


Introduction
Archaeologists increasingly recognise that the global tropics and sub-tropics were home to a rich variety of urban settlement traditions in antiquity. While many of these settlement systems shared a tendency toward spatial dispersion—what is frequently called ‘low-density urbanism’ (Fletcher Reference Fletcher1995, Reference Fletcher2009, Reference Fletcher and Smith2012)—there is a burgeoning recognition that the ancient world's low-density urban landscapes were themselves heterogeneous, with substantial gradients in settlement density within settlements, between settlements and their hinterlands, and across subregions (Chase et al. Reference Chase2011; Evans et al. Reference Evans2013; Fisher et al. Reference Fisher, Cohen, Fernández-Diaz and Leisz2017; Canuto et al. Reference Canuto2018; Jackmond et al. Reference Jackmond, Fonoti and Tautunu2018; Prümers et al. Reference Prümers, Betancourt, Iriarte, Robinson and Schaich2022; Thompson Reference Thompson2023; Rostain et al. Reference Rostain2024). Concurrently, archaeologists in many of these same regions are confronting ‘dense pasts’ (see Evans et al. Reference Evans, Aldred and Cooper2023), where the accumulation of research has simply turned up more of everything than the discipline contemplated previously: more settlements, more cities, more landesque capital.
In recent years these two developments in the archaeology of tropical urbanism—the recognition of high-amplitude variability on the one hand, and of a dense past on the other—have come into tension with one another, such that where some researchers see evidence for dense regional-scale populations inhabiting thoroughly urbanised landscapes, others see evidence of a biased sample that over-represents one end of the settlement density gradient. It thus remains an open question whether those areas as yet unmapped by archaeologists hold further evidence of a dense past or reveal a less densely occupied corrective.
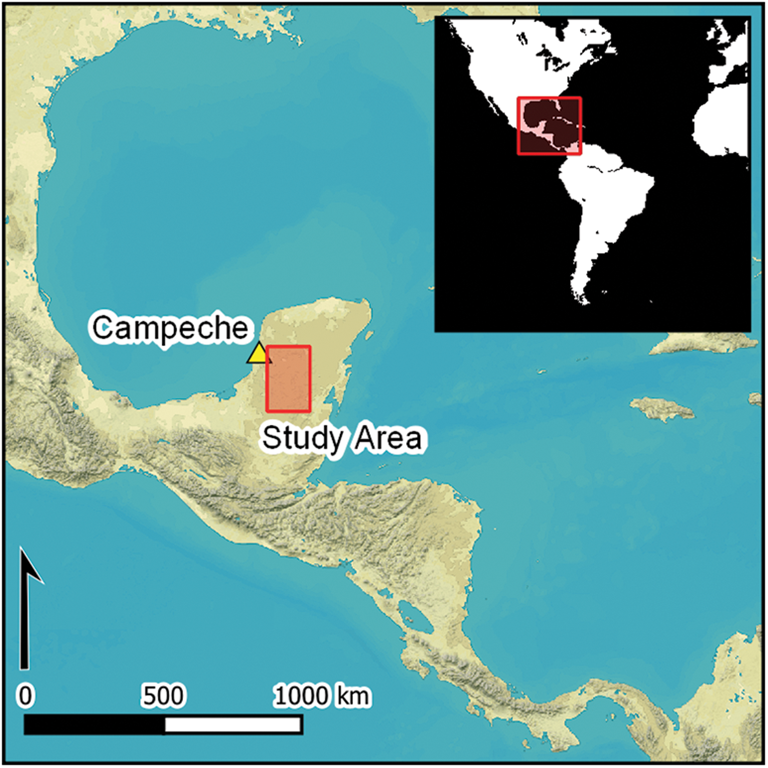
Here we seek to answer this question for the central Maya Lowlands (see Canuto et al. Reference Canuto2018: fig. 1), one of the ancient world's best-known, but also most contentious, examples of tropical urbanism. Our aim in this article is to assess whether overall settlement density and local-scale variability in settlement density (i.e. urbanisation) have been over-estimated by archaeologically motivated, ‘site focused’ surveys. To do this we enlist a new expedient and pseudorandom regional-scale sample of settlement drawn from remote sensing data across one of the Maya Lowlands’ largest ‘blank spots’: eastern Campeche, Mexico.
Since at least the 1940s, researchers have known that the Classic period Maya (AD 250–900) transformed the rugged interior of the Mexican state of Campeche into a densely settled and extensively engineered landscape (Merwin Reference Merwin1913; Ruppert & Denison Reference Ruppert and Denison1943). A series of projects undertaken near the modern town of Xpuhil since the 1970s demonstrate that this region was both crowded with settlement and heavily engineered through durable landscape modifications such as terraces and field walls (Eaton Reference Eaton1975; Turner II Reference Turner, Harrison and Turner1978; Thomas Reference Thomas1981; Suárez Aguilar Reference Suárez Aguilar2007; Arnauld et al. Reference Arnauld, Michelet and Nondédéo2013; Lemonnier & Vannière Reference Lemonnier and Vannière2013). Nevertheless, for most of the twentieth century, archaeological research in east-central Campeche and adjacent Quintana Roo was scant compared to other parts of the Maya Lowlands, such that the authoritative database of known and geolocated sites (Witschey & Brown Reference Witschey, Brown and Braswell2014) shows large swaths of the region to be essentially terra incognita.
In the past decade a growing number of field research projects in Campeche have employed airborne lidar survey (e.g. Reese-Taylor et al. Reference Reese-Taylor2016; Hernández Gómez Reference Hernández Gómez2021; Šprajc et al. Reference Šprajc2021), which has emerged as a powerful tool for settlement archaeology, capable of documenting entire landscapes in minute detail even under dense forest cover (e.g. Chase et al. Reference Chase2011; Canuto et al. Reference Canuto2018). Separately, researchers have also examined lidar datasets collected for non-archaeological purposes, notably those for ecological monitoring (Schroder et al. Reference Schroder2020; Hutson et al. Reference Hutson, Dunning, Cook, Ruhl, Barth and Conley2021) and civil engineering (Instituto Nacional de Antropología e Historia 2020; Pérez Rivas et al. Reference Pérez Rivas, Corral, Uitz and Morlet2023). Collectively referred to as environmental lidar, these expedient datasets have the advantage of being effectively random with regards to the archaeological record; as the data were collected without regard for archaeological questions they are unlikely to contain the same biases as archaeologically motivated surveys. In the Maya Lowlands and elsewhere (Golden et al. Reference Golden2016; García Sánchez Reference García Sánchez2018; Schroder et al. Reference Schroder2020; Kokalj & Mast Reference Kokalj and Mast2021; Peripato et al. Reference Peripato2023; Stauffer et al. Reference Stauffer, Grooms, Hu, Mersmann, Kidder and Henry2023), archaeological re-analysis of these environmental lidar datasets represents a promising new development in regional sampling methodology (Plog & Flannery Reference Plog, Flannery and Flannery1976; see also Banning Reference Banning2021) with an attractive combination of high spatial resolution, broad spatial coverage, limited archaeological bias and low (or no) cost. In Mexico, some environmental lidar datasets have been made freely available to the public—notably the transects from NASA's G-LiHT mission (Goddard's Lidar, Hyperspectral and Thermal Imager mission) (Cook et al. Reference Cook2013)—in addition to the government's own high-resolution lidar data, fostering collaboration among researchers as well as open science, more generally.
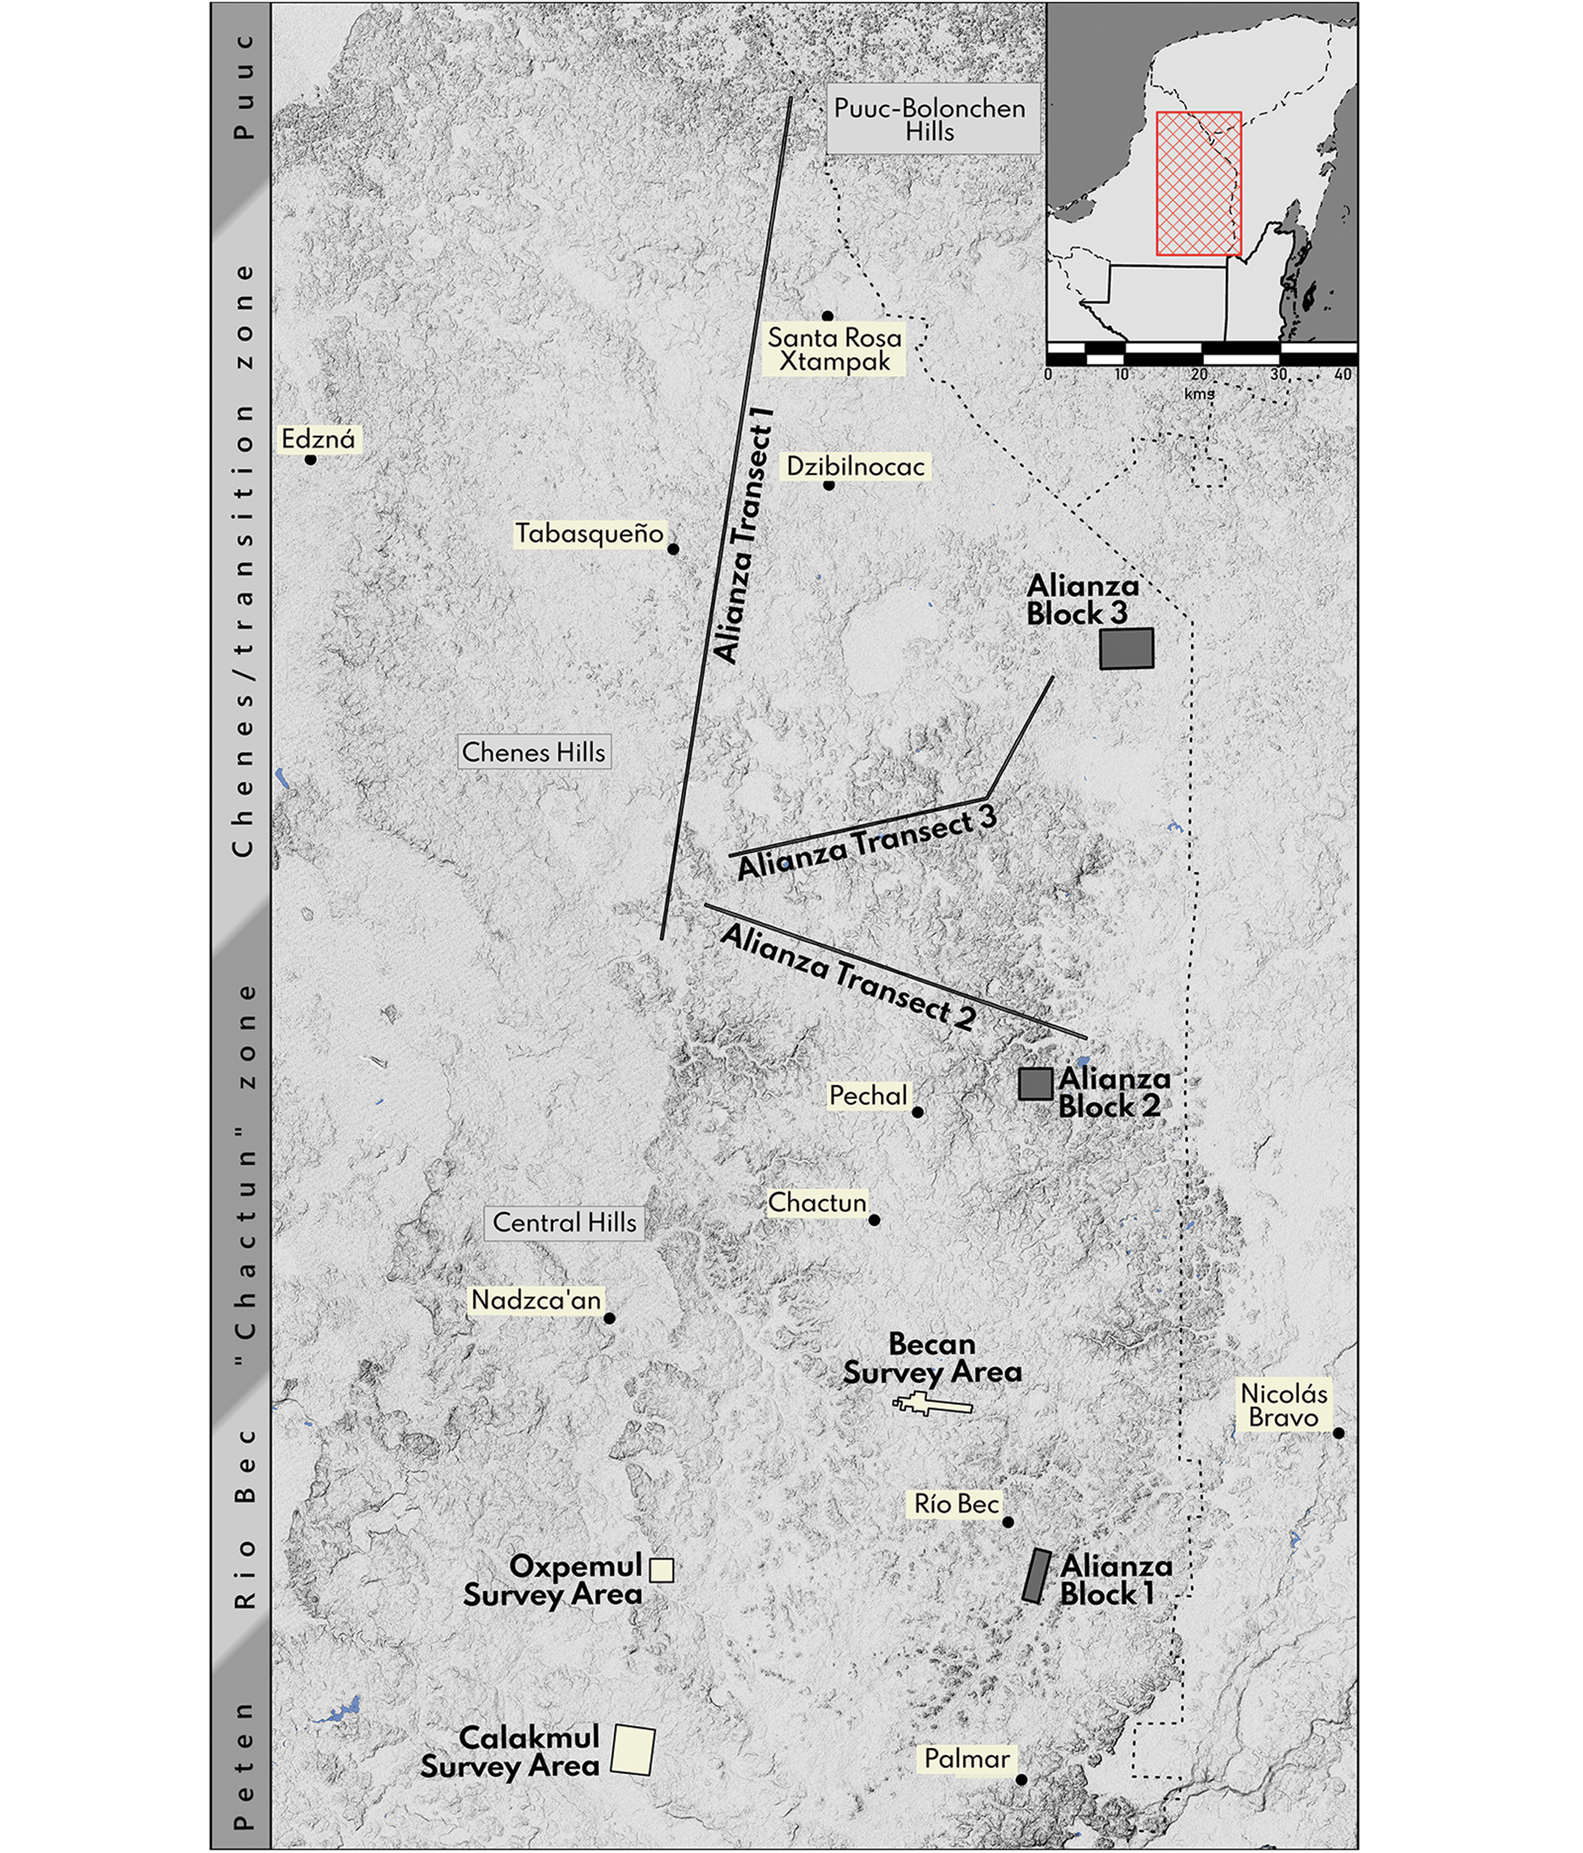
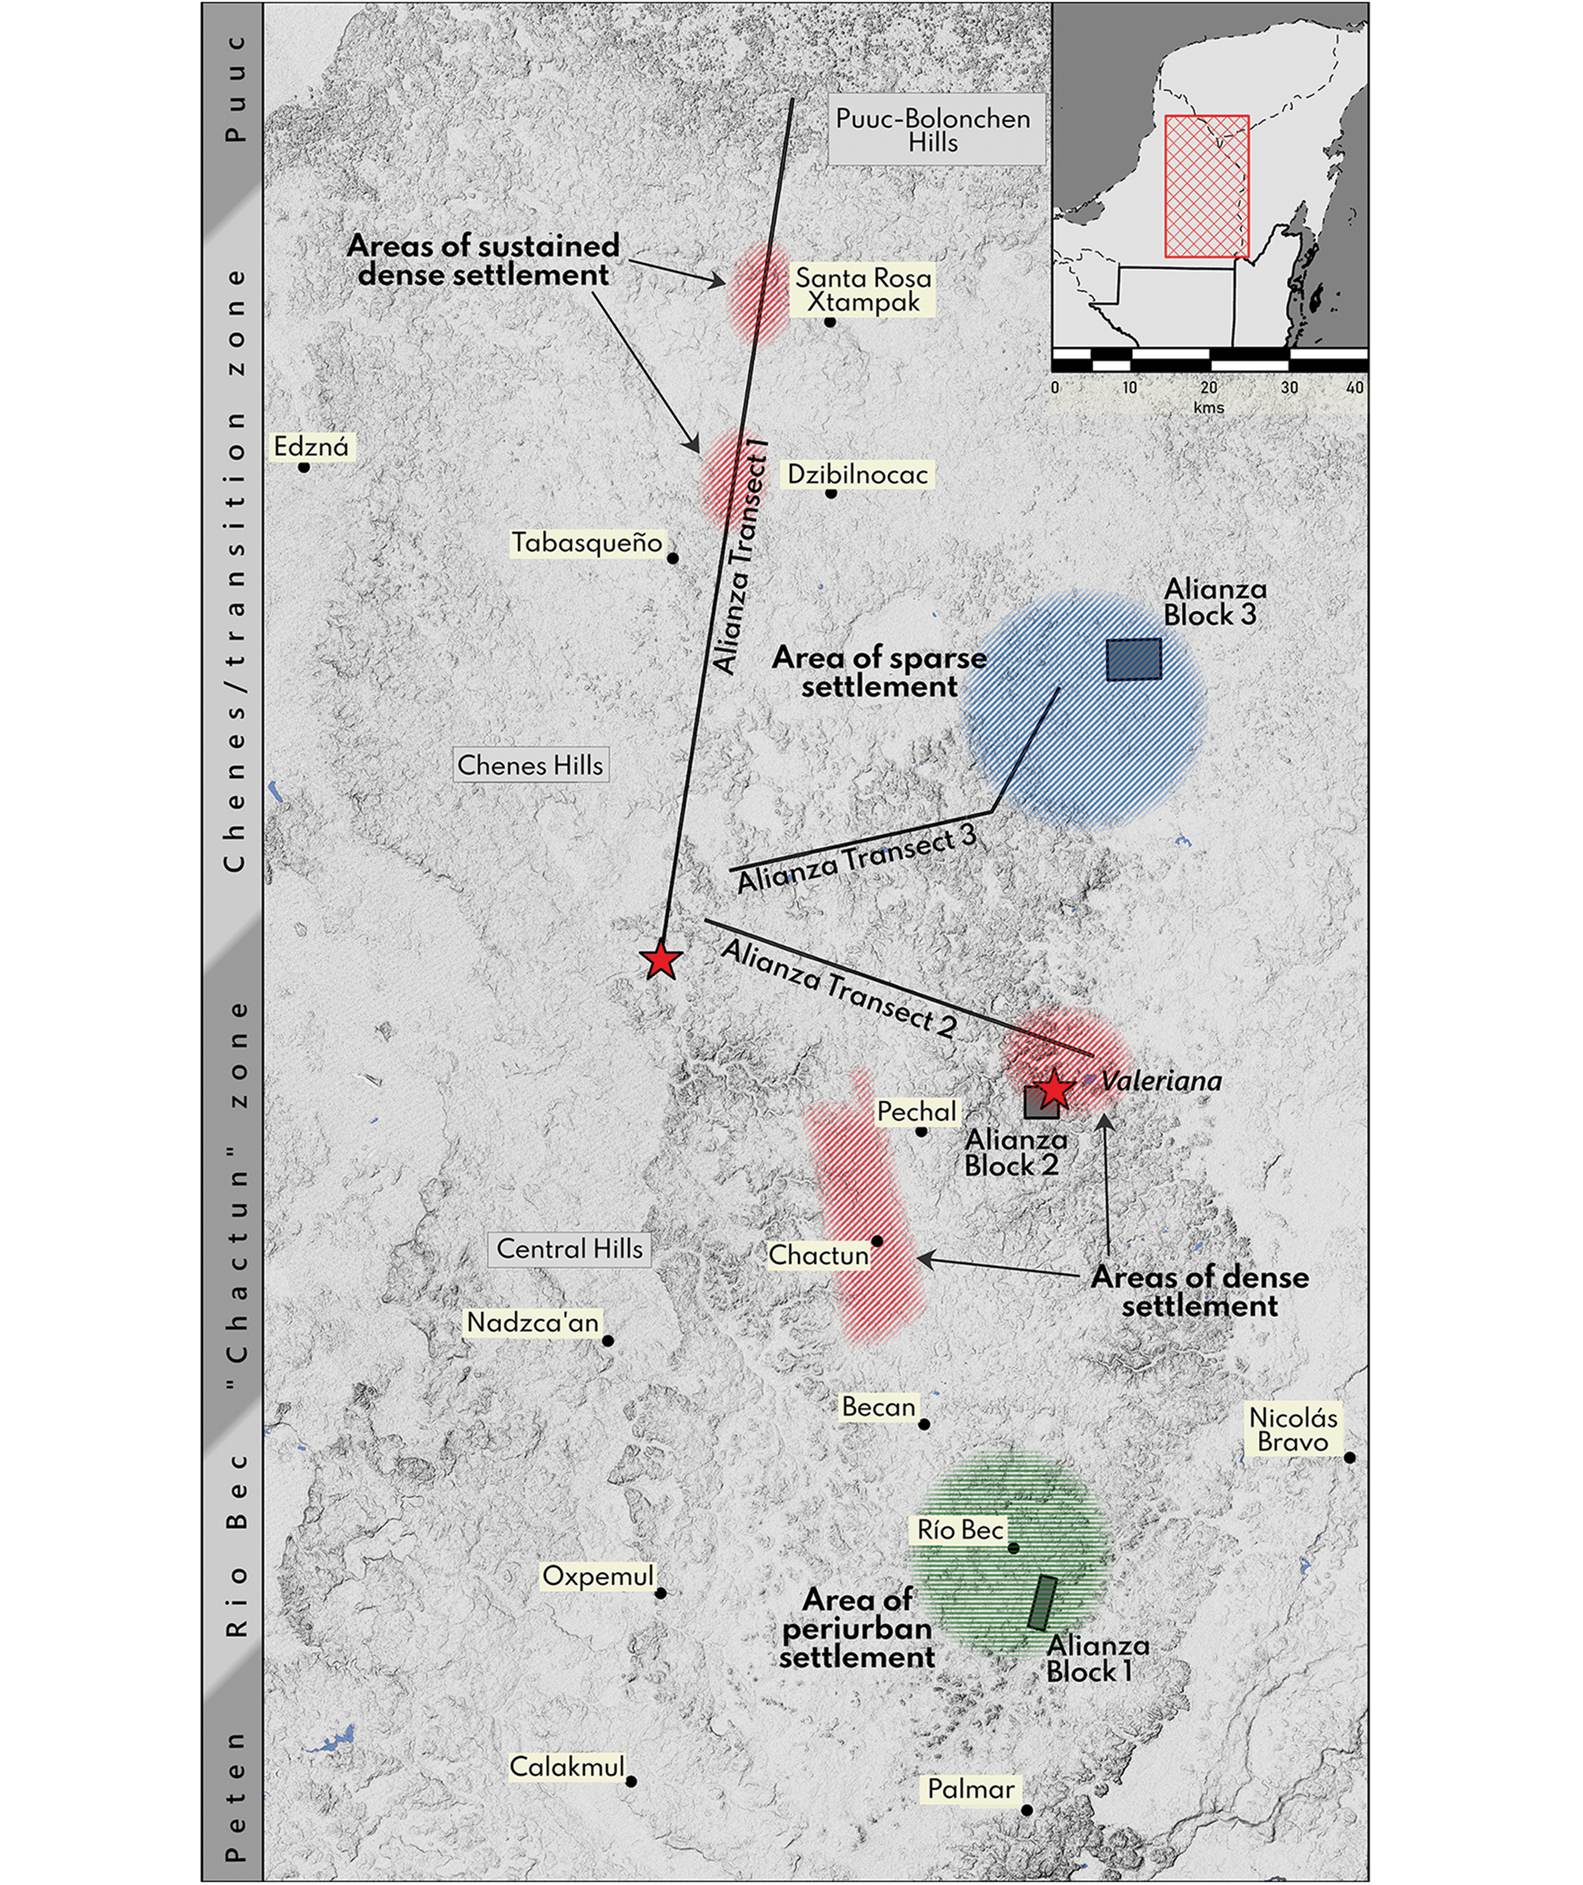
Here, we present an archaeological analysis of approximately 122km2 of high-quality airborne lidar data collected in 2013 as part of a forest monitoring project called Alianza M-REDD+ (Reducing Emissions from Deforestation and Degradation in Mexico), spearheaded by the Nature Conservancy, Mexico. This dataset—hereafter ‘Alianza’—uniquely comprises both transect and areal (quadrat or block) survey samples, permitting a pseudorandom sample of settlement patterns in Campeche that is both longitudinal and contextual (Figure 1).
Alianza lidar survey areas in Campeche (figure by authors).
In this article, we introduce the dataset and provide an overview of the archaeological landscape that it reveals. We argue that the Alianza data demonstrate a range of ancient settlement densities comparable to those documented by site-focused archaeological survey in the region, from nearly vacant rural landscapes to dense urban areas. Despite this survey's lack of archaeological “site bias” (c.f. Ringle et al. Reference Ringle, Negrón, Ciau, Seligson, Fernandez-Diaz and Ortegón Zapata2021: 46–47), we conclude that the Alianza datasets support the notion of a populous and urban ancient Maya landscape consistent with other datasets (Canuto et al. Reference Canuto2018; Schroder et al. Reference Schroder2020; Canuto & Auld-Thomas Reference Canuto and Auld-Thomas2021, Reference Canuto, Auld-Thomas, Chase, Chase and Chase2024). In other words, we suggest that dense regional-scale settlement and high-amplitude variability in local-scale settlement density (reflective of urbanisation) are characteristic of the central Maya Lowlands and not the product of sampling bias (contra Webster Reference Webster2018). More detailed quantitative analysis of the archaeological features within this and other pseudorandom datasets will be published elsewhere in the future.
The dataset
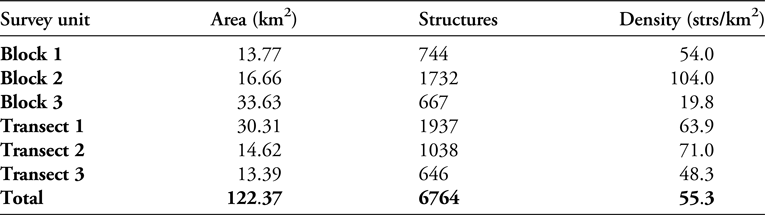
The lidar data were collected in 2013 by the Mexican firm CartoData using a Riegl LMS-Q780 sensor, processed by the Woods Hole Research Center (WHRC) and made freely available by Alianza M-REDD+ (Walker Reference Walker2015). The dataset consists of three transects and three survey blocks (Figure 1). The transects are roughly 275m wide and approximately 213km long, for a total coverage area of 58.3km2. The survey blocks total 64.1km2 (Table 1) and were conducted in three areas: 1) south of the town of Xpuhil, near the well-known site of Río Bec; 2) adjacent to the villages of Dos Lagunas and Bel Ha where several patio groups have been reported along the highway (Merk Reference Merk2004); and 3) near the town of Ucum in northernmost Campeche, an area with no reported sites. A fourth survey block, measuring about 174km2, falls in the Puuc-Bolonchen hills of the state of Yucatan (see Ringle et al. Reference Ringle, Negrón, Ciau, Seligson, Fernandez-Diaz and Ortegón Zapata2021), and is not considered further here.
Settlement data in Alianza lidar in Campeche. Density is measured in structures per square kilometre.
Analytical methods
In the original Alianza digital terrain models, larger archaeological mounds were vertically ‘truncated’, indicating that a subset of real ground points in the lidar point cloud had not been classified as such. We reprocessed the original point clouds using parameters developed at the National Center for Airborne Laser Mapping (NCALM) specifically for archaeological prospection (Fernandez-Diaz et al. Reference Fernandez-Diaz, Carter, Shrestha and Glennie2014), producing a digital terrain model with a spatial resolution of 1m per pixel (ground-point density: 5.01points/m2). This dramatically improved the representation of ancient architecture, though the overall visibility of archaeological features across the dataset was only slightly improved. Digital terrain models were visualised primarily using Simple Red Relief (Auld-Thomas Reference Auld-Thomas2022), which highlights slopes in red and local elevation differences in a gradient of dark blue-green to bright yellow (e.g. Figures 4 & 7), and the Visualization for Archaeological Topography (Verbovšek et al. Reference Verbovšek, Popit and Kokalj2019), which blends a traditional computational hillshade with additional terrain parameters to enhance subtle topographic details. All features of archaeological interest were manually digitised as vector polygons in QGIS and ArcGIS Pro. Digitized features were reviewed by at least three analysts working independently; where analysts disagreed, features were reevaluated by all parties and then included or excluded from the final dataset by majority vote.
To our knowledge, archaeological fieldwork has been conducted only in the Puuc block and not any of the other areas intersected by the survey; and no field validation of the analysis presented here has yet taken place. This means that our analysis carries three caveats. First, over the decade since lidar was first deployed in the service of Mesoamerican archaeology, in no instance has field validation resulted in a net decrease in the total number of buildings identified (e.g. Reese-Taylor et al. Reference Reese-Taylor2016; Canuto & Auld-Thomas Reference Canuto, Auld-Thomas, Barrientos Q, Canuto and López2020; Thompson Reference Thompson2020; Garrison et al. Reference Garrison, Thompson, Krause, Eshleman, Fernandez-Diaz, Baldwin and Cambranes2022), because false positives are reliably offset by a greater number of false negatives—small, unmounded or barely mounded buildings that are seldom detectable in digital terrain models. Nor in that time has field validation of lidar-derived settlement data resulted in a meaningful alteration to the observed spatial distribution of (mounded, surface-visible) settlement.
The second caveat concerns the long-recognised prevalence of rockpiles (or ‘chich’ mounds) throughout the Alianza coverage area. Although their exact use is unknown (Turner II Reference Turner1983; Dunning Reference Dunning1992; Kepecs & Boucher Reference Kepecs, Boucher and Fedick1996; Lemonnier & Vannière Reference Lemonnier and Vannière2013; Hutson et al. Reference Hutson, Dunning, Cook, Ruhl, Barth and Conley2021), most of these rockpiles do not appear to have fulfilled a residential function. Even so, their general shape (as depicted in lidar data) is similar to that of small house-mounds. Despite efforts to mitigate the impact of this ambiguity during our digitisation process, our identification efforts likely mistook some rockpiles for structures, leading to marginally inflated structure tallies overall.
The net result of these first two caveats is that all feature counts and related analyses of density presented here should be regarded as preliminary values that will inevitably be revised through subsequent analyses, both in the field and the computer lab. Overall feature counts will almost certainly increase, but the proportion of features classified as buildings or some other anthropogenic feature, such as rockpiles, is also likely to change. We maintain, however, that the general characteristics and spatial patterning of settlement can be reliably described from our initial remote analysis.
The final caveat concerns chronology and contemporaneity. In the central lowlands, archaeologists have long recognised a “tremendous Late Classic bias” (Rice & Puleston Reference Rice, Puleston and Ashmore1981: 137) in buildings visible on the surface; nearly every archaeological project in the region has reported that between 75 and 95 per cent of excavated buildings have Late Classic components (e.g. Canuto & Auld-Thomas Reference Canuto, Auld-Thomas, Chase, Chase and Chase2024). Similar chronological summaries are not available for the northern lowlands, although the chronological picture there is generally regarded as more complex and there is far more Terminal Classic and Postclassic occupation compared with the central lowlands. The lack of chronological control in the area sampled by the Alianza survey means that the northern and southern portions of the dataset should not be considered synchronic, though elements of each surely overlap in time.
Settlement patterns
General observations
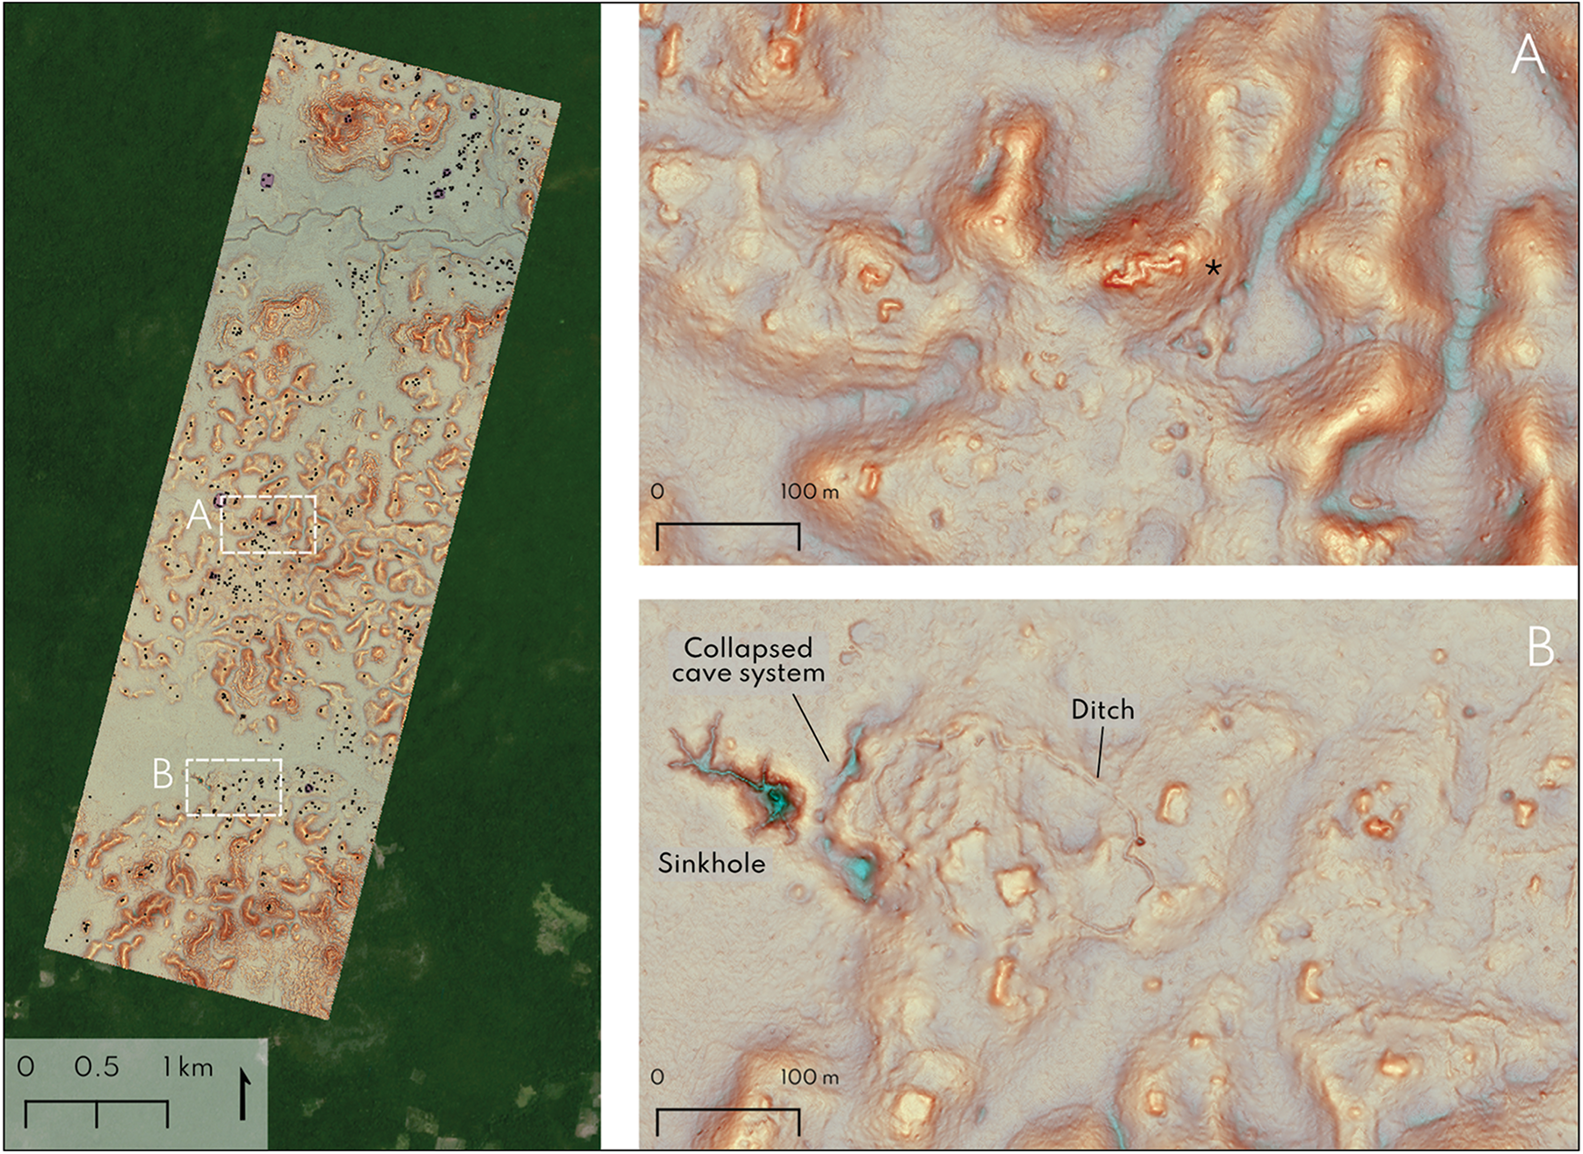
Block 1, located just south and east of the important site of Río Bec, includes one probable example of the distinctive paired pseudopyramid architectural style that takes its name from that site (Figure 2a). The character of settlement, including the ubiquity of agricultural infrastructure, is identical to that recorded by pedestrian survey at Río Bec: a sprawling ‘dense rural’ agro-settlement landscape with little of the imposing public architecture so common elsewhere in the Maya region (Arnauld et al. Reference Arnauld, Michelet and Nondédéo2013; Lemonnier & Vannière Reference Lemonnier and Vannière2013). One notable exception, however, is an architectural complex adjacent to a deep sinkhole giving access to a partially collapsed cave system. The architectural complex is encircled by a narrow ditch, the small scale of which, together with the lack of an associated embankment, precludes a defensive interpretation (Figure 2b). The ditch is in the shape of a quatrefoil, canonically the shape used to represent caves and sinkholes in Mesoamerican art (Guernsey Reference Guernsey2010). This unusual pairing of prominent sinkhole and quatrefoil ditch warrants future investigation.
Left) Block 1 survey block, with building footprints in black and platform footprints in purple; top right) probable Río Bec-style complex marked by *; bottom right) sinkhole with associated quatrefoil ditch (figure by authors).
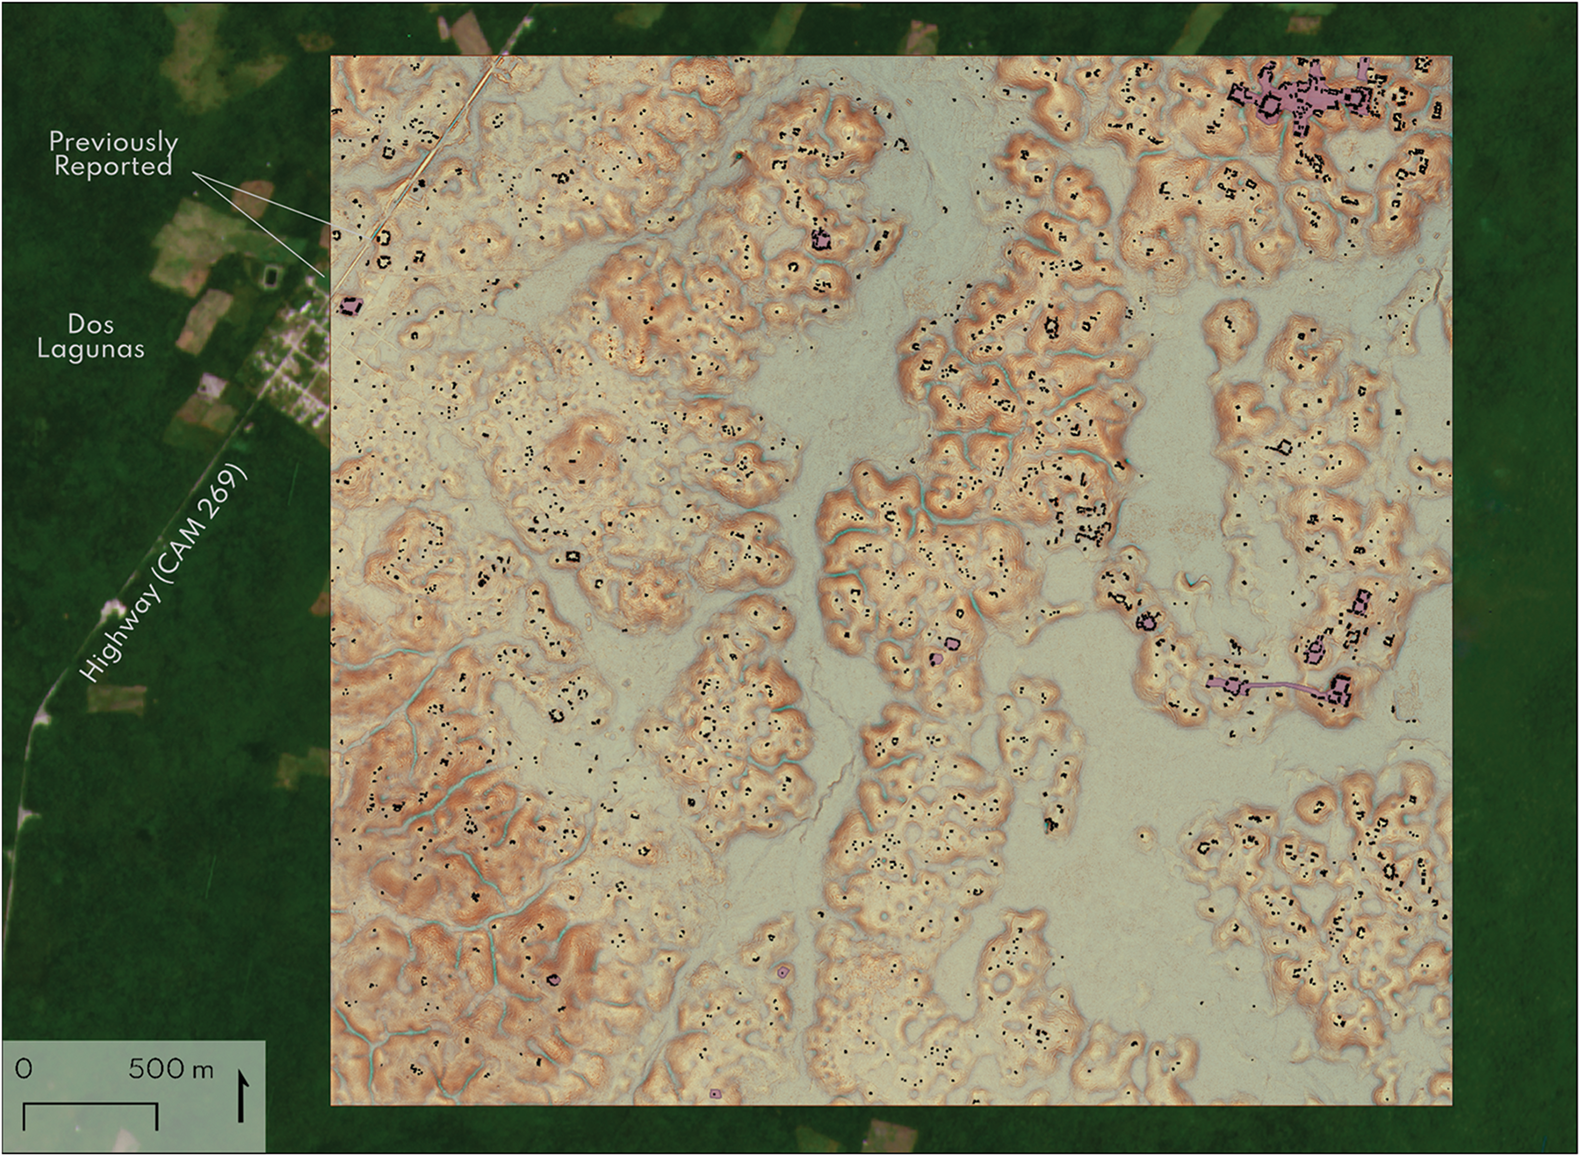
Block 2 directly overlies the epicentre of a major urban area that was previously unknown to the scientific community. This city, which we call Valeriana (Figures 3, 4 & 5) after an adjacent freshwater lagoon, encompasses two major hubs of monumental architecture 2km apart, linked by continuous dense settlement and landscape engineering. The discovery of Valeriana highlights the fact that there are still major gaps in our knowledge of the existence or absence of large sites within as-yet unmapped areas of the Maya Lowlands. Settlement and agricultural infrastructure completely fill the 16.6km2 survey area. The style and density of architecture closely matches that seen in the Chactun-Tamchen area, some 20km to the south-west (Šprajc et al. Reference Šprajc2021), as well as that recently recorded by archaeological salvage work on the Maya Train project (Pérez Rivas, pers. comm.).
Block 2, showing the major site of Valeriana. Structure footprints in black, platform footprints in purple. Two mound groups adjacent to the highway were reported by Merk (Reference Merk2004) (figure by authors).
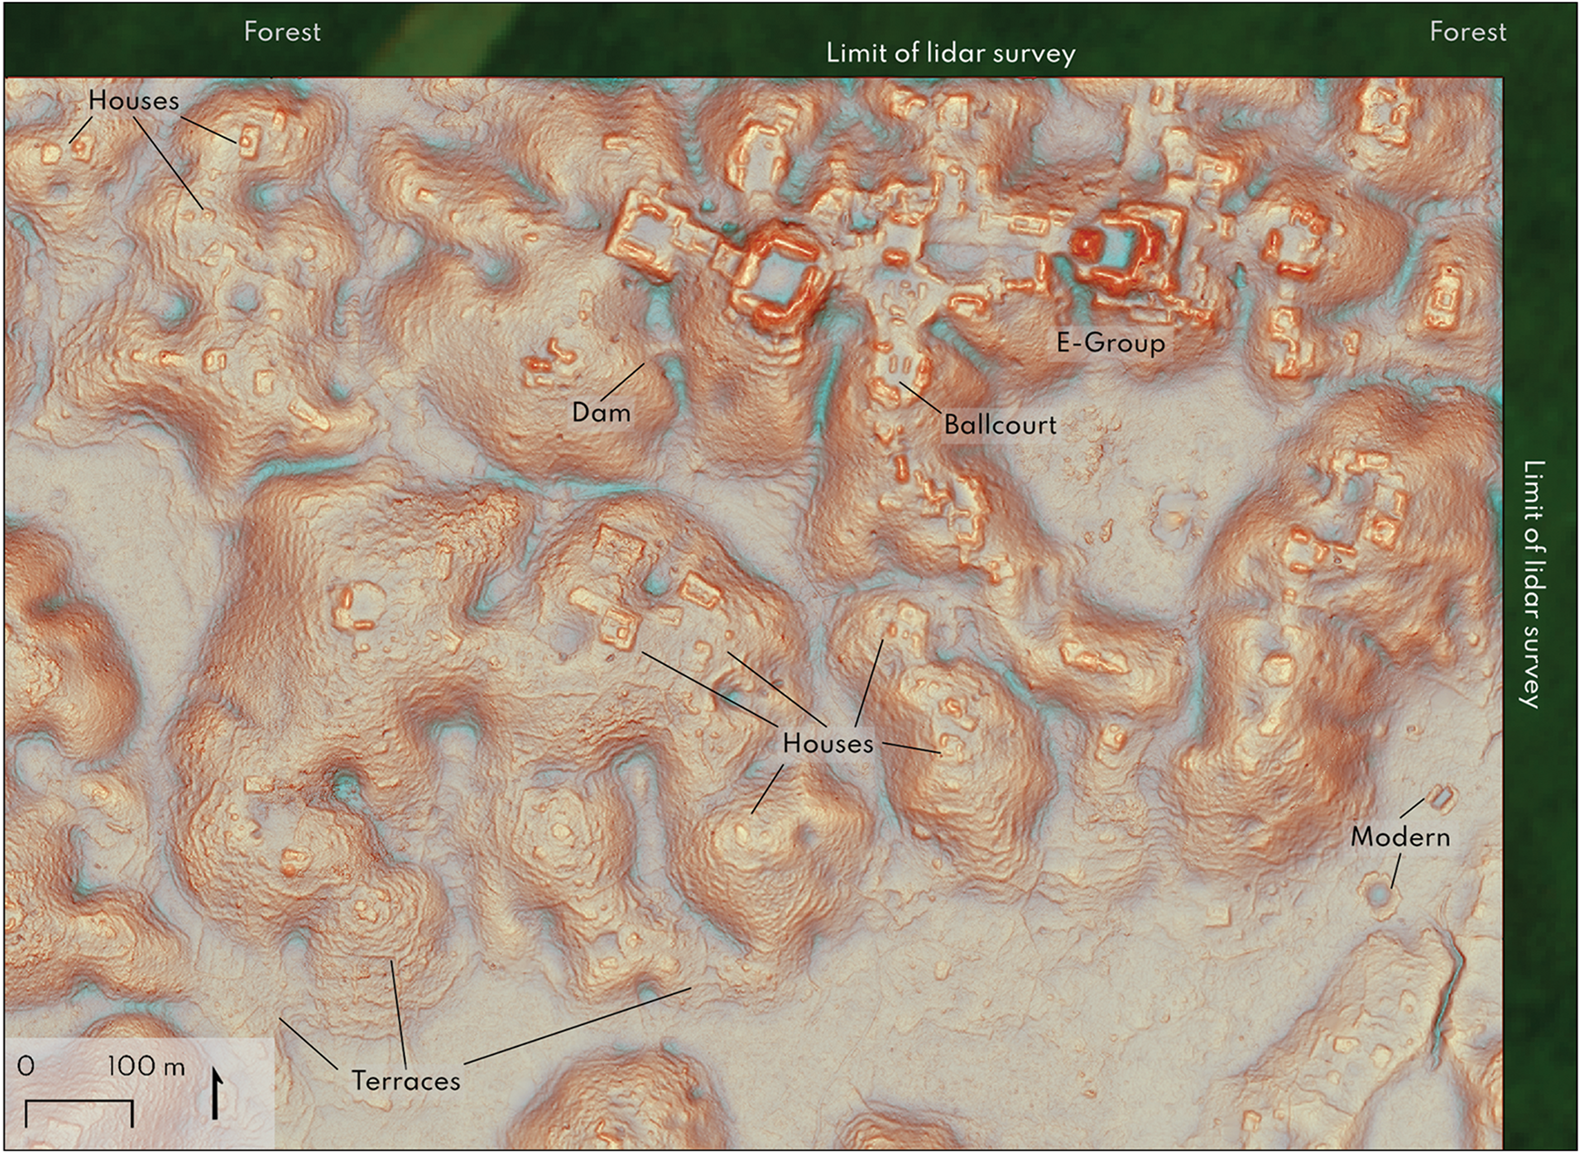
Detail of Valeriana site core, in the north-east corner of Block 2 (figure by authors).
Settlement and agricultural land modification in Block 2, visualisation for archaeological topography. Compare with figures in Šprajc et al. Reference Šprajc2021 (figure by authors).
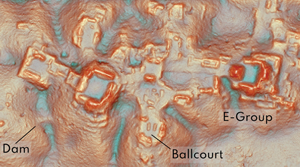
The larger of Valeriana's two monumental precincts has all the hallmarks of a Classic Maya political capital: multiple enclosed plazas connected by a broad causeway; temple pyramids; a ballcourt; a reservoir formed by damming an arroyo (a seasonal watercourse); and a probable E-Group assemblage, an architectural arrangement that generally indicates a founding date prior to AD 150 (Freidel et al. Reference Freidel, Chase, Dowd and Murdock2017). Furthermore, the same style of curved, ‘amphitheatre’ residential patios first identified by Ruppert and Denison (Reference Ruppert and Denison1943) at the site of Pechal and reported in the northern sector of Šprajc and colleagues’ (Reference Šprajc2021) lidar survey are also present at Valeriana, making this a strongly characteristic regional style. Valeriana's architectural epicentre occupies the north-eastern extreme of Block 2, indicating that the settled area associated with it continues beyond the margins of the Alianza dataset. It likely continues at least 5km north, where Transect 2 records identical density and style of buildings and agricultural infrastructure (see below).
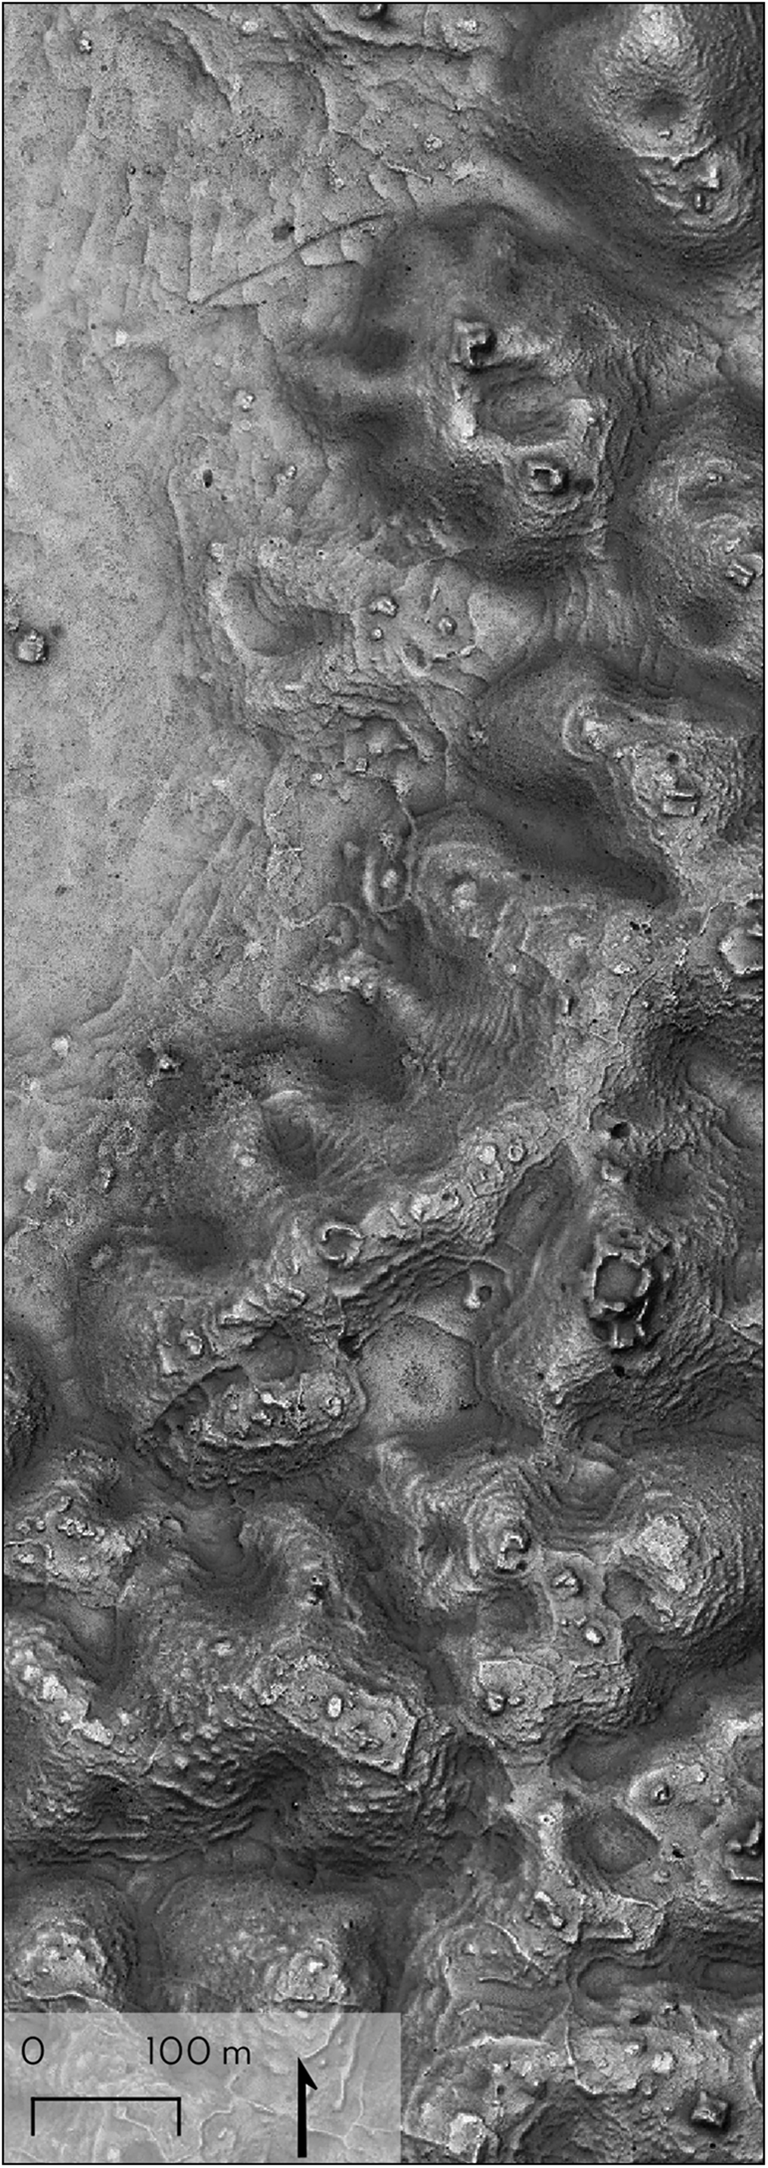
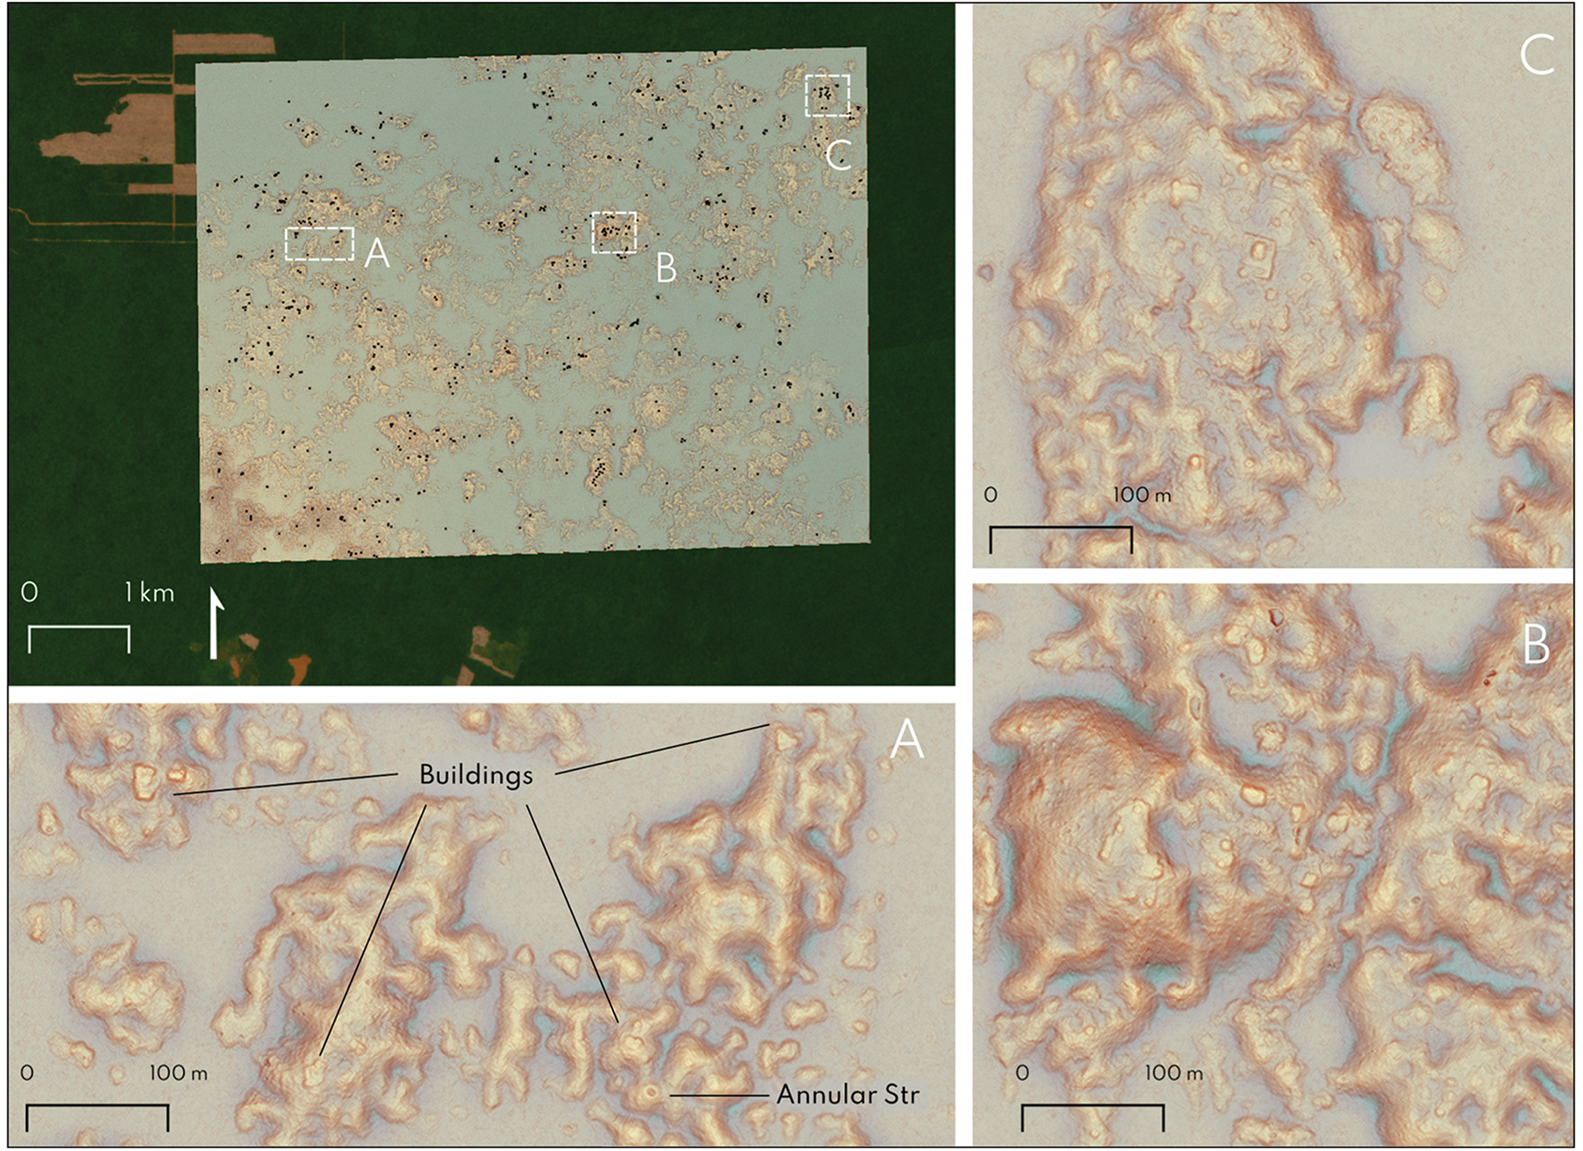
Block 3, by contrast, has sparse and modest settlement (Figure 6), consisting of scattered or loosely clustered residences with no monumental architecture and limited investment in water storage. Notably, the settlement here does include so-called ‘annular structures’, ring-shaped structures that are common in the Puuc region and were used in the production of lime plaster (Seligson et al. Reference Seligson, Ruiz and Pingarrón2019).
Settlement in Block 3 (building footprints in black). Annular structures are associated with lime plaster production (Ringle et al. Reference Ringle, Negrón, Ciau, Seligson, Fernandez-Diaz and Ortegón Zapata2021). Details A, B and C illustrate Northern Lowland settlement morphology, compare with Figure 7 (figure by authors).
Settlement density
With a total of 6764 structures (strs) in the entire dataset, the aggregate settlement density is 55.3strs/km2, comparable to the 49strs/km2 recently reported by Schroder and colleagues (Reference Peripato2020) for a portion of the G-LiHT transects in the same region. These figures are relevant to assessments of regional-scale settlement density and population history—for instance, they exceed regional-scale settlement density reported for any part of Belize or Guatemala (Canuto & Auld-Thomas Reference Canuto, Auld-Thomas, Chase, Chase and Chase2024). However, they explain little about the degree to which a settlement system was urbanised, which requires an appreciation of local-scale variability or density gradients. To accommodate the distinct spatial qualities of quadrat and transect data, we assess density gradients separately for the Alianza blocks and transects.
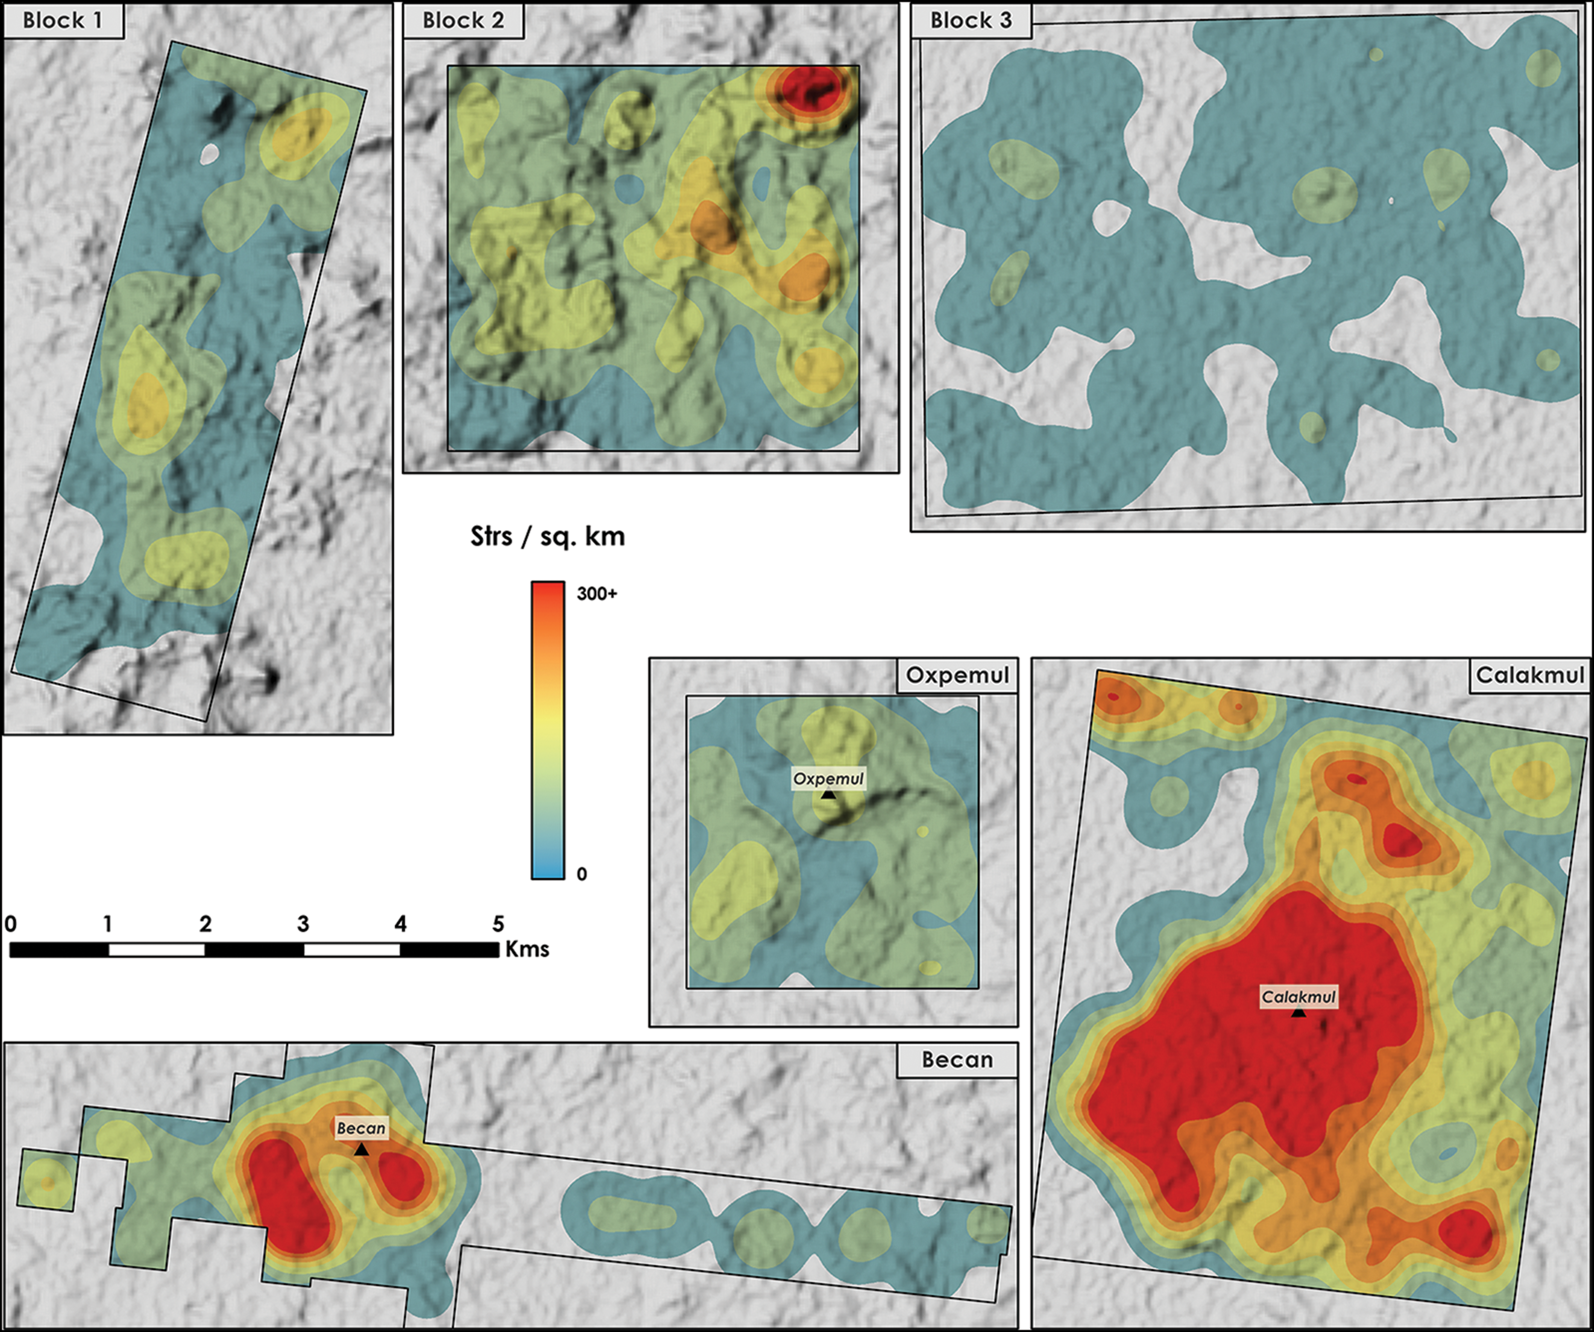
To calculate settlement density gradients in the survey blocks, we used a kernel density estimation, fitting a quartic kernel with a 565m bandwidth over each structure point with an output cell size of 5m. We did the same for the only pedestrian surveys conducted at comparable scale and completeness in the same region, namely at Calakmul (May Hau et al. Reference Hau, R, Muñoz, Gonzalez Heredia and Folan1990), Oxpemul (Barnes et al. Reference Barnes2009) and Becan (Thomas Reference Thomas1981). Comparing these ‘site-centred’ block surveys with ‘random’ block surveys illustrates that the latter fit comfortably within the range of densities suggested by the former (Figure 7). Block 1 (range: 0–195strs/km2) falls between densities recorded at Oxpemul (range: 0–149strs/km2) and Becan (range: 0–264strs/km2), while Block 2 (range: 0–426strs/km2) displays a density gradient only surpassed by the behemoth site of Calakmul (range: 0–770strs/km2). Notably, the placement of Block 2 vis-à-vis Valeriana's dense epicentre creates an edge effect precisely in the area where settlement density is greatest; that city's urban core is undoubtedly both larger and denser than our kernel density estimation suggests. Block 3 (range: 0–84strs/km2) shows the lowest, most ‘rural’, settlement distribution of all six survey blocks; block-level density here is comparable to that reported for rural areas such as the Corona-Achiotal region in northern Guatemala (Canuto & Auld-Thomas Reference Canuto and Auld-Thomas2021), though it is also more evenly distributed. In sum, Alianza's three pseudorandom survey blocks recorded: 1) a low-density rural area; 2) a moderately dense periurban or ‘dense rural’ area; and 3) a large, dense city—precisely the range of variability suggested by ‘site-centred’ pedestrian and lidar surveys.
Comparison of settlement density between six areas in central Campeche (figure by authors).
Due to the narrowness of the transects (between 200m and 300m), we devised a binning/segmentation procedure to assess variability in settlement density. Schroder and colleagues (Reference Peripato2020) used a similar strategy in their analysis of the G-LiHT data, dividing the transects into roughly 2km2 segments (approximately 8km in length). We reasoned that bins of that length would be unlikely to capture significant short-scale variation in settlement density, since even the largest Maya cities’ epicentres seldom exceed 4km in any linear dimension and are often bounded by vacant wetlands and sparsely occupied rugged terrain (Canuto et al. Reference Canuto2018); the effect of segments this long is to reduce a city's analytical visibility. Consequently, we employ a segment size of 25ha (approximately 1km in length). These reveal greater variability in settlement density, allowing us to identify areas of nucleation (potential loci of ‘urbanising processes’) as well as areas with little or no settlement (‘hinterlands’).
Dense settlement is most broadly sustained at the eastern end of Transect 2, only 5km to the north of Block 2 and the site of Valeriana, suggesting that the region encompassing Block 2 and the eastern end of Transect 2 is part of an extended high-density settlement system (Figure 8C), like the one recorded by Špracj and colleagues (Reference Šprajc2021) around Chactun—indeed, the Alianza and Chactun survey areas are close enough that they may simply capture parts of a single sprawling conurbation.
Close-ups of transects; A) Transect 1; B) southern tip of Transect 1; C) eastern end of Transect 2. All densities expressed as structures per square kilometre (figure by authors).
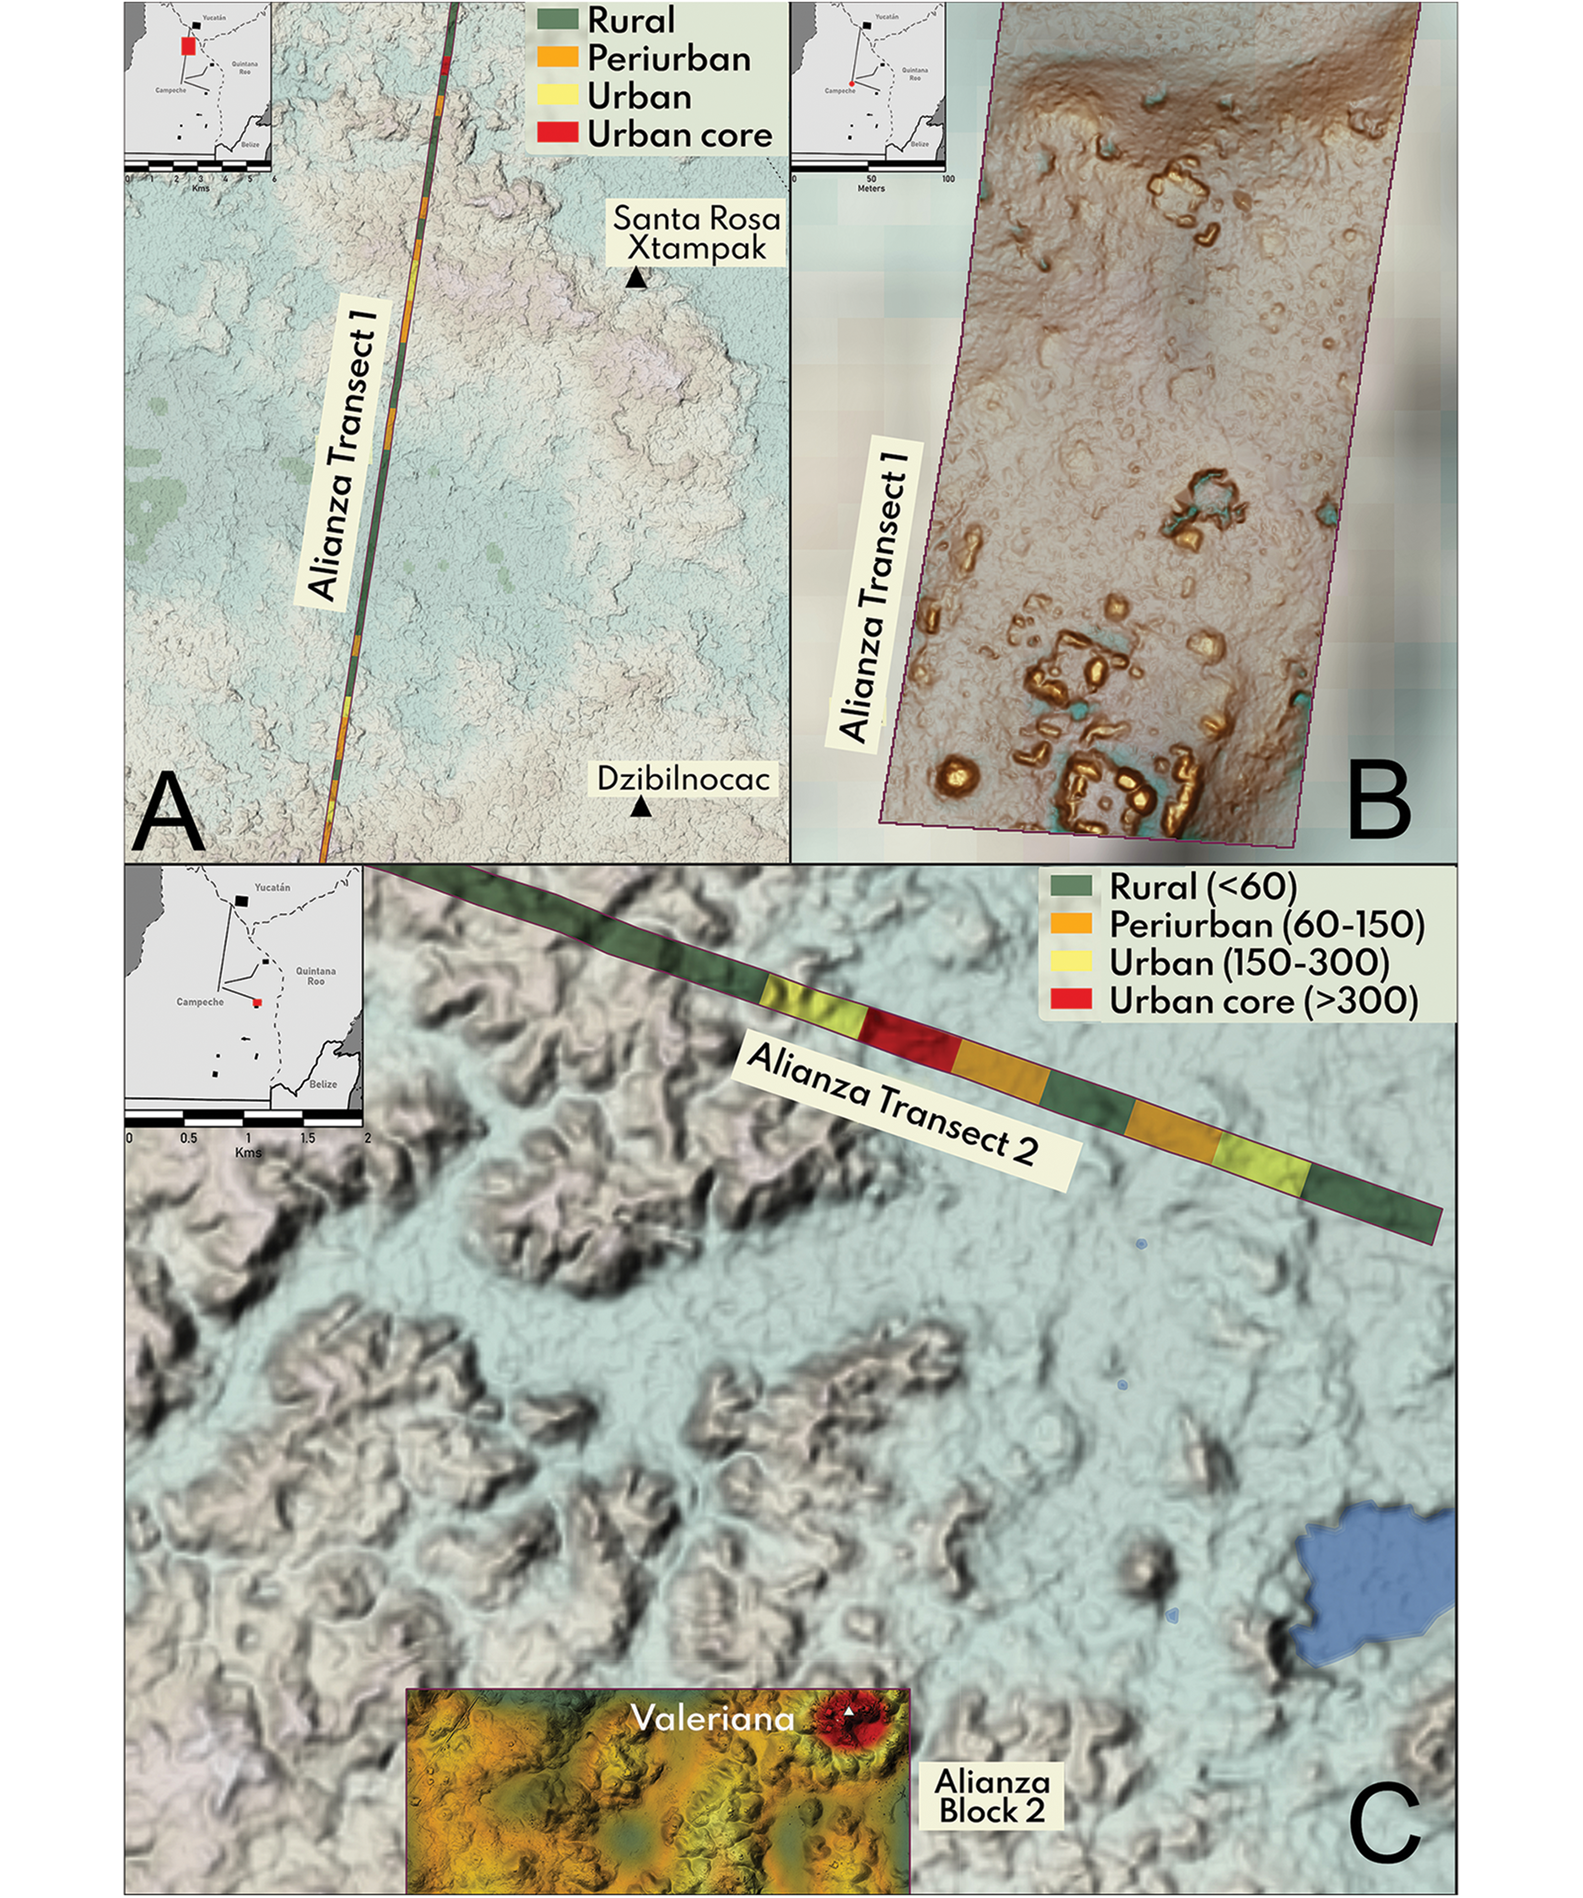
There are other areas where density appears to spike to levels typical of ‘urban’ landscapes. Two are found along Transect 1, at points near the known centres of Dzibilnocac and (somewhat farther north) Santa Rosa Xtampak (Figure 8A). A third localised spike in density corresponds to a previously unreported monumental complex at the extreme southern terminus of Transect 1 (Figure 8B); because this complex occupies the southern end of the transect, it is impossible to say how large it may be or how urban the settlement associated with it was. Transect 3 records the lowest density of all three transects; nowhere does it intersect densities typical of urban areas, and its eastern leg has the longest stretch of low-density segments (range: 0–0.84strs/ha or 0–84strs/km2) in the entire dataset, matching the low-density Block 3 and suggesting the existence of a large and sparse settlement zone in north-easternmost Campeche.
Regional variability
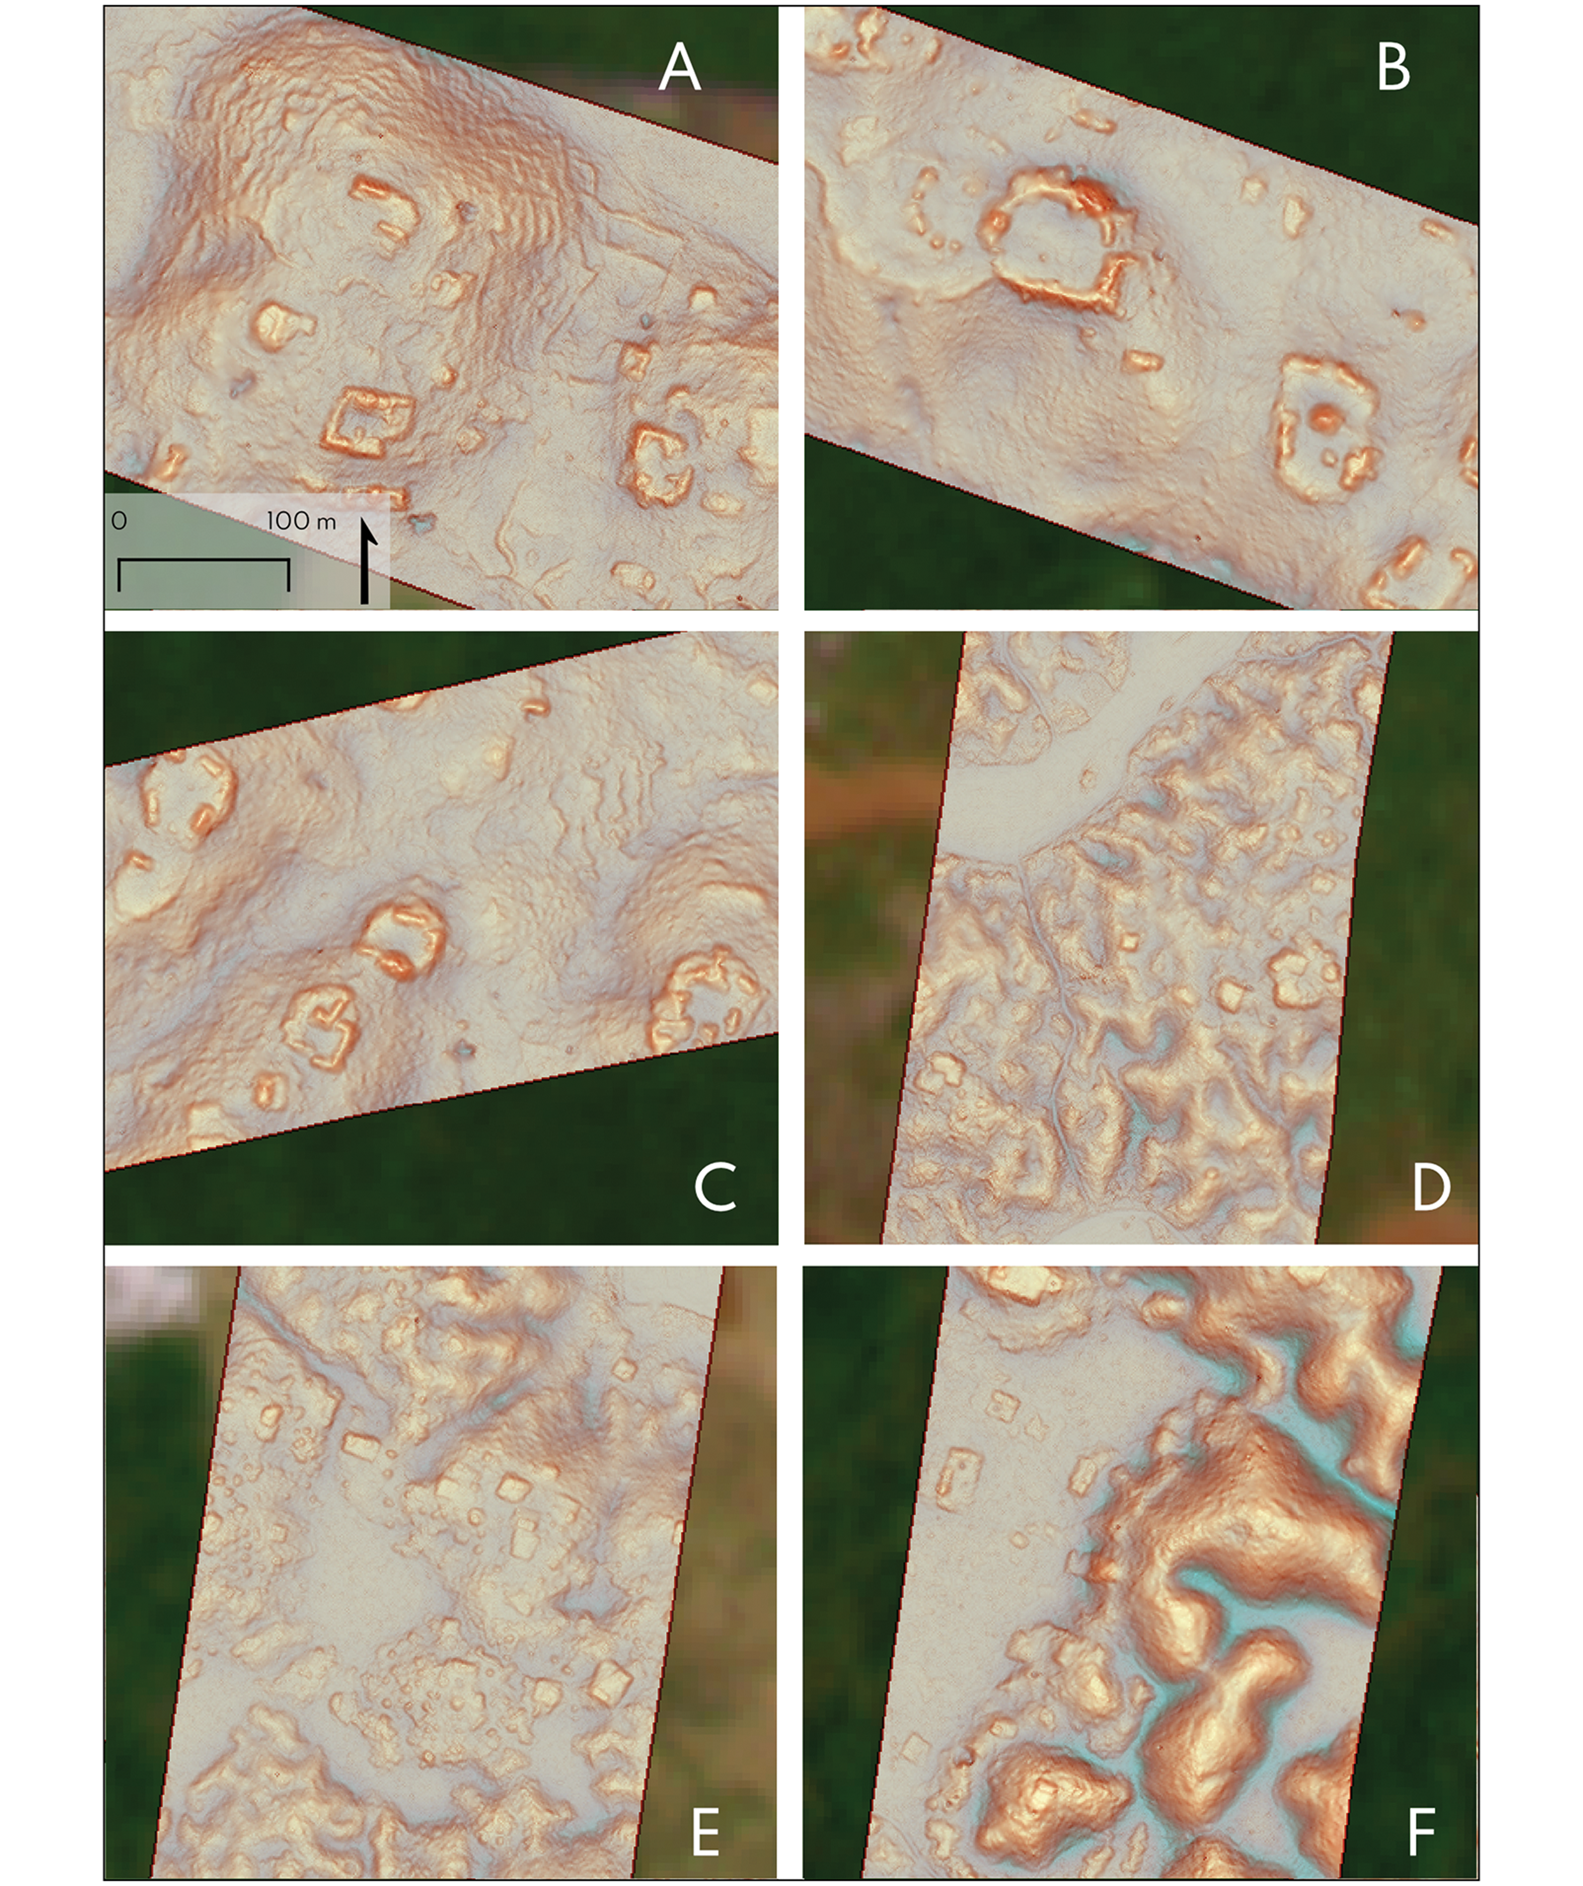
The longitudinal nature of the three transects helps to reveal changes in settlement morphology, especially moving south to north (Figure 9). Throughout the southern half of the survey area, architectural remains strongly favour upland locations and generally consist of mounded structures arranged orthogonally or in a continuous arc around a built-up or levelled patio.
Changes in settlement morphology from south to north. A) 18°57´0″N, 89°18´36″W, Transect 2, Central Hills; B) 19°1´48″N, 89°33´0″W, Transect 2, Central Hills; C) 19°10´48″N, 89°33´36″W, Transect 3, Central Hills; D) 19°32´24″N, 89°43´12″W, Transect 1, Chenes; E) 19°34´48″N, 89°42´36″W, Transect 1, Chenes (note high frequency of chich mounds); F) 20°0´0″N, 89°39´0″W, Transect 1, Puuc-Bolonchen Hills (figure by authors).
The same landform-crowding phenomenon documented by Canuto and Auld-Thomas (Reference Canuto and Auld-Thomas2021) in Guatemala is apparent in the Alianza survey blocks, with urban Block 2 having a higher settlement rate on marginal landforms (42strs/km2) than in the more rural Block 1 (10strs/km2) or sparsely settled Block 3 (8strs/km2). Agricultural infrastructure, in the form of field walls and terraces, is ubiquitous and occurs in close association with settlement. Wetland fields are notably absent from the Alianza survey data, although complexes of narrow drainage canals articulating with field walls are known from the adjacent Chactun region (Dunning et al. Reference Dunning2019; Šprajc et al. Reference Šprajc2021).
Both the morphology of settlement remains and their topographic patterning change gradually but markedly above the 19th parallel (Turner II Reference Turner1983), beginning in the northern part of what Dunning and colleagues (Reference Dunning, Beach, Farrell and Luzzadder-Beach1998) call the Central Hills adaptive region. Terracing and field walls become less common, then all but disappear. Vernacular architecture changes as well: mounded residential patio groups are mostly replaced by large basal platforms greater than 200m2 interspersed with less orthogonally arranged individual buildings. Both this architectural tradition and the absence of agricultural terracing are long-noted characteristics of settlement in the Puuc region and adjacent parts of the northern Maya Lowlands (Ringle et al. Reference Ringle, Negrón, Ciau, Seligson, Fernandez-Diaz and Ortegón Zapata2021), although field walls are common further north (e.g. Hutson Reference Hutson2016). The strong correlation of upland landforms and archaeological settlement also progressively breaks down north of the 19th parallel and is largely inverted north of Hopelchen; in the northern reaches of Transect 1, most buildings are in valley bottoms and on spurs or foot slopes—long noted as a central characteristic of settlement in the Puuc region (Dunning & Kowalski Reference Dunning and Kowalski1994).
Given the generally synchronous changes in architectural practice, settlement morphology, agricultural engineering and landform preference, we suggest that the northern limits of the Central Hills region—around the towns of Xkanha, Kancabchen and Ucum—is a reasonable benchmark for the transition between a southern/central lowlands settlement tradition and that of the northern lowlands, with settlement in the southern Chenes region showing attributes of both.
Conclusion
Twentieth-century researchers were indeed correct that interior Campeche is a substantially anthropogenic landscape (sensu Chase & Chase Reference Chase and Chase2016). This and other recent analyses (Hernández Gómez Reference Hernández Gómez2021; Šprajc et al. Reference Šprajc2021) make clear that this area was also, in places, an urbanised landscape where rural populations articulated and interacted with crowded cities (Figure 10).
Sites and settlement densities in the Alianza survey area (figure by authors).
When the regional-scale settlement density values from a vast area of Campeche and western Quintana Roo—55.3strs/km2 reported here, 49strs/km2 in G-LiHT (Schroder et al. Reference Schroder2020), minimally 61strs/km2 in the Chactun region (see Šprajc et al. Reference Šprajc2021)—are considered alongside the discovery of new urban areas such as Valeriana within pseudorandom survey blocks, we can only conclude that cities and dense settlement are simply ubiquitous across large swaths of the central Maya Lowlands. In this regard, the Alianza data are relevant because of the degree to which they do not reveal a new and substantially different perspective on Maya settlement density and urbanism when compared with other datasets. Rather, they offer an unambiguous rejoinder to the concern (voiced, for example, by Ringle et al. Reference Ringle, Negrón, Ciau, Seligson, Fernandez-Diaz and Ortegón Zapata2021) that archaeologically motivated lidar surveys have inflated estimates of regional settlement density. To the contrary, pseudorandom surveys—those combining expedient and random sampling—like this one, have established that anyone who is waiting for a sparsely settled Maya hinterland large enough to offset the high settlement densities documented by archaeological lidar surveys is running out of places to look.
As archaeologists work to document and characterise ancient settlement systems throughout the tropics, local scale ‘dense pasts’ are proliferating. It is increasingly clear that dense palimpsests of human modification are not exceptional in these settings, despite long-standing biases that presumed them to be. The field of archaeology now confronts the twin tasks of understanding how these settlement palimpsests accrued through time, and of charting how they varied across space—the better to appreciate just how crowded tropical antiquity may have been.
Data availability statement
Point clouds (.laz), digital elevation models (.tif) and vector points representing our interpretation of archaeological buildings (.kmz) are available through Tulane University's Lab Archives platform with the permission of Mexico's Instituto Nacional de Antropología e Historia. They may also be downloaded from the Ancient Maya Settlement blog (ancientmayasettlement.com).
Acknowledgements
The authors wish to thank Scott Hutson, Whittaker Schroder and two anonymous reviewers for providing detailed and helpful feedback that significantly improved this manuscript during its journey to publication.
Funding statement
Support for this research was provided by Tulane University Middle American Research Institute through a grant for the MARI-GISLAB by the Hitz Foundation.


 Open access