


Vitamin D is a pro-hormone that is synthesised in the skin with sunlight exposure (UVB wavelength 290–315 nm)( Reference Holick 1 ). It can also be obtained from the diet but sources are limited. Whilst essential for maintaining bone health through its effect on parathyroid hormone (PTH) and Ca absorption, the presence of vitamin D receptors in most tissues in the body indicate its involvement in many aspects of non-skeletal health including immune function, diabetes risk, some cancers, ischaemic heart disease and depression.
Measuring 25-hydroxyvitamin D (25(OH)D) in free-living individuals exposed to UVB light is an established marker for assessing variation in blood vitamin D concentrations( Reference Poskitt, Cole and Lawson 2 , Reference Juttman, Visser and Buurman 3 ). In Northern latitude areas (i.e. 50–60°N), UVB exposure varies with season, being highest in late summer (August–September) and lowest in late winter/early spring (February–March)( 4 , Reference Swan 5 ). It has been shown that blood 25(OH)D concentrations follow the same pattern in UK civilian( Reference Juttman, Visser and Buurman 3 , Reference Zittermann 6 ) and military( Reference Davey, Lanham-New and Shaw 7 ) populations. For example, Davey et al. ( Reference Davey, Lanham-New and Shaw 7 ) reported seasonal differences in serum 25(OH)D concentrations in military trainees (who were similar to volunteers in the present study in terms of sex, ethnicity, physical fitness, geographic location, clothing style, sunlight exposure and diet), from a low of 47·0 (sd 23·7) nmol/l in February to a high of 97·3 (sd 24·6) nmol/l in July (note: measures were not taken in August due to summer leave).
Seasonal variations in vitamin D status arise from an inability of skin to endogenously synthesise vitamin D during the winter months at the UK latitude of 50–58°N (October–March)( 4 ). Adequate systemic concentrations of vitamin D are vital for maintaining bone mineralisation( Reference van Leeuwen, van Driel and van den Bemd 8 ) and hence long-term bone health( Reference Zittermann 6 ). However, seasonal cycling of serum 25(OH)D have been associated with increased bone resorption, which in turn could be detrimental for longer-term skeletal integrity( Reference Darling, Hart and Gibbs 9 ). Both the size of the seasonal change in 25(OH)D concentration, and the absolute 25(OH)D concentration, appear important in influencing health outcomes( Reference Darling, Hart and Gibbs 9 ). Darling et al. ( Reference Darling, Hart and Gibbs 9 ) observed that reductions in 25(OH)D of about 20 nmol/l were associated with changes in bone resorption, as evidenced by changes in serum PTH and C-telopeptide concentrations. Low-vitamin D concentrations (i.e. <50 nmol/l) increased the risk of stress fracture in military populations undertaking arduous physical work( Reference Davey, Lanham-New and Shaw 7 ), and this risk may be further increased by large 25(OH)D fluctuations.
The interaction between nutrition, physical activity and musculoskeletal health in young adults has been confirmed( Reference Ruffing, Cosman and Zion 10 , Reference Baxter-Jones, Faulkner and Whiting 11 ), where low body mass and poor aerobic fitness increase bone injury risk in military volunteers( Reference Davey, Lanham-New and Shaw 7 ). Serum 25(OH)D concentrations below 76 nmol/l have previously been predictive of stress fracture in Finnish young men( Reference Ruohola, Laaksi and Ylikomi 12 ). A reduction in vitamin D status can contribute to increases in PTH concentration, which has concomitant effects on increasing osteoclastic activity and bone resorption. High-serum PTH concentrations have been associated with increases in stress fracture incidence in military trainees( Reference Valimaki, Alfthan and Lehmuskallio 13 ). In addition, vitamin D (1,25-dihydroxyvitamin D) regulates the active process of Ca absorption in the gut( Reference Heaney and Barger-Lux 14 ), and low-vitamin D status would be associated with impaired Ca regulation – both directly and indirectly – which in turn would also increase bone injury risk.
Helmand Province, Afghanistan is located 31°N. British Armed Forces personnel who patrolled on foot in Afghanistan during military operations (2002–2014) frequently carried loads in excess of 50 kg, often in ambient temperatures >40°C, for up to 12 h per d( Reference Hill, Fallowfield and Delves 15 ). During such patrols, soldiers may have been required to sprint, cross ditches, climb compound walls, fire weapons and lift and evacuate casualties. Such conditions placed severe physical and nutritional demands on soldiers( Reference Fallowfield, Delves and Hill 16 ). A standard deployment was for 6 months, interspersed with a short (10–14 d) period of rest and recuperation. Despite significant improvements, forward operating bases (FOB) and patrol bases remained austere living and working environments. Soldiers who sustained a musculoskeletal injury during operational deployments to Afghanistan tended to have a lower energy intake (12 %) and lower carbohydrate intake (20 %) than non-injured personnel( 17 ). In addition, those deploying from the UK in March–April, due to a potentially low-vitamin D status, would likely be at increased risk of bone injury early in their deployments.
The operational capability of military personnel is determined by their physical fitness, ability to adapt to local environmental conditions, nutritional status, the quality of rest/recovery after bouts of arduous work( 18 ), and the ability to remain injury and illness free. As few data exist worldwide examining the effect of extreme changes in climate on nutrient profiles, this study investigated longitudinal changes in 25(OH)D concentration in young, male, UK military volunteers during summer military deployments to Afghanistan.
Methods
Overview
This paper presents two data sets. First, a pilot study (n 37) was undertaken to provide preliminary data on serum 25(OH)D concentrations during a 6-month (hot-dry) summer operational deployment in Afghanistan, to assess the feasibility of addressing the research question within a conflict zone, and to modify the study design as necessary. Second, the main study (n 98) was part of a more expansive research programme( Reference Fallowfield, Delves and Hill 16 ), also undertaken during a summer deployment. In addition to measuring serum 25(OH)D concentrations, PTH, adjusted Ca and albumin concentrations were measured to confirm and better understand the significant 25(OH)D fluctuations observed in the pilot study.
The daily working routine would have been dependent upon the prevailing operational tempo. During a typical working day, study volunteers would undertake the following activities: patrolling on foot; watch ‘Sangar’ duty; quick reaction force duties, where small teams rapidly respond at short notice to developing ‘hostile’ situations for security or reconnaissance missions; sleeping; eating; personal physical training (dependent upon the available facilities); and relaxation (e.g. reading, watching videos and playing computer games). Due to the operational context in which the study was undertaken, it was not possible to gather specific information on sunlight exposure for each volunteer. However, in the more basic and austere FOB, volunteers could be exposed to sunlight for most of the day with limited shade. Whilst patrolling outside of the base, volunteers were fully covered by military trousers, shirts, body armour, helmet, and would be carrying a mission-specific load. When undertaking general FOB duties and relaxing, a more relaxed uniform was worn (e.g. shorts with or without a T-shirt). Volunteers were encouraged to wear sunscreen, but this was not mandated and could not be monitored.
Study design
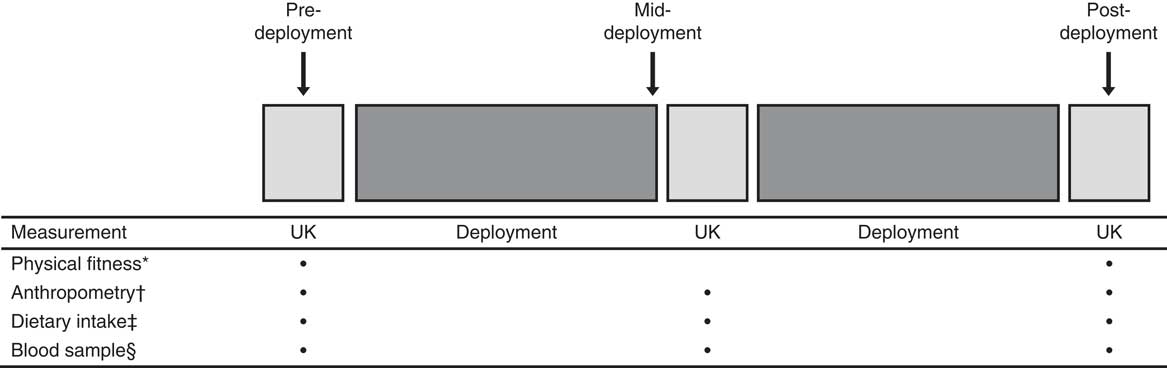
Both the pilot study and the main study followed a with-in subject, repeated measures design. Volunteers were measured and blood samples drawn pre-deployment, mid-deployment and post-deployment. A schematic representation of the study design is presented in Fig. 1. These studies were conducted according to the guidelines laid down in the Declaration of Helsinki, and all procedures involving human volunteers were approved by the Ministry of Defence Research Ethics Committee (pilot study: MODREC 0903/228; main study: MODREC 090/GEN/09). Written informed consent was obtained from all volunteers.
Schematic representation of the study design. * Physical fitness assessment (multistage fitness test, sit-ups, press-ups), hand-grip strength and static lift strength. † Body mass, height, skin-folds and body girths. ‡ Food diary. § Blood sample (pilot study: 25-hydroxyvitamin D (25(OH)D); main study: 25(OH)D, parathyroid hormone, calcium and albumin).
Research participants
Pilot study
A unit of approximately 550 deploying soldiers was approached to take part. At the time of the pre-deployment measurements, due to attendance on courses away from the unit, about two-thirds of soldiers were available in camp to volunteer for the study. A sample of eighty-eight deploying soldiers (forty-four soldiers; thirty-three non-commissioned officers; two officers; nine other), from which n 37 matched (pre-, mid-, post-deployment) sets of data for the pilot study serum measures were obtained. Participants were aged 18–42 years and had been deemed medically fit to operationally deploy.
Main study
A unit of approximately 750 deploying soldiers was approached to take part. The study sample was limited to those in camp during pre-deployment measurements. All participants were at least 18 years old at deployment, operationally fit and medically healthy. A cohort of 249 volunteers were recruited (139 marines, ninety non-commissioned officers, ten officers and ten other), from which n 98 matched (pre-, mid-, post-deployment) sets of data for the serum measures were obtained. The energy expenditure, nutritional status, body composition and physical fitness data have been reported in full previously( Reference Fallowfield, Delves and Hill 16 ).
Procedures
Anthropometric assessment
Pre-deployment (March) anthropometric measures (body mass, height and body composition), dietary intake and physical activity were assessed in the UK; mid-deployment (June–August) measures were undertaken at Camp Bastion, Afghanistan, and post-deployment (October–November) measures were undertaken in the UK (pilot study) and RAF Akrotiri, Cyprus (main study) as volunteers returned to the UK. Thus, volunteers were measured within 14 d (pilot study) or 7 d (main study) of leaving the frontline. Body mass (Seca scales; accuracy 0·1 kg), height (Invicta stadiometre; accuracy 0·1 cm), body composition as assessed by skin-folds (eight sites) and circumferential girths (six sites) were measured( Reference Lohman, Roche and Martorell 19 ). Body mass measurements were standardised, with volunteers being measured in a fasted state in the morning wearing underwear/lightweight sports shorts. To minimise error variance in the anthropometric assessment, body girth and skinfold measurements were controlled and standardised between investigators taking the measurements through locating specific body measurement sites relative to stable anatomical features, where the distance from the anatomical landmark was standardised between measurements. Percentage body fat was estimated using the method of Durnin & Womersley( Reference Durnin and Womersley 20 ).
Dietary intake assessment
Volunteer dietary intake was recorded over representative 4-d periods pre-, mid- and post-deployment using a customised food diary( Reference Davey, Delves and Allsopp 21 ). Additional information on dietary supplement use was also collated at these time points using a dietary supplements questionnaire. The accuracy of the self-reported diet records was assessed using the James & Schofield( Reference James and Schofield 22 ) human energy requirement equation for BMR calculation. Dietary intake data were analysed using a dietary assessment package (WinDiets).
Physiological fitness assessment
The physiological fitness test battery included: the multistage fitness test( Reference Brewer, Ramsbottom and Williams 23 ) to estimate VO2max; press up and sit up tests assessed upper body and trunk muscular endurance; hand grip strength assessment (Takei Hand Grip Dynamometer, Model 5401; Cranlea) of both dominant and non-dominant hands; and a static lift strength assessment (Takei Isometric Dynamometer, Model 5402; Cranlea)( Reference Fallowfield, Delves and Hill 16 ).
Biochemical analyses
At pre-, mid- and post-deployment, blood samples were drawn, serum extracted from a 10 ml aliquot, frozen at –20°C in situ and subsequently stored at –80°C until analysed. Serum 25(OH)D concentrations were measured in the pilot study, and 25(OH)D, PTH, adjusted Ca and albumin concentrations were measured in the main study at these three time points. Ca, albumin and inorganic phosphate were measured by standard absorbance spectroscopic methods on the Abbott Architect ci1600 analyser (Abbott Diagnostics). Measurement intra- and interassay CV were 2·0 and 3·0 %, respectively. Ca concentrations were adjusted for systemic albumin concentrations to determine the physiologically important ‘free’ Ca concentration. As such, albumin-adjusted Ca concentrations are reported. Intact PTH concentrations were measured by an automated immunoassay performed on a Roche Modular system (Roche Diagnostics), where the CV for PTH analysis was 4·8 %. Measurement of 25-hydroxyvitamin D2 and 25-hydroxyvitamin D3 was performed by liquid chromatography and tandem MS (Waters Ltd). This method uses deuterated (H3) 25-hydroxyvitamin D3 as an internal standard (AsVitas Pharmaceuticals). The laboratory was certified as proficient by the vitamin D external quality assessment scheme (DEQAS), where the objective of DEQAS is to ensure the analytical reliability of 25(OH)D and 1,25-dihydroxyvitamin D assays. Intra- and inter-assay CV were 3·7 and 4·8 %, respectively.
Statistical analysis
Statistical analyses were undertaken using the statistical package SPSS (version 20.0.1). Data were checked for normality using the Kolmogorov–Smirnov test. Parametric and non-parametric data are presented as means and standard deviations or medians and interquartile ranges, respectively. Differences between pre-, mid- and post-deployment measurements were investigated by repeated-measures ANOVA, with Bonferroni correction to control for family-wise errors, as appropriate. Data that were not normally distributed were evaluated by Friedman test with post hoc evaluation by Wilcoxon matched-pairs test, with Bonferroni correction as appropriate. P values <0·05 were considered significant.
Results
The pilot study and main study took place during consecutive summer deployments (March–October/November) in 2009 and 2010, respectively. The duration of the UK’s summer deployments was 121 (sd 18) d (range: 90–153 d) pre- to mid-deployment, and 86 (sd 19) d (range: 55–125 d) mid- to post-deployment.
Research participants
Pilot study
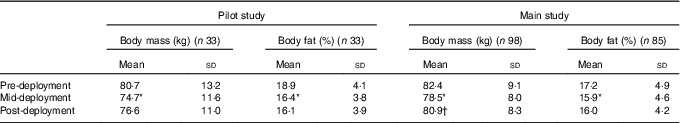
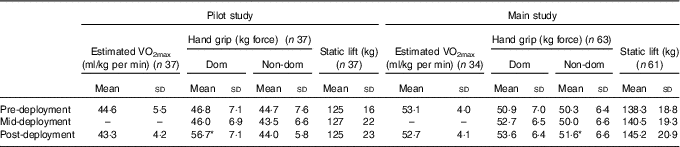
A sample of eighty-eight volunteers was recruited pre-deployment for the pilot study, of which fifty-five volunteers were measured at mid-deployment and sixty-nine were measured post-deployment. Matched data for thirty-seven volunteers were collated for the blood measures. Mean body mass (n 37) decreased between pre- v. mid-deployment (80·7 (sd 13·2) v. 74·7 (sd 11·6) kg; P<0·05). Body mass partially recovered (2·4 (sd 2·0) kg) between mid- and post-deployment. Body mass and percentage body fat of the volunteers are shown in Table 1. Aerobic fitness was maintained during the deployment, and hand-grip strength of the dominant hand increased (P<0·05) (Table 2).
Body mass and percentage body fat of volunteers in the pilot study and the main study, pre-deployment, mid-deployment and post-deployment; matched data for three measurement pointsFootnote ‡ (Mean values and standard deviations)
* P<0·05 v. pre-deployment.
† P<0·05 v. mid-deployment.
‡ Data were analysed by ANOVA followed by Bonferroni’s post hoc comparisons tests.
Physical fitness data of volunteers in the pilot study and the main study, pre-deployment, mid-deployment and post-deployment (Mean values and standard deviations)
Dom, dominant hand; Non-dom, non-dominant hand.
* P<0·05 v. mid-deployment.
Main study
In total, 249 volunteers participated in the research programme( Reference Fallowfield, Delves and Hill 16 ). Operational constraints prevented many volunteers from providing complete data sets for all measures at all time points. Two volunteers were killed in action and nine were injured and returned to the UK before study completion. Matched data were available at all time points for 105 volunteers (n 98 for blood measures); body mass and percentage body fat of this sub-group of volunteers are shown in Table 1. Body mass decreased by 3·9 (sd 3·2) kg between the pre- and mid-deployment (P<0·05) and increased by 2·4 (sd 2·2) kg between mid- and post-deployment (P<0·05) (Table 1). The mean percentage body fat of the volunteers decreased between pre- and mid- (P<0·05) and post-deployment (P<0·05). During the first half of the deployment, estimated FM and estimated fat free mass (FFM) decreased by 1·7 (sd 2·0) kg (P<0·05) and 1·9 (sd 1·9) kg (P<0·05), respectively. During the second half of the deployment, FM and FFM increased by 0·5 (sd 1·3) kg (P<0·05) and 2·1 (sd 1·8) kg (P<0·05), respectively. As was observed during the pilot study, aerobic fitness was well maintained throughout the 6-month deployment (Table 2), and performance in certain measures of strength improved (pre- v. post-deployment hand grip strength – dominant hand 50·9 (sd 7·0) v. 53·6 (sd 6·4) kg force; non-dominant hand 50·3 (sd 6·4) v. 51·6 (sd 6·6) kg force, P<0·05).
Dietary intake
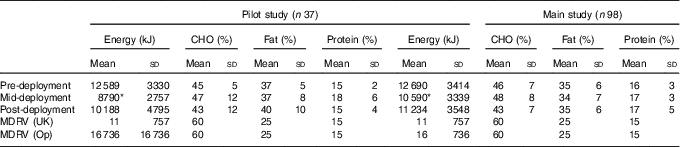
The mean energy intake data and percentage intakes of carbohydrate, fat and protein, for the pilot study and main study are presented in Table 3. Data are reported for pre-deployment, mid-deployment and post-deployment, as are the UK military dietary reference values for energy( 24 ). The mean energy intakes of volunteers in both the pilot study and the main study were lower at mid-deployment compared with pre-deployment (P<0·05). Specifically, in the main study, protein intake decreased from 1·66 (sd 0·19) g/kg body mass pre-deployment to 1·35 (sd 0·26) g/kg body mass mid-deployment. Dietary vitamin D intake, and the use of dietary supplements, was further explored in the main study. Vitamin D intake in the daily diet pre-deployment and mid-deployment was 4 (sd 3) and 3 (sd 2) µg/d, respectively. The most common dietary supplements taken by volunteers in the main study were protein bars and/ or protein powders (35 %), energy drinks (16 %), multi-vitamins (9 %), multi-vitamins and minerals (8 %), creatine (6 %), and Fe (2 %). There were no reports of volunteers self-supplementing with vitamin D with or without Ca.
Self-reported energy and macronutrient intake data of volunteers in the pilot study and the main study, pre-deployment, mid-deployment and post-deployment; matched data for three measurement pointsFootnote † (Mean values and standard deviations)
CHO, carbohydrate; MDRV, military dietary reference value; Op, operation.
* P<0·05 v. pre-deployment.
† MDRV for personnel serving in the UK (MDRV (UK)) and for personnel serving on operations (MDRV (Op))( 24 ).
Serum vitamin D status as measured by 25-hydroxyvitamin D concentrations
Pilot study
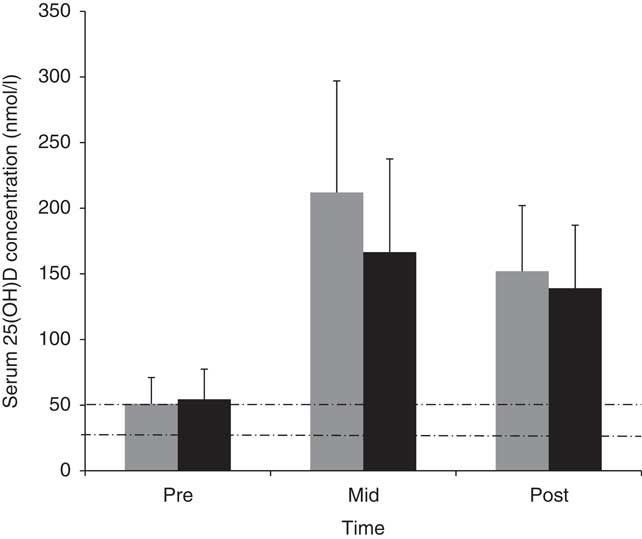
Fig. 2 presents the 25(OH)D status of volunteers pre-, mid- and post-deployment. At the pre-deployment baseline measurement point (base location: 54°N), 62 % of soldiers participating in the pilot study had a suboptimal vitamin D status for bone health (i.e. 25(OH)D <50 nmol/l)( 25 ), with 3 % being deficient (i.e. <25 nmol/l)( 25 ). Mean 25(OH)D concentrations increased 4-fold during the first half (March–June) of the deployment (P<0·05). At the mid-measurement point, no volunteers were suboptimal but 59 % had very high concentrations at >185 nmol/l (over three and a half times the 50 nmol/l cut-off for vitamin D as defined for optimum bone health by the US Institute of Medicine( 25 )) Mean 25(OH)D concentrations decreased during the second half (June–October) of deployment (P<0·05), but post-deployment serum 25(OH)D concentrations were still >185 nmol/l in 24 % of the volunteers.
Mean values and standard deviations of serum 25-hydroxyvitamin D (25(OH)D) concentrations in pilot study (![]() ) and main study (
) and main study (![]() ) volunteers at pre-deployment, mid-deployment and post-deployment. Dashed lines indicate vitamin D cut-off values for suboptimal (<50 nmol/l) and deficient (<25 nmol/l).
) volunteers at pre-deployment, mid-deployment and post-deployment. Dashed lines indicate vitamin D cut-off values for suboptimal (<50 nmol/l) and deficient (<25 nmol/l).
Main study
Similar to the pilot study, 25(OH)D concentrations in the main study volunteers increased 3-fold between pre- (base location: 51°N) and mid-deployment time points (54 (sd 23) v. 167 (sd 71) nmol/l, P<0·05), and decreased between mid- and post-deployment (P<0·05) (Fig. 2). At the pre-deployment baseline measurement point, 48 % of volunteers participating in the main study were suboptimal for their 25(OH)D status, with 9 % being deficient. At the mid-deployment measurement point, no volunteers were suboptimal, but 33 % of volunteers had concentrations >185 nmol/l. At post-deployment, 14 % of volunteers still had 25(OH)D concentrations >185 nmol/l.
Markers of calcium metabolism (serum parathyroid hormone, serum calcium and albumin)
25(OH)D status is also informed by serum PTH, and serum Ca concentrations corrected for albumin status (Table 4). PTH concentration decreased between pre- and mid-deployment time points (P<0·05) and increased between mid- and post-deployment (P<0·05). Systemic concentrations of PTH were within the range of normality for serum PTH pre-, mid- and post-deployment (1·1–6·8 pmol/l). Serum-adjusted Ca and albumin concentrations did not change across the deployment.
Parathyroid hormone (PTH), adjusted calcium and albumin in volunteers (main study) at pre-deployment, mid-deployment and post-deployment (n 98) (Mean values and standard deviations; medians and interquartile ranges (IQR))
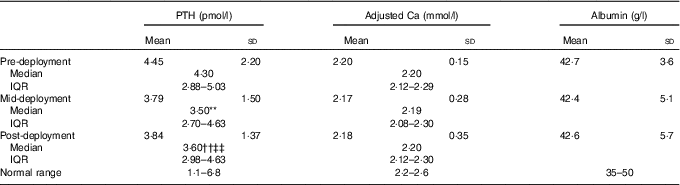
** Friedman’s ANOVA with Bonferroni correction; pre- v. mid-deployment (P<0·017).
†† Friedman’s ANOVA with Bonferroni correction; pre- v. post-deployment (P<0·017).
‡‡ Friedman’s ANOVA with Bonferroni correction; mid- v. post-deployment (P<0·017).
Discussion
This study investigated the effect of a summer military deployment to Afghanistan on vitamin D status (assessed from 25(OH)D concentration) in young UK male military volunteers. The mean 25(OH)D concentration of pilot study volunteers at the pre-deployment baseline measurement point was 51 (sd 20) nmol/l, with 38 % of volunteers falling within the normal range. The baseline measurements were taken in March 2009, when the body’s stores of vitamin D would have been at their lowest. A summer deployment to Afghanistan would likely be associated with greater sunlight exposure, which would allow vitamin D stores to be replenished and maintained in almost all volunteers. Indeed, this sunlight exposure is most probably the largest single cause of the observed increase in 25(OH)D. This is likely to be a much larger contributor than body weight loss alone( Reference Shapses and Cifuentes 26 ); previous research has confirmed that a weight-reducing diet that achieved a weight loss of 8·4 kg was associated with a rise in 25(OH)D of 7·2 nmol/l( Reference Villareal, Fontana and Das 27 ). Thus, the weight loss of about 4 kg observed in the present study would only be associated with a rise in 25(OH)D of up to 4 nmol/l. By the post-deployment measurement point, all volunteers had 25(OH)D concentrations within the normal range. The preliminary observations from the pilot study were confirmed in the main study, where volunteers had low (48 % sub-optimal, 9 % deficient) 25(OH)D concentrations pre-deployment (March 2010), and a significant increase in 25(OH)D by mid-deployment, with concentrations being maintained at the post-deployment measurement point.
In contrast with 25(OH)D, PTH measured in the main study was at its highest at the pre-deployment measurement point and decreased thereafter at the mid- and post-deployment measurement points. This seasonal pattern of response (i.e. increasing 25(OH)D as PTH decreases winter/spring v. summer/autumn) has previously been reported by Christensen et al. ( Reference Christensen, Lien and Hustad 28 ) who speculated on a link with Ca homoeostasis and bone health. However, the magnitude of difference seen in the present study (i.e. 6·4 pg/ml) was unlikely to affect bone health.
As well as the effects of total body mass loss over the course of the deployment, the seasonal cycling of 25(OH)D observed in both the pilot study and the main study might have been exaggerated by associated changes in body FM( Reference Kremer, Campbell and Reinhardt 29 ). The 95 % confidence limits for estimating body FM from skinfold calliper measurements have previously been assessed in this population as ±0·8 kg (or ±0·9 % body fat)( 30 ). The observed changes in body FM in the present study were therefore of physiological importance, and not within the error of the measurement approach. Increases in vitamin D status with reductions in FM have been reported in obese volunteers, where the mechanism was likely related to both a direct mobilisation of vitamin D stores into the circulation and the enzymatic regulation of 25(OH)D in response to weight loss( Reference Pannu, Zhao and Soares 31 ).
It was a concern that volunteers in both the pilot study and the main study were beginning their tour of duty with what would be considered to be ‘sub-optimal’ vitamin D concentrations – especially taking into consideration the austere living conditions associated with the deployment. This is potentially a similar situation across the UK military population and requires urgent attention; continuous winter-time vitamin D deficiency could have profound effects on future bone health, particularly stress fracture risk, which is a common problem in the UK military( 32 ). The pilot and main studies were undertaken before the publication of the UK’s Scientific Advisory Committee on Nutrition’s (SACN) guidance on vitamin D intake to support health( 33 ). SACN provided a recommended nutrient intake of 10 µg/d (400 IU/d) to maintain a serum 25(OH)D concentration ≥25 nmol/l (10 ng/l) in 97·5 % of the population when UVB sunshine exposure is minimal (e.g. in the winter months). Work is ongoing by the UK Ministry of Defence to investigate the efficacy of a vitamin D supplementation regimen, taking into account seasonal fluctuations, to mitigate any adverse effects of insufficiency or deficiency on injury and illness risk.
Of interest were the large increases in 25(OH)D status at mid-deployment, which were maintained at post-deployment in the study volunteers – both in the pilot study and in the main study. A cut-off of 185 nmol/l was used to define ‘high serum 25(OH)D status’, which is consistent with Melamed et al. ( Reference Melamed, Michos and Post 34 ) (and cited in the IOM report( 25 )), with respect to a U-shaped risk curve for high-vitamin D status and all-cause mortality. In the present study, there were large increases in 25(OH)D concentrations between pre- and mid-deployment, such that the normal fluctuations (often referred to as ‘seasonal 25(OH)D cycling’)( Reference Darling, Hart and Gibbs 9 ) observed in the general population (i.e. low in the winter, higher in the summer) were very exaggerated in these military populations( Reference Woitge, Scheidt-Nave and Kissling 35 ). Darling et al. ( Reference Darling, Hart and Gibbs 9 ) reported that increased seasonal fluctuations in 25(OH)D were associated with increased systemic concentrations of PTH and increased bone resorption markers (as assessed by C-terminal telopeptide). Bone formation markers were not assessed in the pilot study and main study cohorts, but in the absence of increased bone formation bone loss would ensue at a relatively rapid rate. The finding of elevated PTH concentrations at pre-deployment in the main study probably reflected bone resorption, and if proven these findings would likely have an adverse effect on long-term bone health. 25(OH)D cycling and associated PTH fluctuations is an area for further investigation( 25 ). It is known that vitamin D is critical for bone mineralisation, but there are insufficient data currently available to determine the importance of its role in microdamage repair. Nevertheless, this is of relevance in military populations as reduced stress fracture prevalence has been shown to be associated with a serum 25(OH)D concentration above a median of 76 nmol/l in Finnish male army trainees, compared with trainees with a serum 25(OH)D concentration below the median( Reference Ruohola, Laaksi and Ylikomi 12 ). However, stress fracture risk was lowest in US female navy trainees with a serum 25(OH)D concentration above 100 nmol/l( Reference Burgi, Gorham and Garland 36 ).
Differences in the optimal serum 25(OH)D concentrations to minimise stress fracture risk may reflect study design, the military training undertaken, and/or differences between the sexes. Nevertheless, these studies would suggest that the current UK and US systemic vitamin D concentrations for insufficiency would not protect against injury in a military population regularly undertaking arduous physical training or physically demanding work( Reference Davey, Lanham-New and Shaw 7 ). In support of this thesis, we have previously reported a high prevalence of serum 25(OH)D insufficiency during the winter months in UK military trainees undertaking arduous Royal Marines (RM) training (i.e. 25(OH)D concentrations below 50 nmol/l)( Reference Davey, Lanham-New and Shaw 7 ). Moreover, we identified a higher proportion of RM trainees who suffered a stress fracture during training and had insufficient serum 25(OH)D at the start of training compared with those who did not develop a stress fracture. Thus, 25(OH)D status was identified as an important independent risk factor for bone injury, where there were fundamental differences in bone mass and bone structure in stress fractured trainees( Reference Davey, Lanham-New and Shaw 37 ). As such, trainees with low-25(OH)D status represented a cause for concern with respect to stress fracture risk. We were unable to investigate the study cohort for a longer period of time, which would have been helpful in identifying whether those trainees who were the highest 25(OH)D ‘cyclers’ were also more prone to injury and in particular stress fracture.
Furthermore, the link between 25(OH)D status and muscle function is of great interest to exercise physiology and military training. There is evidence in the literature that low-vitamin D status is associated with poor muscle health( 25 , 33 ), potentially through a mechanism mediated by vitamin D receptors on skeletal muscle( Reference Ceglia, Niramitmahapanya and Da Silva Morais 38 ). The changes in strength observed in the main study volunteers may be related not only to physical capability but also (in part at least) to changes in serum 25(OH)D status. The study design did not allow this hypothesis to be rigorously tested, but it is certainly an area for further research.
Study limitations
The present study has a number of limitations. First, we were limited to only being able to study males within a narrow age range, and as such our findings may not be applicable to older age groups and to females who may be at a different risk of vitamin D insufficiency/deficiency. It was not possible to study the cohorts longitudinally over a longer period of time (e.g. 12–24 months) with respect to the long-term effects on 25(OH)D changes. This would be an area for further research. Neither was it possible to measure actual changes in bone turnover markers in this population group, which would have added significantly to the interpretation of the effects of 25(OH)D cycling on bone health in the long-term. This also warrants further study and would provide important data on the potential impact on stress fracture risk. The present study is limited with respect to the specific measurements of Ca and vitamin D metabolism; it was not possible to measure either the active hormone of vitamin D or vitamin D-binding protein. Hence, we acknowledge that it is difficult to address from this data set features specific to vitamin D restoration. As such, this again is an area for further research.
Conclusion
In conclusion, this is the first study to investigate vitamin D status fluctuations (as assessed by measurement of 25(OH)D concentrations) in military personnel, relative to dietary intake and body mass changes, during a 6-month summer operational deployment in Afghanistan. Body mass and FM decreased markedly over the first half of the deployment. The high percentage of military personnel below the insufficiency cut-off threshold for vitamin D pre-deployment is a clear cause for concern, given the established link between low-25(OH)D status and risk of stress fracture. Concomitantly, the pronounced increase in 25(OH)D concentration observed during deployment also needs to be investigated further. Such sharp rises in 25(OH)D status may have detrimental consequences for longer-term bone health. These data have significance with respect to mitigating illness and injury in soldiers undertaking arduous military roles on operational deployments, as well as civilian populations, which can be certainly considered an area that warrants further investigation in light of the new UK government’s vitamin D requirements.
Acknowledgements
The authors wish to acknowledge the support of the Command and volunteers from the British Army and the Royal Marines, as well as assistance from LAND Forces Headquarters and the UK Permanent Joint Head Quarters.
This study was funded by the United Kingdom Ministry of Defence. The views expressed are those of the authors and do not necessarily reflect those of the UK Government or the United Kingdom Ministry of Defence.
J. L. F. designed study, data collection, data analysis, data interpretation and prepared manuscript. S. K. D. designed study, data collection, data analysis and data interpretation. N. E. H. designed study, data collection, data analysis, data interpretation and contributed to the preparation of the manuscript. S. L. N., D. W. and A. J. A. designed study, data interpretation and contributed to the preparation of the manuscript. A. M. S. designed study, data collection, data analysis and data interpretation and contributed to the preparation of the manuscript. P. B. data collection and contributed to the preparation of the manuscript. C. B. data collection, data analysis, data interpretation and contributed to the preparation of the manuscript.
None of the authors had any conflicts of interest.
Ministry of Defence © Crown Copyright 2018.


