

Accumulating evidence supports that a high proportion of dietary energy derived from proteins increases weight loss and prevents weight (re)gain( Reference Skov, Toubro and Ronn 1 – Reference Lejeune, Kovacs and Westerterp-Plantenga 5 ), and primary data from the Diet, Obesity and Genes (DiOGenes) study indicate a weight-maintaining effect of a high-protein–low-glycaemic index diet( Reference Larsen, Dalskov and van Baak 6 ). The beneficial effects of proteins seem to be due to higher diet-induced thermogenesis (DIT)( Reference Mikkelsen, Toubro and Astrup 7 ), increased satiety( Reference Weigle, Breen and Matthys 2 , Reference Astrup 8 ) and decreased hunger( Reference Skov, Toubro and Ronn 1 ). In the Western part of the world, dairy products are a major source of daily protein intake, and data from the Coronary Artery Risk Development in Young Adults study indicate an inverse association between dairy product consumption and 10-year cumulative incidence of obesity in subjects who were overweight at baseline( Reference Pereira, Jacobs and Van 9 ). However, data from randomised clinical trials examining the effect of dairy product consumption on body weight and metabolic risk markers are conflicting( Reference Zemel, Thompson and Milstead 10 – Reference Wagner, Kindrick and Hertzler 16 ). Evidence from two recent meta-analyses( Reference Chen, Pan and Malik 17 , Reference Abargouei, Janghorbani and Salehi-Marzijarani 18 ) indicates that dairy product intake combined with energy restriction, but not combined with ad libitum diets, may favour weight loss. Additionally, data from the meta-analysis carried out by Chen et al. ( Reference Chen, Pan and Malik 17 ) suggest that study duration also influences the outcome, with no effects of dairy product intake being observed in studies lasting for more than 1 year.
Furthermore, the beneficial effects of dairy product consumption on blood lipid profile, blood pressure and insulin resistance have been observed in some, but not in all studies( Reference Pfeuffer and Schrezenmeir 19 – Reference Soedamah-Muthu, Verberne and Ding 21 ). Specific peptides (valine–proline–proline and isoleucine–proline–proline) have been suggested to contribute to the blood pressure-lowering effect of dairy products( Reference Pfeuffer and Schrezenmeir 19 , Reference McGrane, Essery and Obbagy 22 ). Peptides containing up to ten amino acids may be released from dairy proteins through the proteolytic activity of lactic bacteria, and thus be found in fermented dairy products, or may be released during the digestive process. Some of these peptides have angiotensin-converting enzyme-inhibitory and endothelin release-inhibitory activities( Reference Pfeuffer and Schrezenmeir 19 ), and angiotensin-converting enzyme is a key enzyme in the regulation of peripheral blood pressure( Reference Pfeuffer and Schrezenmeir 19 ). Furthermore, the inverse association between dairy product consumption and type 2 diabetes risk observed in both cross-sectional and prospective studies( Reference Elwood, Pickering and Givens 23 , Reference Elwood, Pickering and Fehily 24 ) has been suggested to be due to the insulinotropic effects of dairy proteins, in particular, whey protein( Reference Pfeuffer and Schrezenmeir 19 ).
Dairy products are also rich in saturated fat. However, there is no clear evidence that the consumption of dairy products is associated with an increased risk of CVD( Reference Tholstrup 25 ). In fact, as summarised in three meta-analyses( Reference Elwood, Pickering and Givens 23 , Reference Elwood, Givens and Beswick 26 , Reference Soedamah-Muthu, Ding and Al-Delaimy 27 ), evidence from observational studies indicates that milk and dairy product consumption may have a neutral or beneficial effect on the incidence of CVD, possibly through beneficial effects on the components of the metabolic syndrome. These findings are supported by data from both cross-sectional and prospective analyses from the French study ‘Data from the Epidemiological Study on the Insulin Resistance Syndrome’( Reference Drouillet, Balkau and Charles 28 ).
Much of the current knowledge about dairy products and metabolic health comes from observational studies, and evidence from high-quality randomised clinical trials is needed to clarify the effects of dairy product consumption. The present study did not specifically use dairy products as part of the intervention, but the subjects were given diets varying in protein content and glycaemic index and were followed carefully for 6 months. The main objective of the present study was to examine putative associations between consumption of dairy proteins and changes in body weight and metabolic risk markers after weight loss in obese and overweight adults who participated in the DiOGenes study. In contrast to those in the primary study( Reference Larsen, Dalskov and van Baak 6 ), analyses in the present study were based on data obtained from all the subjects, irrespective of the intervention group. The primary end point was changes in body weight, and secondary end points were changes in body composition, blood pressure, insulin resistance and blood lipid profile.
Subjects and methods
Study design
The present study was based on secondary analyses of data obtained from adults who completed the DiOGenes study. The DiOGenes study was a multicentre study carried out in eight European countries. The study design, methods, procedures and main results have been described in detail previously( Reference Larsen, Dalskov and van Baak 6 , Reference Larsen, Dalskov and van Baak 29 – Reference Aston, Jackson and Monsheimer 31 ). The study consisted of an 8-week low-energy diet (LED) weight-loss phase immediately followed by a 6-month weight-maintenance (WM) phase. During the 8-week LED phase, subjects were given a LED consisting of Modifast products (Nutrition et Santé) that provided 3·3 MJ (800 kcal) per d. In addition, the subjects could eat up to 400 g of vegetables, providing a total of 3·3–4·2 MJ (800–1000 kcal)/d. In the WM phase, subjects who lost at least 8 % of their body weight during the LED phase were randomly assigned to one of the following five diet groups: (1) low-protein (13 % of total energy consumed)/low-glycaemic index (LP/LGI); (2) low-protein/high-glycaemic index (LP/HGI); (3) high-protein (25 % of total energy consumed)/low-glycaemic index (HP/LGI); (4) high-protein/high-glycaemic index (HP/HGI); (5) control (C). The control diet, prepared following dietary guidelines of each participating country, had a moderate protein and fat content. Dairy product consumption was allowed in all the diet groups (within the limits of protein intake). It was not specifically predetermined in any of the diet groups and varied within and between the groups by personal choice. The subjects were instructed to maintain their weight loss during the WM phase, although further weight reduction was allowed. All the five diets were designed to have a moderate fat content (25–30 % of total energy consumed) with no restrictions on energy intake (i.e. ad libitum diets) to test the ability of the diets to regulate appetite and body weight. Dietary counselling visits were scheduled every 2–4 weeks during the WM phase( Reference Moore, Lindroos and Kreutzer 30 ).
The DiOGenes study was conducted according to the guidelines laid down in the Declaration of Helsinki, and all procedures involving human subjects were approved by the local ethical committees. Written informed consent was obtained from all the subjects. The study was registered at http://www.clinicaltrials.gov with the identification code NCT00390637.
Subjects
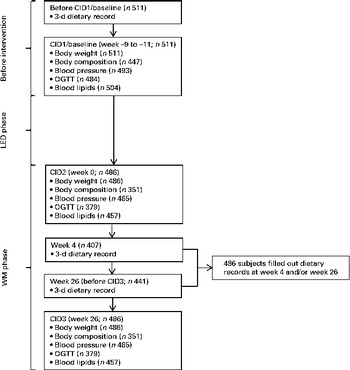
Families with at least one healthy child aged between 5 and 17 years and at least one parent aged between 18 and 65 years who was overweight or obese (BMI (weight (kg)/height (m)2) of at least 27 and less than 45) were recruited for the study. In total, 1209 adult men and women were screened, and 938 were included in the LED phase. Of these, 773 subjects achieved the targeted weight loss ( ≥ 8 % of their baseline weight) during the LED phase and were randomly assigned with their families to one of the five WM diet groups. A total of 548 adults completed the intervention (Fig. S1, available online). Of the 548 completers, 363 were women. The median body weight was 96·1 (25th–75th percentiles 87·0–109·3) kg, and the median age was 42 (25th–75th percentiles 38–46) years. However, only 511 subjects filled out the dietary records at baseline, and only 486 subjects completed either one or two dietary records during the WM phase (Fig. 1). Only data from subjects who completed the intervention and filled out dietary records were included in the present study. The baseline characteristics of subjects who did not complete the dietary records were not different from those who did (data not shown).
Overview – exposure and outcome measures. LED, low-energy diet; WM, weight maintenance; CID, clinical investigation day; OGTT, oral glucose tolerance test. The number of subjects included in the different analyses is the number of subjects who had completed the study and the respective analyses and in addition filled out dietary records at the given time points.
Measurement of anthropometric parameters
Body weight, fat mass (FM), fat-free mass and waist circumference were measured before the LED phase (at baseline: clinical investigation day (CID1)), after the 8-week LED phase (CID2) and after the 6-month WM phase (CID3) (Fig. 2). Body weight was recorded to the nearest 0·1 kg. The subjects were instructed to wear only underwear, and weight was measured in the morning in a fasting condition and with an empty bladder. Height was measured with a wall-mounted stadiometer to the nearest 0·5 cm without shoes. Body composition was determined by either dual-energy X-ray absorptiometry (Lunar Radiation Company) or bioimpedance (Quad-Scan 4000; Bodystat). For each subject, measurements were taken using the same method every time body composition was determined. Moreover, the same measurement devices were used in each centre whenever measurements were taken. The waist circumference was measured between the bottom of the ribs and the top of the hip bone with an accuracy of 0·5 cm.
Experimental design. CID, clinical investigation day; LED, low-energy diet weight-loss phase; WM, weight-maintenance phase; CID1, baseline visit; CID2, visit after LED; CID3, visit after WM; OGTT; oral glucose tolerance test. * The dietary food record at week 26 was filled out before the outcome measures were determined at CID3.
Determination of dietary intake
The subjects completed weighed dietary records for three consecutive days at the time of screening (before baseline/CID1), 4 weeks after the start of the WM phase and in the last week (week 26/before CID3) of the WM phase (Fig. 2) as described elsewhere( Reference Larsen, Dalskov and van Baak 29 ). The dietary records filled out at screening were used to estimate habitual intake, whereas the intake of subjects during the WM phase was estimated based on an average of the food intake recorded at weeks 4 and 26 of the WM phase to achieve an average intake for the entire WM phase. Based on the dietary records, dairy foods were assigned to the following food groups: low- and high-fat milk; low-, medium- and high-fat cheeses; low- and high-fat yogurts; cream; ice cream; other dairy products. Dairy protein intake was estimated from the intake of these food groups. Unfortunately, the DiOGenes database does not contain information on dietary calcium intake. The calculation of nutrient intake was carried out using local food databases( Reference Moore, Lindroos and Kreutzer 30 ).
Collection and analysis of clinical samples
At CID1, CID2 and CID3 (Fig. 2), fasting blood samples of the subjects were drawn from a Venflon catheter and an oral glucose tolerance test was carried out for 120 min. The subjects consumed 75 g of glucose (82·5 g of glucose monohydrate) diluted with 250 ml of water. Blood samples were sent from each centre to a central laboratory, depending on the type of analysis. Fasting and oral glucose tolerance test serum glucose concentrations were determined by a colorimetric assay (Ortho-Clinical Diagnostics, Johnson & Johnson). Insulin concentration was determined using fasting serum samples by a solid-phase, two-site chemiluminescent immunometric assay with the Immulite 2500 analyser (Siemens Healthcare Diagnostics). Insulin resistance was calculated at fasting using the homeostasis model assessment for insulin resistance (HOMA-IR). In addition, insulin resistance was evaluated using the Matsuda index, which includes results obtained for the blood samples at all the time points in the oral glucose tolerance test( Reference Matsuda and DeFronzo 32 ). Fasting blood samples to be analysed for total cholesterol, HDL, TAG, glucose and insulin were analysed at the Research Laboratory, Department of Clinical Biochemistry, Gentofte University Hospital, Denmark. LDL concentration was calculated from the measured values of total cholesterol, HDL and TAG, according to Friedewald's equation( Reference Friedewald, Levy and Fredrickson 33 ).
Determination of urinary nitrogen
The subjects were asked to collect 24 h urine samples four to five times during the study period( Reference Larsen, Dalskov and van Baak 29 ). In the present study, urine samples collected during visits at week 4, at week 14 and at CID3 (week 26) in the WM phase were used to determine average 24 h N secretion. Urinary N concentration was determined by the Dumas combustion methodology, using a VarioMax CN analyser (Elementar), and it was used as a compliance marker.
Measurement of blood pressure
Systolic blood pressure and diastolic blood pressure were recorded at CID1, CID2 and CID3 using an automatic device after 5–10 min rest in a supine position (Fig. 2).
Statistical analyses
Only data obtained from adult subjects who completed the intervention were included, and if dietary intake was not recorded and if data were missing, the observations were removed from the analyses (baseline: n 511, WM phase: n 486). The statistical analyses were carried out using the STATA software, version 11.2 (StataCorp LP, 2011).
Baseline characteristics (e.g. body weight, body composition, blood lipid profile, insulin resistance and blood pressure) were analysed according to the quartiles of dairy protein intake (E%, energy percentage) at CID1. Mixed linear models were used to examine trends in baseline characteristics across the quartiles of dairy protein intake. A Bonferroni post hoc analysis was used to test for multiple comparisons and to reduce the risk of type I errors.
Dairy protein intake of the five intervention groups was examined, and later the subjects were assigned to three diet groups: LP (LP/LGI and LP/HGI); HP (HP/LGI and HP/HGI); C (control). The associations between average dairy protein intake (E%) during the WM phase and changes in body weight, body composition, blood lipid profile, insulin resistance and blood pressure from CID2 to CID3 were examined using mixed linear models. An interaction between dairy protein intake and diet group was included in the model to adjust for potential differences in dairy protein intake in the LP, HP and C groups. If an interaction was present, associations between dairy protein intake and changes in metabolic risk markers were examined in each group separately. If no interaction was present, the interaction with diet group was removed from the analyses, and the analyses were carried out for all the subjects included in the present article, irrespective of the diet group.
Finally, we determined whether habitual intake influenced the association between dairy protein intake and changes in body weight or metabolic risk markers during the WM phase. This was done by inclusion of an interaction of dairy protein intake during the WM phase and at baseline/CID1 (in quartiles) in the model.
All the models were adjusted for sex and age. In multivariate models, we further adjusted for potential confounders (confounders described in the legends of Table 1 and Table 4), and centre was included as a random-effect parameter in all the models. All the data are presented as medians (25th–75th percentiles) as they were not normally distributed. The transformation of variables was carried out if required, and statistical significance was set at P< 0·05.
Body weight and metabolic risk markers by the quartile of dairy protein intake (E%, energy percentage) at baseline in overweight and obese adults* (Median values and 25th–75th percentiles)
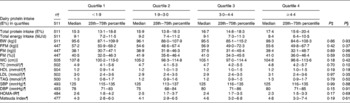
BW, body weight; FFM, fat-free mass; FM, fat mass; WC, waist circumference; TC, total cholesterol; SBP, systolic blood pressure; DBP, diastolic blood pressure; HOMA-IR, homeostatic model assessment for assessment of insulin resistance.
* Data are presented as unadjusted data. Subjects were divided into quartiles based on dairy protein intake (E%).
† The number of subjects depends on the number of completers included in the respective analyses. The different number of subjects in the analyses of blood parameters can be explained by analytical errors.
‡ Unadjusted P value.
§ Model-adjusted P value.
∥ All the models were controlled for age, sex and centre (random effect).
¶ All the models were controlled for age, sex, centre (random effect) and BMI at baseline.
Results
Baseline
Unadjusted baseline data on dairy protein intake (E%), total protein intake (E%) and energy intake, body weight and metabolic risk markers are reported in Table 1. In total, 511 subjects filled out the dietary records at baseline. There were no linear associations between dairy protein intake and body weight, body composition, blood lipid profile, insulin resistance or blood pressure when analysing unadjusted and model-adjusted data at baseline.
Weight maintenance
Data on average dairy protein and total protein intake (g/d and E%) reported herein are those of 486 subjects who filled out one or two dietary records during the WM phase. These data are given in Table 2. Dairy protein and total protein intake was higher in the HP and C groups than in the LP group (P< 0·05), but dairy protein intake did not differ between the HP group and the C group.
Dairy protein, total protein and energy intake in the intervention and diet groups during the 6-month weight-maintenance phase (Median values and 25th–75th percentiles, n 486)
LP, low-protein group; HP, high-protein group; C, control group; LP/LGI, low-protein–low-glycaemic index group; LP/HGI, low-protein–high-glycaemic index group; LP pooled, LP/LGI and LP/HGI groups combined; HP/LGI, high-protein–low-glycaemic index group; HP/HGI, high-protein–high-glycaemic index group; HP pooled, HP/LGI and HP/HGI groups combined; E%, energy percentage.
* Median values were significantly different from those of the C group (P< 0·05).
† Median values were significantly different from those of the LP group (P< 0·05).
‡ Median values were significantly different from those of the HP group (P< 0·05).
§ Median values were significantly different from those of the LP/LGI and LP/HGI groups (P< 0·05).
∥ Median values were significantly different from those of the LP/LGI group (P< 0·05).
¶ Median values were significantly different from those of the HP/LGI and HP/HGI groups (P< 0·05).
** Median values were significantly different from those of the HP/LGI group (P< 0·05).
†† Statistical analyses were controlled for total energy intake.
Data on median changes in body weight and metabolic risk markers during the WM phase, for all subjects pooled, are given in Table 3. On average, body weight, fat-free mass, waist circumference, blood lipid levels, blood pressure and HOMA-IR values increased significantly during the WM phase, while FM (%) and Matsuda index values were significantly reduced. There was no overall change in FM (kg) during the 6-month intervention.
Absolute median changes in body weight, body composition and metabolic risk markers during the 6-month weight-maintenance phase † (Median values and 25th–75th percentiles)
BW, body weight; FFM, fat-free mass; FM, fat mass; WC, waist circumference; TC, total cholesterol; SBP, systolic blood pressure; DBP, diastolic blood pressure; HOMA-IR, homeostatic model for assessment of insulin resistance.
*P< 0·01.
***P< 0·0001.
† Absolute median (25th–75th percentiles) changes during the 6-month weight-maintenance phase. Data from all the subjects, irrespective of the intervention group, were pooled.
‡ The number of subjects depends on the number of completers included in the respective analyses. The different number of subjects in the analyses of blood parameters can be explained by analytical errors.
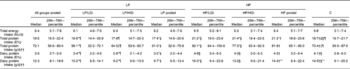
Table 4 summarises the associations between average dairy protein intake (E%) and changes in body weight and metabolic risk markers during the WM phase. These data are those of subjects who filled out the dietary records during the WM phase and in whom measurements of body weight, body composition and risk markers were taken. No interaction between diet group (LP, HP and C) and dairy protein intake was observed in any of the analyses. Therefore, analyses were carried out for all the subjects, irrespective of the diet group. A trend for a negative association was observed between dairy protein intake (E%) and changes in body weight during the WM phase (P= 0·08; β = − 0·17), but when the analysis was controlled for total protein intake, the trend was no longer present (P= 0·30). Moreover, habitual dairy protein intake did not influence the association between dairy protein intake (E%) and changes in body weight during the WM phase. Finally, there were no associations between dairy protein intake (E%) and changes in body composition, blood lipids, blood pressure or insulin resistance.
Associations between dairy protein intake and changes in body weight and metabolic risk markers during the 6-month weight-maintenance phase*
BW, body weight; FFM, fat-free mass; FM, fat mass; WC, waist circumference; TC, total cholesterol; SBP, systolic blood pressure; DBP, diastolic blood pressure; HOMA-IR, homeostatic model for assessment of insulin resistance.
* Data from all the subjects, irrespective of the intervention group, were pooled before the analyses. Regression coefficients are only presented when P values tend to indicate significance or if they are close to 0·1.
† All the models were controlled for age, sex, centre (random effect), change in response parameter during the weight-loss period, response parameter at clinical investigation day 2, glycaemic index and fibre intake during the weight-maintenance phase. Transformation of data was carried out if required.
‡ The number of subjects depends on the number of completers included in the respective analyses. The different number of subjects in the analyses of blood parameters can be explained by analytical errors.
Compliance
Total protein intake estimated from the dietary records correlated with urinary N concentration (r 0·3750; P< 0·00 001). However, the median protein intake calculated from urinary N concentration (80·2 (25th–75th percentiles 60·1–99·6) g, N × 6·25) was significantly higher than the total protein intake estimated from the dietary records (72·2 (25th–75th percentiles 56·6–89·0) g).
Discussion
In the present study, the consumption of dairy proteins was not associated with changes in body weight or other metabolic risk markers during the WM phase. However, increased consumption of dairy proteins tended to be negatively associated with weight gain, although not independent of total protein intake.
Primary data from the DiOGenes study suggest that a high-protein–low-glycaemic index diet is beneficial for the maintenance of body weight after initial weight loss( Reference Larsen, Dalskov and van Baak 6 ). The weight-maintaining effect of proteins may be dependent on the protein source. However, Gilbert et al. ( Reference Gilbert, Bendsen and Tremblay 34 ) found no clear evidence that one protein source is preferable to another in weight-reducing programmes. The present study did not find dairy proteins to add an additional weight-maintaining effect compared with total protein. Therefore, the trend towards a negative association between consumption of dairy proteins and change in body weight may not have been related so much to source as to the total quantity of proteins consumed. This is further supported by the result that there is no association between dairy protein intake and changes in body composition.
Several randomised clinical trials have been conducted to investigate the effect of dairy product consumption on body weight and FM, and data have recently been reviewed in two meta-analyses( Reference Chen, Pan and Malik 17 , Reference Abargouei, Janghorbani and Salehi-Marzijarani 18 ). Both meta-analyses concluded that dairy product consumption without energy restriction does not lead to weight loss. Furthermore, Chen et al. ( Reference Chen, Pan and Malik 17 ) suggested that dairy product consumption has no impact on body weight in the long term (>1 year). However, some of the studies( Reference Chen, Pan and Malik 17 , Reference Abargouei, Janghorbani and Salehi-Marzijarani 18 ) examining the effect of inclusion of dairy products in habitual diets included in these meta-analyses have certain limitations. Subjects received no dietary counselling, which resulted in a tendency towards a greater( Reference Wennersberg, Smedman and Turpeinen 35 ), or a significantly greater( Reference Barr, McCarron and Heaney 36 ), energy intake in the dairy food groups than in the control groups. Despite increased energy intake, body weight and FM did not differ between the groups( Reference Wennersberg, Smedman and Turpeinen 35 ), which suggests that inclusion of dairy products in a habitual diet does not result in weight gain. This finding is further supported by results from studies carried out by Crichton et al. ( Reference Crichton, C Howe and Buckley 37 ) and Zemel et al. ( Reference Zemel, Donnelly and Smith 38 ).
Abargouei et al. ( Reference Abargouei, Janghorbani and Salehi-Marzijarani 18 ) and Chen et al. ( Reference Chen, Pan and Malik 17 ) concluded that there is no negative association between dairy product consumption and body FM when dietary energy intake is unrestricted. These findings are in line with the results of the present study, where there was no energy restriction. However, Zemel et al. ( Reference Zemel, Richards and Milstead 11 ) reported that the consumption of a high-dairy product diet (three servings per d), both during WM and during energy restriction( Reference Zemel, Teegarden and Loan 39 ), results in reduced trunk fat and reduced waist circumference. Furthermore, a recent study has found that drinking 1 litre of skimmed milk per d for 6 months leads to relative reduction in visceral adipose tissue and liver fat compared with drinking 1 litre of regular cola per d, despite similar energy intake( Reference Maersk, Belza and Stodkilde-Jorgensen 40 ).
It has been suggested that proteins exert their beneficial effects on body weight and composition through appetite regulation and increased DIT( Reference Weigle, Breen and Matthys 2 , Reference Mikkelsen, Toubro and Astrup 7 , Reference Astrup 8 ). The effect on appetite regulation and DIT may also depend on the protein source. Acheson et al. ( Reference Acheson, Blondel-Lubrano and Oguey-Araymon 41 ) have recently found a single supplement of whey protein to increase DIT compared with soya protein. The increased DIT may be caused by an increased protein synthesis stimulated by insulin, potentially affected by the high content of branched-chain amino acids found in whey protein. Furthermore, Gilbert et al. ( Reference Gilbert, Bendsen and Tremblay 34 ) suggested that in the long term animal proteins, especially dairy proteins, could support muscle protein synthesis more than plant proteins, and this could stimulate a greater energy expenditure, while Fouillet et al. ( Reference Fouillet, Juillet and Gaudichon 42 ) suggested that amino acids from dairy products are used to a lesser extent for splanchnic catabolic activity and to a greater extent for peripheral anabolic activity than soya protein.
Dairy proteins, and especially whey protein, have also been suggested to have a beneficial effect on appetite. Some randomised clinical trials have observed a more satiating effect of whey protein than of other protein sources( Reference Veldhorst, Nieuwenhuizen and Hochstenbach-Waelen 43 – Reference Anderson, Tecimer and Shah 45 ), but results are conflicting( Reference Acheson, Blondel-Lubrano and Oguey-Araymon 41 , Reference Veldhorst, Nieuwenhuizen and Hochstenbach-Waelen 46 ). In the DiOGenes study, standard meal-induced subjective appetite sensations were monitored at CID1, CID2 and CID3 in a subgroup of 180 subjects. No difference was observed between the five groups( Reference Larsen, Dalskov and van Baak 6 ). Associations between dairy protein intake and appetite have not yet been analysed in the DiOGenes study.
No associations were observed between consumption of dairy proteins and changes in blood pressure during the WM phase in the present study. This finding is not in agreement with the data presented by He et al. ( Reference He, Wofford and Reynolds 47 ), who found that dairy protein supplementation lowered blood pressure in prehypertensive and stage 1 hypertensive subjects. In the present study, subjects were mostly normotensive when entering the WM phase (data not shown). This could explain why there was no decrease in blood pressure, which is supported by the findings of a previous study( Reference Crichton, C Howe and Buckley 37 ). The conflict between the results of the present study and those of the study of He et al. ( Reference He, Wofford and Reynolds 47 ) may also be due to a dose–response effect, as subjects who participated in the study of He et al. ( Reference He, Wofford and Reynolds 47 ) were given 40 g dairy protein per d as supplements, whereas the average intake of dairy proteins in the present study was only 12 g per d (Table 2).
In the present study, dairy protein intake was not associated with changes in blood lipids or insulin resistance, as evaluated by either HOMA-IR or Matsuda index, which is similar to the findings of earlier studies( Reference Pfeuffer and Schrezenmeir 19 , Reference Wofford, Rebholz and Reynolds 48 ). Pfeuffer & Schrezenmeir( Reference Pfeuffer and Schrezenmeir 19 ) found milk, and whey protein, in particular, to be insulinotropic when given in a single meal, but not in long-term interventions, which may explain the lack of association in the present study. In contrast, Rideout et al. ( Reference Rideout, Marinangeli and Martin 49 ) have recently found that four servings per d of low-fat milk and yogurt reduce fasting plasma insulin concentrations and improve insulin resistance. However, based on their study, it is not possible to determine whether the beneficial effect was due to dairy proteins or other bioactive dairy components.
Data obtained in the present study were extracted from an intervention study where subjects were followed carefully over 6 months and received dietary guidance throughout the entire study period. Dairy proteins were not part of the intervention, but the consumption was higher in the HP and C groups than in the LP group. The study included a large number of subjects, representing many different nationalities that may have different preferences for dairy products and proteins. However, there are limitations to the analyses of data obtained during the intervention. Dietary intake was monitored closely after (week 4) and before (1 week before CID3) the determination of outcome measures, which may hamper drawing conclusions on the causal effect of dairy protein intake on outcome parameters. However, we used the average intake from two dietary records to estimate dairy protein intake over the entire 6-month period. Furthermore, we were not able to control for influential factors such as physical activity, but to be included in the study, it was a requirement not to make major changes in activity level during the study( Reference Larsen, Dalskov and van Baak 29 ). Moreover, data on dairy protein intake were obtained from 3 d dietary records. Obese subjects tend to under-report their food intake in dietary records( Reference Schoeller 50 ). In the present study, the average energy intake during the WM phase was only 6·4 MJ/d (compared with approximately 9 MJ/d at baseline), which could indicate that the subjects had under-reported their dietary intake and thereby their dairy product intake. This was supported by data on urinary N concentration and the observation that the consumption of dairy products was much lower than expected for all the dairy food groups, e.g. milk, cheese and yogurt (data not shown). In addition, the lack of additional weight loss during the WM phase indicates that the subjects had under-reported their dietary intake. Dietary records may also have been influenced by diet allocation. In addition, dairy product intake may have been under-reported due to failure to record items such as cheese on pizzas, milk and cream in sauces, and other dairy products included in meals. Moreover, for the determination of body composition, two distinct methods were used. Measurements were taken in each subject using the same method at every visit and the main interest was the change in body composition. However, some discrepancy in the sensitivity to detect changes in body composition exists between the two methods, and this is why the results obtained using the two methods may not be perfectly comparable( Reference Verdich, Barbe and Petersen 51 ). Finally, the DiOGenes study was not designed to investigate associations between consumption of dairy proteins and changes in body weight or metabolic risk markers. Therefore, the study would have had a stronger design if the consumption of dairy proteins had been part of the intervention.
Conclusion
No associations between consumption of dairy proteins and body weight or other metabolic risk markers were found. However, a trend for an association between dairy protein intake and reduced weight gain was found. This did not persist when controlling for total protein intake and therefore it cannot be determined whether the effect of dairy proteins was due to the protein source, other bioactive dairy components or the quantity of total proteins consumed. To further establish whether dairy proteins are preferable over other proteins for the maintenance of body weight and metabolic risk markers, more controlled, long-term intervention studies with focus on specific protein sources are needed.
Supplementary material
To view supplementary material for this article, please visit http://dx.doi.org/10.1017/S0007114513003322
Acknowledgements
The DiOGenes study was funded by a grant from the EU Food Quality and Safety Priority of the Sixth Framework Programme, contract no. FP6-2005-513946. The Dairy Research Institute provided financial support for conducting the data analyses of the present study. Local sponsors made financial contributions to the supermarket centres. The supermarket centres received a number of foods free of charge from food manufacturers (the complete list of sponsors can be viewed at http://www.diogenes-eu.org/sponsors/). The sponsors had no role in the design and analysis of the study or in the writing of this paper.
The authors' contributions are as follows: A. A. and W. H. M. S. designed the study; T. M. L., M. v. B., A. P., J. A. M., T. H.-D., S. A. J., M. K., A. F. H. P., A. A. and W. H. M. S conducted the research; L. Q. B. and J. K. L. analysed the data and carried out the statistical analyses; L. Q. B., J. K. L. and A. R. wrote the paper; all authors contributed to the analyses and interpretation of data, revised the manuscript critically for important intellectual content and approved the final version of the manuscript.
A. A. is currently a member of the advisory boards of the following bodies with interests in dairy industry: Global Dairy Platform, USA; Danone A/S Scandinavia, Sweden; Kraft Foods Worldwide Health & Wellness Advisory Council, USA. In the past 5 years, his research has received funding from Arla Foods A/S and The Danish Dairy Association and from international organisations with interests in dairy industry through a collaborative grant coordinated by Global Dairy Platform. The remaining authors have no conflicts of interest.


