

1. Introduction
The influence of obstacles on avalanche flows has been the topic of many recent studies combining full-scale observations on snow avalanches, small-scale experiments with granular materials, theory and numerical modelling. Studies refer to avalanche flows interacting with deflecting dams (Reference Irgens, Schieldrop, Harbitz, Domaas and OpsahlIrgens and others, 1998; Reference JoÓhannessonJohannesson, 2001; Reference HákonardÓttir and HoggHakonardottir and Hogg, 2005; Reference Cui, Gray and JóhannessonCui and others, 2007; Reference Faug, Naaim and Fourrie`reFaug and others, 2007; Reference Gray and CuiGray and Cui, 2007), catching dams (Reference Chu, Hill, McClung, Ngun and SherkatChu and others, 1995; Reference McClung and MearsMcClung and Mears, 1995; Reference Naaim, Naaim-Bouvet, Faug and BouchetNaaim and others, 2004; Reference GauerGauer and others, 2007, Reference Gauer, Lied and Kristensen2009; Reference Faug, Chanut, Naaim and PerrinFaug and others, 2008a,Reference Faug, Gauer, Lied and Naaimb) and retarding mounds (Reference HakonardoAttir, Hogg, Johannesson and TomassonHákonardóttir and others, 2003; Reference Chiou, Wang and HutterChiou and others, 2005). Up to now the particular situation of free-surface flows overflowing a catching dam has been addressed in terms of the run-out shortening downstream of the dam (Reference Faug, Chanut, Naaim and PerrinFaug and others, 2008a,Reference Faug, Gauer, Lied and Naaimb). This situation is of crucial interest with regard to the residual risk downstream of protection dams. Here we consider the force these avalanche flows are able to exert on a flat obstacle when overflowing it, which is also important when estimating the mechanical vulnerability of buildings and protection dams. Recent full-scale observations on snow avalanches report large pressures at low incoming Froude numbers on tubular pylons (Reference Sovilla, Schaer and RammerSovilla and others, 2008b,Reference Tai, Gray, Hutter and Noellea) and on a flat obstacle (a 1 m2 plate) (Reference Sovilla, Schaer and RammerSovilla and others, 2008b; Reference Thibert, Baroudi, Limam and Berthet-RambaudThibert and others, 2008). Complex materials, such as granular materials and dry snow, can behave as a fluid or a solid: their ability to undergo a transition from a fluid state to a solid state can lead to the formation of stagnant zones when the flow encounters a topographic discontinuity of the ground. While a part of the incoming material is jammed (solid-like phase) another part of the material remains in a fluid-like phase and is deflected, being able to overflow the obstacle. The ability of a granular fluid to form stagnant zones, called granular ‘dead zones’ (Reference Faug, Lachamp and NaaimFaug and others, 2002, Reference Faug, Chanut, Naaim and Perrin2008a; Reference Gray, Tai and NoelleGray and others, 2003), upstream of a topographic discontinuity may lead to severe modifications of the resulting force on the obstacle. The size of the stagnant zone formed upstream of a catching dam is very large if the catching dam prevents side flows. In this paper, we present a simple analytical model based on momentum balance over a control volume upstream of a flat obstacle in order to analyse and quantify the effect of the dead-zone mechanism on the resulting force. The analytical model is first developed for two-dimensional (2-D) flows and validated in a discrete numerical model for dry granular flows overflowing a dam. Asymptotic behaviours at low and high Froude numbers are discussed. We then extrapolate the model to 2-D dry-snow flows using a Voellmy friction law and adapt the model to a more complex three-dimensional (3-D) geometry, taking into account lateral fluxes. Finally we compare the predictions of the 3-D simplified analytical model to field data available from a 1 m2 plate subject to the impact of snow avalanches, at the Lautaret test site in France. It is shown that our analytical model is able to correctly reproduce the measured force values within the experimental uncertainty found in related previous studies (Reference Thibert, Baroudi, Limam and Berthet-RambaudThibert and others, 2008; Baroudi and Thibert, in press).
2. Modelling of Free-Surface Flows Overflowing A Dam
2.1. General framework equations in 2-D geometry
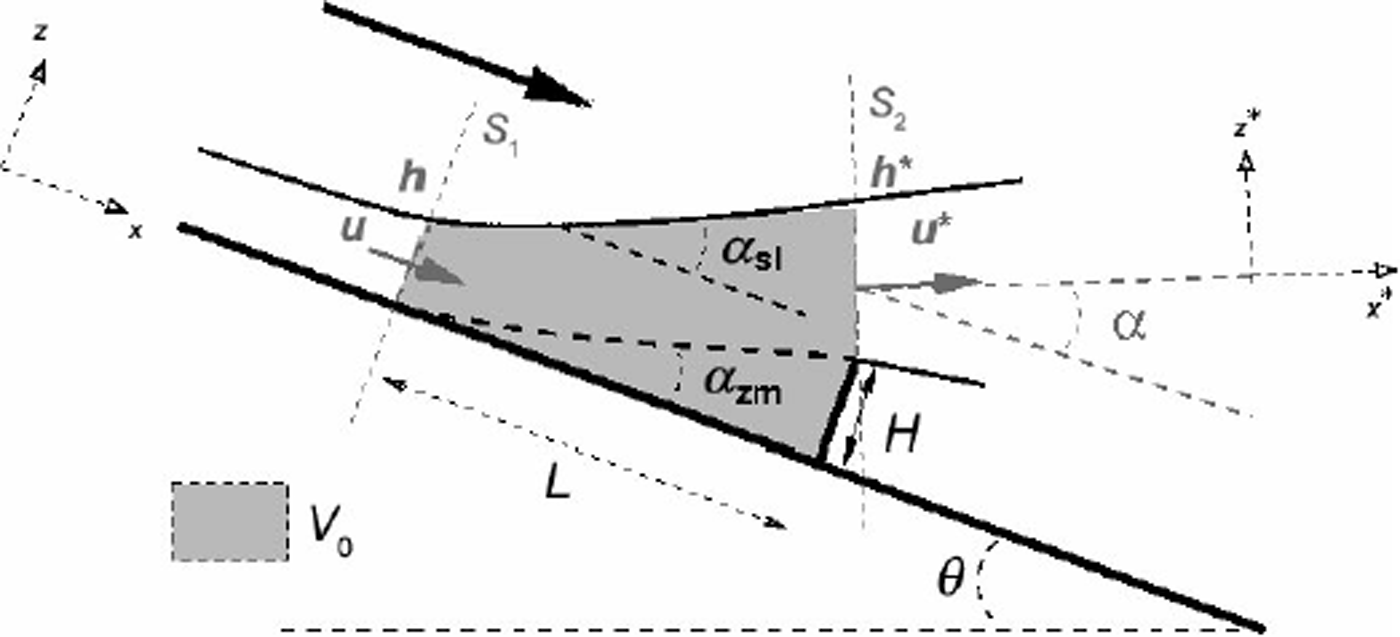
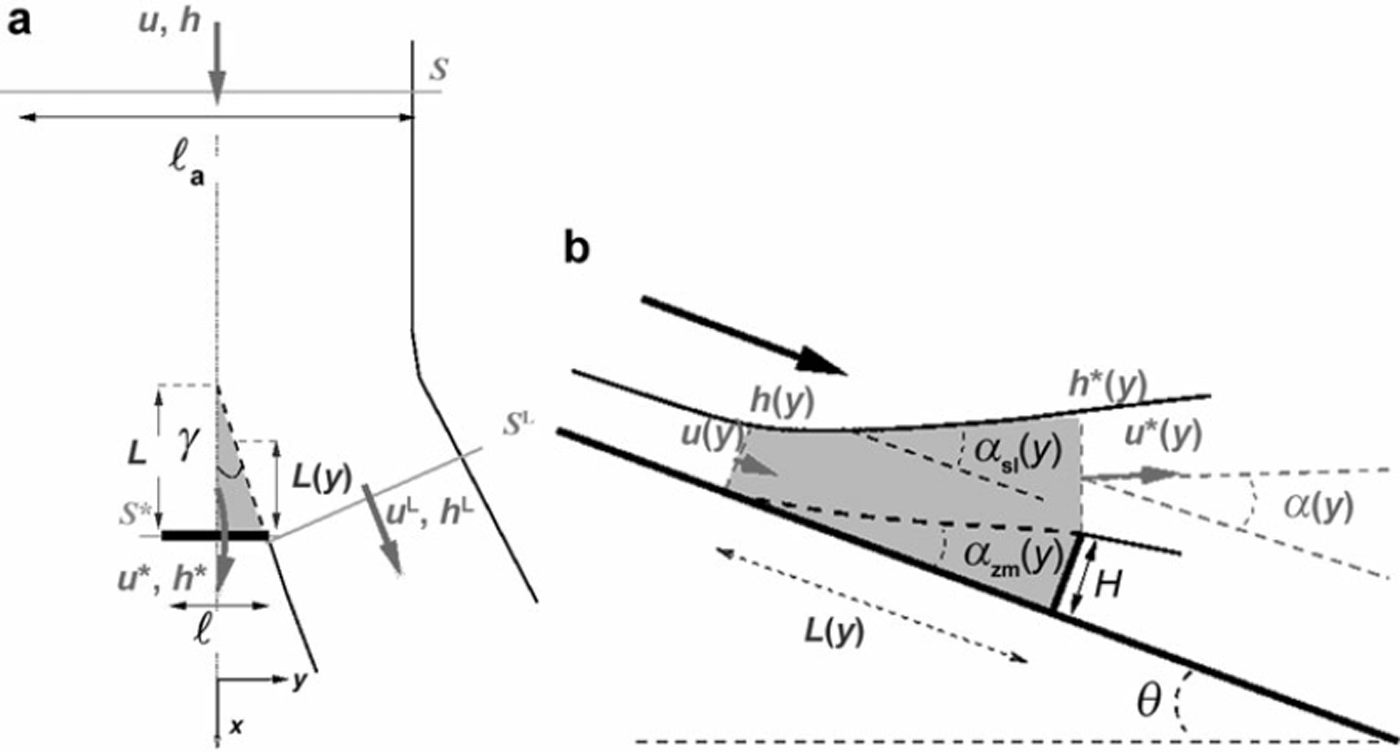
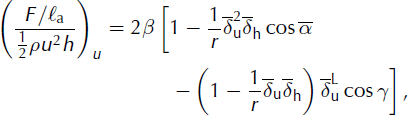
We consider a steady incoming free-surface flow of thickness h, mean velocity u and mean density p down a flat slope with inclination 9, as shown in Figure 1. A nearly triangular stagnant zone is formed upstream of the dam, as shown in Figure 1. Momentum conservation over a control volume, V 0, upstream of the dam (pink area in Fig. 1) allows us to show that, in a steady-flow regime, the resulting force, F, normal to the dam is the sum of four contributions:
Sketch of the flow and control volume, V0 (pink area). H is the obstacle height; αzm is the mean angle of the dead zone; αsl is the mean angle of the free surface above the dead zone; a is the angle between the velocity, ![]() , and the ground; h and u are the thickness and the depth-averaged velocity outside the influence area of the obstacle; h* and u* are the thickness and the depth-averaged velocity of the overflow at the top of the dam (in the x
* direction); and L is the length of the influence zone upstream of the obstacle, assumed to be close to the length of the dead zone.
, and the ground; h and u are the thickness and the depth-averaged velocity outside the influence area of the obstacle; h* and u* are the thickness and the depth-averaged velocity of the overflow at the top of the dam (in the x
* direction); and L is the length of the influence zone upstream of the obstacle, assumed to be close to the length of the dead zone.
V
0 is a volume per unit width and we consider forces per unit width. Fu
is a purely dynamic force resulting from the momentum variation between sections S
1 and S2, defined in Figure 1: Fu
= α(δu
cos α)ρu
2
h where 5u
is the velocity ratio, u*/u, u* is the velocity at the top of the dam, as defined in Figure 1, and a is the deflection angle (i.e. the angle between u* and the ground). The coefficient f3 depends on the shape of the velocity profile and is defined by ![]() .The relative velocity reduction, (u - u*)/u, is simply assumed to be proportional to the deflection angle, a, which gives:
.The relative velocity reduction, (u - u*)/u, is simply assumed to be proportional to the deflection angle, a, which gives:
where K is a velocity-reduction coefficient. Fh is a purely hydrostatic contribution due to the incoming flow undisturbed by the obstacle, ![]() , where k is the earth pressure coefficient classically introduced for gravity-driven flows of granular materials (Reference Savage and HutterSavage and Hutter, 1989) or snow (Reference McClung and MearsMcClung and Mears, 1995; Reference Bartelt, Salm and GruberBartelt and others, 1999). Fw
is the x-axis component of the weight of the control volume, V0: Fw = ρgV0 sin θ. Ff is the basal friction force assumed to be proportional to the y-axis component of the weight of the control volume, V0 (Coulomb friction): Ff = μzmρgV0 cosθ, where μzm
is the friction coefficient between the dead zone and the ground. We discuss μzm
further below.
, where k is the earth pressure coefficient classically introduced for gravity-driven flows of granular materials (Reference Savage and HutterSavage and Hutter, 1989) or snow (Reference McClung and MearsMcClung and Mears, 1995; Reference Bartelt, Salm and GruberBartelt and others, 1999). Fw
is the x-axis component of the weight of the control volume, V0: Fw = ρgV0 sin θ. Ff is the basal friction force assumed to be proportional to the y-axis component of the weight of the control volume, V0 (Coulomb friction): Ff = μzmρgV0 cosθ, where μzm
is the friction coefficient between the dead zone and the ground. We discuss μzm
further below.
The volume, V0, can be calculated from Figure 1 as follows:
where h* is the thickness of the outcoming flow defined in Figure 1, δ h is the depth ratio, h*/h, H is the obstacle height and L is the length of the influence zone upstream of the obstacle. The zone of influence upstream from the dam is defined as the length of the disturbed flow upstream of the dam (flow depth and velocity are not equal to the incoming flow depth, h, and velocity, u) and can be approximated by tan(αzm) = H/L By mass flow rate conservation, the flow depth ratio, δ h, is equal to 1/δu, if we assume that the density is unchanged. The angle a is equal to (αsl + αzm)/2 where αsl is the angle of the free surface inside the control volume, V0. We detail below how we can estimate the angles azm and αsl.
If we neglect the second-order term ![]() in Equation (3), then Equation (1) can be synthesized in terms of the normalized force, F/(0.5ρu2h), versus the incoming Froude number,
in Equation (3), then Equation (1) can be synthesized in terms of the normalized force, F/(0.5ρu2h), versus the incoming Froude number, ![]() :
:
The second-order term ![]() is strictly negligible when h* ≈ L and h* w h, which is almost true when the Froude number is not too high (typically less than 5–10). When the Froude number is more than 5–10, the contribution due to the volume, V0, in the total force is so weak (purely dynamic force) that an error in V0
has no effect on the total resulting force. This analytical model has been initially developed for granular flows (Reference Faug, Beguin and ChanutFaug and others, 2009) for which the parameters (k, β, μzm, K) have been determined, as well as expressions to calculate the angles azm
and αsl, which give the deflection angle, a. Results for granular flows are briefly reported in the next subsection.
is strictly negligible when h* ≈ L and h* w h, which is almost true when the Froude number is not too high (typically less than 5–10). When the Froude number is more than 5–10, the contribution due to the volume, V0, in the total force is so weak (purely dynamic force) that an error in V0
has no effect on the total resulting force. This analytical model has been initially developed for granular flows (Reference Faug, Beguin and ChanutFaug and others, 2009) for which the parameters (k, β, μzm, K) have been determined, as well as expressions to calculate the angles azm
and αsl, which give the deflection angle, a. Results for granular flows are briefly reported in the next subsection.
2.2. Validation of the analytical model for 2 -D granular flows
We performed discrete-particle simulations using a linear damped spring law between spherical particles with a Coulomb failure criterion, in order to simulate 2-D steady granular flows down an inclined slope, as shown in Figure 1 (see details in Reference Faug, Beguin and ChanutFaug and others, 2009). These discrete numerical simulations were based on the molecular-dynamics method introduced by Reference Cundall and StrackCundall and Strack (1979) and widely used to simulate dense granular flows (Reference Ertas, Grest, Halsey, Levine and SilbertErtas and others, 2001; Reference Silbert, Ertas, Grest, Halsey, Levine and PlimptonSilbert and others, 2001; Reference Da Cruz, Emam, Prochnow, Roux and Chevoirda Cruz and others, 2005). The following microscopic parameters were needed to describe the contacts between grains: the normal and tangential stiffnesses, kn and k t; the restitution coefficient, e (linked to the damping coefficient) and the interparticle friction coefficient, p. The influence of these parameters was discussed by Reference Silbert, Ertas, Grest, Halsey, Levine and PlimptonSilbert and others (2001): (1) kn and kt have no effect in the limit of rigid grains (overlap between particles < 1/1000d, where d is the particle diameter); (2) e has little effect except for extreme values e = 0 and e = 1; (3) μ has a greater effect on the results, but its influence becomes weak at low values, typically <0.5. In our simulations, we used the following values: kn = 104 N m∼1, kt = 1/2 k n, e = 0.5 and μ = 0.5 (corresponding to a typical value of the internal friction angle of granular materials). Here we used the commercial code PFC2D (Itasca Consulting: http://www.itasca.com/pfc/index.php). These numerical simulations allowed us to estimate the macroscopic empirical laws to close Equation (4) for the case of granular materials. A first result of the numerical simulations is that the basal friction, μzm, was shown to be constant, equal to tan 9m in, where 9m in is the minimal angle below which no steady flow is possible (stopping of the flow) (Reference PouliquenPouliquen, 1999; GDR Reference MiDiMiDi, 2004). Second, the mean angle of the dead zone with the horizontal, θ – αzm, was shown to be equal to 9m in for all slope inclinations, 9. The length, L, of the influence zone of the obstacle was then assumed to be equal to the length of the stagnant zone and accordingly was defined as: tan(θ – θmin) = H/L. Third, the free-surface angle, αsl, was shown to be a simple linear function of the slope inclination, 9: αsl = aθ + b, where a and b are coefficients depending on the incoming flow regime. We defined 9max as the maximum angle above which uniform flows were not possible. For uniform flows (#min < 9 < Omax), the angle αsl was expressed as:
For non-uniform flows (θ > θ max), the angle αsl was expressed as:
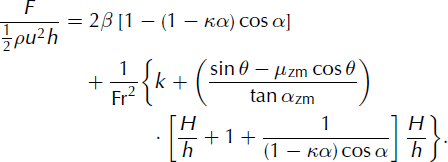
Equation (4) was successfully tested on data from discrete numerical simulations using the following values (Reference Faug, Beguin and ChanutFaug and others, 2009): k = 1, β = 5/4 (for a Bagnold-like velocity profile (GDR Reference MiDiMiDi, 2004)), κ = (1 – e)/(π/2) (where e = 0.5 is the restitution coefficient), 9m in = 14° and θmax = 24° (typical values for 2 -D granular flows (GDR Reference MiDiMiDi, 2004)). The value of K is simply estimated from a purely collisional regime assuming that u*/u scales as e when α = π/2 which gives e = 1 – κ(π/2) according to Equation (2). Figure 2 shows predictions of the analytical model compared to discrete simulations. The predictions of the model are in very good agreement with the discrete simulations, without having introduced any fitting parameter. Note that Equation (4) predicts a force ratio F/(0.5ρu2h) = 2β[1 – (1 – κα) cos a] at high Froude numbers, which gives a value of 2 for a = π/2, compatible with the drag coefficient classically given for a flat obstacle in the inertial regime (high Froude number). Figure 2 also reports the force normalized by the purely hydrostatic force, 12 pgh2 cos 9. It is interesting to consider the asymptotic prediction for this ratio when 9 tends towards 9m in (i.e. the Froude number, Fr, tends to zero). According to the analytical model, this ratio should scale as κ + (H/h) (2 + H/h) (1/ cos 9m in ). With κ = 1 and H/h = 1, this gives a value of 1 + 3/cosθmin. The ratio is then close to 4 (cosθm in ≈ 1), as found in discrete simulations and shown in Figure 2. In section 2.3, we use the analytical model for dry snow and we provide the model parameters adapted to dry snow.
Granular flows: prediction of the model for the rescaled force, F/(0.5ρu2h) and F/(0.5ρgh2 cosθ), vs slope, compared to data from numerical discrete simulations. The following parameters were used: β = 5/4, k = 1, κ = 0.31 (e = 0.5), θm in = 14°, θmax = 24° (Reference Faug, Beguin and ChanutFaug and others, 2009).
2.3. Outlook for 2-D snow flows
Here we use Equation (4) for dry snow flows and we describe the parameters characterizing the behaviour of dry snow. Cemagref has designed a 10 m long and 20 cm wide channel at Col du Lac Blanc, Alpe d’Huez, France, described in detail by Reference Bouchet, Naaim, Ousset, Bellot and CauvardBouchet and others (2003, Reference Bouchet, Naaim, Bellot and Ousset2004). Recent investigations on flows of dense and dry snow (for T < 0°C) down this 10 m long flume showed that snow exhibits some properties similar to those of granular flows (Reference RognonRognon, 2006; Reference Rognon, Chevoir, Bellot, Ousset, Naaim and CoussotRognon and others, 2008). Dry and dense snow is a polydisperse granular material. Similarly to granular flows, there exists a minimum angle below which the flow is stopped, and a maximum angle above which flows accelerate along the channel. Steady and uniform flows are only possible between these two angles. Typical values were derived from experimental investigations at Col du Lac Blanc for dense and dry snow (Reference Rognon, Chevoir, Bellot, Ousset, Naaim and CoussotRognon and others, 2008): 9m in = 33° and θmax = 42°. These angles were obtained in a narrow channel with typical flow depths ∼10cm. Even if these angles are likely to be influenced by wall effects (whose extent is still under discussion), we will use these angles for snow in the following. The flow is divided into two layers: a highly sheared layer of snow grains (typically 1 mm in size) at the base, surmounted by a low shear layer of aggregates (with a maximum size close to the flow depth). This flow configuration results in a typical velocity profile close to velocity profiles obtained from discrete numerical simulations on bi-disperse granular flows. A value of β close to 1 is then reasonable for snow flows.
The friction law for snow flows is still an open question. However, an effective friction law corresponding to a Voellmy model could be fitted to data from the Lac Blanc chute (Reference RognonRognon, 2006): μ = μs + (g/ξ)Fr2. The Voellmy model is classically used in snow-avalanche engineering applications (Reference Bartelt, Salm and GruberBartelt and others, 1999); μs is a dry friction coefficient and ξ is a turbulent coefficient. Both parameters (μs, ξ) were fitted corresponding to various choices. The best fit was obtained for μ = 0.61, i.e. θ s = arctan(/μs) = 31.2°, and ξ = 1050 m s∼2, which are values encountered for snow avalanches (Reference Salm, Burkard and GublerSalm and others, 1990). With respect to the limit angle, 9m in = 33°, which would imply μ = tan 9m in, a value of ξ = 1400 m s∼2 was obtained.
We assume that the empirical laws derived from investigations on granular flows to estimate the free-surface angle, αsl, the dead-zone angle, αzm, and consequently the deflection angle, a, as well as the friction, μzm, still hold for our granular-like snow flows. A value of k = 1 is chosen. Here, K is calculated using a very low value for e that is more compatible with the properties of snow material: e = 0.1 gives K = 0.57.
The angle a is assumed to be equal to:
where αsl is defined by Equations (5) and (6).
In steady and uniform flow conditions, or within a flow regime for which the effect of acceleration terms (time-derivative terms in momentum conservation) can be neglected, we have the following equation corresponding to equilibrium between gravity and friction forces (tan 9 = μ):
Equation (8) allows us to eliminate the slope, 9, in Equations (7) and (4) and to express the rescaled force, F/(0.5ρu2h), as a function of the incoming Froude number, Fr, without the prior knowledge of the slope (information which is included in the Froude number). This raises the question whether we may extrapolate the predictions of our analytical model to slope inclinations less than 0m in in transient conditions towards stopping. The answer to this question is positive if the system is able to reach an equilibrium state for which the assumption tan θ = μ still holds. This assumption seems reasonable in the case of decelerating flows evolving towards stopping (tails of avalanches), for which the effect of time-derivative terms is expected to be negligible. We use this assumption in the following when applying equations established for the steady regime to full-scale avalanche flows.
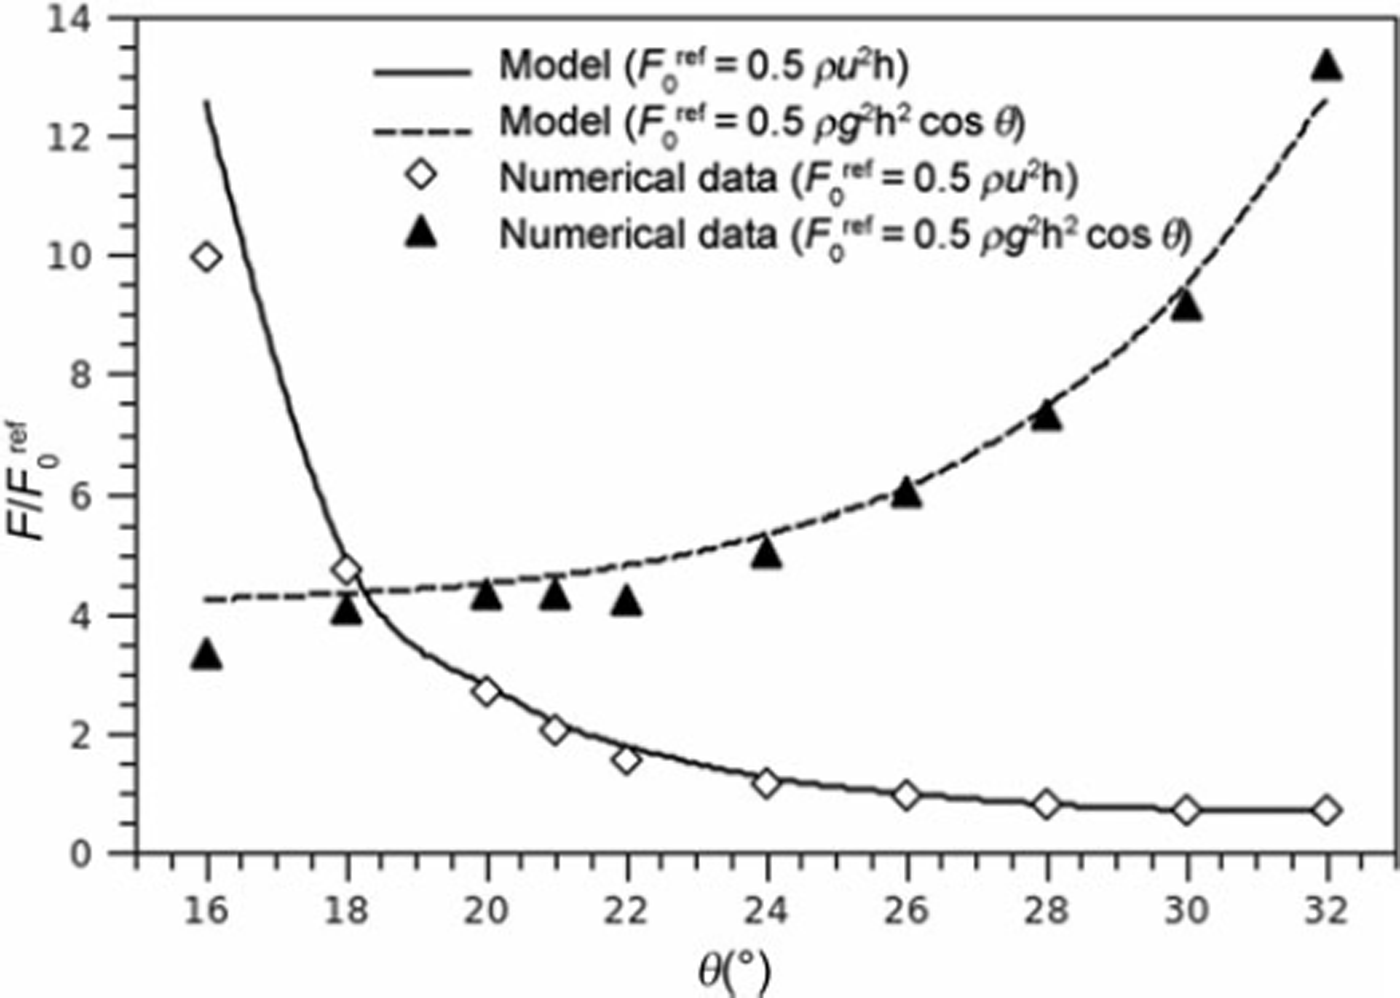
It is important to note that the rescaled force, F/(0.5ρu2h), depends on the ratio H/h. Indeed, attempts to find a relation between this ratio and Fr are meaningful only if H/h remains constant. Figure 3 gives the prediction of the analytical model in terms of the rescaled force vs Fr for different values of H/h, 9m in and θmax, keeping θmax - θmin constant. The curves show that the results are not very sensitive to the value of 9min. The results are, rather, influenced by the geometry corresponding to a varying ratio, H/h. We also show the rescaled force, F/(0.5ρgh2 cos 9), for the same set of parameters to give the prediction of the analytical model at very low Fr in order to highlight the transition towards the hydrostatic regime.
Snow flows. Prediction of the analytical model for the rescaled forces (a) F/(0.5ρu2h) and (b) F/(0.5ρgh2 cosθ) vs the Froude number at different ratios, H/h (0.1, 1 and 5). The following parameters were used:β = 1, k = 1, κ = 0.57 (e = 0.1) and ξ = 1000 ms-2. Predictions are given for two pairs (θm in ,θmax) keeping θmax – θmin = 9°: [33°; 42°] (ps = 0.65) and [10°; 19°] (ps = 0.18).
2.4. Outlook for 3 -D effects with lateral fluxes
2.4.1. General framework equations in 3-D geometry
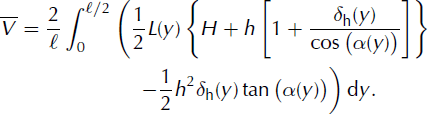
We propose a modification of Equation (4), taking into account 3-D effects corresponding to lateral fluxes and to the modification of the shape of the dead zone by these lateral fluxes. The resulting analytical model is a simplified model that does not take into account the entire effect of flow spreading, which would require fully 3-D numerical models (e.g. Reference Naaim, Naaim-Bouvet, Faug and BouchetNaaim and others, 2004). Here, we consider the thickness, hL, and the depth-averaged velocity, uL, that correspond to the lateral fluxes around the obstacle. Figure 4a gives a top view of the flow configuration in 3-D geometry. A dead zone is formed upstream of the obstacle. The base of the dead zone in the plane (x, y) is triangular and is characterized by angle γ.
(a) Top view of the flow and dead zone (pink area) in 3-D geometry. 7 is the mean angle of the dead zone in the plane (x, y). h and u are the thickness and the depth-averaged velocity outside the zone of influence of the obstacle. ξa is the width of the incoming flow. h* and u* are the thickness and the depth-averaged velocity at the top of the dam. ξ is the width of the obstacle. h L and u L are the mean thickness and the depth-averaged velocity in the flow branch corresponding to lateral fluxes. L is the length of the dead zone at the centre (in y-axis direction) of the obstacle, and L(y) is the length of the dead zone at a given position, y. Note that h*, u*, h L and u L are mean values in sections S* (overflow) and S L (lateral fluxes). Due to the symmetry of the problem, we only show one lateral flux. (b) Side view at a position y of the flow overflowing the obstacle. We use a notation similar to that of the 2-D configuration given in Figure 1, but here the variables depend on the position, y.
Compared to the 2-D geometry, the angles αzm, αsl and a depend on the transverse position, y, along the width, £, of the obstacle as depicted in Figure 4b. As a first approximation, and in the absence of well-documented experimental evidence of the shape of the dead zone, we assume a simple triangular shape for the dead zone in a plane normal to the z axis (Fig. 4a), and the length, L(y), at location y can be expressed as L(y) = c + dy. The boundary conditions require 0 = c + d(ℓ/2) (edge of the obstacle) and H/tan(θ - θmin) = c (centre of the obstacle), which leads to:
The dead-zone angle at position y is αzm(y) = arctan[H/L(y)). The free-surface angle is assumed to vary linearly between π/2 (edge of the obstacle) and the value of αsl in 2-D given by Equations (5) and (6), which gives αsl(y) = 2(π/2 - αsl)(y/ℓ)+ αsl. The mean angle of deflection is then given by α(y) = (αzm(y) + αsl(y))/2. The dependence of these angles on y complicates the calculation of the momentum balance (3-D integrals).
We assume that the basal friction is proportional to the weight in the z-axis direction. The total basal force is caused by the basal friction below the dead zone and the sum of the weights of the dead zone and the fluid above the dead zone: ![]() . Here
. Here ![]() is the control volume in 3-D geometry (between sections S, S* and S
L in Fig. 4):
is the control volume in 3-D geometry (between sections S, S* and S
L in Fig. 4):
Equation (10) can be solved numerically and is work in progress. In section 2.4.2 we propose some rough approximations to simplify the model in order to be able to provide an analytical solution under restrictive conditions.
2.4.2. Simplified analytical model for 3-D snow flows
For the sake of simplicity and to provide an analytical model, we here consider the mean values over the obstacle width:
One parameter is introduced: r = ℓa/ℓ is the ratio between the width of the incoming avalanche flow, ℓa, and the width of the obstacle, £. Similarly to the 2-D case, we can apply the momentum balance over the control volume, ![]() . We simplify the calculation by taking the mean values over the obstacle width (given by Equations (11–13)) out of the 3-D integrals, which gives:
. We simplify the calculation by taking the mean values over the obstacle width (given by Equations (11–13)) out of the 3-D integrals, which gives:
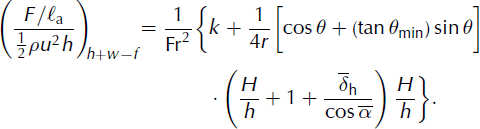
We split the resulting ratio, (F/ℓa)/(0.5ρu2h), into two parts: Equation (14) is the contribution due to the dynamic force and Equation (15) is the contribution of the sum of the incoming pressure force, the weight and the basal friction force. Three parameters have to be quantified: the mean ratio of velocities at the centre, ![]() the mean ratio of the flow depths,
the mean ratio of the flow depths, ![]() and the mean ratio of velocities on both lateral sides,
and the mean ratio of velocities on both lateral sides, ![]() The mean lateral flow depths ratio,
The mean lateral flow depths ratio, ![]() where h
L is the thickness of lateral fluxes, is determined by the conservation of the mass flow rate:
where h
L is the thickness of lateral fluxes, is determined by the conservation of the mass flow rate: ![]() .
.
We use the following assumptions to derive simple empirical laws for these quantities. The mean ratio of velocities at the centre is calculated from the mean angle, ![]() similarly to the 2-D geometry. The mean ratio of flow depths at the centre is assumed to be ∼1, which corresponds to the assumption that the typical size of the overflowing flow is close to the typical size of the undisturbed flow. This is almost true for the case of 2-D granular flows (Reference Faug, Beguin and ChanutFaug and others, 2009) but it remains an assumption for 3-D flows, in the absence of well-documented experimental data. The mean ratio of velocities on both lateral sides is assumed to depend on the mean angle, γ (by analogy with the definition of
similarly to the 2-D geometry. The mean ratio of flow depths at the centre is assumed to be ∼1, which corresponds to the assumption that the typical size of the overflowing flow is close to the typical size of the undisturbed flow. This is almost true for the case of 2-D granular flows (Reference Faug, Beguin and ChanutFaug and others, 2009) but it remains an assumption for 3-D flows, in the absence of well-documented experimental data. The mean ratio of velocities on both lateral sides is assumed to depend on the mean angle, γ (by analogy with the definition of ![]() according to
according to ![]() where we simply assume a value of κ
L equal to K = (1 - e)/(π/2). This latter assumption is argued by the fact that the restitution coefficients are similar for collisions in the planes (x, z) and (x, y). The angle 7 is defined as 7 = arctan [(ℓ/2)/L] (Fig. 5a).
where we simply assume a value of κ
L equal to K = (1 - e)/(π/2). This latter assumption is argued by the fact that the restitution coefficients are similar for collisions in the planes (x, z) and (x, y). The angle 7 is defined as 7 = arctan [(ℓ/2)/L] (Fig. 5a).
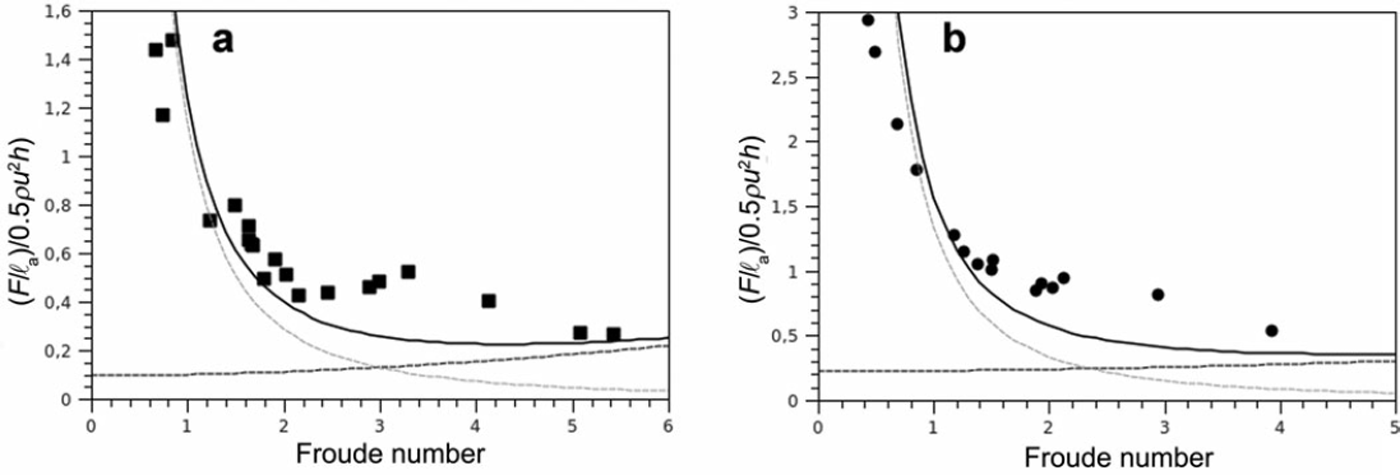
Avalanche flows at Lautaret: predictions of the analytical model compared to the measured data (full black curve). The following parameters were used: β = 1, k = 1, H/h = 1, θm in = 33°, 9max = 42°, ξ = 1000 ms– 2 and κ = κ L = (1 – e)/(π/2) with e = 0.1. The grey dashed curve shows the contribution from the sum of the hydrostatic force, the gravity force and the basal friction force (Equation (1 5)). The black dashed curve shows the contribution from the incoming dynamic force (Equation (14)). (a) 1 5 February 2007 avalanche (Reference Thibert, Baroudi, Limam and Berthet-RambaudThibert and others, 2008) with r = 7. (b) 26 March 2008 avalanche (Baroudi and Thibert, in press) with r = 3.
3. Model Predictions Compared To Full-Scale Field Data
Only few data corresponding to the geometry considered here are available in the literature. Three large-scale avalanche test sites provide some promising data. First, the Lautaret avalanche site in France, particularly the track equipped with a flat obstacle of surface equal to 1 m2 (Reference Thibert, Baroudi, Limam and Berthet-RambaudThibert and others, 2008), is of interest even if the geometry is complex due to lateral fluxes, jet and spreading effects. Second, the Vallée de la Sionne test site in Switzerland provides well-documented data, but only obstacles that are small compared to the width of the avalanche flow (pylons or flat obstacles) are investigated (Reference Sovilla, Schaer and RammerSovilla and others, 2008b,a); these do not fit into the framework of our analytical model. Third, the Ryggfonn test site in Norway is of interest because it is close to the geometry of our analytical model, but it suffers from a lack of flow-depth data, implying an unknown Froude number (Reference Faug, Gauer, Lied and NaaimFaug and others, 2008b) and the dam is not normal to the incident flow.
The full-scale avalanche flows are transient flows that, a priori, are not compatible with our 3-D analytical model, for which we assume a steady state. As discussed above, we assume that the effects of time-derivative terms in the equations of motion are weak, so that a quasi-steady state is reached at each time, t, and that the basal friction, μ is close to tan 9. These assumptions allow us to express 9 as a function of the incoming Froude number, where μ = tan θm in + (g/ξ)Fr2 (Voellmy friction law). Then we can describe variations of (F/ξa)(0.5ρu2h) with Fr.
Here we compare the predictions of the simplified 3-D model to the measurements from the Lautaret test site. One of the avalanche paths is equipped with a 1 m2 plate with pressure sensors. The avalanche site, the instruments and the procedure are presented in detail by Reference Thibert, Baroudi, Limam and Berthet-RambaudThibert and others (2008). In Figure 5, we compare the prediction from Equations (14) and (15) to the data for two avalanches from the Lautaret test site, 15 February 2007 (Reference Thibert, Baroudi, Limam and Berthet-RambaudThibert and others, 2008) and 26 March 2008 (Baroudi and Thibert, in press). Both avalanches were released in cold and dry snow conditions. Furthermore, the time-derivative terms were estimated and shown to be negligible for the 2007 avalanche in the decelerating-flow phase (see Reference Thibert, Baroudi, Limam and Berthet-RambaudThibert and others, 2008, fig. 11). We only consider data obtained in the decelerating-flow phase of the avalanche. The following set of parameters was used: β = 1, k = 1, H/h = 1, θm in = 3°, θmax = 42°, ξ = 1000 ms – 2 and κ = κ L = (1 – e)/(π/2) with e = 0.1. We used r = 7 for the 15 February 2007 avalanche and r = 3 for the 26 March 2008 avalanche. These values of r are compatible with field observations from films taken of the avalanches. The 2007 avalanche was substantially larger than the 2008 avalanche. In spite of many assumptions, the prediction of our 3-D simplified model is in good agreement with the field data (full black curve in Fig. 5). We plot both contributions to the total force in Figure 5: one contribution from the dynamic force (Equation (14)) and the other contribution (Equation (15)) corresponding to the sum of the hydrostatic force, the gravity force and the basal friction. The graphs clearly show that the increase of the total rescaled force, (F/ℓa)/(0.5ρu2h), at low values of the Froude number (Fr ≈ 1) is mainly due to the contribution corresponding to the sum of the hydrostatic force, the gravity force and the basal friction. Note that the increase of the rescaled force, (F/ℓ a)/(0.5ρu2h), does not mean that the corresponding force, F, becomes the design force. For both avalanches investigated here, the force is maximal when the Froude number is higher (close to 4–5) and, in an engineering project, this maximal force would be the design force. By these graphs we demonstrate that when the avalanche comes to rest, the contributions from forces due to hydrostatic effect, weight and friction become dominant. This effect is particularly important in the run-out areas of snow avalanches. The simplified analytical model presented here has to be validated with more data. However, it can provide the ingredients for a practically applicable approximation of the total force exerted on obstacles by snow avalanches. When the design reference Froude number is low and large stagnant zones are likely to be formed upstream of the protection structure it is crucial to check whether the resulting force, F, calculated from the proposed model is greater than the force calculated using traditional engineering methods (Reference Salm, Burkard and GublerSalm and others, 1990).
4. Discussion and Conclusion
We have presented an analytical model to estimate the force on flat obstacles when a stagnant zone is formed upstream of the obstacle. We first presented a 2-D analytical model describing gravity-driven flows overflowing a wall normal to the ground. Three important parameters were needed to close the model: the friction, μzm, between the dead zone and the ground, the coefficient of velocity reduction, κ, and the angle of the free-surface upstream of the wall, a. The analytical 2-D model and the empirical laws proposed to quantify these parameters were validated by discrete-particle simulations of granular flows down an inclined slope. We provided the parameters to use this analytical model for 2-D flows of dry snow, which allowed us to quantify the effect of the stagnant zone on the resulting force, particularly at low incoming Froude numbers, and to provide a tool to estimate the force on large catching dams with no (or little) lateral overflows. This 2-D analytical model was then extended to a 3-D configuration in order to predict the force when lateral fluxes occur. The analytical model was given for steady-flow conditions but we believe that it is also suitable for transient flows for which the effect of time-derivative terms can be neglected. This is typically the case for snow avalanches in the decelerating phase (before the final standstill). We compared the prediction of our analytical model to the field data available at Lautaret. We only used the data in the quasi-steady state corresponding to the decelerating phase (Reference Thibert, Baroudi, Limam and Berthet-RambaudThibert and others, 2008, fig. 11). The analytical predictions are in good agreement with field observations within the experimental uncertainty. More validation of the analytical model is needed (not only for the force, but also for geometrical data, such as the deflecting angles and the shape of the stagnant zone). Let us stress the fact that the time dependency of avalanche flows has not been considered in this paper, which means that our proposed model is not able to predict acting transient forces on obstacles induced by the avalanche front. Further work is needed to analyse these transient forces and the related fluctuations. Furthermore, a sensitivity analysis of the model with respect to all the parameters needs to be performed before we can propose that the sketched methodology serve as conceptional base for a practioners’ recipe to estimate design forces for structures that can be hit by avalanches. The parameter combinations for various avalanche types, similar to those of Reference Salm, Burkard and GublerSalm and others (1990) for the estimation of avalanche run-out lengths and velocities with the Voellmy friction law, could be used to carry out this task. However, we recommend investigating the force at low Froude numbers, when stagnant-zone mechanisms are likely to occur, at a more fundamental level.
5. Acknowledgements
We thank H. Bellot, F. Ousset and X. Ravanat for their work at the Lautaret test site. Thanks also to D. Bertrand who helped in performing the numerical simulations with the commercial code PFC2D (Itasca Consulting: http://www.itasca.com/pfc/index.php).


