
The Head Start program was created as part of President Lyndon B. Johnson’s War on Poverty to provide educational, medical, dental, and mental health services to young children and families from economically disadvantaged backgrounds (Administration for Children and Families, 2012). Head Start began in the summer of 1965 as an 8-week program for children who were about to enter public schools, and over the past 50 years, the program has expanded the scope and intensity of its services (Styfco & Zigler, Reference Styfco, Zigler, Reynolds and Wang2003). Currently, Head Start is the largest provider of publicly-funded, center-based early childhood education (ECE) programs in the United States, serving nearly 1 million 3-year-olds and 4-year-olds each year (Barnett et al., Reference Barnett, Carolan, Squires, Clark Brown and Horowitz2015).
In 1998, reauthorization of federal funding for Head Start by the US Congress came with a mandate that the US Department of Health and Human Services, the federal agency that administers the program, determine on a national level the impacts of Head Start on the children and families it serves (US Department of Health and Human Services, January 2010). An advisory committee on Head Start Research and Evaluation recommended a framework for studying the impacts of the program that included the following features: an experimental design involving random assignment of children to Head Start and Control groups; a nationally representative sample of Head Start classrooms; multiple child and parent outcomes; and assessments of these outcomes collected at multiple points in time (Advisory Committee on Head Start Research and Evaluation, 1999). These recommendations became the blueprint for the Head Start Impact Study (HSIS; Puma, Bell, Shapiro et al., Reference Puma, Bell and Shapiro2001).
The HSIS began in fall 2002 within a nationally representative sample of 84 Head Start grantee/delegate agencies and included newly entering 3- and 4-year-old children. Children who signed up to attend Head Start centers within these grantees were randomly assigned – separately within each age group – to the Head Start condition that was offered access to the program or the Control condition that was not offered access to the program. Results from this study offer two conclusions about the impactsFootnote 1 of Head Start: (1) offering children access to Head Start had positive impacts on their academic skills (e.g., literacy, math, language) at the end of the Head Start year, and (2) these early advantages were no longer evident for most outcomes at the end of kindergarten (Puma, Bell, Cook et al., Reference Puma, Bell and Cook2012).
This result, suggesting a “drop-off” or “fade-out” of the impacts of offering access to Head Start, may come as no surprise to some. A meta-analysis described by Duncan (Reference Duncan2015) included 67 studies of the impacts of ECE programs published between 1960 and 2007. Results indicated that the average post-program impacts on academic outcomes had an effect size of 0.23, which diminished to 0.10 on follow-up assessments conducted within one year after the program ended. These overall effects are similar in magnitude to what was found for academic outcomes in the Head Start Impact Study at the end of the Head Start year and the end of the kindergarten year, respectively (Puma, et al., Reference Puma, Bell and Cook2012). Nonetheless, results indicating a drop-off of the impacts of Head Start and other ECE programs are troubling to many in the ECE community – policymakers, program administrators, and teachers – whose investments of resources to implement, expand, regulate, monitor, and improve ECE programs come with expectations that these investments will produce long-term benefits to the children and families served, which return economic benefits to society. As evident by the title of and topics within this edited volume, this issue of sustaining the gains of early childhood programs on children’s long-term development is a foremost concern on the minds of ECE researchers, as well.
However, research to address questions about the maintenance of impacts of Head Start has been impeded by some conceptual difficulties attributed to the multiple processes that impact children’s long-term development. More specifically, children’s development not only depends upon the nature and quality of their experiences within Head Start and kindergarten classrooms, but there also may be patterns of experiences across these grades that contribute to children’s long-term development. The purposes of this chapter are to: (1) elucidate some of the classroom processes affecting children’s development from the beginning of Head Start until the end of kindergarten; (2) generate three sets of hypotheses about specific patterns of experiences across Head Start and kindergarten classrooms that contribute to children’s long-term development; and (3) test one of these hypotheses – that consistent instructional practices across Head Start and kindergarten classrooms is positively associated with children’s development during kindergarten.
Classroom Processes Affecting Children’s Development from Head Start through Kindergarten
Understanding children’s development from the beginning of Head Start at age 4 until the end of kindergarten is a complicated endeavor, for at least three reasons. First, multiple factors affecting children’s development during this time must be considered, including attributes of the child him- or herself, the multiple settings within which the child spends time (e.g., home, Head Start classrooms, kindergarten classrooms), and the multiple administrative agencies (Head Start, state and district K–12) that support the home and classroom settings. Second, the child, settings, and agencies are all dynamic, such that they are each changing over the course of this time. This includes changes occurring within the child, and, in particular, the rapid neurological development in the prefrontal cortex that helps to facilitate the child’s capacities to regulate his or her emotion and attention (Durston & Casey, Reference Durston and Casey2006); changes in their classroom experiences (i.e., moving from Head Start to kindergarten); and changes in administrative agencies that support these classrooms (e.g., Head Start to federal, state and local Departments of Education).
Third, there are multiple processes that contribute to children’s development of academic and social-emotional skills during these two years. One process involves the quality of children’s interactions within their homes, ECE classrooms, and other primary settings wherein the child spends substantial time and has defined roles and relationships. For example, ecological and social interaction theories of development (e.g., Bronfenbrenner & Morris, Reference Bronfenbrenner and Morris2006; Vygotsky, Reference Vygotsky1962) applied to preschool classrooms (Mashburn & Pianta, Reference Mashburn, Pianta, Reynolds, Rolnick, Englund and Temple2010) offer explanations for how children’s development occurs within Head Start and kindergarten classrooms. Namely, learning and development occurs through the child’s back-and-forth interactions with adults, peers, and learning materials that occur on a regular basis and over extended periods of time, are appropriate to the child’s current ability, and become progressively more complex. More specifically, the quality of social interactions in classrooms that impact young children’s development of academic and social-emotional has been described as comprising three domains: emotionally supportive interactions, well-organized interactions, and instructionally supportive interactions (Hamre et al., Reference Hamre, Pianta and Downer2013). There is empirical support that that more emotionally supportive classroom interactions (e.g., positive climate, sensitivity toward children’s emotional needs) were positively associated with children’s development of social-emotional skills and more instructionally supportive classroom interactions (e.g., language modeling, concept development) were positively associated with children’s development of literacy, math and language skills during the preschool year (Mashburn et al., Reference Mashburn, Pianta and Hamre2008).
Processes affecting children’s development from Head Start through kindergarten also involve the nature of the instructional practices that children experience within their classrooms. Instructional practices vary across ECE classrooms with regard to how much time is spent on academic instruction (e.g., math and literacy instruction), child-led activities (e.g., free-choice centers) and teacher-directed whole group activities (e.g., book readings, group lessons), and there is some empirical evidence suggesting that specific instructional practices in ECE classrooms are positively associated with children’s development. For example, Ball and Blachman (Reference Ball and Blachman1991) found that kindergarten instructional practices focused on phonemic segmentation and letter-sound combinations were positively associated with children’s reading and spelling outcomes. Further, Claessens, Engel, and Curran (Reference Claessens, Engel and Curran2014) found that greater exposure to advanced math and reading instruction in kindergarten was positively associated with academic skills; however, frequency of basic skills instruction was not associated with children’s development.
In addition to those processes within classrooms described above, children’s development from Head Start through the end of kindergarten is also affected by their patterns of experiences as they transition across Head Start and kindergarten classrooms. The child’s transition from a Head Start to a kindergarten classroom may present abrupt shifts in the quality of their interactions with teachers, peers, and learning materials, and in the types of instructional experiences with regard to how classroom activities are structured and the amount of time spent on direct academic instruction. This shift in children’s instructional experiences may be particularly abrupt today, as accountability pressure from the K–12 systems have trickled down to kindergarten classrooms; the result of which is “a heightened focus on academic skills and a reduction in opportunities for play” (Bassok, Latham & Rorem, Reference Bassok, Latham and Rorem2015). As a result, the transition from Head Start to kindergarten very likely involves a shift from play-focused, child-centered experiences to more academically focused, adult-directed experiences, and for some children, this shift is more pronounced than for other children.
In theory, these shifts in experiences from Head Start to kindergarten classrooms may have implications for children’s long-term development. For example, Dewey (Reference Dewey1938) introduced the concept of continuity of experience, which posits that acquiring new knowledge involves a process of taking current knowledge from previous learning experiences and modifying it based on current experiences. Thus, the learner’s prior experiences and current capacities are the starting place for developing new knowledge, and for teaching to be effective, it must build upon those prior experiences and current capacities to make learning more meaningful and effective (Dewey, Reference Dewey1938). Similarly, in this volume, Stipek (Reference Stipek2015) discusses how and why continuity, and more specifically, the alignment of policy and classroom practices across grades, promotes children’s development. From both of these perspectives, children’s development is not only affected by the nature of their instructional experiences and quality of interactions within classrooms; children’s development is also affected by the accumulation of experiences across grades, and more specifically, the extent to which the child’s current learning experiences are attuned to the child’s capabilities and are consistent with their prior experiences. As such, we postulate that the fade-out of impacts of Head Start and other early learning programs may be due, in part, to a mis-alignment in between the systems of Head Start and kindergarten.
Despite the theoretical warrant for the importance of considering children’s experiences across Head Start and kindergarten classrooms, there is very little empirical research that examines if and how specific patterns of experiences across grades affect children’s long-term development. In the next section, we briefly present three sets of hypotheses – Consistency, Developmentally Sequenced, and High Quality – regarding specific patterns of instructional experiences across Head Start and kindergarten classrooms that we postulate are positively associated with children’s long-term development.
Hypotheses about Long-Term Development of Children Who Attended Head Start
Consistency Hypothesis.
Developmental and education theory (e.g., Bronfenbrenner & Morris, Reference Bronfenbrenner and Morris2006; Dewey, Reference Dewey1938) and research (e.g., Ansari & Winsler, Reference Ansari and Winsler2013; Curby, Brock, & Hamre, Reference Curby, Brock and Hamre2013) indicate that children’s development is affected by the degree of stability and consistency in their experiences across time. This suggests that when a child transitions from a Head Start classroom into a kindergarten classroom, the child will more readily adapt to and succeed within kindergarten if his or her experiences in this new setting build upon his or her prior experiences and current capabilities. In contrast, if the child’s instructional experiences in kindergarten do not have this continuity with the child’s prior experiences in Head Start or their current capabilities, then the child may experience difficulty adjusting to these new demands. This may be evident by the child’s difficulties regulating his or her attention and behavior in kindergarten classrooms, which has implications for the child’s academic and social-emotional development during kindergarten. More specifically, we hypothesize that consistency in children’s instructional experiences (i.e., focus on academic instruction, structure of activities) across Head Start and kindergarten classrooms positively impacts children’s development during kindergarten.
Developmentally Sequenced Hypothesis.
Social-interaction theories of cognitive development (e.g., Vygotsky, Reference Vygotsky1962) indicate that learning and development occur through interactions that are suited to the child’s current ability and that become progressively more complex, extending the child’s knowledge to a new level that is within their “zone of proximal development.” This suggests that when instructional experiences are properly suited to the child’s ability, there is a greater likelihood that the instruction will build upon the child’s current base of knowledge. However, instruction that is not aligned with his or her ability – being either too simple or too advanced for the child’s current capability – will not promote academic development.
From this theoretical perspective, we hypothesize the following regarding the amount of time children experience basic academic instruction in Head Start and kindergarten classrooms. Kindergarten classrooms that involve more frequent direct instruction of basic academic skills will have positive effects on development among children who have experienced less of this sort of instruction previously and presumably have not achieved these basic skills; as such, this instruction is more appropriate to the child’s developmental level and likely to result in new knowledge. In contrast, among children who have previously experienced greater amounts of basic instruction in Head Start and presumably achieved levels of proficiency of these skills, frequent academic instruction in kindergarten is redundant and unlikely to result in any new literacy and math skills. Interestingly, this hypothesis competes with the Consistency Hypotheses regarding the optimal amounts of academic instruction in Head Start and kindergarten. The Consistency Hypothesis posits that children benefit when the amounts of academic instruction are consistent across classrooms, whereas the Developmentally-Sequenced Hypothesis posits some optimal patterns (low basic skills instruction in Head Start to high basic skills instruction in kindergarten) and sub-optimal patterns (high basic skills instruction in Head Start to high basic skills instruction in kindergarten).
High Quality Hypothesis.
As discussed earlier, the quality of children’s social interactions with teachers and peers in classrooms, including the quality of emotional support, classroom organization, and instructional support (Hamre et al., Reference Hamre, Pianta and Downer2013), have implications for children’s development within each grade. Further, we hypothesize that as children move from Head Start to kindergarten classrooms, there is one optimal pattern of experiences related to the quality of social interactions across grades – moving from a high-quality Head Start classroom to a high-quality kindergarten classroom – and a single worst pattern of experiences – moving from a low-quality Head Start classroom to a low-quality kindergarten classroom.
In sum, children may experience profound shifts in their experiences when they move from a Head Start classroom to a kindergarten classroom. We hypothesize that there are some specific patterns of experiences across Head Start and kindergarten classrooms that may be optimal for promoting children’s long-term outcomes – when instructional practices are consistent, when academic instruction builds upon the child’s current knowledge base, and when social interactions are emotionally supportive, well organized, and instructionally supportive across both Head Start and kindergarten classrooms. In the next section, we conduct an empirical investigation of the Consistency Hypothesis by testing the extent to which consistent instructional practices across Head Start and kindergarten classrooms are associated with children’s development of academic and social-emotional skills.
More specifically, we address the following research question among the sub-sample of children in the HSIS who attended both Head Start and kindergarten classrooms: Do the effects of kindergarten instructional practices on children’s academic and social-emotional development during kindergarten depend upon the instructional practices children experienced in Head Start? We explore this question for two dimensions of instructional practices: (1) focus on academic instruction (i.e., time spent on literacy/language activities and math activities), and (2) structure of activities (i.e., time spent doing child-chosen activities and whole-group activities). We hypothesize that greater consistency in the degree to which instruction is focused on academic skills (time spent doing literacy/language activities and math activities) across Head Start and kindergarten classrooms will positively impact children’s development of literacy/language and math skills, respectively; and greater consistency in how activities are structured (amount of time spent doing child-chosen activities, whole group activities) across Head Start and kindergarten classrooms will positively impact children’s development of social-emotional skills during kindergarten.
Method
Participants
Participants in this study were 975 children from the 4-year-old cohort of the Head Start Impact Study (Puma et al., Reference Puma, Bell and Cook2012). This included any child who (1) attended Head Start regardless of whether they were assigned to the Head Start or the Control condition (recall that 14% of children randomly assigned to the Control group attended a Head Start program) and (2) had complete data for classroom experience measures in Head Start and kindergarten. Refer to the HSIS Technical Manual (Puma et al., Reference Puma, Bell, Cook and Heid2010) for details about the sampling and recruitment of this nationally representative sample of Head Start grantees, children, and families, and for more detailed information about the measures, which are briefly described next.
Measures
Child, family and school characteristics.
Parents were asked to complete a survey during the fall of children’s Head Start year, which included questions about their child’s race/ethnicity, primary language spoken at home, gender, and age, as well as the mother’s education level, whether she was a teenager when she had the child, whether the child lives with both biological parents, whether the school is located in an urban setting, and whether the child attended a full-day kindergarten. Table 6.1 presents characteristics of children, families, and schools in the study, which are used as covariates in analyses that address the primary research questions about the consistency of classroom instructional practices.
Table 6.1 Demographic characteristics of children, families, and schools (n = 975)
| Frequency | Percent | ||
|---|---|---|---|
| Child Gender | |||
| Male | 496 | 51% | |
| Female | 479 | 49% | |
| Child Race | |||
| White/other | 406 | 42% | |
| Black | 329 | 34% | |
| Hispanic | 240 | 25% | |
| HSIS Study Condition | |||
| Treatment | 563 | 57% | |
| Control | 412 | 42% | |
| Mother’s Education Status | |||
| Less than high school | 320 | 33% | |
| High school diploma | 376 | 39% | |
| Beyond high school | 279 | 29% | |
| Mother’s Marital Status | |||
| Never married | 425 | 44% | |
| Currently married | 381 | 39% | |
| Separated/Divorced/Widowed | 169 | 17% | |
| Teen Mother | |||
| Yes | 158 | 16% | |
| Urbanicity | |||
| Urban | 808 | 83% | |
| Not urban | 167 | 17% | |
| Length of Head Start Day | |||
| Full day | 643 | 66% | |
| Not full day | 332 | 34% | |
Instructional practices in Head Start and Kindergarten classrooms.
To assess two dimensions of instructional practices that children experienced in Head Start and kindergarten classrooms – focus on academic instruction and structure of activities – teachers completed self-report measures of the amount of time children experienced different types of instructional practices in their classrooms during the year. Head Start teachers completed these surveys at the end of the Head Start year, and kindergarten teachers completed the surveys at the end of the kindergarten year. The amount of time spent on literacy/language instruction was assessed by asking teachers to respond to 12 questions that began with the following stem: “How often do you or someone else do each of the following reading and language activities with the children in your classroom?” Twelve different language and literacy practices were presented (e.g., “work on learning the names of the letters,” “practice the sounds that letters make,” “retell or make up stories”), and teachers responded on a 1 (never) to 6 (every day) Likert-type rating scale. Overall, the scale for the 12-item measure achieved adequate internal consistency reliability (Cronbach’s alpha) among Head Start (α = 0.810) and kindergarten teachers (α = 0.708). To assess the amount of time spent on mathematics instruction, teachers responded to the question, “How often do children in your class do each of the following activities?” for each of eight math activities (e.g., “count out loud,” “play math games,” “use music to understand math ideas”). Teachers responded on a 1 (never) to 6 (every day) Likert-type rating scale, and overall, this scale showed adequate internal consistency reliability (Head Start: α = 0.812; kindergarten: α = 0.792).
Teachers also reported about two aspects related to how they structure activities in Head Start and kindergarten classrooms. More specifically, Teachers responded to the question, “How much time daily did children in your classroom spend on the following activities?: the amount of time spent in whole-group activities and the amount of time spent on child-chosen activities.” Teachers responded on a 1 (no time) to 6 (five hours or more) Likert-type scale for the amount of time “child chooses activities” and the amount of time “adult directs whole class/group activities.”
Table 6.2 presents descriptive statistics and correlations within year and across years for the four measures of instructional practices in Head Start and kindergarten classrooms. On average, teachers reported that children experienced a high amount of literacy/language and math instruction in both Head Start and kindergarten – approximately 3–4 times per week – and there was considerable variation in the amount of time spent on literacy/language instruction, ranging from once or twice per week to every day. As was expected, there was an increase, on average, in the amount of time children spent on literacy/language instruction from Head Start (M = 4.79, SD = 0.72) to kindergarten (M = 5.02, SD = 0.55); however, it was not expected that the amount of time children spent on math instruction would decrease from Head Start (M = 4.99, SD = 0.99) to kindergarten (M = 4.77, SD = 0.73).
Table 6.2 Descriptive statistics for and correlations between instructional practices in Head Start and kindergarten (n = 975)
| M | SD | n | 1 | 2 | 3 | 4 | 5 | 6 | 7 | 8 | |
|---|---|---|---|---|---|---|---|---|---|---|---|
| 1-HS-Time Spent on Lit/Lang Activities1 | 4.79 | 0.72 | 975 | – | |||||||
| 2-HS-Time Spent on Math Activities1 | 4.99 | 0.75 | 975 | .65 | – | ||||||
| 3-HS-Time Spent on Child-Chosen Activities2 | 3.45 | 1.03 | 975 | .15 | .12 | – | |||||
| 4-HS-Time Spent on Whole Group Activities2 | 2.60 | 0.91 | 975 | .08 | .01 | .12 | – | ||||
| 5-KG-Time Spent on Lit/Lang Activities1 | 5.02 | 0.55 | 975 | .03 | .01 | –.01 | .04 | – | |||
| 6-KG-Time Spent on Math Activities1 | 4.77 | 0.73 | 975 | .04 | .01 | .01 | .06 | .44 | – | ||
| 7-KG-Time Spent on Child-Chosen Activities2 | 3.04 | 1.08 | 975 | –.01 | –.03 | .01 | .01 | .03 | .35 | – | |
| 8-KG-Time Spent on Whole Group Activities2 | 3.10 | 1.12 | 975 | –.04 | –.03 | –.02 | .04 | .17 | –.20 | –.24 | – |
1 1=never, 2=once a month or less, 3=2–3 times per month, 4=once or twice per week, 5=3–4 times per week, 6=every day.
2 1=no time, 2=30 minutes or less, 3=1 hour, 4=2 hours, 5=3–4 hours, 6=5+ hours
Head Start and kindergarten teachers reported that children experienced, on average, over one hour of child-chosen activities every day, and there was an expected decrease in the amount of time devoted to child-chosen activities from Head Start (M = 3.45, SD = 1.03) to kindergarten (M = 3.04, SD = 1.08). Similarly, the amount of time children spent in adult-directed whole-group activities increased from between 30 minutes and 1 hour in Head Start (M = 2.60, SD = 0.91) to over an hour in kindergarten (M = 3.10, SD = 1.12). Within Head Start and kindergarten classrooms, the correlation between the frequency of literacy/language instruction and math instruction was 0.65 and 0.44, respectively (see Table 6.2). Interestingly, the correlations between instructional experiences within Head Start and within kindergarten were very small (ranging from −0.04 to 0.06), illustrating the wide-ranging and idiosyncratic patterns of instructional experiences that children have across Head Start and kindergarten classrooms.
Children’s academic and social-emotional skills.
To assess children’s development of academic and social-emotional skills during kindergarten, a variety of methods (e.g., direct assessments, teacher-reports, and parent-report) were used at the end of Head Start and again at the end of kindergarten. Children’s academic skills were assessed using the following direct assessments. An adapted version of the Peabody Picture Vocabulary Test (PPVT; Dunn, Dunn, & Dunn, Reference Dunn, Dunn and Dunn1997) assessed children’s Receptive Language skills. In this test, assessors orally present a stimulus word to children, who must choose among four pictures to correctly identify the picture that matches the stimulus word. An adaptive, shortened version of the traditional PPVT was created via Item Response Theory for this study (see HSIS technical report, Puma et al., Reference Puma, Bell, Cook and Heid2010). For this version of the test, all children completed 20 core items, after which children whose responses were close to the ceiling (17 items correct or more) or floor (11 items correct or fewer) completed an additional 10 items. To score the test, the HSIS used Marginal Maximum Likelihood (MML) estimation to estimate children’s true ability score from a) their actual score on the test, and b) a “prior score” that estimated what a child’s ability score might be in the absence of any data, in order to reduce error variance associated with the test’s reliability (see HSIS technical report for details). After estimation, children’s scores were standardized within age cohorts to have a mean of 100 and a standard deviation of 15.
Children’s Literacy skills were assessed using the Letter-Word Identification subtest of the Woodcock–Johnson III test (Woodcock & Johnson, Reference Woodcock and Johnson1990). Children are asked to recognize and name letters and words, and their raw scores were converted to standardized scores (M=100; SD=15) that assess children’s performance relative to others in their age group. Children’s Math skills were assessed using the Applied Problems subtest of the Woodcock–Johnson III test. In this measure, children complete a series of basic mathematical problems, including items tapping children’s ability to use basic mathematical operations (e.g., adding and subtracting) as well as other basic math skills (e.g., using a thermometer). Both scales have been positively linked to other measures of academic achievement in other samples (Woodcock & Johnson, Reference Woodcock and Johnson1990).
At the end of Head Start, and again at the end of kindergarten, parents and teachers completed surveys about their child’s social-emotional skills at home and in the classroom, respectively. To assess children’s Social Skills and Positive Approaches to Learning, parents completed a seven-item survey about their child’s cooperative and empathetic behavior (e.g., “Comforts or helps others”), openness to new skills and challenges (e.g., “Likes to try new things”), and attitudes toward learning (e.g., “Enjoys learning”). Parents rated each item on a 0 (“not true”) to 2 (“very true”) scale. As has been found in prior studies, the score distributions on this scale were skewed such that most responses fell toward the top of the scale, indicating that most parents rate their children as high on all of the scale items; however, previous studies have found strong, predictive relations between this scale and other social-emotional outcomes as well as other child and family characteristics (Puma et al., Reference Puma, Bell, Cook and Heid2010).
Parents were also asked to rate their children’s Problem Behaviors using a fourteen-item scale. The items on this scale tapped children’s aggressive behaviors (e.g., “Hits and fights with others”), inattentive and hyperactive behaviors (e.g., “Can’t concentrate; can’t pay attention for long”), and withdrawn behaviors (e.g., “Is unhappy, sad, or depressed”). Parents rated each item on a scale ranging from 0 (“not true”) to 2 (“very true”). The overall scale ranged from 0 to 28, with lower scores representing fewer problem behaviors and higher scores representing more problem behaviors.
Children’s Classroom Aggression was measured using the aggression subscale of the Adjustment Scales for Preschool Intervention (ASPI; Lutz, Fantuzzo & McDermott, Reference Lutz, Fantuzzo and McDermott2002). In this scale, teachers are asked about each child’s behaviors in a variety of common classroom situations. For example, teachers are presented with a classroom scenario (e.g., “How does this child cope with learning tasks?”) and are asked to select any behavior that the student has engaged in for the past two months from a menu of options representing both typical and problem behaviors (e.g., the possible answers for the example scenario include “has a happy-go-lucky attitude to every problem,” “charges in without taking time to think or following instructions,” “approaches new tasks with caution, but tries,” “won’t even attempt it if he/she senses a difficulty,” “likes the challenge of something difficult,” and “cannot work up the energy to face anything new”). Teachers were able to select multiple child behaviors for each of 24 different scenarios, each with 6 possible responses. Of the 144 possible child behaviors identified through this scale, 22 items represented behaviors indicative of aggression (e.g., “starts fights in free play”; “has made unprovoked attacks on other children”). Raw scores were calculated by adding together the number of items checked for each student that loaded onto the aggression factor, and these raw scores were converted to t-scores based on the original ASPI standardization sample. Table 6.3 presents descriptive statistics for children’s academic skills (receptive language, literacy, math) and children’s social-emotional skills (social skills and approaches to learning, problem behaviors, and aggression) at the end of Head Start and at the end of kindergarten.
Table 6.3 Descriptive statistics for children’s academic and social-emotional skills in Head Start and kindergarten (n = 975)
| End of Head Start | End of Kindergarten | |||||
|---|---|---|---|---|---|---|
| Mean | SD | n | Mean | SD | n | |
| Receptive Language (PPVT) | 91.5 | 10.2 | 801 | 92.6 | 12.3 | 757 |
| Literacy (WJ-III) | 89.2 | 13.6 | 805 | 99.4 | 14.9 | 757 |
| Math (WJ-III) | 93.2 | 13.3 | 803 | 96.8 | 14.0 | 757 |
| Social Skills and Positive ATL (Parent) | 12.5 | 1.69 | 809 | 12.7 | 1.56 | 783 |
| Problem Behaviors (Parent) | 6.00 | 3.58 | 809 | 5.31 | 3.69 | 783 |
| Classroom Aggression (Teacher) | 50.2 | 7.55 | 917 | 49.4 | 7.63 | 929 |
Analyses
Preliminary analyses examined direct associations between instructional practices in Head Start and kindergarten classrooms and children’s academic and social-emotional outcomes during kindergarten. To do so, models were run in which each child outcome was regressed on children’s instructional practices in Head Start and kindergarten classrooms, controlling for their baseline scores at the end of Head Start and a variety of child and family demographic characteristics. To address our primary research questions, we entered targeted interaction terms to this preliminary model. More specifically, for children’s math development, we included an interaction term between time spent on math instruction in Head Start and time spent on math instruction in kindergarten; for children’s literacy and language development, we included an interaction term between time spent on literacy/language instruction in Head Start and time spent on literacy/language instruction in kindergarten; for children’s development of social-emotional skills, we included (separately) an interaction term between time spent on child-chosen activities in Head Start and in kindergarten, and an interaction term between time spent on whole-group activities in Head Start and in kindergarten. In general, these interaction terms test the extent to which the effect of kindergarten instructional practices on children’s development during kindergarten depended upon children’s instructional experiences during Head Start.
All analyses were conducted using R statistical analysis software (R Core Team, 2015). Tables 6.4 and 6.5 present results from analyses using list-wise deletion. There was a small amount of missing data for child outcome variables (the amount of missing data per outcome ranged from 5% to 22%), and an examination of these data showed that they met Missing at Random assumptions. Thus, we replicated the analyses using datasets in which missing values were imputed via Multiple Imputation techniques, and the results of these analyses were consistent with the results reported herein.
Results
In our preliminary analyses, we tested direct effects of instructional practices in Head Start and kindergarten classrooms on children’s academic and social-emotional development during kindergarten. Results from these analyses are presented in Table 6.4 for academic outcomes and Table 6.5 for social-emotional outcomes (see Block 1, which includes these eight measures of instructional practices entered into the models). There were no significant associations (p < 0.05) found between any of the instructional practices and children’s development of academic skills during kindergarten (Table 6.4). Thus, instructional practices in Head Start and in Kindergarten classrooms did not contribute, uniquely and independently, to children’s language, literacy or math development during kindergarten. Children’s development of social-emotional skills during kindergarten (Table 6.5) was positively associated with the frequency of literacy instruction they experienced; however, the patterns of these results are not intuitive. For example, more frequent literacy instruction in Head Start was negatively associated with children’s development of social-emotional skills and positive approaches to learning (B = −0.21, SE = 0.10, p < 0.05) during kindergarten. More frequent literacy instruction in kindergarten was positively associated with teachers’ reports of the child’s classroom aggression (B = 1.36, SE = 0.56, p < 0.05) and negatively associated with parents’ reports of the child’s problem behaviors (B = −0.59, SE = 0.25, p < 0.05).
Table 6.4 Classroom instructional practices and children’s development of academic skills during kindergarten (n = 975)
| Receptive Language | Literacy | Math | |||||||
|---|---|---|---|---|---|---|---|---|---|
| B | SE | p | B | SE | p | B | SE | p | |
| Block 1: Direct Effects | |||||||||
| Instructional Practices in KG | |||||||||
| Time Spent on Lang/Lit | −0.01 | 0.67 | 0.983 | −0.92 | 1.04 | 0.378 | −1.04 | 0.94 | 0.267 |
| Time Spent on Math | −0.26 | 0.52 | 0.623 | 0.60 | 0.81 | 0.463 | 0.39 | 0.73 | 0.598 |
| Time Spent Child-Choice | −0.14 | 0.31 | 0.647 | 0.06 | 0.48 | 0.902 | −0.06 | 0.44 | 0.890 |
| Time Spent Whole-Group | −0.53 | 0.30 | 0.082 | −0.34 | 0.47 | 0.478 | 0.20 | 0.43 | 0.639 |
| Instructional Practices in HS | |||||||||
| Time Spent on Lang/Lit | 0.40 | 0.56 | 0.471 | 0.05 | 0.87 | 0.953 | −0.53 | 0.78 | 0.500 |
| Time Spent on Math | −0.05 | 0.55 | 0.925 | −1.02 | 0.85 | 0.231 | 0.57 | 0.77 | 0.457 |
| Time Spent Child-Choice | 0.43 | 0.31 | 0.162 | −0.08 | 0.48 | 0.874 | 0.76 | 0.43 | 0.079 |
| Time Spent Whole-Group | −0.34 | 0.34 | 0.324 | 0.59 | 0.54 | 0.271 | 0.20 | 0.48 | 0.683 |
| Block 2: Interactions | |||||||||
| Lang/Lit KG × Lang/Lit HS | −1.09 | 0.78 | 0.160 | −1.19 | 1.21 | 0.326 | – | – | – |
| Math KG × Math HS | – | – | – | – | – | – | 2.16 | 0.82 | 0.009 |
Notes: Block 1 includes Instructional Practices in KG and Instructional Practices in Head Start. Block 2 includes each interaction term entered separately. Analyses control for end of HS assessments, age, HSIS study condition, child lives with both biological parents, race/ethnicity, gender, maternal education, maternal marital status, teen mother, urban school, full day kindergarten.
Table 6.5 Classroom instructional practices and children’s development of social-emotional skills during kindergarten (n = 975)
| Social Skills and Positive Approaches to Learning | Problem Behaviors | Aggression | |||||||
|---|---|---|---|---|---|---|---|---|---|
| B | SE | p | B | SE | p | B | SE | p | |
| Block 1: Direct Effects | |||||||||
| Instructional Practices in KG | |||||||||
| Time Spent on Lang/Lit | −0.04 | 0.12 | 0.737 | −0.59 | 0.25 | 0.020 | 1.36 | 0.56 | 0.016 |
| Time Spent on Math | −0.01 | 0.09 | 0.871 | 0.32 | 0.20 | 0.110 | −0.15 | 0.44 | 0.743 |
| Time Spent Child-Choice | −0.07 | 0.05 | 0.191 | −0.06 | 0.12 | 0.584 | −0.15 | 0.26 | 0.570 |
| Time Spent Whole-Group | −0.05 | 0.05 | 0.330 | 0.10 | 0.12 | 0.368 | −0.04 | 0.25 | 0.864 |
| Instructional Practices in HS | |||||||||
| Time Spent on Lang/Lit | −0.21 | 0.10 | 0.030 | −0.16 | 0.21 | 0.460 | 0.13 | 0.48 | 0.781 |
| Time Spent on Math | 0.13 | 0.10 | 0.166 | 0.15 | 0.21 | 0.471 | 0.05 | 0.46 | 0.911 |
| Time Spent Child-Choice | −0.03 | 0.05 | 0.551 | −0.04 | 0.12 | 0.749 | −0.30 | 0.26 | 0.243 |
| Time Spent Whole-Group | 0.04 | 0.06 | 0.557 | −0.10 | 0.13 | 0.469 | −0.12 | 0.29 | 0.694 |
| Block 2: Interactions | |||||||||
| Child Choice KG × Choice HS | 0.10 | 0.05 | 0.035 | 0.06 | 0.11 | 0.557 | 0.25 | 0.24 | 0.303 |
| Whole Group KG × Whole HS | −0.07 | 0.05 | 0.188 | 0.07 | 0.12 | 0.568 | −0.44 | 0.24 | 0.065 |
Notes: Block 1 includes Instructional Practices in KG and Instructional Practices in Head Start. Block 2 includes each interaction term entered separately. Analyses control for end of HS assessments, age, HSIS study condition, child lives with both biological parents, race/ethnicity, gender, maternal education, maternal marital status, teen mother, urban school, full day kindergarten
To evaluate the primary research questions about the consistency of children’s experiences across Head Start and kindergarten classroom and children’s development of academic skills during kindergarten (Table 6.4), interaction terms were added to the preliminary analyses. More specifically, for the two models examining children’s development of receptive language skills and literacy skills during kindergarten, the following interaction term was added: frequency of literacy/language instruction in kindergarten × frequency of literacy/language instruction in Head Start. This resulting coefficient represents the extent to which the effects of more frequent literacy/language instruction in kindergarten on children’s language or literacy development during kindergarten depended upon the frequency with which children experienced literacy/language instruction in their Head Start classrooms. Neither of these two interaction terms was statistically different from zero. For children’s math development during kindergarten, we entered the interaction between the frequency of math instruction in kindergarten classrooms and the frequency of math instruction in Head Start classrooms. A statistically significant coefficient for this interaction was found (B = 2.19, SE = 0.82, p < 0.01).
We depict this interaction in Figure 6.1 using model-based estimates to generate math scores at the end of kindergarten for nine groups of children who had each different combination of low, medium, and high frequency of math instruction in Head Start and in kindergarten. To estimate these means, low was defined as one standard deviation below the mean, medium was defined as at the mean, and high was defined as one standard deviation above the mean. This interaction in Figure 6.1 illustrates that the association between math instruction in kindergarten and children’s development of math skills during the kindergarten year depended upon the frequency with which children experienced math instruction in Head Start.

Figure 6.1 Consistency of math instruction across Head Start and kindergarten classrooms and children’s development of math skills during kindergarten
More specifically, among children who experienced low frequency math instruction during Head Start, less frequent math instruction during kindergarten was positively associated with math skills at the end of kindergarten. In addition, among children who experienced high frequency math instruction during Head Start, more frequent math instruction during kindergarten was also positively associated with math skills at the end of kindergarten. This figure also indicates that highest math skills at the end of kindergarten were achieved by children who experienced low frequency math instruction across both grades (Mean = 97.1) and children who experienced high frequency math instruction across both grades (Mean = 97.5). In addition, the lowest math skills at the end of kindergarten were achieved by two groups of children: those who experienced high frequency math instruction in Head Start and low frequency math instruction in kindergarten (Mean = 94.8), and those who experienced low frequency math instruction in Head Start and high frequency math instruction in kindergarten (Mean = 94.5). These patterns of associations provide some evidence in support of the Consistency Hypothesis.
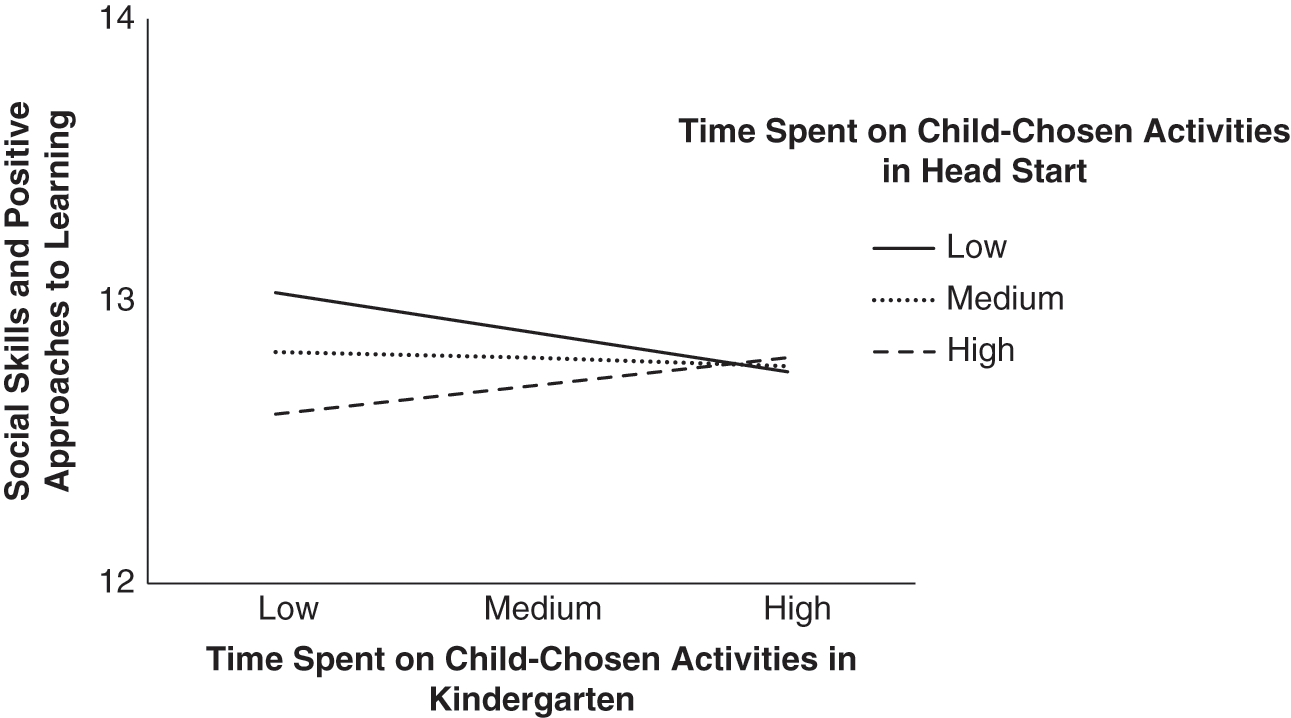
To evaluate the research questions related to children’s development of social-emotional skills during kindergarten (Table 6.5), we entered the following two interaction terms separately for each of the three social-emotional outcomes: frequency of child-chosen activities in kindergarten × frequency of child-chosen activities in Head Start; and frequency of whole-group activities in kindergarten × frequency of whole-group activities in Head Start. A statistically significant coefficient was found for the interaction between the frequency of child-chosen activities in Head Start and kindergarten on children’s development of social skills and positive approaches to learning during kindergarten (B = 0.10, SE = 0.05, p < 0.05). Figure 6.2 illustrates this interaction. Among children who spent more time doing child-chosen activities during Head Start, more frequent child-chosen activities in kindergarten was positively associated with children’s development of social-skills and positive approaches to learning. In contrast, among children who spent less time doing child-chosen activities during Head Start, less frequent opportunities for child-chosen activities during kindergarten were also positively associated with development. Another coefficient – for the interaction between the frequency of whole-group activities in kindergarten and the frequency of whole-group activities in Head Start on children’s classroom aggression – approached statistical significance (B = −0.44, SE = 0.24, p = .065). Figure 6.3 illustrates this interaction, which has a similar pattern to Figures 6.1 and 6.2. More specifically, for children who experienced frequent whole-group activities in Head Start, more frequent whole group activities during kindergarten were associated with lower classroom aggression; similarly, for children who experienced less frequent whole-group activities in Head Start, less frequent whole group activities during kindergarten were also associated with lower classroom aggression. Both of these figures suggest that the children who experienced consistent instructional practices across Head Start and kindergarten made the greatest gains on social-emotional skills during kindergarten, while children who experienced inconsistent patterns in how activities were structured had the lowest gains in their social skills and approaches to learning and greatest gains in classroom aggression during kindergarten.


Discussion
Our empirical investigation into the Consistency Hypothesis among children in the 4-year-old cohort of the HSIS who attended Head Start and kindergarten classrooms provides some initial evidence that the combination of children’s instructional practices across Head Start and kindergarten classrooms affects their development during kindergarten. Results indicate that, overall, instructional practices that children experienced during kindergarten (time spent on a literacy/language instruction, math instruction, whole-group activities, child-chosen activities) were not directly associated with their development of academic and social-emotional skills during kindergarten. However, the effects of these instructional practices on children’s development depended upon children’s previous instructional experiences during Head Start. More specifically, the pattern of results provides some initial evidence that consistency in the amount of math instruction across grades promotes math development during kindergarten, and consistency in how activities are structured (whole-group, child-chosen) across grades promotes positive development of social-emotional skills during kindergarten. This pattern of results was found for multiple child outcomes, including direct assessments of math, teacher-reports of classroom aggression, and parent-reports of social skills.
There are some notable limitations with this study related to its correlational design, which through the inclusion of covariates may not adequately account for other unmeasured factors that affect children’s development during kindergarten. In addition, the measures of children’s instructional experiences in Head Start and kindergarten are teacher-reported and reflect the perspectives of teachers, and thus may not directly comport with children’s actual experiences. Further, the measure of the frequency of literacy/language instruction and math instruction had limited variability, due to the rating scale that truncated the most frequent response to “daily” and, therefore, did not capture variability in the number of hours and minutes of instruction per day.
Despite these limitations, these results provide initial empirical evidence that consistent instructional practices across Head Start and kindergarten classrooms is positively associated with children’s development. Further empirical investigations are warranted, which include: extending the analyses with this sample to include first grade experiences and child outcomes, and third grade experiences and child outcomes; replicating these analyses with other samples; exploring other analytic approaches to investigate the consistency hypothesis; and exploring the two other sets of hypotheses regarding developmentally-sequenced and high-quality experiences across Head Start and kindergarten classrooms.
Just as ECE researchers in this volume and elsewhere are engaged in work to advance our understanding of children’s long-term development and how to sustain the gains of the investments made in ECE programs, policymakers, program administrators, and teachers have been engaged in numerous efforts to implement strategies that support children and families amid the transition to kindergarten. For example, there is a long history of developing and implementing a wide-range of “transition” strategies that support children as they move into kindergarten (e.g., Kagan, Karnati, Friedlander & Tarrant, Reference Kagan, Karnati, Friedlander and Tarrant2010). Strategies range from short-term, low-cost, and easy-to-implement practices, such as kindergarten open houses, phone calls, and home visits before the school year begins, which are intended to help children and families become acquainted with the new settings and establish relationships that open lines of communication between children, teachers, and parents.
Other strategies provide more intensive supports to children and families during the summer before the beginning of kindergarten as well as throughout the early elementary grades. For example, in 1990, the Head Start Bureau began implementing a large-scale transition program to provide a comprehensive set of supports to former Head Start children and their families during the first four years of elementary school (Kagan & Neuman, Reference Kagan and Neuman1998), including parent involvement activities, educational enhancements for children, family social support services, and health and nutrition services (Ramey, Ramey, Phillips et al., Reference Ramey, Ramey and Phillips2000). Other types of transition strategies involve aligning standards, curriculum, instruction, and assessment from pre-kindergarten through third grade (Bogard & Takanishi, Reference Bogard and Takanishi2005), in order to support children’s development by promoting experiences across grades that are consistent and effectively build upon the child’s current capabilities (Kagan, Karnati, Friedlander & Tarrant, Reference Kagan, Karnati, Friedlander and Tarrant2010).
In conclusion, children’s transitions from Head Start into kindergarten bring changes in their instructional experiences. Among children in the Head Start Impact Study, this shift involved moving from Head Start classrooms into kindergarten classrooms wherein they spent more time on literacy/language instruction and in whole-group activities and less time in child-chosen activities (Table 6.2). We proposed that the magnitude of this shift in instructional practices that children experience upon entering kindergarten, which varies widely between children, has implications for their development of academic and social-emotional skills during kindergarten. Results from this study provide some empirical evidence that the consistency of instructional practices across Head Start and kindergarten classrooms is positively associated with children’s development of math skills and social-emotional skills during kindergarten. Thus, strategies that effectively increase the consistency of instructional experiences when children move from Head Start into kindergarten classrooms can help sustain the gains in children’s academic and social-emotional skills that were made during the Head Start year.
Introduction
Experts have proposed two likely explanations for the erosion of the advantages achieved in preschool during the early elementary grades: (1) the preschool “treatment” was not sufficiently strong, and (2) it was not followed up with high-quality educational opportunities in the early elementary grades. Supporting the first explanation is the observation that the preschool programs that have shown sustained effects (e.g., Abecedarian, Chicago Child–Parent Centers, Perry Preschool) were intense and unusually high in quality, including substantial parent involvement and well-trained teachers. Teachers in the Perry Preschool Program, for example, were certified to teach preschool, elementary, and special education (Schweinhart, Barnes & Weikart, Reference Schweinhart, Barnes and Weikart1993). Consistent with the second explanation is evidence that children in low-income communities attend elementary schools with fewer resources and relatively inexperienced teachers (Currie & Thomas, Reference Currie and Thomas2000; Peske & Haycock, Reference Peske and Haycock2006). Quality matters in both explanations. This chapter accordingly focuses on the issue of quality for preschool and the early elementary grades as well as strategies for achieving continuity in children’s educational experience as they move from preschool into elementary school.
Quality of learning contexts is typically measured within classrooms. What transpires in the classroom, however, substantially depends on policies made beyond the classroom. For example, state standards and assessments, as well as district and school decisions about curriculum, affect the nature and quality of learning experiences in any given grade and the level of continuity across grades. Strategies to ensure and maintain the benefits of preschool therefore need to consider the larger ecology of schooling.
The first section provides a brief overview of evidence on the nature of high-quality instructional programs for preschool through third grade. This summary is followed by a discussion of policies outside of the classroom that affect the quality of children’s learning experiences in the classroom. The final section focuses on the potential value of creating continuity in children’s educational experience as they move from preschool through the early elementary grades.
Program and Classroom Quality
This section focuses on the qualities of learning environments that are associated with positive student outcomes.
Social-Emotional Development
Social-emotional development is widely accepted as an important child outcome, both because it is associated with academic learning and because it is important in its own right. Social-emotional development typically includes prosocial skills (e.g., sharing, collaborating with peers) and the ability to develop close relationships, as well as the absence of externalizing behavior (acting out, aggression) and internalizing problems (withdrawn, depressed). Longitudinal studies suggest that aggression or externalizing behavior are stronger and more consistent negative predictors than are prosocial skills of academic learning (Duncan, Dowsett, Claessens, et al., Reference Duncan, Dowsett and Claessens2007; Pagani, Archambault & Janosz, Reference Pagani, Archambault and Janosz2010) and other important outcomes, such as high school and college completion (Duncan & Magnuson, Reference Duncan, Magnuson, Duncan and Murnane2011).
Research has repeatedly demonstrated that children benefit from emotionally supportive and respectful learning environments (e.g., Hamre, Reference Hamre2014; Hamre & Pianta, Reference Hamre and Pianta2005; Pianta, Reference Pianta1999; Rudasill, Gallagher & White, Reference Rudasill, Gallagher and White2010), close caring relationships with teachers (Pianta, Reference Pianta1999; Sabol & Pianta, Reference Sabol and Pianta2012), and classrooms that provide clear, consistent behavioral expectations (Emmer & Strough, Reference Emmer and Strough2001; Good & Grouws, Reference Good and Grouws1977).
Synthesis reports have come to similar conclusions. In a report based on research by a National Academy of Science Panel (National Research Council (NRC), 2008), the following qualities of the social context of classrooms were deemed important (p. 158):
1. Affectionate, supportive, attentive, and respectful adults;
2. Explicit support for social skills;
3. Conversations about feelings;
4. Collaboration and cooperation opportunities;
5. Clear and developmentally appropriate rules; and
6. Use of redirection, positive reinforcement, encouragement, and explanations to minimize negative behavior.
Another synthesis of research and expert opinion adds to this list specific supports for children’s social-emotion regulation and decision making (Hyson, Whittaker, Zaslow et al., Reference Hyson, Whittaker, Zaslow, Zaslow, Martinez-Beck, Tout and Halle2011). These might include modeling and teaching specific strategies for self-calming (e.g., cuddling with a stuffed animal) and giving opportunities to choose among constrained options. The authors point out also that the organization of space and materials can foster or undermine positive social interactions and children’s feeling of comfort. Crowded spaces and insufficient materials, for example, can encourage peer conflict.
Although research assessing the effects of cultural accommodations is sparse, most early childhood educators recommend practices that demonstrate respect for children’s language and culture (see August & Shanahan, Reference August and Shanahan2006; Espinosa, Reference Espinosa2008; Goldenberg, Hicks & Lit, Reference Goldenberg, Hicks, Lit and Reutzel2013). Examples are: learning and using words in the children’s native language, showing an interest and appreciation for the children’s culture, and creating a classroom environment (posters, picture books) that represents the children’s culture.
Academic Skills
Academic outcomes are central to the purposes of schooling, and many studies have shown that academic skills at school entry predict skills through children’s school careers (e.g., Duncan et al., Reference Duncan, Dowsett and Claessens2007; Duncan & Magnuson, Reference Duncan, Magnuson, Duncan and Murnane2011). I focus on language, literacy and math because they are core competencies and central to most state accountability systems.
There is some resistance in the early childhood education field to teaching academic skills in preschool, based on concerns about developmental appropriateness and fear that it will crowd out opportunities for play and developing social-emotional skills. Efforts to design developmentally appropriate instruction for young children, however, have shown that academic skills instruction can be developmentally appropriate and integrate opportunities for children to develop social skills.
In general, research has shown that some amount of teacher-directed academic instruction is important to promote academic gains. One large recent study is illustrative. Fuller, Bein, Bridges, Kim & Rabe-Hesketh (Reference Fuller, Bein, Bridges, Kim and Rabe-Hesketh2017) used a nationally representative data set (Early Childhood Longitudinal Study, Birth Cohort, ECLS-B) to examine the effects of the amount of time spent each week in preschool on academic activities (building oral language, pre-literacy skills, knowledge of math concepts). The children in the more academic preschools made substantially more academic gains, which persisted into kindergarten, with no observed negative effects on social skills. Similarly, the 2008 Preschool Curriculum Evaluation Research Consortium, which assessed the effects of 14 preschool curriculum programs, found consistent effects on child outcomes for only two of the curricula, both of which involved direct instruction.
Although subject matter experts agree that children need some explicit, structured instruction, this can be implemented in a playful context and made meaningful and engaging for young children (Hirsh-Pasek, Golinkoff, Berk & Singer, Reference Hirsh-Pasek, Golinkoff, Berk and Singer2009). Rhymes and songs can be used to help children recognize letters and letter–sound relationships. Games can be used to develop number sense and math operations. Books that are read to children and that children are given to read can be related to their interests, and vocabulary can be taught in the context of meaningful stories and exploration of the environment. Below is a summary of some of the instructional strategies that are widely considered both effective and appropriate for young children.
Language and literacy.
Language skills form the foundation for literacy skills and have been shown to predict children’s mastery of reading (Pressley, Reference Pressley and Pressley2002). For both native English speakers and dual-language learners, native language skills predict the development of reading skills (August & Shanahan, Reference August and Shanahan2006). “Emergent literacy” (an understanding that print represents spoken language, books are a source of information, and writing can be used to communicate words) also predicts later literacy skills (National Research Council [NRC], 1998). According to consensus reports (e.g., NRC, 1998), other important early literacy skills include:
1. Phonological awareness (including phonemic awareness);
2. Letter identification;
3. Word identification; and
4. Word, sentence, and passage comprehension.
In classrooms providing effective opportunities to develop language, teachers engage in conversations with children, provide activities that encourage conversation among children, and make explicit efforts to develop vocabulary and language skills in the context of meaningful activities. Engaging children in conversation is particularly critical for dual-language learners, who typically catch up with native English speakers in decoding skills but lag behind in vocabulary and comprehension.Footnote 1
If English is the language of instruction, dual-language learners need special supports for developing English proficiency and gaining access to instruction in other areas. Comprehensible input is one recommended strategy (Krashen, Reference Krashen2003). Teachers facilitate children’s understanding of English by using visible referents, gestures, simplifying syntax, repeating and paraphrasing, speaking slowly and clearly, and checking often for comprehension. Teachers who speak children’s native language can also use it to help children understand English (Goldenberg et al., Reference Goldenberg, Hicks, Lit and Reutzel2013).
According to the National Research Council report on assessing young children (NRC, 2008), high-quality literacy learning opportunities at the preschool and kindergarten level include the following:
1. Children are being read to and given opportunities to read.
2. They engage in rhyming words.
3. They are taught initial sounds and letter–sound links, and spellings of common words are pointed out and practiced.
4. Their attention is called to functions and features of print.
5. They are given opportunities to dictate and write using invented spelling.
The NICHD-sponsored National Reading Panel (2000) report provides a synthesis of the research evidence on the most effective instructional strategies to support the development of reading skills in the early grades. In their report, the following strategies had strong empirical support:
1. Explicit teaching of phonemic awareness (the ability to focus on and manipulate phonemes in spoken words);
2. Systematic instruction related to phonics (letter–sound correspondences in creating words);
3. Guided oral reading with feedback to improve fluency;
4. Direct and indirect instruction designed to support vocabulary development (e.g., having students encounter new words often and in varying contexts); and
5. Explicit teaching of comprehension strategies (comprehension monitoring, graphic and semantic organizers, question answering, question generation, and summarization).
In contrast to the practices listed above, the panel found little evidence to support independent reading for young children who are learning to read. A recent meta-analysis provides further evidence for the value of some direct teaching (Chambers, Cheung & Slavin, Reference Chambers, Cheung and Slavin2016). They found substantially greater literacy skill gains in preschool programs using comprehensive approaches which included phonemic awareness, phonics, and other skills, along with child-initiated activities, than in developmental constructivist approaches that focused on child-initiated activities with little direct teaching of early literacy skills.
Research on dual-language learners indicates that learning to read in children’s native language is often associated with higher reading skills in English than initially learning to read in English. Native language instruction also strengthens and maintains native language and literacy skills (Goldenberg et al., Reference Goldenberg, Hicks, Lit and Reutzel2013).
Math.
Math is typically given less attention in early childhood programs, but recent findings suggest that early math skills are important. First, as is true for literacy, there is a great deal of variation in children’s math skills at school entry, and children who enter with relatively poor skills fall further behind as they advance through the grades in school (National Science Foundation, 2010). In two recent longitudinal studies of American and Canadian children, respectively, the achievement level in math at school entry predicted, as well or better than reading skills, both math and reading abilities several grades later (Duncan et al., Reference Duncan, Dowsett and Claessens2007; Romano, Kohen, Babchishin & Pagani, Reference Romano, Kohen, Babchishin and Pagani2010). In later studies, persistent problems in math over the elementary grades were a much stronger predictor than persistent problems in reading of both high school completion and college attendance (Duncan & Magnuson, Reference Duncan, Magnuson, Duncan and Murnane2011), and growth in math learning from 54 months through first grade was a strong predictor of math skills at age 15 years (Watts, Duncan, Siegler & Davis-Kean, Reference Watts, Duncan, Siegler and Davis-Kean2014). Taken together, these findings suggest that developing math skills in preschool is important.
There is a fair amount of consensus about the math skills which are important to develop in the early grades (National Research Council, Reference Cross, Woods and Schweingruber2009). They fall into five strands: (1) number (including the sequence of number words, one-to-one correspondence, and cardinality) and relations (e.g., more/less); (2) operations (composition and decomposition of number); (3) algebraic thinking (sorting and classifying objects, observing patterns, predicting what comes next); (4) measurement and data (determining the attribute of objects to measure, selecting the units of measurement and using measuring tools); and (5) geometry (spatial reasoning and shape, e.g., recognition and naming, understanding of defining properties).
Early number skills have been shown to be a particularly strong predictor of later mathematics achievement (Bailey, Siegler & Geary, Reference Bailey, Siegler and Geary2014; Jordan, Kaplan, Ramineni & Locuniak, Reference Jordan, Kaplan, Ramineni and Locuniak2009; Nguyen, Watts, Duncan et al., Reference Nguyen, Watts and Duncan2016). But all of the strands are considered important. Some researchers have demonstrated the importance of presenting these elements in a coherent sequence of topics and skills that is consistent with the logical and hierarchical structure of the content taught and with typical learning trajectories (Cai, Ding & Wang, Reference Cai, Ding and Wang2013; Clements & Sarama, Reference Clements and Sarama2014; Ferrini-Mundy, Burrill & Schmidt, Reference Ferrini-Mundy, Burrill and Schmidt2007).
The National Research Council (Reference Cross, Woods and Schweingruber2009) report points out that math is often absent in preschool classrooms, and when it is present, it is embedded in activities in which the teaching of mathematics is secondary to play or learning goals related to other domains. Emerging research indicates that activities in which math is a supplementary activity rather than the primary focus are less effective in promoting children’s math learning than activities focused on math learning as the primary goal. Dale Farran, for example, found a strong association between the amount of teacher-led math instruction in preschool and the gains children made in mathematics (Farran, Lipsey & Wilson, Reference Farran, Lipsey and Wilson2011).
The “math wars” (pitting traditional direct instruction against more reform-minded approaches that focus on understanding) continue, but there is a fair amount of agreement among experts about the essential qualities of effective math learning opportunities. No synthesis of effective math teaching strategies for young children has been conducted, as it has for reading. But a National Academy of Science panel that focused on early math learning (National Research Council, 2001) concluded that, whether focused on number, measurement, algebraic reasoning, or one of the other strands of mathematics, teachers should give children opportunities to develop (1) conceptual understanding (comprehension of mathematical concepts, operations, and relations); (2) procedural fluency (skill in carrying out procedures flexibly, accurately, efficiently, and appropriately); (3) strategic competence (ability to formulate, represent, and solve mathematical problems); (4) adaptive reasoning (capacity for logical thought, reflection, explanation and justification); and 5) productive dispositions (habitual inclination to see mathematics as sensible, useful, and worthwhile, coupled with a belief in diligence and one’s own efficacy).
Stipek and Johnson (in press) summarized recommendations related to teaching strategies from recent documents published by national organizations that examined research in early childhood mathematics, including the NAEYC & NCTM Joint Position Statement (National Association for the Education of Young Children & National Council of Teachers of Mathematics, 2010), the National Research Council Committee on Early Childhood Mathematics (NRC, Reference Cross, Woods and Schweingruber2009), and the Institute for Education Sciences (IES) Practice Guide: Teaching Math to Young Children (Frye et al., Reference Frye, Baroody and Burchinal2013). According to their summary, teachers should:
1. Recognize and build from children’s informal mathematical knowledge, as well as their linguistic, cultural, family, and community resources;
2. Support children to focus on, describe, and extend the mathematical opportunities present within everyday activities;
3. Intentionally devote time to engaging children in mathematics through planned mathematical activities, as well as through capitalizing on mathematical opportunities within play;
4. Integrate mathematics with other activities and other activities with mathematics;
5. Ground mathematics curriculum and teaching practices in research-based knowledge that details developmental progressions in number and operations, geometry, and measurement; and
6. Ensure that learning opportunities build on children’s existing understanding by thoughtfully and continually assessing their mathematical knowledge, skills, and strategies.
Self-Regulation/Executive Functions
Recent research suggests the importance of self-regulation (both emotional and behavioral) and the executive functions required for self-regulation, including short-term memory, attention, and inhibitory control (similar to impulse control). It is during preschool and the early elementary grades that brain development supporting these skills is the most rapid (Luciana & Nelson, Reference Luciana and Nelson1998). Studies have found that executive functions are highly predictive of social competencies, learning-related behavior, and academic achievement gains (see Obradovic, Portilla & Boyce, Reference Obradovic, Portilla, Boyce and Pianta2012). For example, working memory is necessary for children to remember what they want to say while waiting for a peer to finish talking in a social context as well as to hold numbers and steps in mind while working on a math problem. Attention is required to read another child’s emotions and to process the teacher’s directions for an academic task. And inhibitory control is needed by a child whose immediate inclination is to grab a toy from another child as well as to reflect before writing down or calling out the first answer that comes to mind.
A few educational programs have been designed specifically to help young children develop self-regulation and executive functions (see Bierman & Torres, Reference Bierman, Torres, Griffin, Freund and McCardle2016). Tools of the Mind is the best known. It is aimed at improving executive functions primarily in the context of scripted dramatic play. The program includes a set of activities that are designed to help children use private speech for self-regulation and to use external aids to support memory and attention (Barnett, Jung, Yarosz et al., Reference Barnett, Jung and Yarosz2008). The Chicago School Readiness Project implemented in Head Start programs (Raver, Jones, Li-Grining et al., Reference Raver, Jones and Li-Grining2011) and a preschool intervention by Tominey and McClelland (Reference Tominey and McClelland2011) also focus on the development of self-regulation and executive functions.
Although there is some evidence for the effectiveness of these programs, specific efforts to improve children’s self-regulation skills and executive functions are relatively new and we can only speculate about the critical elements of successful programs. Fortunately, research is burgeoning in this area and we should be able to identify effective practices in the near future.
Motivation and Engagement
To gain anything from preschool or the early elementary grades, children need to be actively engaged. Engagement can be broadly defined in terms of three dimensions: emotional (e.g., enthusiasm, interest), intellectual (e.g., involving active thought, problem solving), and behavioral (sometimes referred to as “learning-related behavior,” such as following teacher directions, paying attention, and completing work). Many longitudinal studies have demonstrated strong associations between learning-related behavior and academic skills (DiPerna, Lei & Reid, Reference DiPerna, Lei and Reid2007; Galindo & Fuller, Reference Galindo and Fuller2010; Nesbitt, Farran & Fuhs, Reference Nesbitt, Farran and Fuhs2015). Learning-related behavior has cognitive as well as social/motivational components. Maintaining attention on the teacher, for example, requires the cognitive capacity to resist distractions. Capacity, however, is not sufficient. Attending to the teacher or to a task also requires motivation – the desire to engage in teacher-sanctioned behavior, perhaps out of a wish to please the teacher, to avoid punishment, or because the task is intrinsically interesting. Engagement is also affected by students’ goals and by their self-confidence and self-efficacy – whether they believe they can perform tasks and activities in the classroom. In brief, to exert effort, students need to want to engage and they need to believe they can engage effectively.
Qualities of educational settings have powerful effects on both students’ capacity and desire to be engaged, and we know a great deal about the qualities of classroom instruction and activities that are most engaging for young children (Stipek, Reference Stipek2002; Wigfield & Wentzel, Reference Wigfield and Wentzel2007). For example, the social-emotional climate of the classroom affects children’s motivation and engagement as well as their social development. Children who feel excluded by peers and not cared for by adults can become preoccupied with their own emotional discomfort, which can undermine their involvement in both academic and social activities.
The nature of tasks is also important. Being asked to complete tasks that children do not have the prerequisite skills to do can undermine self-confidence, the belief that effort will pay off, and children are not likely to be motivated to complete tasks that don’t make any sense to them.
In brief, extant research (see Stipek Reference Stipek2002, Reference Stipek, Zigler, Gilliam and Barnett2011; Ramey & Gambrell, Reference Ramey, Gambrell and Reutzel2013) suggests that the following qualities of instruction are important for fostering children’s motivation and engagement:
1. Tasks are challenging – not beyond children’s ability to grasp, but requiring some effort and learning;
2. Activities are personally meaningful – related to children’s interests, experiences and culture;
3. Instruction provides opportunities for active involvement, including experimentation, analysis, and problem-solving;
4. Children have some discretion in choosing or completing tasks;
5. The focus is on learning and understanding rather than on getting correct answers or performing well relative to peers;
6. Evaluation is specific and constructive (provides guidance); errors are considered a natural part of learning and provide information that can be used to guide future efforts; and
7. Success is attributed to effort and persistence, not ability, and teachers consistently convey high but realistic expectations.
Family Communication and Involvement
There is substantial evidence on the value of children’s primary caregivers being involved in children’s learning and development (e.g., Pomerantz, Moorman & Cheung, Reference Pomerantz, Moorman, Cheung, Harris, Graham and Urdan2012; for a review see Henderson & Mapp, Reference Henderson and Mapp2002). Research on effective practices for promoting family involvementFootnote 2 suggests that caretakers are most likely to play productive roles in their children’s education when
1. Teachers communicate regularly and thoroughly (covering all academic subjects, social-emotional development, behavior, etc.) with caregivers and listen attentively to their concerns and suggestions. Conversations can occur in informal contexts before and after school, in home visits, in formal parent–teacher conferences, and in phone calls.
2. Back-to-school events and programs are used to inform caregivers generally of the curriculum and to provide guidance on strategies they can use at home to support their children’s development (e.g., on reading to children or managing difficult behavior).
3. Classroom newsletters and other materials are sent home to provide caregivers with information about current topics of instruction and suggestions for activities that they can engage in with their children to reinforce school learning.
4. Caregivers are made to feel welcome in the classroom, such as by being encouraged to volunteer or participate in special classroom events.
Continuity
There is indisputable evidence that high-quality preschool, as described above, is required for substantial and sustained benefits (Barnett, Reference Barnett2011) and that children benefit from high-quality teaching subsequent to preschool. Indeed, Hanushek (Reference Hanushek, Izumi and Evers2002) concluded from his analyses that the achievement gap could be closed by providing economically disadvantaged children three consecutive years of a highly effective teacher. Children whose quality preschool experience is followed by high quality instruction in the early elementary grades thus have an advantage over children whose quality preschool experience is followed by low-quality instruction in elementary school.
Quality counts at every grade, but many experts and policymakers claim that there are additional benefits to continuityFootnote 3 between preschool and the early elementary grades. Quality, then, needs to be conceptualized not just as the quality of instruction within a grade, but the continuity of educational experiences across grades.
Why might a lack of continuity result in a failure to achieve the expected long-lasting effects of preschool? Here are a few examples. If kindergarten teachers do not build on the gains children made in preschool and continue to advance in their skills, and instead teach material that children have already learned, children without the benefit of preschool will catch up. Significant and unnecessary changes in behavioral expectations or the nature of instruction likewise might disrupt children’s continuous learning. Time for learning is reduced by the time needed to learn new routines and expectations. If parents are not invited or given opportunities to participate in elementary school, the habits and expectations of being involved in their children’s education, developed in high-quality preschool, would not provide ongoing benefit for children.
Proponents of what is often referred to as “Pre-K–3” have written widely on the policies and practices that are important to achieving continuity in children’s educational experiences so that the benefits of quality preschool are maintained and children continue to make gains in the early elementary grades. The focus has been on such elements as standards, assessments, curricula, and instructional strategies (Kauerz, Reference Kauerz2006; Bogard & Takanishi, Reference Bogard and Takanishi2005; Graves, Reference Graves2006; Takanishi, Reference Takanishi2016).
The value of continuity from preschool through the early elementary grades is suggested by evidence that programs providing continuity in services and supports have produced particularly impressive long-term effects in child outcomes (see Reynolds, Magnuson & Ou, Reference Reynolds, Magnuson and Ou2006). Otherwise, there is little empirical evidence for the benefits of continuity in policies and practices across grades, over and above the value of high-quality learning environments and the provision of services at every grade. Given the dearth of research, the discussion below is an analysis of what dimensions of policy and practice continuity are most likely to matter for children’s learning and development.
Clearly, for children who are enrolled in low-quality preschool, the goal is not to create continuity by continuing ineffective practices throughout the early elementary grades. And no proponent of Pre-K–3 continuity suggests that children should engage in the same academic activities for several grades, or that 3- or 4-year-olds should have the same level of autonomy and responsibility as 8-year-olds. The important questions are: What kind of continuity across grades is beneficial? What should change in children’s school experience? How should it change and what should remain the same? These issues are discussed below at various levels of policy and practice (see also Stipek, Clements, Coburn et al., Reference Stipek, Clements, Coburn, Franke and Farran2017).
State Policies
What matters for children is what transpires in their classroom. But, as mentioned above, the larger educational policy context substantially affects children’s experiences in the classroom. It is safe to assume, therefore, that some articulation between state policies at the preschool and elementary grades is necessary for continuity in classroom practices. If kindergarten teachers are expected to build on the competencies that children developed in preschool and to move them along a coherent continuum of skills, then kindergarten standards and assessments need to be aligned with preschool standards and assessments.
Apparently, failing to build on skills developed in preschool is common. Engel, Claessens & Finch (Reference Engel, Claessens and Finch2013) found that, in a nationally representative sample, children had, prior to entering kindergarten, already mastered most of the mathematics concepts reportedly covered by teachers during that year. Moreover, coverage of this basic content, which most children had already learned, was negatively associated with student achievement gains at the end of kindergarten. Failing to give students an opportunity to build on skills they had developed in preschool appeared to cause them to plateau. Meanwhile, children who did not have the benefit of preschool, had time to catch up. Although it is not clear that the problem was misalignment of standards, it may have contributed to the problem.
In addition to leading to too much duplication between kindergarten and preschool, nonaligned standards can create gaps between what children are expected to learn in preschool and what they are expected to learn in kindergarten. Discontinuous standards could therefore also lead to instruction in preschool that does not prepare children for the academic demands of kindergarten and instruction in kindergarten that assumes skills that have not yet been developed.
Differences in relative weight given to different dimensions of development could also result in the early elementary grades failing to build on strides children made in preschool. For example, if literacy but not math skills are emphasized in the preschool standards, but they both figure prominently in standards for the early elementary grades, children may enter kindergarten well prepared to meet the elementary grade standards in literacy, but not at all in math.
Differential attention to social-emotional development may also undermine children’s success in school. Currently, most states’ preschool standards and assessments give relatively equal weight to social-emotional and academic development, whereas most elementary standards and assessments are focused entirely on academic skills. Given evidence that social-emotional skills support learning (see Durlak, Weissberg, Dymnicki et al., Reference Durlak, Weissberg, Dymnicki, Taylor and Schellinger2011; Payton, Weissberg, Durlak et al., Reference Payton, Weissberg and Durlak2008), the absence of standards and assessments related to social-emotional development in the elementary grades could contribute to fade out because teachers in elementary school are not capitalizing on whatever gains on this dimension children made in preschool.
Ideally, standards and assessments follow a clear developmental trajectory that is coherent with both the discipline and with the developing cognitive capacities of children moving from preschool through the early elementary grades. But having well-articulated standards across the grades is not sufficient to ensure instruction that helps children move from wherever they are in the learning trajectory to the next level. Teachers need to know the standards that come before and after their grade. Not all children who enter kindergarten will have met all of the preschool standards and teachers need to provide instruction that helps these children meet those standards before they tackle the kindergarten standards. By the same token, some children entering kindergarten will have already achieved the kindergarten standards and teachers need to provide instruction that allows them to continue to grow their skills beyond the expectations of kindergartners.
A more radical but arguably sensible policy might be to create one set of Pre-K–3 standards and assessments that acknowledges the diversity of skills that children bring to each grade. The goal would be for all children to achieve the high end of the standards by the end of third grade. The teachers’ task would be to determine where each child is on these learning trajectories and provide learning opportunities designed to move him or her to the next level. Short of this ambitious change, at the very least standards should be aligned across grades, with teachers well informed of the previous and later grade standards, and understanding that instruction needs to be targeted at each child’s current skill level, which may be at, above or below the grade-level standard.
District and School Policies
Standards and assessments used for accountability purposes are typically imposed by the state. District and school-level policies related to curricula, formative and summative assessments, and teacher professional development also affect children’s learning experiences in the classroom. Although there is no empirical evidence demonstrating specifically that using the same curriculum and assessments or providing similar or the same professional development across preschool and the early elementary grades leads to better learning outcomes for children, there are reasons to expect advantages associated with this kind of continuity.
Using the same literacy, math or science curricula across grades should help teachers move students along a coherent trajectory of skill building, with new instruction building on previously developed skills. Curriculum continuity would also make it easier for teachers to return to material from the previous grade for students who had not mastered it, and to jump ahead to material in the next grade for students who had already mastered their current grade standards. The absence of meaningful curriculum connections across grades could lead to instruction that is either repetitious of the previous grade or skips important prerequisite skills and understandings.
Continuity in assessments allows teachers to assess children where they are in a learning trajectory that transcends the particular grade they are in so they can provide more appropriate learning experiences. If the kindergarten teachers in the study by Engel et al. (Reference Engel, Claessens and Finch2013) had had easy access to their children’s skill levels in math when they entered kindergarten, they might not have targeted instruction to skills most of their children had already mastered.
Tracking children’s individual progress from preschool through third grade should help teachers plan instruction and develop interventions for children who have stalled in their progress. Having the data available is a first step, but teachers also need to be trained to effectively use data on individual children’s skills to plan instruction. If teachers lack such skills, the data alone will not result in improved student learning. Tracking learning over time can also help administrators and teachers assess learning losses from spring to the next fall and develop strategies for helping parents support their children’s learning over the summer.
Note, however, that the same curriculum can be implemented in classrooms in very different ways. Thus, even if the same curriculum is used in preschool through third grade, instruction could be discontinuous. Continuity in children’s experience therefore requires support for teachers and opportunities for teachers to work collaboratively across grade levels.
All of the policies and practices described above are designed to create a seamless educational experience for children as they move from preschool through early elementary school. The next section focuses on continuity in the classroom practices that children experience directly.
Classroom
We know little about what aspects of instruction should be continuous and which should change. Some adjustment in teaching style is appropriate. For example, children should be given more independence and responsibility as they advance in age. But there are also ways in which a different approach to teaching could be disruptive. Consider math, for example. Learning could be undermined if children move from a classroom using a more progressive approach – in which manipulatives are used extensively, children work in pairs or groups and are encouraged to figure out their own strategies to solve problems, and understanding is stressed more than getting the right answer – to a more traditional approach, in which all activities involve paper and pencil, children work alone, and the teacher stresses a particular single strategy to get the right answer. These are very different approaches to teaching math and it could be confusing to children to shift suddenly from one approach to the other.
There may also be value in consistency in particular practices or routines (e.g., keeping daily journals, using a problem that children solve in their heads as a warm-up activity for math). This kind of consistency can give children a feeling of familiarity and self-confidence. Teaching strategies can be made increasingly complex so they are appropriate for children in preschool (e.g., dictating journal entries in preschool) and in later grades (doing their own writing). The complexity changes, but the task is familiar.
Continuity in classroom management strategies, as well, should make it easier for children to learn and follow the rules. Routines that support students’ self-regulation, for example, such as practices designed to gain children’s attention, transitions to go outside or eat lunch, and language (e.g., “crisscross applesauce”) used in conversations about appropriate behavior may give children a sense of comfort and confidence, and reduce the time required to acquaint them with new practices and language. Changing the rules from year to year unnecessarily can be confusing and can require additional time away from instruction to teach children the new classroom rules.
Clearly children should be given increasing responsibility for self-regulation and managing tasks. Four-year-olds can be expected to put their materials away. Older children may be expected to identify and collect the materials they need, as well as put their materials back in their place. But the increased responsibility should come in small increments. To do this, teachers need to know what responsibilities children had in the previous grade so they can begin with what children are used to, and then slowly add responsibility and complexity.
Continuity in how schools involve parents may also be important (Takanishi, Reference Takanishi2016). Parent involvement is stressed in high-quality preschool. If parents are not actively invited to engage productively in their child’s elementary schooling, the involvement they practiced in preschool may disappear. A failure to build in the elementary grades on what parents learned when their children were in preschool could thus contribute to the fading of the benefits of high-quality preschool. Consistency in the form in which schools and teachers inform parents may also be useful. For example, although the content of assessments will change as children develop new skills, the reporting formats can be similar and continuous. This facilitates parents’ processing and understanding of their children’s performance and needs, and it allows them to see progress across grades. Consistency in messages about parent involvement across preschool and the early elementary grades is also more likely to succeed in engaging parents than inconsistent messages about expectations.
Achieving continuity in practices – whether they concern instruction, management or communication to parents – requires communication among teachers from different grades. Opportunities for cross-grade collaboration and professional development may be the most important practice in achieving coherence and continuity across grades. For this to occur, dedicated and regular time needs to be made available for teachers at different grade levels to discuss standards, curriculum, instruction, assessment, management, communication, and connections with families, and any other topic that might affect the educational experience of their students.
Summary
Quality is typically assessed within grades. But continuity and coherence across grades most likely also contributes to the quality of children’s experience and thus their learning. This chapter suggests ways in which a lack of continuity could undermine the overall quality of children’s educational experience and contribute to the fading of the benefits of high-quality preschool.
Achieving the kind of continuity described here is difficult in the context of the typical organizational disconnect, especially between preschool and elementary grades. Preschool is often embedded in different institutional contexts (e.g., Head Start, state preschool) from elementary schools, with different funding sources and different regulations, and with different teacher certification requirements. Preschools and elementary schools are also often not located on the same campus, making collaboration among teachers at the different levels difficult. And in some states, there are substantial differences in the nature and quality of teachers’ training.
Many districts and schools have made attempts to address these challenges and promote greater continuity (Valentino & Stipek, Reference Valentino and Stipek2016). These efforts should be followed closely, documenting successful strategies, the challenges encountered, and the effects on classroom instruction and student learning. There is a strong research base supporting the description of quality educational contexts reviewed in the first section of this chapter. A similar research base is needed to answer the questions asked in the second section concerning continuity of policies and practices needed to sustain the benefits of high-quality preschool and promote children’s learning and development.
The increasing emphasis on supporting children’s learning throughout the first decade of life is based on two unfortunate realities. First, the size of the achievement gap by family income is large and increasing. A single program or practice at any one phase is not enough to close the gap in any enduring way. In the 2015 National Assessment of Educational Progress, 20 percent of fourth-graders from low-income families (up to 185 percent of the poverty line) were proficient readers compared to 52 percent of students from higher-income families (NAEP, 2016). This 32-point gap, which has increased by a third over the past decade, indicates that, to be effective, prevention services must be proportionate to the identified need (Belfield & Levin, Reference Belfield and Levin2007; Braveman & Gottlieb, Reference Braveman and Gottlieb2014; Takanishi, Reference Takanishi2016).
A one- or two-year preschool program, even if high quality, can reduce this gap by only about a third (Barton & Coley, Reference Barton and Coley2009; Reynolds et al., Reference Reynolds, Hayakawa and Ou2017). Early gaps in school readiness magnify over time and, in conjunction with post-program learning environments, contribute to disparities in achievement proficiency, school completion, and health behavior. To realistically address these challenges, multi-year and multi-component approaches that integrate services are needed.
The second unfortunate reality is that, despite the overall evidence of positive benefits for good-quality programs, impacts of early childhood programs vary substantially in magnitude, consistency, and duration. Too much variation in program quality is a major reason why, as is the fact that later education is not aligned to reinforce and bolster early learning gains (Camilli et al., Reference Camilli, Vargas, Ryan and Barnett2010; Reynolds & Temple, Reference Reynolds and Temple2008; Zigler, Gilliam & Jones, Reference Zigler, Gilliam and Jones2006). Even if large and sustained effects do occur as well as greater alignment of services, these programs are rarely scaled to entire populations.
Given the size of achievement disparities, the relatively modest levels of achievement proficiency of US students, and the limited reach of current programs, programs must be implemented that are longer in duration and more comprehensive in scope than existing approaches. They also must have the capacity to scale, since only a small fraction of education and prevention programs are ever scaled to the population level (O’Connell et al., Reference O’Connell, Boat and Warner2009; Spoth et al., Reference Spoth and Rohrbach2013).
Multi-level programs in the first decade of life can redress these trends. To increase scalability and sustainability, collaborative models of engagement are needed.
Chapter Focus
In this chapter, I review the Midwest Child–Parent Center Preschool-to-Third-Grade Program (CPC-P–3) as an approach for scaling and sustaining an evidence-based education program. Key elements, short- and longer-term impacts, and shared lessons for implementation at the neighborhood, district, and state levels are described. Supported by an Investing in Innovation Grant from the US Department of Education, the Chicago Longitudinal Study, and related projects, CPC-P–3 provides comprehensive education and family support services to children and parents in six Illinois, Minnesota, and Wisconsin school districts. Designed to accelerate achievement, socio-emotional learning, and parent involvement (HCRC, 2012; Reynolds et al., Reference Reynolds, Richardson and Hayakawa2016), CPC-P–3 is a school reform model to engage schools and families, thereby facilitating scale up. This is illustrated with evidence from ongoing longitudinal studies, which support scaling at larger levels and key principles of effective collaboration.
Principles of School–Family–University Collaboration
As a school reform model, CPC-P–3 implements a set of core elements in elementary school or center-based sites to enhance student learning. CPC services through third grade can be completely co-located or as a partnership between centers and schools. The framework is a school–family–university collaboration model which emphasizes three principles: (a) shared ownership, (b) committed resources, and (c) progress monitoring for improvement (Reynolds et al., Reference Reynolds, Hayakawa and Ou2017).
In shared ownership, the major partners have an equal responsibility to plan, implement, manage, and improve the program. Rather than the usual approach in which an externally developed (e.g., university-based) program is adopted without modification, a shared ownership model distributes the responsibility to ensure effective implementation, thereby strengthening the commitment from all partners to work together in achieving common goals. This is consistent with emerging collaborative stakeholder models of research (Frank, Basch & Selby, Reference Frank, Basch and Selby2014). Shared ownership provides a foundation of trust necessary for scaling and sustaining programs. Families also have an active role by providing input and ideas about strategies to implement, and working collaboratively with teachers and staff to create and maintain a strong learning environment.
For committed resources, each partner makes key investments that are necessary for effective implementation. Resources include time, financial capital, and physical space. Although resources denote the “stake” that each partner has in an initiative, the increased commitment that goes along with investment can facilitate scale-up and sustainability. Alternative financing options that are used, such as matching grants, blended funding, and leveraging, increase the capacity and feasibility of further expansion. Given shared ownership, staff collaboration in fulfilling roles and responsibilities is further enhanced, which also increases efficiency.
Progress monitoring for improvement addresses how well programs are meeting their short- and intermediate-term goals. This ongoing formative evaluation is essential for continuous improvement. Measuring and reporting the extent of implementation fidelity enables timely adjustment of program strategies and activities to the needs of participants and partners alike. This is especially important in comprehensive programs in which responses to intervention have large variability. The use of data and evidence, and sharing these among partners, reinforce the importance of meeting milestones and standards. The tools that are routinized also help ensure that the quality of the program can be maintained as scaling occurs.
Midwest Child–Parent Center Expansion Program
The CPC program began in 1967 in inner-city Chicago. This was made possible by funding from Title I of the Elementary and Secondary School Act of 1965, which provided grants to school districts serving high proportions of low-income children. The goal of the Act was to “Employ imaginative thinking and new approaches to meet the educational needs of poor children” (US Senate, 1967; p. 1455). The Chicago Public School District was the first school system to use these funds for preschool and thereby established CPC as the second oldest (after Head Start) federally funded preschool. Although CPC began as a comprehensive preschool program, children received continuing services in kindergarten and the early grades the following year, resulting in the P–3 program that exists today. The program was designed as a response to three major problems facing Chicago’s west side neighborhoods: low rates of attendance, family disengagement with schools, and low student achievement.
The conceptual foundations of the program derive from ecological, risk/protection, and human capital theories (Bronfenbrenner, Reference Bronfenbrenner1989; Rutter & Rutter, Reference Rutter and Rutter1993), in which well-being is a product of proximal and distal influences at multiple levels of contexts (individual, family, school, community) experienced during the entire early childhood period (ages 3 to 9). The program’s focus on the quality and continuity of learning environments indicates that optimal development can be promoted through enriched experiences and settings co-created by children, families, and schools. Due to discontinuities in instructional support and philosophy between early childhood and school age settings, improvements in the integration and alignment of services during this important ecological transition can improve children’s levels of readiness for kindergarten that are sustained over the elementary grades (Takanishi, Reference Takanishi2016; Takanishi & Kauerz, Reference Takanishi and Kauerz2008; Zigler & Styfco, Reference Zigler and Styfco1993). Increased teacher preparation and ongoing resource support reinforce instructional improvements (Manning et al., Reference Manning, Garvis, Fleming and Wong2017).
In the current expansion, each CPC-P–3 site provides a dynamic support system. Comprehensive education and family support services are provided. Under the direction of a leadership team at each site and in collaboration with the Principal, CPC-P–3 enhances school readiness skills, increases early school achievement, and promotes parent involvement. It is a stand-alone school or center in which all children receive services. Sites implement a set of six core elements following the program guidelines and requirements specified in the manual (HCRC, 2012; Reynolds et al., Reference Reynolds, Richardson and Hayakawa2016). All teachers, staff, and children participate as well as staff hired to reduce class sizes, and provide program leadership, professional development, and family engagement. For historical comparisons of the program, see Reynolds et al. (Reference Reynolds, Richardson and Hayakawa2016) and Reynolds (Reference Reynolds2012).
The program expansion and scale-up is guided by six major goals: (1) Implement the CPC model with high levels of quality following key elements of effectiveness; (2) Assess the quality of implementation of the preschool, kindergarten, and first- to third-grade components by context and participant characteristics; (3) Evaluate the impact of the CPC program from preschool to third grade using a rigorous and multifaceted design; (4) Assess the impact of the CPC program by child, family, and program characteristics; (5) Determine the cost-effectiveness of the program over preschool to third grade; and (6) Implement a sustainability plan to facilitate program expansion in additional settings.
The CPC’s Head Teacher (HT) or Director works under the leadership of the elementary school Principal. HTs are the administrative leads for the program and manage implementation, provide coaching and supervision to staff, and help establish expectations of performance. The Parent Resource Teacher (PRT) directs the CPC’s parent resource room and family services, and outreach activities are organized by the School–Community Representative (SCR). Health services are coordinated between the preschool and elementary grades. Liaisons work with the HT and PRT to provide alignment of curriculum and parent involvement activities.
After preschool participation at ages 3 and/or 4 in small classes with student:teacher ratios of 17:2, the K–3 component provides reduced class sizes (maximum of 25), teacher aides for each class, continued parent involvement opportunities, and enriched classroom environments for strengthening language and literacy, math, science, and social-emotional skills. Site mentors from HCRC also work with leadership and staff to ensure effective implementation. Curricular and performance monitoring are integrated within a robust professional development system of school facilitators and online supports.
In order to enhance shared ownership and school-wide integration of P–3 services, the Midwest CPC expansion conceptualizes the program as a school reform model led by the principal. Figure 8.1 shows the continuity principle of implementation and Figure 8.2 the organizational structure, in which the CPC head teacher, in concert with the principal and other coordinators, implements all program elements. Children’s learning is supported by the family within the context of the school and community. The system of services is mutually beneficial to all partners and builds shared ownership, committed resources, and progress monitoring for improvement.

Figure 8.1 Child–Parent Center Preschool to Third Grade Conceptualization

Figure 8.2 Child–Parent Center Preschool to Third Grade Model
CPC-P–3 as School Reform
Given the historic focus on specific elements of reform, including curriculum enhancement and small classes (Reynolds, Magnuson & Ou, Reference Reynolds, Magnuson and Ou2010), newer comprehensive approaches for promoting effective school transitions may not only have larger effects on child development but also provide a greater likelihood that gains will be sustained. To date, key principles of effective school improvement developed in the 1970s have not been successfully utilized in early childhood programs and their follow-on efforts (Reynolds et al., Reference Reynolds, Hayakawa and Ou2017; Zigler & Styfco, Reference Zigler and Styfco1993; Zigler & Trickett, Reference Zigler and Trickett1978). Among these are principal leadership, school climate and high expectations of performance, and engaged learning communities (Rury, Reference Rury2016; Takanishi & Kauerz, Reference Takanishi and Kauerz2008). These principles have been incorporated in school reform with positive results, most notably the 5 Essentials framework of effective leaders, ambitious instruction, involved families, supportive environment, and collaborative teachers (Bryk, Sebring, Allensworth, Lupescu & Easton, Reference Bryk, Sebring, Allensworth, Luppescu and Easton2010). Although developed independently within the context of early childhood programs, the six core elements of CPC are consistent with the 5 Essentials, and they provide a strategy of school improvement that can promote well-being and achievement.
Figure 8.1 shows the continuity inherent in CPC-P–3 in its equal emphasis on preschool, kindergarten, and the early grades. Preschool or early education provides the foundation and the next few grades build on this to promote achievement and well-being for children and parents. The figure also illustrates the inherent tension between the early timing of intervention versus duration of services. One is the early timing versus the developmental continuity in learning. CPC-P–3 represents both, but a major focus of dissemination will be the importance of continuity in learning for children to benefit most and for the achievement gap to be realistically closed (see Figure 8.2).
As shown, there are six core elements that are described as follows:
1. Collaborative leadership team. A leadership team is run by the HT in collaboration with the principal. The HT ensures that all elements are effectively implemented. The PRT, SCR, and other staff work together to support the system.
2. Effective learning experiences. Ensure mastery in core learning domains (e.g., literacy and language, math, science, socio-emotional) through small classes, diverse and engaged instruction, and increased time through full-day preschool and kindergarten classes. For example, preschool and K–3 classes are limited to 17 and 25, respectively, with assistants in each.
3. Aligned curriculum. Organize a sequence of evidence-based curricula and instructional practices that address multiple domains of child development within a balanced, activity-based approach. A curriculum alignment plan is developed with the principal is and updated annually.
4. Parent involvement and engagement. Comprehensive menu-based services are led by the PRT and SCR, including multifaceted activities and opportunities to engage families.
5. Professional development system. Online professional development and on-site follow-up support is integrated for classroom and program applications. Among the topics covered by the modules are oral language, thinking skills, movement, inquiry, and socio-emotional learning.
6. Continuity and stability: Preschool to third grade services, through co-located or close-by centers, incorporate comprehensive service delivery and year-to-year consistency for children and families. Instructional and family support services are integrated across grades.
The strength of the model lies in the synergy of all six elements working together, with across-element coordination a strong design feature. These are key to producing long-term impacts on children’s educational progress, socio-emotional development, and well-being.
Figure 8.3 shows a more detailed program structure and operations for the six key elements to promote well-being, which includes achievement, performance, parent involvement, and health. Beginning with a strong foundation at ages 3 and 4, children participate in small classes through third grade and each class has an assistant for at least half of the day. The learning environment created by the principal and CPC head teacher provides an integrated context for improved achievement and sustained gains. Transitions from year to year are supported by the parent involvement team, site mentors, and school staff, who share instructional approaches across grades for the benefit of children and families. A curriculum alignment plan and parent involvement plan are developed each year to guide implementation and program improvement. Professional development includes on-line teaching modules and on-site coaching and review of instructional practices to support a balance of teacher- and child-initiated instructional practices. Outreach services, including home visits and workshops, are through the parent resource room, as the parent resource teacher and school–community representative develop a menu-based system that is informed by a family needs assessment.
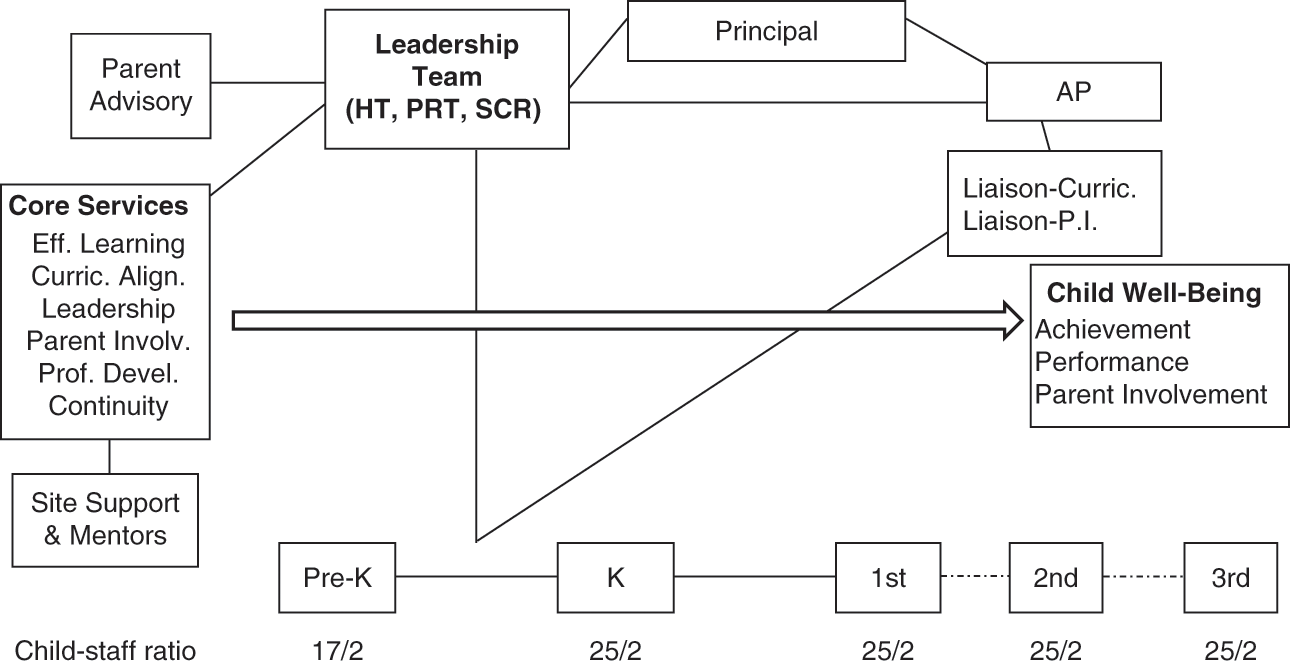
Table 8.1 provides a description of how each of the program elements contributes to the three core principles of collaboration. The collaborative leadership team of the principal and HT help establish the learning environment of shared ownership among the partners, which provides opportunities for CPC staff to serve children and families in all facets of the program. The principal’s increased commitment to the program, including participation in institutes and decisions to increase school resources to P–3, is a significant advance from the original program. This results in not only greater implementation fidelity but increased resource investments by the partners, who see the benefits of improved learning environment. The greater attention to progress monitoring by the leadership team increases fidelity to program principles and accountability.
Table 8.1 Midwest Child–Parent Center expansion core elements and collaboration
| Core program element | Shared ownership | Committed resources | Progress monitoring | Evidence of impact |
|---|---|---|---|---|
| Collaborative Leadership Team | Create a positive learning environment | Hire leadership team for implementation | Ensure that instructional and family services are effective | Increased fidelity of implementation; increased principal support to teachers, staff |
| Effective Learning Experiences | Small classes and balance of instructional activities | Provide matching funds to open new classrooms | Classroom Activity Report tool; observation of instruction tool; teacher checklists | Full-day preschool increased readiness skills and attendance; increased engagement in learning. |
| Aligned Curriculum | Provide coordinated instruction across grades | Implement new curricula to enhance learning | Annual curriculum alignment plan; observation of across-grade coordination | Increased child-initiated instruction linked to greater learning gains |
| Parent Involvement and Engagement | Establish a menu-based system of services | Increase staff time to work with parents and family members | Parent involvement logs; annual parent involvement plan | Program linked to increased parent involvement in school |
| Professional Development | Create a professional learning community | Hire coaches and mentors to improve teaching | Checklist of fidelity; facilitation and review of teaching | Increased time in math instruction and in child-initiated activities |
| Continuity and Stability | Ensure consistency and predictability in learning | Increase classroom supports (e.g., assistants) | Determine percentage of students who remain in the program over time | Participating families have lower mobility |
Other program elements contribute in similar ways to the collaboration and shared ownership, resource commitments, and progress monitoring, and provide a foundation for scaling. In effective learning experiences, for example, the implementation of full-day preschool in small classes emphasizes a balance of teacher-directed and child-initiated instruction for promoting strong learning gains (Reynolds et al., Reference Reynolds, Richardson and Hayakawa2016). This is complemented by increased alignment of instruction across grades, in which a curriculum alignment plan is developed, and grade level meetings and coaching visits are frequent. As a consequence, sustained gains of early education are more likely to occur.
Implementation Examples for Increasing and Sustaining Effects
Although CPC has a distinguished history, expansion beyond Chicago has been a major need. This is addressed by the Midwest expansion. At the time of the expansion in 2012, only the preschool component of the program was being implemented in just ten of the original sites. On the basis of the accumulated evidence, the Chicago district and others expressed interest in not only re-establishing the P–3 elements but enhancing the program so that it could be effective in a variety of community contexts. Working with Chicago’s leadership and others, the HCRC team developed a comprehensive plan that integrated six core elements that was implemented under a school reform model consistent with the US Department of Education’s Office of Innovation.
Program elements were modified and strengthened to address large demographic changes at both the societal level (e.g., increasing numbers of single-parent households and working mothers of young children) and program level (e.g., more diverse populations of children and families, new geographic locations).
Children’s participation in CPC-P–3 is expected to promote enduring positive impacts for three major reasons: (a) a longer duration of participation can produce greater and more foundational changes in school achievement and performance; (b) the program encourages stability and predictability in learning environments; and (c) it is implemented during the transition to school, a critical phase of development in which continuing services can accelerate learning and reduce the likelihood of drop-off effects (Reynolds, Magnuson & Ou, Reference Reynolds, Magnuson and Ou2010). Studies of preschool impact show that the length of gains is a function of program quality, magnitude of initial effect, timing and duration, and subsequent school quality (Camilli et al., Reference Camilli, Vargas, Ryan and Barnett2010; Currie & Thomas, Reference Currie and Thomas2000; Englund et al., Reference Englund, White, Reynolds, Schweinhart, Campbell and Reynolds2014). We describe three examples of how CPC-P3 is strengthening impacts in ways that are scalable and that overcome earlier limitations.
Collaborative Leadership and Effective Learning
As a school reform model, CPC-P–3 has a collaborative leadership structure in which the principal and staff establish a positive learning environment for students and families. Principals develop a CPC leadership team and support key program elements through matching funding (e.g., open full-day preschool, hire teaching assistants and outreach staff), and facilitate cross-grade curriculum and parent involvement activities.
During the planning stages, the HCRC team worked with each principal to develop an implementation plan for a smooth roll-out in each school. One of the main recommendations by principals and head teachers was to open full-day preschool classrooms in the first year (fall 2012). This was based in large part on feedback from parents that they wanted their children in full-day preschool due to the incompatibility between their work schedules and the school’s existing part-day program. The added challenge of coordinating care and education for the other part of the day was a major concern. Some parents went so far as to indicate that they would not enroll their child in the center unless there was a full-day option. In addition to parents’ demands, principals also believed full-day preschool would improve school readiness skills and the successful transition to the kindergarten and the elementary grades.
Full-day preschool, however, was not part of the CPC expansion design and consequently significant changes were needed. HCRC and the principals agreed that if schools contributed at least 25 percent of the added cost for opening a full-day classroom, HCRC would match the remainder. Eleven of the 16 schools agreed to do this, with the contributions ranging from 25 percent to 100 percent. HCRC reallocated funding to cover these costs. Twenty-three full-day classrooms were opened in fall 2012. This was the first time in these schools that principals directly funded preschool classrooms out of their own budgets. This process also supported key elements of shared ownership and committed resources (see Table 8.1). Our partnership with schools in opening full-day preschool classrooms led to the district financially sustaining and expanding them the following year. Other districts also opened full-day classes. CPC leadership positions also were sustained.
Menu-based System of Parent Involvement and Engagement
While the importance of parent involvement in children’s school success has been well documented (Jeynes, Reference Jeynes2007; Reynolds, Reference Reynolds2012; See & Gorard, Reference See and Gorard2015), daily schedules and demands, school climate, and the lack of necessary school resources often prevent parents from fully engaging in family support activities (e.g., workshops, home visits). Through collaborations with principals, school staff, family members, and the community, we developed a menu-based system of parent involvement that overcomes these barriers by offering a comprehensive program tailored to the educational and career needs of families. Parents choose among a range of events activities in which to participate and agree to be involved at least 2.5 hours per week (Reynolds et al., Reference Reynolds, Richardson and Hayakawa2016).
The goals of family engagement are to (a) implement a menu-based program that addresses family needs while strengthening the school-family partnership, (b) sustain parent involvement in children’s education, and (c) enhance support for educational attainment, career opportunities, and personal development through the following topics and activities: a supportive home environment, healthy child and family development, parent education, career, and personal development. Each site has a parent resource room to host events and serve as a center for parents to visit throughout the day. The PRT works collaboratively with the HT and the school principal to engage families throughout the school-based parent program (see also Table 8.1).
School–family–community relationships are especially important in the CPC model. The role of the SCR is to help lead these efforts. Usually residing in the community, this para-professional staff member recruits families, informs them of programming, works toward increasing and maintaining child and parent attendance, and conducts home visits. These home visits are an opportunity to foster positive school and community relations by better understanding the obstacles impacting a family’s ability to participate in events. Given the need for home visits and monitoring attendance, SCRs became full-time positions in the first year.
A needs assessment is conducted at the beginning of the year to avoid planning events that do not match the identified needs of families. The available resources in the community are assessed through asset mapping. These are integral components of the Parent Involvement Plan. In collaboration, the HTs, PRTs and Parent Involvement Liaisons (K–3) develop activities at each center to promote involvement and engagement. Parent involvement logs (an electronic documentation system) are maintained for progress monitoring. Given the needs assessment results and the increased time of the SCR, parent involvement logs showed that CPC families in year 1 participated in an average of 12.4 school events compared to 2.7 for the comparison group (Reynolds et al., Reference Reynolds, Hayakawa and Ou2017). This difference was maintained the following year.
Family support behavior is one of five mechanisms through which CPC participation affects well-being (Reynolds, Reference Reynolds2012). Benefits will accrue to the extent that participation enhances parenting skills, attitudes and expectations, and involvement in children’s education (Hayakawa et al., Reference Hayakawa, Englund, Warner-Richter and Reynolds2013; Ou & Reynolds, 2010). Parent involvement in school and parent expectations for achievement have been found to improve well-being by increasing children’s learning time, enhancing children’s motivation and school commitment, and increasing expectations for attainment and success (Hayakawa et al., Reference Hayakawa, Englund, Warner-Richter and Reynolds2013). They also improve social support and parenting skills, which reduce social isolation and the risk of child maltreatment. Meta-analyses of family and two-generation interventions as well as parenting behaviors (Jeynes, Reference Jeynes2007; Sweet & Applebaum, Reference Sweet and Appelbaum2004) show that involvement and monitoring link to higher achievement and delinquency prevention.
Progress Monitoring for Improving Instruction
Monitoring ensures that learning is optimized for all students. It is not only for accountability but essential to improvement. Based on site visits, interviews, and a review of data collected for each element, we assessed each school’s fidelity of implementation in meeting requirements. The scale for each element and overall ranged from 1 (few requirements met) to 5 (almost all). The overall average rating of implementation fidelity for year 1 across the six program elements was 3.9 or moderately high. The highest was continuity and stability (4.2) and the lowest aligned curriculum (3.3). Parent involvement was in the moderate range (3.9). Across the six elements, 75 percent of sites met the moderate-to-high fidelity standard defined as a rating of 3.5 or higher. In year 2, the overall fidelity rating improved to 4.1 with collaborative leadership, parent involvement, and professional development rated highest. In years 3 and 4, overall fidelity averaged 4.0.
CPC classrooms are expected to utilize a variety of instructional strategies to maintain a balance of teacher-directed and child-initiated activities at a ratio no higher than 65/35. The Classroom Activity Report (CAR) was developed by HCRC to monitor classroom progress in meeting this requirement. This tool documents the organization and implementation of instructional activities (i.e., percentage of time during the day devoted to math, language and literacy activities, science, and social-emotional activities). Classroom teachers complete the CAR on a regular basis. HCRC staff review the submitted CARs and provide feedback. This promotes a collaborative approach to program fidelity and helps schools identify gaps and design new instructional strategies. We have found that learning gains in preschool and kindergarten are linked to the degree to which child-initiated instruction activities are implemented.
Table 8.2 provides an example of how the CAR can be used as a progress monitoring tool for improving learning outcomes. Although the distribution of instructional time was similar in full-day and part-day classes, the number of hours of total instructional time was nearly 2.5 times greater in full-day classes (984 vs. 417). This increase was proportionate across instructional domains and activities. For example, the number of hours in child-initiated literacy activities increased to 225 in full-day from 101 in part-day (increase of 124 hours) to 225. These data were used by schools and the district to determine if and how the additional hours were productively spent. One district asked that full-day classrooms be added, while another planned to open them the following year.
Table 8.2 Percentage of time in instructional activities by Chicago full-day and part-day classes
| Instruction | Mean Percentage Time, Hours, and Percent Change | |||
|---|---|---|---|---|
| Type of Activity | Part-Day (n = 76) | Full-Day (n = 21) | Increased hours in full-day classes | Percent change over part-day classes |
| Language & Literacy | 48.9 (9.9) | 48.1 (6.1) | 269 | 232 |
| Math | 18.9 (5.7) | 19.3 (3.2) | 111 | 241 |
| Social-Emotional | 7.8 (4.1) | 8.8 (3.5) | 54 | 264 |
| Science | 8.1 (3.0) | 8.4 (2.5) | 49 | 244 |
| Teacher-Directed vs. Child-Initiated | ||||
| Language & Literacy | ||||
| Teacher-Directed | 50.5 (13.8) | 52.4 (12.1) | 145 | 241 |
| Child-Initiated | 49.5 (13.8) | 47.6 (12.1) | 124 | 225 |
| Math | ||||
| Teacher-Directed | 49.6 (11.8) | 50.6 (12.0) | 57 | 246 |
| Child-Initiated | 50.4 (11.8) | 49.4 (12.2) | 54 | 235 |
| Science | ||||
| Teacher-Directed | 43.1 (15.7) | 53.1 (15.0) | 29 | 293 |
| Child-Initiated | 56.2 (16.6) | 46.2 (16.3) | 20 | 205 |
| Mean hours of total instruction for year | 417 | 984 | 567 | 236 |
Note. Data are teacher reports for 16 sites in Chicago. Two full-day classrooms out of 23 did not report time use. Standard deviations are in parentheses. Due to omitting the category “other,” percentage time in instruction activity does not add up to 100%.
Based in part on the increased instructional time and the content distribution documented by CAR, one district began to offer full-day preschool and strengthened their curriculum alignment between preschool and the early grades. Teacher collaboration across grades also increased. The CAR, along with an observational assessment called the Classroom Learning Activities Checklist, provides valuable information for improving the quality of experiences in the classroom. Independent observations of program and comparison sites on this assessment indicated that 76 percent of CPC preschool classrooms were rated moderately high to high in task orientation and engagement, a key program focus. 43 percent of comparison classrooms had this rating. This advantage persisted into kindergarten and the early grades. The balance of instruction was consistent with program principles.
CPC Impacts over Time
The positive effects of CPC are well documented. I summarize findings from the Chicago Longitudinal Study (CLS; Reynolds, Reference Reynolds2012) and the initial implementation of the Midwest CPC expansion.
CLS.
This study has tracked a CPC and comparison cohort born in 1979–80 and provides the most extensive evidence of impacts. It was also the basis of the Midwest CPC expansion. In a quasi-experimental design, 989 3- and 4-year-olds from low-income families who participated in 20 CPCs in the mid 1980s were compared to 550 children of the same age who enrolled in the usual early childhood programs in five randomly selected schools. A broad range of measures of well-being have been collected over three decades with over 90 percent sample recovery. These include school readiness and achievement, remedial education, educational attainment, involvement in the criminal justice system, and economic well-being. Program participation was from P–3 and followed the CPC elements. Study characteristics and findings are described in Table 8.3.
Table 8.3 Child–Parent Center estimates for school readiness, parent involvement, and achievement in two studies
| Study characteristics | Midwest Longitudinal Expansion Project | Chicago Longitudinal Study | ||
|---|---|---|---|---|
| Chicago | Saint Paul | Total | ||
| Preschool years | 2012–2013 | 2012–2013 | 2012–2013 | 1983–1985 |
| Research design | Quasi-experimental, school-level propensity scores | Quasi-experimental, matched groups | ||
| Program, Control participants | 1724, 906 | 215, 87 | 1993, 993 | 989, 550 |
| Control group enrolled in pre-K (%) | 100 | 100 | 100 | 15% |
| African American/Hispanic/Asian (%) | 64/34/0 | 30/14/31 | 60/32/3 | 93/7/0 |
| Assessment | TS-GOLD | PALS | ITBS composite | |
| Time of assessment | End of pre-K | End of pre-K | End of pre-K | Beginning of K |
| Average class size/level of fidelity | 17/high | 17/high | 17/high | 17/high |
| School readiness effect size (SD units) | 48 | 38 | 47 | 63 |
| Higher dosage (full-day/2 years) | 65 | n/a | 40 | 71 |
| Lower dosage (part-day/1 year) | 32 | 38 | 33 | 36 |
| Parent involvement effect size | 39 | 20 | 37 | 46 |
| Time of assessment | End of PreK | End of PreK | First grade | |
| Education outcomes effect size (SD or %) | N/A | |||
| Third grade reading achievement | 28 (pre-K), 0.60 (pre-K–3) | |||
| Eighth grade reading achievement | 30, 0.35 | |||
| Special education by age 18 | 14.4% vs. 24.6%, 13.5% vs. 20.7% | |||
| Grade retention by age 15 | 23.0% vs. 38.4%, 21.9% vs. 32.3% | |||
| High school completion by age 21 | 61.9% vs. 51.4%, 59.4% vs. 57.2% | |||
Note. Midwest CPC Chicago sample size is enrolled 3- and 4-year-olds. Saint Paul sample size is enrolled 4-year-olds for whom the school district provided data. Evanston and McLean County (Normal, IL) districts were excluded due to lack of available data. Chicago Longitudinal Study sample size is an age cohort of children who enrolled at age 3 and/or 4. TS-GOLD = Teaching Strategies Gold Assessment, Total Score. PALS = Phonological Awareness Literacy Screening (Upper-Case Alphabet Recognition). ITBS = Iowa Tests of Basic Skills cognitive composite. The quasi-experimental designs are propensity-score matching at the school level (i.e., achievement, family income, race/ethnicity) and matched groups based on demographic similarity and participation in district intervention. For dosage, Midwest CPC is full-day/part-day; CLS is 2 years versus 1 year for part-day SD = standard deviation units.
Based on a variety of regression, latent-variable, and propensity score analyses, CPC preschool participation was found to be associated with higher school readiness, higher reading and math achievement, reduced grade retention, reduced special education placement, and higher rates of high school completion (Reynolds, Reference Reynolds2012). CPC–P–3 has shown similar patterns of gains with the exception of high school completion by age 21. Significant differences were detected in later in the 20s, however (Reynolds et al., Reference Reynolds, Temple, Ou, Arteaga and White2011a).
Figure 8.4 shows the pattern of gains and effect sizes in reading achievement for the CPC preschool component from kindergarten through age 15. Developmental standard scores on the Iowa Tests of Basic Skills are shown and effect sizes in standard deviation units. The latter are across the bottom of the figure. Values are adjusted for child and family background characteristics as well as participation in CPC school-age services. A standard deviation of 0.20 is generally considered practically significant and signifies an improvement in performance of roughly 3 months (a third of a school year). Positive and significant effect sizes were sustained from kindergarten entrance to the end of ninth grade (age 15). The large initial impact of roughly two-thirds of a standard deviation (based on a composite heavily weighted on literacy and language) was maintained at slightly lower levels through second grade and then stabilized in the range of 0.25 to 0.32 from middle childhood to adolescence. That the standard deviation increases with age naturally leads to a reduction in effect size. This is due to variability in learning opportunities and experiences as children develop. Since the sum total of experience and learning increases with age, the contribution of preschool experience to this total would be expected to decline in relative terms as children grow.

Figure 8.4 Reading growth to age 15
By age 21, the CPC preschool program is found to be associated with a higher rate of high school completion and a lower rate of juvenile arrest (Ou & Reynolds, Reference Ou, Reynolds and Groark2006; Reynolds, Temple, Robertson, & Mann, Reference Reynolds, Temple, Robertson and Mann2001). Children participating in CPC-P–3 (4 to 6 years of participation from preschool to second or third grade) were found to have higher academic achievement when compared with children receiving only the preschool or follow-on programs (Conrad & Eash, Reference Conrad and Eash1983). CPC-P–3 participation was associated with lower rates of school remedial services and delinquency (Reynolds et al., Reference Reynolds, Temple, Robertson and Mann2001, Reference Reynolds, Temple, Ou, Arteaga and White2011a; see Table 8.3).
Figure 8.5 shows the growth in reading achievement from kindergarten entry (age 5) to fourth grade (age 10) for the CPC-P–3 group that participated in 4 to 6 years of intervention (to second or third grade) compared to the CPC group that only completed preschool and kindergarten. Scores are developmental standard scores on the Iowa Tests of Basic Skills and are adjusted from baseline child and family background characteristics (Reynolds, Reference Reynolds1994, Reference Reynolds2012). Although growth during the kindergarten year was similar between groups and at/above national norms, the CPC-P–3 group experienced greater growth between first and fourth grades. This translates to about a 6-month gain above and beyond preschool and kindergarten participation (Reynolds & Temple, Reference Reynolds and Temple1998; Reynolds et al., Reference Reynolds, Temple, Ou, Arteaga and White2011a). This advantage in performance reduced the gap with the national average by about 75 percent, even though the average performance of the CPC-P–3 group was not quite to the national average. That the program increased reading achievement to this extent is impressive given the high levels of economic and disadvantage growing up. CPC families reside in the highest poverty neighborhoods in Chicago, which are among the most extreme in the nation (Reynolds, Reference Reynolds2012).

Figure 8.5 CPC-P–3 reading advantage
Midwest CPC-P–3 expansion.
The expansion project assesses the impact and generalizability of the program model. Initial findings are similar to those in the CLS and indicate the benefits of the six core elements and services (see also Table 8.1). In the expansion project, the CPC cohort included 2,364 CPC participants in 26 sites and 1,212 comparison participants from propensity-score matched schools in four districts of various sizes who enrolled in the usual preschool with no coordinated school-age programs (Reynolds et al., Reference Reynolds, Richardson and Hayakawa2014, Reference Reynolds, Richardson and Hayakawa2016). The groups are being followed to third grade with school achievement and parent involvement as the primary outcomes. The sample is more geographically and ethnically diverse compared to the CLS, which was in inner-city Chicago with over 90% of children African American. In the Midwest CPC, 53% are African American with 32% Hispanic, 7% White, and 5% Asian.
Controlling for baseline performance and child and family background characteristics, the mean effect size for school readiness skills at the end of preschool for Midwest CPC participants in Chicago (based on the Teaching Strategies Gold total score) and Saint Paul (based on PALS alphabet recognition) was 0.47 standard deviations (Table 8.3). The effect size for school readiness in the CLS was 0.63 standard deviations. Most of the control group in the CLS, however, was not enrolled in preschool, whereas in the Midwest CPC they were enrolled in state/district pre-K or Head Start. Effects for parent involvement in school (teacher ratings) in the Midwest CPC was 0.33 standard deviations compared to 0.46 in the earlier study. These consistent effects indicate the continued feasibility and effectiveness of the program across contexts. Analyses of K–3 impacts are currently underway.
Finally, because full-day preschool was introduced in the CPC expansion to increase learning time, we found that relative to part-day, full-day participation was associated with significantly higher school readiness skills in language, math, and socio-emotional development (ES = 0.33), higher average daily attendance (ES = 0.30), and lower rates of chronic absences (ES = −0.45; Reynolds et al., Reference Reynolds, Richardson and Hayakawa2014). Nevertheless, both part-day and full-day CPC were associated with significantly higher school readiness skills than comparison participants in the usual part-day preschool (ESs = 0.32 to 0.71; Table 8.3). The impact of dosage in the CLS was similar to the expansion as the 2-year group in part-day classes had greater school readiness skills than the 1-year group, but both significantly outperformed the matched comparison (Reynolds et al., Reference Reynolds, Temple, Ou, Arteaga and White2011a).
The Midwest expansion findings led to an expansion of full-day preschool the following year, the introduction of full-day in another district, and plans to do so in a third district. Overall, the findings from both studies show the benefits of the CPC program and the advantages of the principles of shared ownership, committed resources, and progress monitoring.
Scaling and Financing through Pay for Success
Given the low rate of success in scaling evidence-based programs, new approaches to financing have been developed. One of the most prominent is called Social Impact Bonds or “Pay for Success.” In a Pay for Success (PFS) approach, private investors and/or philanthropic organizations loan funds to public sector jurisdictions (e.g., school districts, cities, counties) to expand evidence-based or very promising programs (GAO, 2015; Temple & Reynolds, Reference Temple and Reynolds2015). To the extent that these services are found to generate cost savings to the public sector, a state or local government is obligated to make payments to the investors based on the estimated cost savings. Economic evaluation is crucial in both determining the suitability of intervention programs to be financed in this manner and in determining the “success” payments. This approach can promote a shift from costly treatment-based interventions consuming ever larger portions of public budgets to proactive, preventive interventions that save more dollars than they cost.
PFS illustrates the role of shared ownership and committed resources in program expansion. Through a PFS initiative with the City of Chicago, the Midwest CPC has begun further expansion in the Chicago Public Schools. In this financing structure, Goldman Sachs, Northern Trust, and the J. B. & M. K. Pritzker Family Foundation provided $17 million in loans for the operational costs of new classrooms, which will serve an additional 2,600 children over four years (HCRC, 2014). The City will repay the loans only if the program improves outcomes as determined by an independent evaluation.
The CPC program under the Midwest expansion was selected for two major reasons. First, the expansion of CPC already underway was showing strong initial findings and school principals and the district were committed to the program. This was demonstrated by their increased funding and growing collaboration with the university. Second, the program had a long track record of effectiveness in promoting student success and in reducing the need for remediation. Two cost–benefit analyses documented that at an average cost per child of $8,512 (2012) for preschool, benefits exceed costs by a factor of 7 to 10 (Reynolds et al., Reference Reynolds, Temple, Robertson and Mann2002, Reference Reynolds, Temple, White, Ou and Robertson2011b). P–3 services showed similar returns.
A large percentage of the economic return was savings in special education, juvenile court, and child welfare. For example, the annual cost per child of special education services is over $15,000 above and beyond regular instruction. The majority of this cost is covered by the school district. Given the direct relationship between the city and the school district, the focus of the PFS was special education savings.
The CPC PFS initiative began implementation in February 2015 for an initial cohort of over 350 children in six sites. Five of them are existing schools in the CPC expansion. Annual evaluation results have been reported since 2016. Success payments of $2,900 were paid to the investor in 2017 for each child who was ready for kindergarten. Success payments of $9,100 were paid starting the next year for each CPC child who avoided special education as compared to the matched control group of children without CPC participation. Next, success payments of $750 may be made for each child proficient in literacy in third grade. Rates of special education will be tracked through high school. School readiness for each 4-year-old is defined as the percentage of children performing at or above the national average at the end of the year on five of six subscales of the Teaching Strategies Gold Assessment System (Lambert, Kim & Burts, Reference Lambert, Kim and Burts2013). The payment structure is based on the long-term evidence that CPC improves school achievement and reduces the need for special education by up to 41 percent or nearly a year of services (Reynolds et al., Reference Reynolds, Temple, Robertson and Mann2002).
Although the major advantage of PFS is the capacity for program expansion when existing public resources are not available, two limitations are notable. First, the success of the initiative is largely dependent on the selected program. Those having a track record, such as CPC or others with existing evidence of economic returns, are most reassuring to investors. Second, as a new type of financing, the success metrics of PFS so far rest on one jurisdiction of savings – special education or the justice system. Comprehensive programs having many sources of savings require multi-jurisdiction contracts. These are very challenging to complete and have not been completed to date. In CPC, for example, there are criminal justice system and child welfare savings, but because they are administered through counties, it was not feasible to secure partnership agreements. Consequently, PFS contracts may underestimate the possible savings.
Overall, PFS has helped scale CPC and can facilitate similar efforts in other districts. It provides a new avenue for leveraging resources in evidence-based programs. Private investment contributed to an initiative can also be combined with public resources to create a public–private approach to scaling, which then can be modified over time as public resources increase.
Implications for Creating, Increasing, and Sustaining Gains
The expansion of CPC-P–3 is based on a school reform approach to program improvement within a collaborative structure of partners. Through shared ownership, committed resources, and progress monitoring for improvement, the program is more likely to be scaled effectively and sustained in ways that continually produce benefits to children and families in school success and engaged parenting. This approach effectively bridges the historically large divide between early education and school-age services (Bogard & Takanishi, Reference Bogard and Takanishi2005; Takanishi, Reference Takanishi2016; Ziger & Styfo, Reference Zigler and Styfco1993). Successful implementation of CPC has yielded strong benefits so far in increasing school readiness skills, improving attendance, and in strengthening parental involvement in children’s education. These positive benefits have led to further scale up through an innovative Pay for Success initiative in Chicago that will substantially increase enrollment in the coming years. Cost savings in special education and remediation are expected to be consistent with prior studies.
Buy-in from partners at every level of the school community – school leaders and staff, children, and families, and local partners – is critical to successful CPC expansion and prevention programs in general (Takanishi & Kauerz, Reference Takanishi and Kauerz2008). The principle of shared ownership means that program and school decisions result from reciprocal dialogue among partners (Boyd & Crowson, Reference Boyd and Crowson1993). Such a climate of collaboration helps ensure that benefits are sustained and that progress toward scaling is successful.
Based on development, implementation, and evaluation of the CPC-P–3 expansion, there are a number of lessons and implications for increasing and sustaining early learning gains in all programs. The essential principle is that by establishing and maintaining a comprehensive system of supports from preschool through third grade, achievement levels can be optimized and achievement gaps realistically closed.
1. Principal leadership is essential for good implementation and positive effects on students. In working directly with principals, the implementation team established a strong partnership with schools. Principals felt a shared ownership of the program. As a result, they prioritized program continuity and key elements over P–3 and directly financed key elements of the program: full-day pre-K, classroom assistants, and outreach staff. This support was essential in promoting a positive learning climate for students, families, and teachers necessary for sustained learning gains. Analysis of implementation data indicated that the collaborative leadership team was integral to the success of other program elements. Increased investment in principal preparation and professional learning about the design and impact of P–3 approaches is needed. Ongoing opportunities to engage principals in the key elements of P–3 programs are also warranted.
2. Systems of support must be comprehensive and include family services. CPC is a comprehensive school reform model of six core elements covering leadership, instructional support, school–family relations, and continuity. This level of coverage is consistent with school reform strategies (Takanishi, Reference Takanishi2016; Zigler & Styfco, Reference Zigler and Styfco1993). Each site leadership team of Head Teacher, Parent Resource Teacher, and School–Community Representative as well as the Curriculum and Parent Involvement Liaisons play key roles. Alignment of services across P–3 has been instrumental for creating a strong learning climate. The extent to which each of the program elements contributes to short- and longer-term effects is an important next-step question.
3. Menu-based system of parent involvement enables schools to tailor services more effectively. Under this new framework, the parent involvement team increased the focus on home visits, check-ins with parents on attendance, and workshops ranging from English Language Learning and computer classes to career and GED training. CPC families had higher involvement through at least first grade. As shown in previous studies (Reynolds et al., Reference Reynolds, Temple, Ou, Arteaga and White2011a), parent involvement is a key reason why CPC has sustained effects on later achievement, school completion, and lower need for remediation and treatment.
4. P–3 can improve levels of student, family, and teacher engagement at multiple levels. As a comprehensive support system to promote a strong climate for participation, P–3 reforms can not only increase student-level attendance and reduce chronic absenteeism but help at the school level as well. Prior to the introduction of CPC-P–3 in 2012–13, CPCs had the lowest average daily attendance of all Chicago district preschool programs. This was due in part to the centers being located in the highest poverty areas. After the first year of Midwest CPC, they had the highest rate (including tuition-based pre-K). The introduction of full-day programs and the comprehensive set of services contributed (Reynolds et al., Reference Reynolds, Richardson and Hayakawa2014). These benefits carried over to the later grades. K–2 school-level attendance gains were 50 percent higher in CPC schools than in comparison schools. This is likely to be attributed to the established learning climate. P–3 strategies that are comprehensive in scope are more likely to affect the larger climate than reforms that are more narrowly focused on curriculum or professional development.
5. Progress monitoring leads to program improvements and better P–3 alignment. The evidence indicates that regular documentation of implementation of elements helps ensure that adherence to evidence-based elements is occurring. Because of such fidelity checks, changes can be made regularly and in a timely manner. This promotes better program effectiveness. Four tools were developed in the expansion to promote monitoring for improvement: observational assessment, brief teacher activity reports, and annual curriculum and parent involvement plans. The observational assessment measures classroom task orientation and student engagement. CPC classes were observed to have significantly higher levels of task orientation than comparison classes. These results enhance instruction and professional development. This ongoing process of monitoring for program improvement is beneficial for all types of programs yet most monitoring is for accountability, and is not frequent or in-depth enough to encourage program improvement. Greater comprehensive in monitoring requires additional resources for implementation and should be a built-in part of program management at the school level.
In conclusion, the findings of the implementation and impacts of CPC-P–3 provide a strong foundation for increased investment in scale-up and expansion efforts, especially in communities and schools serving large proportions of at-risk children. Readiness for dissemination occurs when programs have strong evidence and there is a system of services to support expansion and provide consultation. This is now available in the CPC program and can facilitate further scale-up to promote increased achievement.
Introduction
The first eight years of children’s learning experiences lay the critical cognitive, social, and emotional foundations on which the entirety of their future education rests. Children who do not have these in place by age 8 are at high risk of later educational failure and negative life outcomes. Fortunately, aligned, high-quality early education programs can narrow opportunity and achievement gaps while also raising the achievement and accelerating the developmental progression of all students.
Yet access to high-quality birth-to-third grade early education remains rare in the United States. Early childhood education programs are delivered through a patchwork of school-based, non-school-based, and home-based providers, many of questionable quality. The early education workforce is similarly variable in both quality and credentialing. For instance, most states require just a high school diploma for teachers of infants and toddlers. This is also true for pre-K teachers working in non-school settings and for directors of child care centers. Finally, all too often, infant, toddler, and pre-K programs feed into elementary schools led by principals who have limited experience with early education. As a result, many of their K–3 classrooms feature inconsistent instruction and learning environments that are ill-suited to meet youngsters’ needs.
Based on estimates from the National Institute for Early Education Research’s The State of Preschool 2014, only about 42 percent of 4-year-olds and 15 percent of 3-year-olds are served by public pre-K programs, including special education and the federal Head Start program (Barnett, Carolan, Squires, Clarke Brown & Horowitz, Reference Barnett, Carolan, Squires, Clarke Brown and Horowitz2015). Those enrollment figures do not account for the quality of programs in which children are enrolled. Even children who benefit from high-quality pre-K may lose the benefits of these programs when they continue into elementary schools where curriculum, instructional interventions, professional development, and assessments are not necessarily aligned with their pre-K experiences.
This fragmented system has produced dismal outcomes for children. Based on data from the National Assessment of Educational Progress (NAEP), known as “the nation’s report card,” just 42 percent of all American children read at or above the proficient level at fourth grade (National Center for Educational Statistics, 2013, p. 7). For children from low-income families, the percentage plummets to less than 20 percent (Guernsey, Bornfreund, McCann & Williams, Reference Guernsey, Bornfreund, McCann and Williams2014). For dual-language learners (DLLs), fewer than 10 percent are meeting expectations. While there is not a nationally comparable measure of children’s early reading skills, there are other worrisome data. According to seminal research by Betsy Hart and Todd Risley, children from families receiving public assistance hear as many as 30 million fewer words than their peers living in more affluent families (1995). Later studies have found disparities between young children from poor families and those from more well-off families as early as 18 months (Fernald, Marchman & Weisleder, Reference Fernald, Marchman and Weisleder2013).
Improving Reading Outcomes
Students who have weak literacy skills at third grade face a series of potentially damaging short- and long-term consequences. Many will repeat a grade and some will drop out of school. Worse still, when they reach adulthood, their lack of a high school diploma makes it more likely that they will face incarceration and become dependent on social supports (Lesaux, Reference Lesaux2010). To improve children’s literacy skills and close opportunity and achievement gaps, federal, state, and local policymakers, along with other stakeholders, have centered on third grade as a pivotal point in academic and life trajectories.
The low percentage of American fourth-graders who are proficient readers is the result of economic, health, education, and other factors. One key variable is that too many state and local education agencies (LEAs) lack a seamless, coordinated, high-quality birth-through-third grade continuum of learning. Meanwhile, progress at the state and federal levels to build a strong early “learning staircase” has been mixed (Bornfreund, McCann, Williams & Guernsey, Reference Bornfreund, McCann, Williams and Guernsey2014, p. 3). The focus on early literacy must begin much before third grade; ideally, it should begin at birth.
Nonie Lesaux, professor of education at Harvard School of Education, has made the case that isolated, compartmentalized policy reforms are insufficient for making sure children are on track in the pre-K–third grade years (2013). A comprehensive approach to literacy includes attention to a wide range of components, including: teacher preparation and professional development; early identification of struggling students and intervention to support their success; comprehensive and shared assessments; language-rich and engaging reading curricula; provision of pre-K and full-day kindergarten; and school–community–family partnerships.
In order to significantly improve children’s literacy development as well as learning and development across domains, federal, states, and local education agencies need to take a comprehensive, coordinated, and connected pre-K–third grade approach and use a long-term vision for this developmental period to provide a high-quality early education for each and every child.
History of Pre-K–Third Grade Approaches
Pre-K–3 is not a new approach to early education. Its origins date to the 1960s and 1970s with the Johnson Administration’s War on Poverty, which popularized the notion that education can lift Americans out of poverty. Head Start was created in 1965 to provide low-income families and their 4-year-old children with educational, health, and social services. However, a number of studies conducted over decades show that, although Head Start children displayed positive outcomes on early childhood metrics, academic gains fade during the first year of elementary school (Omwake, Reference Omwake1969; US Department of Health & Human Services, 2010). In 1967, President Johnson issued an executive order creating Project Follow Through, an effort to identify whole-school approaches to curriculum and instruction that maintained the academic gains children made in Head Start (Hirsch, Jr. et al., Reference Hirsch Jr., Apple and Rochester2005). As with Head Start, Follow Through was locally run, which allowed each community to develop its own model for instruction to fit the needs of its students (Meyer, Gersten & Gutkin, Reference Meyer, Gersten and Gutkin1983).Footnote 1
The Chicago Child–Parent Center Education Program (CPC) also started in 1967 as a comprehensive early education program to support children from low-income families who were not served by Head Start (Reynolds, Reference Reynolds2000; Sullivan, Reference Sullivan1971). The program provides 3- and 4-year-olds with a full day of pre-K. Parent engagement, including regular volunteering in the classroom, is a major component of the program. The original program followed a pre-K–3 model and provided key program elements such as reduced class sizes, low teacher:student ratios, and parent involvement throughout the early elementary school grades. Rigorous evaluations have found that CPC participation increases kindergarten readiness, improves high school graduation rates, and reduces crime (Reynolds et al., 2016a; Reynolds et al., 2011). In 2011, researchers at the University of Minnesota received a five-year grant from the US Department of Education to begin expanding the CPC program across the Midwest (Nyhan, Reference Nyhan2013, Reynolds et al., Reference Reynolds, Hayakawa, Candee and Englund2016b).
Two demonstration programs, developed in the following decades, provide useful insight into the potential value of investing in a pre-K–3 approach to early education. North Carolina’s Abecedarian Project (started in 1972; Campbell et al., Reference Campbell, Ramey, Pungello, Sparling and Miller-Johnson2002) included some elements of a strong PreK–3 model. The experimental program provided full-time, year-round education and care to low-income African American children from birth to age 5. A small number of children received extended family support in the primary grades (Graves, Reference Graves2006, Campbell et al., Reference Campbell, Ramey, Pungello, Sparling and Miller-Johnson2002). Those children had higher academic outcomes than children who only received support during pre-K (Graves, Reference Graves2006).
From 1974 on, the federal government established multiple programs to foster collaboration across child development programs and improve transition into public elementary programs. These include Project Developmental Continuity, the Head Start Transition Project, and the National Transition Study in the 1980s (Kagan & Neuman, Reference Kagan and Neuman1998). In 1990, Congress passed legislation to make the focus on transitions a more permanent part of Head Start’s model. The National Head Start/Public School Early Childhood Transition Demonstration Projection allocated grants to programs to continue providing social and health services for children and families. Preliminary qualitative findings on this program showed families had more positive adjustments to school (Kagan & Neuman, Reference Kagan and Neuman1998).
In part because of these early examples, pre-K–3 approaches have begun to take hold in communities across the country. For instance, New Jersey’s full-day, high-quality Abbott preschool program, which is aligned with full-day kindergarten and the later grades, has been found to improve student achievement well into elementary school (Barnett et al., Reference Barnett, Jung, Youn and Frede2013). Additional states and localities with promising pre-K–3 initiatives underway include: Seattle Public Schools; Boston; Minneapolis and St. Paul; and Lansing, Michigan, which adopted the First School model to reorganize elementary schools into pre-K–3 campuses (Manship et al., Reference Manship, Farber, Smith and Drummond2016). This list is growing, as new districts and organizations are realizing the value of a coordinated pre-K–3 continuum and beyond. Obama Administration efforts, such as the Race to the Top–Early Learning Challenge, have supported the growth of pre-K–3 strategies.
As the pre-K–3 approach gains traction with policymakers and educators, experts are also moving the early education field toward a stronger understanding of how to maximize these strategies’ effectiveness. In 2013, Kristie Kauerz, of the University of Washington, and Julia Coffman, of the Center for Evaluation Innovation, released their Framework for Planning, Implementing, and Evaluating PreK–3rd Grade Approaches, targeted at schools, local education agencies, early learning programs, and community partners.
State Pre-K–Third Grade Policies that Support Children’s Literacy Development
Effective early education policy approaches must combine targeted early literacy initiatives with policies that support, scaffold, and sequence children’s learning and development through third grade. New America recently completed a project to capture the range of current policies in this space (Bornfreund, Cook, Lieberman & Williams, Reference Bornfreund, Cook, Lieberman and Williams2015). The effort synthesized 2011–15 data on states’ pre-K–3 policies. It also sought to explore which of these policies help or hinder the ability of local education agencies, schools, and teachers to ensure that all children are on track to read on grade level by the end of third grade. The project covers seven areas: educators; standards, assessment, and data; equitable funding; state-funded pre-K; kindergarten; dual-language learners; and third grade reading laws.
These policy areas, discussed in more detail below, offer some insight into the kind of priorities state leaders are setting and the conditions they are putting in place for districts to meet students’ educational and developmental needs, particularly when it comes to literacy development in from pre-K to third grade. It is by no means an exhaustive list of important policies.
Educators (Teachers and Leaders)
Educator quality is the primary in-school variable affecting students’ academic and developmental growth (Weisberg, Reference Weisberg2009). Students who have an ineffective teacher multiple years in a row are doomed to fall further and further behind (Chetty, Friedman & Rockoff, Reference Chetty, Friedman and Rockoff2013). Unfortunately, children from low-income families and children of color are often assigned less effective or less experienced teachers (Murnane & Steele, Reference Murnane and Steele2007). Given what we know about the importance of meaningful interactions between students and teachers, this variation in quality is worrisome (Allen & Kelly, Reference Allen and Kelly2015).
Educator practice does not develop in a vacuum, however. It is shaped by each school’s particular context. Effective school leaders set expectations for teachers, provide support, and ensure coordination and collaboration within and across grade levels.
Various state policies also shape educator effectiveness. Relevant policies include teacher preparation and licensing, principal preparation and licensure, and educator evaluation. For example, prospective teachers’ coursework and experiences are driven by their state’s definitions of the teaching licenses they are pursuing. Most states offer both 1) an early childhood teaching license that begins at birth or pre-K and typically extends into the early grades of elementary school and 2) an elementary teaching license that begins at kindergarten or first grade and typically extends through fifth or sixth grade. While both licenses prepare prospective teachers for early grade classrooms, preparation can look very different depending on the track they are pursuing. Early childhood teacher preparation programs tend to place more emphasis on child development, family engagement, integrated curriculum learning strategies, and early literacy development. Elementary teacher preparation programs tend to place more emphasis on classroom management, teaching strategies better suited for the later grades, and content areas beyond literacy (Bornfreund, Reference Bornfreund2011).
By providing an early childhood license, prospective teachers who know they want to teach in early-grade classrooms can specialize in the ways that young children learn and develop as well as benefit from practical experience by working with younger children. An early childhood degree program and teaching license provides a path for teachers of infants, toddlers, and preschoolers to develop necessary knowledge and expertise and have opportunities to advance. This is critically important in an era of rising credential requirements for the birth-to-5 educator workforce. It is becoming more common for a BA to be the minimum qualification for entry into the profession. Head Start already mandates that at least 50 percent of teachers have a bachelor’s degree with an early childhood specialization; many state pre-K programs require the same. The recent Institute of Medicine report, Transforming the Workforce for Children Birth through Age 8: A Unifying Foundation, makes this a long-term goal for all lead teachers of children birth-to-8 (Allen & Kelly, Reference Allen and Kelly2015). According to the NIEER’s State Pre-K Yearbook (Barnett, Carolan, Squires, Clarke Brown & Horowitz, Reference Barnett, Carolan, Squires, Clarke Brown and Horowitz2015), 21 states and the District of Columbia require the lead teacher in a state-funded pre-K classroom to have a bachelor’s degree, but not necessarily a teaching license, regardless of whether she or he teaches in a public school or non-public school setting.
Outside of public school settings, policies also need to pay attention to the adults who are working with young children. It is essential that those lead teachers, assistant teachers, and program leaders have an understanding of child development and how to foster nurturing relationships and quality interactions with infants, toddlers, and preschoolers. States can establish requirements through child care licensing to help ensure that teachers of children at these stages have at least some specific training. As of 2011, only 19 states and the District of Columbia required lead teachers in child care centers to have more than a high school diploma (NACCRRA, 2013, pp. 188–189). What is especially worrisome is that 17 states do not even require teachers of younger children in center-based settings to have a high school diploma or GED at all. And states all but ignore assistant teachers, who spend significant amounts of time with children in early childhood classrooms.
Table 9.1 Do states require ECE training and/or licensure for pre-K–third grade teachers?
| Requires lead teachers in all state-funded pre-K programs to have a BA in ECE regardless of setting | Has an early childhood education license (for example, but not limited to: birth-to-third grade or pre-K–3) | Requires K teachers to have an ECE license |
| AL, AK, DC, GA, IL, KY, LA, ME, MD, MI, MS, MO, NE, NV, NJ, NY, NC, OK, RI, TN, WV, WI | AL, AK, AZ, AR, CO, CT, DE, DC, FL, HI, ID, IL, IN, IA, KS, LA, MD, MA, MN, MO, NE, NV, NH, NJ, NM, NY, ND, OH, OK, OR, PA, RI, SC, SD, TN, VT, VA, WA, WI, WY | AZ, CT*, DC, IL**, LA, MD, MA, MO, NY, ND, OH, OK, PA, RI, SC |
* ECE license only extends to K.
** In progress.
State policies for educators are not just about aligning licensure requirements with the ages of teachers’ students. To help ensure that elementary school teachers are well prepared to teach reading, many states require – either through coursework requirements or program standards – that preparation programs address five essential components of reading instruction: phonemic awareness, phonics, fluency, vocabulary, and comprehension. As of 2013, 25 states require teacher preparation programs to incorporate all five components (National Council on Teacher Quality, 2014, p. 33).
Table 9.2 For child care center licensing standards, what educational requirements do states require birth-to-5 educators to have?
| Require lead teachers have more than high school diploma | Require center directors have more than high school diploma | Require center directors have at least an AA in related field |
| CA, CO, CT, DE, DC, GA, HI, IL, MD, MA, MI, MN, NH, NJ, NY, PA, RI, VT, VA, WI | AL, AK, AZ, CA, CO, DE, DC, FL, GA, HI, IL, IN, IA, KS, LA, ME, MD, MA, MI, MN, MS, MO, NV, NH, NJ, NM, NY, ND, OH, OK, PA, RI, SD, TN, TX, UT, VT, VA, WA, WI, WY | DE, IN, PA |
Note: New Jersey requires center directors to have at least a BA, but it does not have to be in a field related to early childhood education.
Table 9.3 How do states help to make sure prospective teachers are prepared to teach reading?
| Require elementary school teachers to have preparation in five essential components of reading instruction | Require elementary school teacher candidates to pass a reading pedagogy test | Require ECE teacher candidates to pass a reading pedagogy test |
| AL, AR, CA, CO, CT, FL, GA, ID, IN, LA, MD, MA, MI, MN, MS, MO, OH, OK, PA, TN, TX, VT, VA, WA, WV | AL, CA, CT, FL, IN, MA, MN, MS, NH, NM, NY, NC, OH, OK, TN, VT, VA, WV, WI | AL, CT, FL, IN, MA, MN, NH, NY, OK, TN, VA, WV, WI |
Once teachers are prepared and credentialed to teach in pre-K–3 classrooms, they need principals who can effectively support them, providing feedback that can improve their practice. To do this well, elementary school principals, who in many cases have never taught in an elementary school, need to understand early child development to know what appropriate, content-rich instruction looks like in the early grades, so they can provide the right support for pre-K and early grade teachers (National Association of Elementary School Principals, 2014; Mead, Reference Mead2011).
Illinois is the only state that has made early childhood education a part of principal preparation. In 2010, the state redesigned accreditation for principal preparation programs, requiring that they offer early childhood content and field experiences to expose principals to pre-K–12 instructional activities. The state also intends to add early childhood content to its principal certification exam (NGA, 2013).
Five additional states (Iowa, Minnesota, New York, Oklahoma, and Vermont) require principals to have at least some coursework in child development as part of their school leadership preparation (Bornfreund et al., Reference Bornfreund, Cook, Lieberman and Williams2015). Coursework may seem like a natural policy target – requiring that principals receive instruction in child development topics might mean that they act on this knowledge – but simply imparting information does not mean it is acted on. The National Governors Association points out in a recent report that Illinois did not simply layer early childhood on top of existing principal preparation requirements. Rather, a goal of the change is to embed early education into administrator candidates’ coursework, field experiences, and licensure processes (NGA, 2013).
Leadership is essential in the elementary school, and also in early childhood programs serving infants, toddlers, and preschoolers. Directors of these centers are responsible for meeting requirements set by the myriad agencies they may be regulated by including child care licensing, Head Start, and possibly state-funded pre-K. They are also responsible for engaging and communicating with families, observing and developing teachers, and selecting curricula, assessments, and developmental and educational programming. It is unreasonable to expect that someone with no specialized knowledge or training could do these things well. Yet six states require center directors to have only a high school diploma. Only three states require at least an associate’s degree in a related field (NACCRRA, 2013). Very few states require more advanced training in either business management or instructional leadership.
Standards, Assessment, and Data
Aligned standards, assessment, and data are also key components of a strong pre-K–3 continuum. High-quality standards and aligned curricula across the domains of learning and development are essential for guiding curriculum and instruction. All states have standards for K–12 in at least English language arts (ELA), mathematics, science, and social studies. All states but two (South Dakota and Vermont) have early learning guidelines across multiple domains at least for pre-kindergarten. But while many states report having aligned their early learning guidelines with their K–12 ELA and math standards, there is reason to doubt whether this alignment is substantive enough to drive instruction in pre-K–3 classrooms (Bornfreund et al., Reference Bornfreund, McCann, Williams and Guernsey2014).
It is not enough to align state early learning guidelines with K–12 reading and math standards. Other developmental domains such as social-emotional learning should be included in standards for the early grades of elementary school. Studies have shown that students who have instruction in social-emotional learning have better academic performance and fewer negative behaviors than those who do not (Durlak, Weissberg, Dymnicki, Taylor & Schellinger, Reference Durlak, Weissberg, Dymnicki, Taylor and Schellinger2011). Several states include some social-emotional learning references in standards for various subject areas, but few have free-standing standards. According to a state survey conducted by the Collaborative for Academic, Social, and Emotional Learning, only six states (Idaho, Illinois, Kansas, Pennsylvania, Washington, and West Virginia) have free-standing social-emotional learning standards that include specific grade level indicators through at least third grade (CASEL, 2014).
To get a full picture of children’s learning and development as measured by state standards, policymakers and educators need comprehensive assessments, including screening, and diagnostic, formative, and summative tools. Capturing these data from the early grades and children’s experiences before they enter school is critical. Surprisingly, few states are able to do this fully, meaning basic questions about the children served with public dollars go unanswered (Early Childhood Data Collaborative, 2014).
Approximately half of children with developmental problems are not identified until they begin elementary school, even though intervening earlier is often more effective and more affordable in the long run. And while all children can experience developmental delays, low-income families and mothers with lower educational attainment are more likely to report developmental disabilities.
Both the CDC and the AAP recommend that all children be screened for developmental delays and disabilities at 9, 18, and either 24 or 30 months of age at well-child visits. Developmental screenings, however, do not necessarily need to be conducted by a physician; home visiting nurses, early educators, social workers, and even parents can screen children. Because of the significant percentage of children still not being identified early enough, and the fact that so many children are sent to child care, child care centers offer an ideal opportunity to reduce the numbers of children falling through the cracks.
Yet, no states require all licensed child care centers to conduct developmental screenings of children. Several states do, however, include screenings as an indicator in their quality rating and improvement systems. Delaware, for example, rates centers on the use of a developmental screener. Since Delaware provides higher reimbursement subsidies for higher-rated providers, the state’s support for screeners has material backing.
Developmental screeners are just the first critical assessments in an effective PreK–3rd grade approach to early education. Without diagnostic, formative, and summative tools, it is not possible for teachers, schools, districts, and states to capture and analyze children’s progress toward meeting standards. Early childhood assessments should include multiple domains of learning, including physical well-being, motor development, social and emotional development, approaches to learning, language and literacy development, cognitive development, and general knowledge (Snow & Van Hemel, Reference Snow and Van Hemel2008). Twenty-four states and the District of Columbia require that all state-funded pre-K programs use a multi-domain assessment of a child’s learning and development (Bornfreund, Cook, Lieberman, Williams, Reference Bornfreund, Cook, Lieberman and Williams2015).
Many states are at varying stages of implementing kindergarten entry assessments (KEAs) with an eye toward gathering better data. These assessments are typically given within the first two months of the kindergarten year to gauge students’ skills and knowledge as they enter their first year of traditional schooling. With incentives from the federal government through Race to the Top–Early Learning Challenge and the Enhanced Assessment Grant competition that focused on KEAs, many states are moving toward more multi-domain assessments. Sixteen states have fully implemented KEAs, and another 21 and the District of Columbia are planning, piloting, or implementing them in 2015–16. Beyond KEAs, few states have requirements or even provide recommendations on the kind of assessment that should be taking place in kindergarten, first, or second grade.
In recent years, states have made progress on developing more comprehensive and connected early childhood data systems – expanding their ability to link to other early childhood programs, other systems serving children, and K–12 longitudinal data systems. Around a quarter of states and the District of Columbia can link child-level data across the array of early childhood programs.
Twenty-nine states and the District of Columbia securely link data from at least some early childhood programs to the K–12 longitudinal system. Nine additional states are planning to link data in these systems at some point in the future (ECDC, 2014).
Table 9.4 States that offer recommendations or have requirements for pre-K–third grade assessment
| Requires multi-domain pre-K assessment for all state-funded pre-K programs and gives recommendations on type of assessment used | States without a KEA in some stage of development or implementation | States currently providing recommendations or requirements for K–2 literacy and math assessment |
| AL, AK, AR, CA, CO, DE, DC, GA, IL, IA, KS, KY, LA, MA, MI, MO, NE, NM, NC, OH, OR, RI, VT, WA, WV | CO, ID, KS, LA, MI, MN, MT, NE, NH, SD, TN, UT, WY | AR, IN, KY, MI, OH, TN, TX, |
Table 9.5 States that can link child-level data from early childhood programs to K–12 longitudinal data system
| Part C Early Intervention | Preschool Special Education | State Pre-K | State-subsidized Head Start | Federally Funded Head Start | Subsidized Child Care |
| CT, DE, DC, IA, KS, LA, MD, MN, MO, NE, OH, PA, WA, WI | AR, CT, DE, DC, FL, IL, IN, IA, KS, KY, LA, MD, MN, MS, MO, NE, NV, NJ, NM, OH, PA, RI, VA, WA, WI | AK, AR, CT, DC, FL GA, IL, IA, KS, KY, LA, MD, MO, NE, NV, NJ, NM, OH, PA, SC, VA, WA, WI | AK, CT, DE, DC, MO, NJ, PA | AK, AR, DE, HI, IN, MS, MO, NJ, PA | AR, CT, DC, HI, IN, MD, MA, MS, PA, SC |
Only one state, Pennsylvania, is currently able to securely link child-level data from each early childhood program and connect all of those programs to the K–12 longitudinal data system (Early Childhood Data Collaborative, 2014). Information about a child’s participation and experiences in child care, pre-K, or other programs can help state and local education agencies make decisions about current and future investments in early education policies and programs. And these data can help kindergarten teachers be better prepared to meet the needs of the youngsters entering their classrooms.
Equitable Funding
Strong educators and solid standards, curriculum, data, and assessments require appropriate resources. According to the 4th edition of the School Funding Fairness report, Is School Funding Fair? A National Report Card, states’ per-pupil expenditures in the K–12 system ranged from about $6,400 to $18,500 for 2012 (Baker, Sciarra & Farrie, Reference Baker, Sciarra and Farrie2015). State funding for education is generally distributed by formula. Many states use funding formulas that provide money based on the number of pupils in a district. These formulas are sometimes weighted based on the number of students with disabilities, the number of students living in poverty, or the number of students who are English learners.
The School Funding Fairness report also looked at whether states send more dollars to districts with higher concentrations of students living in poverty. At the local level, the primary funding source is property tax, which means that schools serving the nation’s most vulnerable children are often the least likely to have sufficient economic and non-economic resources to overcome the challenges they face (PreK Financing Overview, 2015). States can establish a formula that addresses these local inequalities. According to the analysis, in 2012, only 15 states had progressive funding distributions, meaning they provide higher-poverty districts (or schools) with more state resources. Meanwhile, 19 states had flat funding distributions, and 14 states had regressive funding distributions (Baker, Sciarra & Farrie, Reference Baker, Sciarra and Farrie2015).
Stable and equitable funding is also important for pre-K. States fund pre-K in a variety of ways, from general funds to money generated through tobacco and lottery taxes. Sixteen states and the District of Columbia pay for at least one of their state-funded pre-K programs through their core school funding formula, raising its profile by recognizing it as a part of children’s core education and provides more reliable funding (National Conference of State Legislatures, 2015). Funding pre-K through these formulas can take a number of forms. Some states apply their K–12 funding formula to pre-K (creating a true Pre-K–12 system). Other states weight pre-K more heavily, recognizing that quality pre-K requires higher per-pupil costs. Some provide a basic per-pupil rate for pre-K and then supplement with additional money for children with special needs. Other states set a cap for pre-K funding in the formula.
Table 9.6 Pre-K and K–12 funding in states
| States that fund at least one pre-K program through their school funding formula | States with a progressive funding distribution | States with a flat funding distribution | States with a regressive funding distribution |
| CO, CT, DC, IA, KS, ME, MD, MI, NE, NJ, NY, OK, RI, TX, VT, WV, WI | CT, DE, IN, LA, MA, MN, NE, NJ, NC, OH, OK, SD, TN, UT, WI | AZ, AR, CA, CO, FL, GA, ID, KS, KY, MI, MS, MT, NM, NY, OR, RI, SC, WA, WV | AL, IL, IA, ME, MD, MO, NV, NH, ND, PA, TX, VT, VA, WY |
Quality and Access in State-Funded Pre-K
If states and local education agencies are serious about improving children’s chances of reading on grade level by the end of third grade, then they will focus on what happens before students enter kindergarten. Increased national awareness of pre-K’s benefits for students has sparked efforts to expand access to public programs in several states and local communities. There are, however, big differences in the reach and quality of these programs. With limited state dollars to support early education, leaders often grapple with how to balance access and quality. There are quality indicators related to both a program’s structure and process that should be in place to help ensure maximum benefits for children (Yoshikawa et al., Reference Yoshikawa, Weiland and Brooks-Gunn2013).
Access
Forty-one states and the District of Columbia have some type of state-funded pre-K program and three more are planning programs with the help of the federal government’s Preschool Development Grant competition. As of 2015, just Idaho, New Hampshire, North Dakota, South Dakota, Utah, and Wyoming have no statewide programs. But even in those states, some local initiatives are underway. While the majority of states have programs, according to data collected by the National Institute for Early Education Research (2015), only nine and the District of Columbia serve more than 40 percent of 4-year-olds. Twenty-six states serve less than 20 percent of four-year-olds. Turning to 3-year-olds, only Vermont and the District of Columbia serve more than 25 percent of children. The District of Columbia is a strong example of broad access, providing pre-K for nearly 99 percent of 4-year-olds and 69 percent of 3-year-olds (Barnett et al., Reference Barnett, Carolan, Squires, Clarke Brown and Horowitz2015).
Quality
In addition to the educational requirements for teachers and assistant teachers, states set other expectations for state-funded pre-K programs. Whether or not states require programs to follow state early learning standards, establish limits for child:teacher ratios, and conduct site visits of programs can provide some insight on the level of quality in those programs. Based on information collected by NIEER, states are offering varying levels of structural quality. All of the 41 states and the District of Columbia with established state-funded pre-K programs have comprehensive early learning standards. More than half of the states with pre-K programs report alignment with the Common Core State Standards for the early grades of elementary school. For pre-K classroom ratios, NIEER recommends a ratio of no more than 10 children per adult. Of the 42 states with established programs, 36 meet this benchmark. But when it comes to monitoring, only 29 states conduct site visits to programs. In many states, site visits include structured observations of classroom quality and documentation of children’s learning. In others, visits are limited to reviews of program records (2015).
Provision of Full-Day Kindergarten
High-quality pre-K experiences are most impactful when followed by a strong, full-day kindergarten program to help sustain children’s pre-K learning. Yet in 35 states, children are not required to attend kindergarten at all, much less for a full day (Workman, Reference Workman2013). Five states do not require districts to provide kindergarten at all. To improve learning outcomes for all children, states must make quality in kindergarten a much bigger priority.
A strong full-day kindergarten program is a key component of the pre-K–3 continuum as it is the bridge of continuity in early elementary school. Some research shows that full-day kindergarten supports better academic outcomes than half-day kindergarten. Students who attend full-day also have better attendance in the primary grades and are less likely to be held back a grade or require remediation (Children’s Defense Fund, 2014).
Surprisingly, many states fund only a half-day of kindergarten, and in some cases kindergarten is funded at a lower amount than first grade (Workman, Reference Workman2013). This leaves districts that still want to offer a full-day kindergarten with the challenge of figuring out how to fund it. More than ten states allow districts to pass the cost onto families by charging tuition for full-day kindergarten. In many places, district leaders establish a sliding scale so that rates are based on family income. Still other states that may not require districts to offer full-day kindergarten fund it anyway. New Jersey and Wisconsin are two examples; this creates a financial incentive for districts to provide full-day kindergarten for all children even when it is not required for them to do so. Still, not requiring full-day kindergarten by law leaves it more vulnerable in challenging budget years.
Time alone, though, will not make a difference without solid, developmentally appropriate instruction and opportunities for learning. The difference between a half day and a full day is not just related to dosage, but also to how the time is structured. A full day should allow teachers to expand lessons beyond reading and math content and to provide time for child-directed learning, small-group activities, exploration and inquiry, and interactions between children – all of which are crucial in the early years of elementary school. While 11 states and the District of Columbia require that districts offer full-day kindergarten, “full day” is not necessarily equivalent to a full day in the first grade. Depending on the state, a full kindergarten day can range from about four to seven hours.
While all children can benefit from attending full-day kindergarten, it may be especially important for certain subgroups of children. Some research suggests that dual-language learners, for example, who attend full-day kindergarten do better on academic measures and are less likely to be retained in the early grades when compared to peers who attended only half-day programs (Cannon, Jacknowitz & Painter, Reference Cannon, Jacknowitz and Painter2011).
Table 9.7 State provision of full-day pre-K and full-day kindergarten
| Require districts to offer full-day kindergarten | Allow districts to charge tuition for full-day kindergarten |
| AL, AR, DE, DC, LA, MD, MS, NC, OK, SC, TN, WV | AZ, CO, ID, IL, KS, MA, MO, NV, NH, NJ, OH, PA, WA |
Dual-Language Learners
Some demographers have estimated that by 2030, nearly 40 percent of American students will speak a language other than English at home (Thomas & Collier, Reference Thomas and Collier2002, p. 10). This population shift will be seen in schools most significantly in the early grades. Unfortunately, state policies governing dual-language learner (DLL) identification, linguistic supports, and reclassification into mainstream English classrooms are frequently misaligned with current research on students’ academic needs.
Identifying and supporting DLLs as early as possible is important for their long-term success in both English and their other language. Yet only 15 states and the District of Columbia require state-funded pre-K programs to conduct screenings to identify children who are DLLs. While research is increasingly clear that the best way to support young DLLs’ academic growth, linguistic development, and English acquisition is by providing ongoing home language support at school alongside English exposure, six states (Arkansas, California, Arizona, Massachusetts, New Hampshire, and Tennessee) endorse “English-Only” instruction in one form or another. Only 21 states have family engagement laws or regulations that make any mention of families that primarily speak another language at home (Belway, Duran & Spielberg, Reference Belway, Durán and Spielberg2013).
As the English learner population continues to grow, it is increasingly likely that general classroom teachers will have students who need English acquisition support. General classroom teachers should be equipped with the knowledge and skills to provide DLLs with the linguistic support they need. Under federal law, local education agencies “must provide research-based professional development to any teachers, administrators, and staff who work with English language learners” (Education Commission of the States, 2014). Based on an analysis conducted by the Education Commission, few states require specialized training for regular classroom teachers beyond what the federal government requires. States such as Indiana, New Mexico, Pennsylvania, and Virginia have made it a licensing requirement, meaning that prospective teachers are required to have coursework on methods for teaching English acquisition. And resources matter. The overwhelming majority of states provide some funding to help meet the needs of English language learners, but four do not (Millard, Reference Millard2015).
Third Grade Reading Laws
Students’ reading proficiency in third grade is an effective predictor of their future academic success. Because of this, 36 states and the District of Columbia have laws aimed at supporting third-grade reading success. But to date, these laws have focused more heavily on intervention rather than prevention. Further, they often consider language and literacy development only after children have entered kindergarten, even though research clearly shows that language and literacy development prior to kindergarten are critical for later academic success.
Florida was among the first states to pass legislation, in 2002, to improve third graders’ reading proficiency and promote only those students scoring proficient on Florida’s third grade reading assessments. By 2015, 36 states and the District of Columbia had followed Florida’s lead passing similar laws aimed at improving students’ third grade reading. Of the states with these laws, 18 and the District of Columbia include a requirement to retain students who do not score at proficient levels on the state’s reading test (Workman, Reference Workman2014).
Table 9.8 State English learner policies
| Require state-funded pre-K programs to screen for dual-language learners | Have language instruction rules for state-funded pre-K programs | Mention of families that speak non-English language at home in family engagement laws or regs |
| AK, AR, CA, DE, DC, IL, ME, NJ, NY, OK, OR, RI, SC, TX, WA, WV | AK, AR, CA, DE, DC, GA, IL, IA, KY, LA, ME, MD, MI, MN, NE, NJ, NM, NY, OK, OR, SC, TX, WA, WI | AK, AZ, AR, CA, CT, FL, HI, ID, IL IN, MA, MN, NE, NJ, NM, NY, NC, RI, UT, WA, WI |
Barnett, W. S., Carolan, M. E., Squires, J. H., Clarke Brown, K. & Horowitz, M. (Reference Barnett, Carolan, Squires, Clarke Brown and Horowitz2015). The State of Preschool 2014: State Preschool Yearbook. New Brunswick, NJ: National Institute for Early Education Research; Bornfreund, L., Cook, S., Lieberman, A. & Williams, C. (Reference Bornfreund, Cook, Lieberman and Williams2015). From Crawling to Walking: Ranking States on Birth–3rd Grade Policies That Support Strong Readers. Washington, DC: New America.
The body of research on retention is somewhat clearer: it shows that retained students are generally no better off in the long-term. Several studies, in fact, show negative impacts for retained children (Jimerson, Reference Jimerson2001). For instance, 19 studies included in a meta-analysis indicate that retention is associated with dropping out of high school. Additionally, retention is also expensive for local education agencies, making it a questionable policy.
Beyond retention, state third grade reading laws have much in common. Most, but not all, states with these laws require annual reading assessments in K–3. Five states require assessment before kindergarten. Most laws include a mix of intervention strategies. The majority require intervention before third grade for students identified as struggling readers. Interventions required or recommended include things like creating academic improvement plans, establishing home reading programs, tutoring or instruction outside of school hours, and providing summer school. Some states require or recommend that schools hire a reading specialist who can provide more intensive instruction to students and/or coaching for general classroom teachers. Twenty-five states and the District of Columbia require parents to be notified about their child’s progress in reading (Workman, Reference Workman2014).
Of the 18 states and the District of Columbia that do require retention, some specify certain actions that districts or schools must take to support students in their retained year or to allow for an alternate pathway for grade promotion. It would make little sense to simply have students repeat a grade without making modifications that could help produce different results. Reflecting this idea, five states require that students who are held back have a different teacher. Eleven states and the District allow students to be promoted if they participate in an intervention such as summer school and 19 include exemptions, but these vary greatly across states. Most states provide for certain students to be exempt from retention. These laws do focus attention on third grade reading, but they alone will not ensure all children are on the path to being strong readers in third grade. That requires a more comprehensive approach to children’s early education and development.
Table 9.9 State third-grade reading policies
| States with third grade reading laws | Require students to be retained if they do not attain a proficient score on the state’s third grade reading test | Provide an opportunity for promotion if student participates in an intervention |
| AK, AZ, AR, CA, CO, CT, DE, DC, FL, GA, ID, IN, IA, KY, LA, MD, MN, MS, MO, NY, NC, ND, NM, NV, OH, OK, RI, SC, TN, TX, UT, VT, VA, WA, WV, WI, WY | AZ, AR, CA, CT, DC, FL, GA, IN, IA, MD, MS, MO, NV, NC, OH, OK, SC, TN, WA | AZ, CA, CT, DC, IN, IA, MD, MO, OH, OK, SC, TN, WA |
Implications for State Policy
Each of these policy areas is important on its own, but the most powerful impacts will take form when they are considered together. Policies exist in context. Investing in or addressing bits and pieces of a pre-K–3 approach will not result in sustained gains for all children. What is necessary is a coherent and connected set of policies that flow and fit together.
Most states are far from unified alignment. From Crawling to Walking shows that states are at very different levels of progress toward a set of strong pre-K–3 policies that establish promising conditions at the local level. Several states are tackling pieces of the pre-K–3 approach fairly well. But real progress will occur when states begin to knit those discrete policies together.
Equally important to the structure of state policy is how those policies are implemented by communities, public schools, and local education agencies. Understanding the implementation of these laws and how they do or do not fit together is an area for future research. State education agencies and other related entities as appropriate should work with experts and practitioners to help think through implementation; pilot initiatives in different communities; and evaluate the success, failure, and potential consequences of those efforts, establishing a feedback loop that will provide important information for making necessary changes.
Without coherent and connected pre-K–3 policies, it will be much harder to ensure that the gains children make in pre-K programs are sustained and built upon in kindergarten, the early grades, and beyond.