
The previous chapter demonstrated that increased Republican Party control of the federal government results in higher levels of social tax expenditures at the expense of public spending for social programs. A major implication of these results is that changes to political party control determine whether the government increases financial aid for public versus private social assistance and by extension which populations receive more federal support for their social benefits and services. Yet these first-order effects are not the only major consequences of changes in the modality of federal social spending. I argue that social policy not only bestows tangible benefits to certain groups (such as a retirement account or health insurance) but also takes money from one socioeconomic group and gives it to another, creating redistribution effects. The increased use of public social spending produces progressive income redistribution effects that help the working class, and, conversely, a growth in tax expenditures regressively distributes federal money to wealthier families. Therefore, changes in the modality of social spending not only produce first-order effects for the provision of social benefits but also create second-order effects that determine the government's role in redistributing national income and by extension the level of income inequality.
So how do changes in social spending impact the level of income inequality in America? In this chapter, I explore the evidence for the divergent income distribution effects of public social spending versus social tax expenditures, and test in a dynamic model the impact of changes to the social expenditure ratio on the level of income inequality. I expect that when the federal government shifts tens of billions of dollars between the two sides of the divided social state from one year to the next, there will be a noticeable impact on changes to the ratio of national income share between the wealthiest and poorest Americans in both the short and the long runs. First, I examine the differences between Democrats and Republicans on the issues of income inequality and income redistribution. Second, I review the research and findings on the rise of income inequality in the United States over the last forty years. Third, I examine the recent literature on the role of political factors in contributing to increases in the level of income inequality. Next, I revisit the model of political parties, social spending, and income inequality and connect my theoretical argument to recent studies that establish opposing income redistribution effects for public social spending and tax expenditures. Finally, I analyze the relationship between federal social tax expenditures and variations in the level of income inequality over time. My results show that as social tax expenditures become a larger proportion of federal social spending there is a corresponding increase in the ratio of income share controlled by the wealthiest households.
Income Inequality in America
An analysis of the partisan differences over rising income inequality is necessary to understand why Democrats and Republicans select different social spending mechanisms with divergent distribution effects. On September 17th, 2011, an estimated group of 1,000 citizens gathered together at Zuccotti Park in New York City (in what later became known as the Occupy Wall Street movement) to protest against rising income inequality and its effect on American politics. Occupy Wall Street (OWS) protesters called attention to the disproportionate power of large corporations in the political process, and, in particular, the excessive influence of the financial sector on shaping federal policy. The Occupy Wall Street movement adopted the slogan “We are the 99%,” which highlighted the changes in the national income share between the top 1 percent of income earners and the rest of the country. Soon after the initial protest, the national media started to cover the NYC protests and similar protests around the country and around the world. The spread of OWS protests and the intense media coverage that followed moved income inequality to the front and center of the national political agenda, and consequently, revealed the stark differences between the Democratic and Republican parties on the role of government in assuaging the growing income gap in the United States.
In the months after the OWS protests, Republican leaders scrambled to offer a response to the public's growing concern about income inequality in ways that meshed with their members’ ideology. Republican House Speaker John Boehner even went so far as to say that he “understood people's frustrations (with rising inequality)” and House Majority Leader Eric Cantor scheduled a major speech on income inequality at the University of Pennsylvania (it was eventually canceled due to the threat of OWS protests). The long-held Republican policy positions of lower taxes, private-sector solutions, and support for business did not lend themselves easily to offering solutions to rising income inequality. While some Republican members tried to shoehorn inequality into their existing legislative strategy, other party members rejected the issue outright. Republican Steve LaTourette, representative from Ohio, when asked about income inequality, replied that “it's redistribution of wealth – which is socialist, which is communist and all of that – but I do think that when you pit millionaires and billionaires against everyone else, that's a nice populist message, and we've got to get our hands on it” (Cogan and Sherman Reference Cogan and Sherman2011). The 2011 Republican House budget reflected the party's ideological position (and reluctance to directly address income inequality) by proposing lowering both corporate and marginal income tax rates while cutting public social spending and converting Medicare into a federal subsidy program for private health care insurance. President Obama during this time period sought to link his economic policies (and by extension the Democratic Party) with the related goals of reducing inequality, and restoring upward mobility for the working class. In a major 2011 economic speech, President Obama argued,
for the top one hundredth of 1 percent, the average income is now $27 million per year. The typical CEO who used to earn about 30 times more than his or her worker now earns 110 times more. And yet, over the last decade the incomes of most Americans have actually fallen by about 6 percent. Now, this kind of inequality – a level that we haven't seen since the Great Depression – hurts us all.…Inequality also distorts our democracy. It gives an outsized voice to the few who can afford high-priced lobbyists and unlimited campaign contributions, and it runs the risk of selling out our democracy to the highest bidder. Obama 12/6/11.
So while no political party is supportive of rising income inequality, the Democratic Party's platform lends itself more easily to rallying its base around federal policy solutions such as raising taxes on the rich and providing more income redistribution to the poor. In the year leading up to the 2012 election, President Obama highlighted his administration's effort to raise taxes on the very rich as a means to pay for more benefits for the middle class and poor. President Obama's stump speeches emphasized how his administration curbed the worst practices of Wall Street, passed a health care bill that raised taxes on the rich to pay for health care insurance for the poor, doubled the number of Pell Grants (college assistance for needy students), and passed a law that required equal pay for equal work for women. President Obama often combined these policies under the framework of addressing the problem of income inequality, even going so far as to claim the growing income gap was “the defining issue of our time” in his 2012 State of the Union (SOTU).
In the year running up to the 2012 election, Democratic Party leaders, in particular President Obama and Senate Democrats, used the increased attention surrounding the issue of income inequality to continually bring up “wedge” issues that forced Republicans to vote for either increased taxes on the very rich or increased spending for the poor (the two most direct policy mechanisms for addressing the income gap). Democrats in Congress proposed a number of bills that would raise taxes on millionaires and allow the Bush tax cuts to expire on the wealthiest households (those making more than $250,000 a year). One piece of legislation designed to draw a contrast between the two parties’ positions on inequality was the Democratic proposal for creating a “Buffett rule” for effective marginal tax rates (effective rates are what taxpayers actually pay the government once all their tax expenditures are netted out). The “Buffett rule” would create a minimum 30 percent tax rate for citizens making over a million dollars a year (this is named after famed billionaire Warren Buffet who argued that he should not pay a lower effective lower tax rate than his secretary). As reported in Politico, Democratic Senator Charles Schumer argued that pushing the “Buffett rule” was a sound political strategy since “it is an emerging contrast with Republicans. We think the wealthy should share even more of the sacrifice” (Weisman 2012, Wong Reference Wong2012). While the Democratically controlled Senate passed a bill with a “Buffett rule” that would have raised taxes on the richest households, generating an additional $47 billion in federal revenue, the Republican House voted down the “Buffett” measure and passed its own bill, which included a 20 percent decrease in taxes on small businesses. Some Democrats on the campaign trail discussed the partisan differences in addressing income inequality by highlighting the vote on the “Buffett rule” along with other unpopular Republican votes on allowing payroll taxes to rise, voting against raising the minimum wage, and cuts to the food stamp program. This collection of votes was purposely put on the agenda by Democrats to put Republican legislators on the defensive concerning the issue of inequality in the run up to the 2012 Presidential election.
In the 2012 election, Governor Romney's personal background along with his selection of Representative Paul Ryan as his vice presidential candidate reinforced the public's perception of the Republican Party as the party of the rich. Governor Mitt Romney, the Republican candidate for president, reported a net worth of $250 million and made his fortune through the private equity industry. The media attention surrounding Romney's untactful portrayal of who benefits from federal policy at a fundraiser (i.e., 47% of people pay no income taxes and are dependent on government programs) was coupled with stories about the low tax rate Governor Romney paid in 2011 (around 14%). Governor Romney's background story made any attempts by the Republican Party to convincingly propose programs that would help the middle and working classes more difficult. On the campaign trail when asked about the political relevance of income inequality, Governor Romney declared that this topic was about the politics of “envy” and “class warfare” and that it should only be discussed in “quiet rooms.” Next, the vice presidential nominee Representative Paul Ryan was the chief architect of the Republican budget proposal that would reduce marginal tax rates for wealthier individuals and corporations, and pay for it by drastically reducing federal social spending on Medicaid, college assistance, and food stamps. Democrats called Ryan's budget the “reverse Robin Hood” plan. Other Republicans sought to blame the federal government for inequality and offered up private market solutions to the growing income gap. Republican Congressman Bill Flores, for example, when asked about income inequality, responded, “absolutely, there's huge income inequality, and it started right here in Washington. The way we fix that is getting the government out of the way of the private sector so we can put these people to work” (Cogan and Sherman Reference Cogan and Sherman2011). All total, the perception of the two political parties is that federal money will be filtered down to the working class under Democrats and transferred up to the rich by Republicans (Bartels Reference Bartels2008).
As Democratic and Republican policymakers have revealed divergent public positions on the importance of income inequality as a political issue, partisans in the electorate have followed suit. In particular, a number of studies have shown that Democratic voters consider income inequality to be an important issue and react more negatively to policy that distributes federal money to wealthier citizens (Bartels Reference Bartels2008, Faricy and Ellis Reference Faricy and Ellis2014, Page and Jacobs Reference Page and Jacobs2009). According to a report from Politico, a poll taken during the height of the Occupy Wall Street movement revealed that more than three times as many Democrats as compared to Republicans considered income inequality to be an important political issue facing the nation (Mak Reference Mak2011). A more recent study shows that while similar numbers of Democrats and Republicans recognize that income inequality has grown over the last decade (68% and 61% respectively), there is a partisan division on whether or not the government should actively work to reduce the income gap. The study finds that 90 percent of Democrats say the government should do some or a lot to reduce inequality compared to only 45 percent of Republicans who wanted government action on the issue (Pew Research Center 2014). When pressed in the survey about possible policy actions that could be used to address income inequality, it is not surprising that Democrats and Republicans disagree on the best course of action. Democrats were twice as likely as Republicans to favor raising taxes on the wealthy to pay for programs for the poor and Republicans were three times more likely to favor lowering taxes on the wealthy and corporations (Pew Research Center 2014). In short, while partisan voters do not differ on recognizing growing income inequality, they differ on the importance of inequality as a political issue and their preferred policy prescriptions for addressing income inequality.
Trends in U.S. Income Inequality
Even though the rise of income inequality in America is – by now – well documented, it is worthwhile to revisit the basic facts. There are many ways to measure income inequality yet by any measure available, the gap between the rich and poor has widened over the last four decades (Piketty Reference Piketty2014, Piketty and Saez Reference Piketty and Saez2003, Reference Piketty and Saez2006, Neckerman and Torche Reference Neckerman and Torche2007). Inequality has increased whether measured in pre-tax or post-tax dollars, whether or not capital gains are included, and whether measured in terms of income or wealth. During the period of this study, the Gini coefficient in the U.S. rose from 0.394 in 1970 to 0.469 in 2010.Footnote 1 Since 1970, income inequality in the United States has risen each consecutive year except for the recession periods of 1990–1991, 2001, and 2007. The following sections present evidence and analysis of growing income inequality in America, including a focus on the unique role of gains made by the top 1 percent of income earners and a comparison of income inequality across countries.
Income inequality has been driven largely by the dual trends of extraordinary income gains by the wealthiest households and decreasing income shares for middle- and working-class American families. The U.S. Census rank orders all households by income from highest to lowest, and then divides the households into five cohorts or quintiles (from highest to lowest income). If total income for the population were evenly divided, then each quintile (from the bottom 20% of income earners to the top 20% of income earners) would account for 20 percent of the total income. Therefore, the degree to which each income cohort is above or below a 20 percent share of the total serves as a measure of income inequality. Figure 6.1 displays the share of household income held by each income quintile – in twenty-year snapshots – from 1969 to 2009.

Figure 6.1. Percentage change in after-tax income across quintiles, 1979–2007.
As Figure 6.1 shows, national income has become more unevenly distributed over time, with the greatest shares going to the wealthiest Americans. The after-tax income gains grow not only with each step up the income ladder but, within the top quintile, triple-digit gains are reserved for those at the very top of the income distribution scale. In 1969 the bottom 80 percent of households earned 57 percent of the nation's income while the top 20 percent controlled 43 percent of national income. By 2009, the wealthiest families saw their share of national income rise by seven points to 50.3 percent while the bottom 80 percent lost seven points of their average income shares. The families in the top quintile of income have not controlled this much of America's wealth since 1928 (U.S. Census 2010). And while households in the top quintile have experienced large income gains, their gains pale in comparison to those in the top 1 percent.
The Top One Percent
The rise of income inequality is not just attributable to changes in the top income quintile; the top 1 percent's income gains has driven the growth of U.S. income inequality. Figure 6.2 shows the change in the share of national income between the bottom 90 percent of income earners and the top one percent in two periods: 1945–1970 and 1971–2010.

Figure 6.2. Changes in national income share between the bottom 90 percent and the top 1 percent.
In 1945, the bottom 90 percent started out with just over two-thirds of the nation's income and that share grew to just under 70 percent by 1970. Conversely, the top one percent lost share of the national income going from 11.2 to 7.8 percent in the same twenty-five-year period. The postwar period was known for widely distributed income gains among the population, and this period also coincided with President Johnson's Great Society programs. However, the majority of the country (the bottom 90 percent) lost out during the last forty years, going from controlling around 70 percent of the national income to around 53 percent. The top 1 percent went through a boom period, more than doubling their portion of the national income from just under 8 percent to a 17.4 percent share. In fact, in the decade before income inequality started to rise, from 1960 to 1970, over 60 percent of the national income gains went to households in the bottom 90 percentile while only 11 percent accrued to the wealthiest 1 percent. This rate of income growth was reversed during the Bush presidency from 2002 to 2007, where the top 1 percent received over 60 percent of the total income gain while the bottom 90th percentile of households took in under 13 percent (Stone et al. Reference Stone, Shaw, Trisi and Sherman2012).
A number of economic studies have found that the largest income gains have been within the exclusive territory of the top one percent. For example, according to a report from the Congressional Budget Office (CBO),Footnote 2 between 1979 and 2005 the bottom half of the top 1 percent experienced an income increase of 105 percent. The next highest four-tenths of the top 1 percent witnessed its real income rise 161 percent. Next, the top one-tenth of one percent had its inflation-adjusted income rise an astounding 294 percent. Finally, the top one one-hundredth of one percent, approximately 11,000 families, had a real income increase of 384 percent. Thomas Piketty and Emmanuel Saez (Reference Piketty and Saez2003, Reference Piketty and Saez2006) demonstrate in a series of articles, using income data from IRS returns, that income gains by the top wage earners (within the top one percent) decreased in the period after World War II but rose sharply starting in the mid to late 1960s. Piketty and Saez examine changes in the income share for those households at 99th, 99.5th, 99.9th, and 99.99th percentile levels. They show that families in the 99.99th percentile saw their share of national income increase five-fold over a forty-year period (0.55 to 3.34) compared to the 99th percentile, who more than doubled their share of national income from 8.02 to 18.29. Not only have the wealthiest households enjoyed larger income gains than the rest of America; the richest American families have experienced the largest income gains in the Western world.
An International Comparison of Income Inequality
The current level and rapid escalation of income inequality in the U.S. stands out among the wealthy, industrialized nations in the world (Brandolini and Smeeding Reference Brandolini and Timothy2006, Leigh Reference Leigh2007, Pontusson and Kenworthy Reference Pontusson and Kenworthy2005). According to the most recent data from the OECD, the United States has the highest level of income inequality in the post-industrial world. In fact, U.S. inequality level is seven percentage points higher than the European average (Luxembourg Income Study 2013). In another measure of international income inequality from 2010 – the ratio of income of households in the 90th percentile compared to the average income of those families in the 10th percentile – the United States reports a ratio that is more than double any other wealthy nation (Luxembourg Income Study 2013). In research on international income inequality, the United States reports a greater level of income inequality compared to every Western European country in both the pre- and post-tax estimates.Footnote 3 In a study from Pontusson and Kenworthy (Reference Pontusson and Kenworthy2005), ten of eleven industrialized countries experienced increased income inequality during the 1980s and 1990s, and nine of these countries responded with more assertive distributive social policies at the end of the period. The United States was not one of these nations.Footnote 4
Figure 6.3 compares the change in the share of national income of the top 10 percent of income earners across six countries. The six countries represented in the figure are the United States, France, Canada, Sweden, Denmark, and Norway. The American wealthy started this period in the middle of the pack but experienced larger income gains over the forty-year period compared to their European counterparts. In 1970, the top 10 percent in the United States accrued around 31 percent of the nation's income, which was lower than the income share of the wealthiest families in Canada, Denmark, and France. Over time the wealthiest households in the United States experienced larger and larger gains and by 2010 this group controlled over 46 percent of the nation's income. In comparison, the top 10 percent of income earners lost national income share in Denmark and France during this same period. And although many countries have experienced increases in income inequality, nations with more traditional social welfare states that progressively redistribute money have much lower levels of comparative income inequality (Saez and Veall Reference Saez and M.S. Veal2005).

Figure 6.3. An international comparison of the top 10 percent of income earners, 1970–2010.
The Politics of Income Inequality
What has caused the recent rise in income inequality? Economic and sociological research have unearthed numerous causes that range from increased globalization to changes in technology to changes in the family structure to disparities across workers’ education and skill level, and including the diminished power of labor unions (Cashell Reference Cashell2009, Gustafsson and Johansson Reference Gustafsson and Johansson1999, Levy and Murnane Reference Levy and Murnane2001, Alderson and Nielsen Reference Alderson and Nielsen2002, Golden and Wallerstein Reference Golden, Wallerstein and Brady2011). Recently, political scientists have turned their collective attention to examining the relationship between politics and income inequality. In 2004, the American Political Science Association's (APSA) Task Force on Inequality and American Democracy released a report that chronicled how political behavior, political institutions, and public policy affect income inequality and how, in turn, the rise of income inequality has influenced the quality of democracy. More recent scholarship has provided evidence that political party control of government, mass public opinion, and changes to public policy have contributed to growing income inequality in the United States (Bartels Reference Bartels2008, McCarty et al. Reference McCarty, Poole and Rosenthal2006, Kelly Reference Kelly2009, Hacker and Pierson Reference Hacker and Pierson.2010, Gilens Reference Gilens2012). The following sections describe how political parties use changes to public policy as a means to distribute income and, in turn, influence the level of national income inequality.
Republicans and Democrats have produced divergent patterns of income growth over the last fifty years. Specifically, Democratic presidential administrations correlate with greater income gains for the working class and Republican presidential administrations produce greater income growth for the wealthy (Hibbs Reference Hibbs1987, Bartels Reference Bartels2008, Kelly Reference Kelly2009). Early work from Douglas Hibbs (Reference Hibbs1987), which examined income trends from 1948 to 1978, found that income inequality decreased on average by 25 percent during periods of Democratic control of the White House and remained relatively unchanged under 17 years of Republican executive power. These same partisan patterns of income distribution are evident in more recent studies on the politics of income inequality. Bartels (Reference Bartels2008) examines change in the income ratio between those households in the 80th percentile of distribution (the wealthiest 20 percent of families) and those in the 20th percentile (the poorest 20 percent of families) from 1948 to 2005. Income inequality went up under six Republican presidents and down under four out of five Democratic leaders. This same study argues that applying consistent income growth patterns experienced under Democratic presidents every year from 1948 to 2005 would almost have negated the real rise in economic inequality over five decades. Conversely, Bartels (Reference Bartels2008) shows that the application of Republican income growth patterns during the last fifty years would have resulted in 80 percent more growth in U.S. income inequality. In addition, Kelly (Reference Kelly2009) examines roughly the same time period (1947–2000) and tests the relationship between partisan control and two forms of income inequality: pre-tax income (income prior to taxes and spending) and post-tax income (pre-tax income plus income from government redistribution). He finds that Democratic presidents reduce overall income inequality through changes to pre-tax income distribution and – to a lesser extent-explicit redistribution through public policy.Footnote 5 Altogether, the literature shows that working class families experience a rise in their income levels during Democratic administrations and wealthier families fare better under Republican presidents.
How do Democrats and Republicans use public policy to produce divergent patterns of income distribution? The majority of evidence, to date, finds that political party control of the federal government has the largest impact on income distribution through influences to the overall economy. In particular, the two major political parties advance opposing fiscal policies that result in different consequences for the macroeconomy and, by extension, income inequality. Historically, Democrats in office have pursued higher taxes on the wealthy and full employment policies that have resulted in patterns of income redistribution that accrue more resources to the working class. For example, from 1948 to 2001, the average unemployment rate was 30 percent lower and economic growth 40 percent higher under Democratic presidents than Republican presidents (Bartels Reference Bartels2008). During this period, as GDP grew and unemployment went down, the working and middle classes experienced more of the nation's income growth. Another study found similar evidence in that Democratic administrations reduced the ratio of pre-tax income inequality (the pre-tax income shares going to the top 20 percent versus the bottom 40 percent of the income distribution), while Republican presidencies corresponded with years of increased pre-tax income inequality (Kelly Reference Kelly2009). Therefore, Democratic administration fiscal policies that bring about higher levels of GDP growth and lower levels of unemployment account for most of the recent decreases in pre-tax income inequality and the majority of change in the total level of income inequality (both pre- and post-tax and transfer). However, these studies operationalize policy mainly through changes in public spending and therefore do not account for the myriad of changes in tax policy that may have impacted changes in the national income distribution.
Republican administrations have enacted fiscal policies that focus on lowering inflation and decreasing taxes, especially for wealthier individuals, and the cumulative effects of these policies are to distribute money up the income ladder (Hibbs Reference Hibbs1987, Bartels Reference Bartels2008, Kelly Reference Kelly2009). Hibbs (Reference Hibbs1987) argued that Republicans accepted lower economic production and growth as a means to fight potential expansions of inflation. He theorized the Republican economic strategy reflected, in part, their electoral goals since wealthier families obtain a significant portion of their wealth from capital and assets and these forms of wealth are eroded by high levels of inflation. In support of this idea, Bartels (Reference Bartels2008) found that inflation rates grew at a slightly slower pace under Republican presidents (as opposed to Democratic presidents) from 1948 to 2005. While political parties have been found to predominantly influence income distribution indirectly through fiscal policy, they also can more directly affect changes in income inequality through social policy. In the next section, I examine the income distributive effects of public social spending (favored by Democrats) and social tax expenditures (preferred by Republicans).
How Public Spending and Tax Expenditures Affect Income Inequality
The relationship between social policy and income inequality can only be fully understood by accounting for both public social programs and private welfare. Studies of changes in public social programs and income inequality only explain how changes in federal spending impact families at the lower end of the income distribution. And while studies of how government activity determines the income of poor families are important, there are areas of social policy that influence the income of wealthier families too. The particular rise of American income inequality has been driven by the large income gains going to the top 1 percent, and, therefore, the following analysis of social tax policy, is well suited to measure the impact of politics and policy on changes in inequality. Federal subsidies and tax expenditures are known to distribute more money, on average, to wealthier families than they do to middle- and working-class groups. While a number of studies have shown that Republican Patry power produces increases in income inequality, the particular policy mechanisms through which this occurs remain enigmatic. The federal government spends hundreds of billions on social tax subsidies every year resulting in wealthier families receiving tens of thousands and sometimes even hundreds of thousands in government funds. If there is going to be a systematic relationship between public policy and changes to income inequality, it is most likely to be found through an examination of the tax code.
Earlier, I theorized that political parties use the distributive effects of policy to target benefits to their constituencies and move the ideological direction of public policy. The partisan use of a public policy's distributive effects has been made possible due to an increasingly divided mass electorate along the lines of partisanship and income class (McCarty et al. Reference McCarty, Poole and Rosenthal2006). While a citizen's party identification has not always been related to class, over the period of this study more working-class citizens have become Democratic Party supporters while wealthier voters have aligned with the Republican Party. The major implication of this bifurcation is that political parties can deliver federal money to their constituencies by changing the direction of national income redistribution. These redistributive effects are especially important in that the socioeconomic groups that Democrats and Republicans want to target, the rich and the poor, are often not very popular with the public (Gilens Reference Gilens1999, McCall Reference McCall2013). Therefore, a political party can create programs for popular social goals such as home ownership and target money to the very wealthy through second-order distributive effects without worrying about public backlash given the information asymmetry between policymakers and the public.
In the following sections, I examine the literature on the distributive effects of public social spending and social tax expenditures. I establish that federal spending for public social programs, both means and non-means tested, progressively redistributes federal income. In contrast, tax expenditures, in general and those explicitly designed for private social programs, distribute income from all taxpayers toward wealthier households. I argue that political parties know and take into account the divergent distributive effects of public spending versus social tax expenditures when deciding changes to social policy and that these divergent distributive effects are observable when evaluating fluctuations in the distribution of national income.
The Progressive Distributional Effects of Direct Social Spending
The main objective of public social programs is to provide citizens with social insurance, services, or benefits. A secondary effect of government social spending is the redistribution of federal income down the income ladder to poorer families. Public social programs collect revenue from federal taxes (payroll and income) and then redistribute a disproportionate amount of financial benefits to middle- and working-class families. For example, Kelly (Reference Kelly2009) finds that the combined income effect for all federal social programs reduced income inequality by around 14 percent. Additional studies have found similar results; Hungerford (Reference Hungerford2009) found that the combination of government social programs and the progressive income tax structure reduces the Gini coefficient by around 16 percent. Therefore, as spending on public social programs goes up, the level of national income inequality goes down (Bartels Reference Bartels2008, Kelly Reference Kelly2009, Cashell Reference Cashell2009).Footnote 6 The majority of public social programs that are means tested, such as Medicaid, welfare, and food stamps, are directly designed to provide financial assistance to the poor. Means-tested social programs take the level of family income into account when determining the eligibility and sometimes the generosity of a program's benefits. The program means test is used to deny benefits to families that have sufficient income to provide themselves economic security. These programs have relatively small annual budgets (outside of Medicaid) and rather obvious progressive redistributive income effects.
There is a socioeconomic division between who receives means-tested federal health insurance and those employees who enroll in the employment-based health system. Table 6.1 compares the recipients of Medicaid to those of employment-based health care insurance across employment status, income level (as measured by a household's position above the federal poverty line), gender, and race. Each category represents the rate of coverage in percentage terms. Medicaid is a joint federal–state health insurance program that is means tested for families and individuals with low-income who cannot afford other sources of health care insurance. As is to be expected, Medicaid covers more disadvantaged groups and those households that are better off enroll at higher rates in the employment-sponsored health care structure. Households in which no one works and that are closest to the federal poverty line (under 100 percent) have rates of Medicaid use over 40 percent. In comparison, full-time workers who earn income well above the poverty line (400 percent or higher) are enrolled at the highest rates in the employment-based system. While there are not substantive gender differences, racial minorities benefit more from Medicaid than do whites, while the opposite is true in the private health care system (although more racial minorities enroll in private plans at higher rates than Medicaid).
Table 6.1. A Comparison of Medicaid Recipients and Employment Beneficiaries, 2010
| Medicaid | |||
| By Employment | Full Time | Part Time | Non Worker |
| 11% | 29% | 41% | |
| By Income (FPL) | Low | Middle | High |
| 43% | 18% | 2% | |
| By Gender | Female | Male | |
| 18% | 16% | ||
| By Race | White | Black | Hispanic |
| 12% | 29% | 27% | |
| Employer-Based | |||
| By Employment | Full Time | Part Time | Non Workers |
| 68% | 27% | 15% | |
| By Income (FPL) | Low | Middle | High |
| 14% | 48% | 86% | |
| By Gender | Female | Male | |
| 57% | 56% | ||
| By Race | White | Black | Hispanic |
| 65% | 42% | 37% |
All total, more vulnerable populations rely on and are served by Medicaid while wealthier workers who are in privileged positions in the labor market reap the benefits of the tax expenditures that subsidize employer-provided health care and pensions. Yet even large, non-means-tested social programs targeted toward the elderly such as Social Security and Medicare have a higher benefit-to-cost ratio for poorer families than for wealthier households.
Social Security, Medicare, and Income Redistribution
The progressive distribution of Social Security and Medicare benefits is a function of both design and demographics. The progressive redistributive effects of Social Security and Medicare are substantial, given that these two programs alone cost the federal government $1.4 trillion in 2012 (Office of Management and Budget 2012). Social Security replaces a larger proportion of lifetime earnings for low-income workers than for high-income workers. In addition, if the disability portion of Social Security is included in calculating redistributive benefits then the working class accrues even more of the financial rewards from the program. In particular, Social Security redistributes national income from upper middle- and high-income employees to low-wage retirees.Footnote 7 A common method used to determine the redistributive winners and losers of Social Security is to measure the “money's worth ratio” or taxes paid versus benefits received by different groups. According to the Government Accountability Office the replacement of benefits-to-taxes paid is the highest for low-income workers at 49 percent, is second highest for average-income workers at 37 percent, and is lowest at only 24 percent for the highest income earners (Government Accountability Office 2005). Another study found that not only do working-class households make out better than wealthier families from Social Security but that women do better than men, and minorities tend to do better than whites (Bucks et al. Reference Bucks, Kennickell, Mach and Moore2009). One recent analysis (Liebman Reference Liebman2002) demonstrates that lower-income households, women, and those with less than a high school education benefit the most from Social Security. In Liebman's study, those families closest to the poverty line (less than 50 percent) received back roughly $90 of benefits for every dollar paid through taxes. Conversely, the wealthiest families (with incomes higher than 300 percent over the poverty line) only received back twenty-six cents for every dollar contributed through payroll taxes. Since racial and ethnic minorities are more likely to be poor and work in lower-wage jobs there is also a racial disparity in Social Security benefits. Next, women received roughly double the benefits-to-taxes compared to men. Similarly, those without a high school diploma accrue nearly three times the lifetime Social Security benefits than those with a higher education. In total, Social Security redistributes financial benefits down the income ladder and toward constituencies that are electorally important for the Democratic Party.
Medicare, a universal program of health insurance for the elderly, provides more financial assistance to low-income families as opposed to higher-income families (McClellan and Skinner 1999, Reference McClellan and Skinner2006, Bhattacharya and Lakdawalla Reference Bhattacharya and Lakdawalla2006, Lee et al. Reference Lee, McClellan, Skinner and Poterba1999). As an example, one study examined the ratio of benefits to taxes for Medicare over a lifetime for three simulated couples: average earner/low earner, average earner/average earner, and high earner/average earner. The couple with one average earner and one low earner received back more benefits from Medicare than the two wealthier couples, with the greatest benefit gap being between the low-earning and high-earning couples (Steuerle and Carasso Reference Steuerle and Carasso2003). Kelly (Reference Kelly2009) found that 37 percent of total Medicare benefits go to the lowest income quintile while only 6 percent accrue to those in the top income quintile. In addition, the benefit of Medicare for working-class households goes up substantially once the insurance value – in addition to the financial value – of the program is accounted for in the benefit-cost ratio (McClellan and Skinner 1999, Reference McClellan and Skinner2006). The insurance value relates to the fact that poor, elderly households could not afford health insurance on the private market absent the Medicare program.Footnote 8
Kelly (Reference Kelly2009) found that Social Security alone reduces income inequality by 6.9 percent and Medicare, by itself, reduces income inequality by 3.6 percent. These two programs are largely responsible for the low level of poverty among the elderly in America. For example, according to a report from the Social Security Administration (SSA), without the cash payments from Social Security, more than half of the elderly population would have fallen into poverty in 2007. Overall, Social Security, Medicare, Medicaid, and other means tested programs have substantial progressive redistributive effects on national income. These redistributive effects are well known among policymakers and therefore provide an explanation for why Democrats have been stalwart supporters of Social Security and Medicare while Republicans have continually attempted to transfer these programs to the private market.
The Regressive Income Distributional Effects of Tax Expenditures
In the United States, wealthier citizens accrue the vast majority of federal income benefits from tax expenditure programs (Burman et al. Reference Burman, Geissler and Toder2008b, Hungerford Reference Hungerford2009, Toder et al. Reference Toder, Harris and Lim2011). Tax expenditures alter the horizontal and vertical equity of the basic tax system by allowing exemptions, deductions, and credits for specialized groups or activities. In particular, tax expenditures designed to subsidize employee fringe benefits provide more government money to wealthier workers. There are three main reasons for the upside-down income redistribution effects of tax expenditures: the progressive federal income tax structure, the relationship between employment benefits and social tax expenditures, and the role of itemization in claiming social tax expenditures.
The progressive structure of the federal income tax system results in tax expenditures becoming more valuable as the marginal rate rises. For example, if a worker in the 35 percent bracket is allowed to exclude $10,000 from her income, she receives a tax benefit of $3,500. If another worker in the 10 percent bracket is allowed to exclude the same $10,000 from her income, her tax break is only $1,000. In comparison, if instead of a tax expenditure each worker received a direct government payment of $10,000 and the receipt was taxable, the lower-income worker benefits more with $9,000 available to her after tax, whereas the other worker is left with just $6,500. Therefore, as a taxpayer's income rises, so too does the value of using social tax expenditure programs to reduce their total tax liability. The JCT (2011) estimates that families earning over $100,000 a year accrued 64 percent of the total benefits from the mortgage deduction, 81 percent of the benefits for the state and local tax deductions, and 80 percent of the redistributed income for tax deductions aimed at private pensions. So even with the top 20 percent of income earners paying 70 percent of federal taxes, there are tax expenditure programs that redistribute back a higher percentage of benefits than these families pay into the federal coffers (Toder et al. Reference Toder, Wasow and Ettlinger2002).
Second, and as discussed in previous chapters, wealthier workers in larger corporations disproportionately benefit from social tax expenditures for employment-based benefits. First, professional workers, who earn high incomes and often work in corporations, are highly likely to both be offered and enroll in employment-based health care insurance and pension plans. Conversely, lower-income workers are often in jobs that do not offer employment-based health care insurance and pension plans. Workers who enroll in employment-based plans have their social insurance contributions excluded from their yearly taxable income through various tax expenditure programs.Footnote 9 Second, recent changes to private social programs allow wealthier workers with higher disposable income to invest more of their earnings in employer-based retirement and insurance plans offered by third parties. The more that wealthier employees contribute to employment-based social plans, the more income they are able to exclude and deduct from their annual tax returns. This disparity occurs not only because of their higher salaries, but also because of the integration of many private retirement plans with Social Security.Footnote 10 These integration rules allow a smaller fraction of income to be allocated to pension benefits for lower-wage employees. Not only do wealthier workers benefit more from the various tax expenditures for employee pensions, once retired, wealthier Americans rely more on employer-based pension payments for their income. Analysis of the March 2008 Current Population Survey shows that pension income constituted less than 7 percent of total family income for elderly individuals in the poorest two income quintiles (the poorest 40 percent of elderly individuals). Pension income, however, accounted for about 20 percent of total family income for those in the richest two income quintiles. Together, wealthier workers’ higher enrollment in employment-based plans and their ability to make greater contributions to these plans, with the accompanying higher tax expenditure benefits, result in a federal tax expenditure system that provides the greatest benefits to wealthier workers.
Finally, wealthier families that own large homes and claim the mortgage interest deduction are much more likely to itemize their tax returns than the average American household. Taxpayers who itemize their returns claim more tax expenditure programs than those families who take the standard deduction. In 1998, 124 million tax returns were filed with the U.S. government. Close to 70 percent of those returns (86 million people) claimed the standard deduction, which is considered part of the normal tax structure. Therefore, only 3 out of 10 taxpayers (38 million) could claim sufficiently high enough tax subsidy values on their returns to exceed the standard deduction (Internal Revenue Service 2003).Footnote 11 According to data from the IRS, taxpayers in higher income brackets are much more likely to itemize their deductions than those citizens in lower brackets. In 2005, 93.3 percent of taxpayers making a yearly income of $200,000 and above itemized their returns. In the same year, 89.5 percent of taxpayers making $100,000–$199,999 itemized their taxes, as compared to 76.2 percent of taxpayers in the income bracket of $75,000–$99,999. In the lowest income group – those making under $50,000 – only 17.9 percent of citizens itemized their federal income tax returns. Additionally, the use of deductions, exclusions, and exemptions excludes non-taxpayers, the poorest Americans, from tax benefits for social purposes. In the following sections, I explore in more detail how tax expenditure programs for employment-based health care insurance and pensions regressively distribute national income to wealthier individuals.
The Regressive Distributive Effects of Tax Expenditures for Retirement Income and Health Care
While Medicare and Medicaid direct more assistance to the working class, the largest federal tax expenditure program in the United States provides the majority of its benefits to the wealthiest households. The most expensive tax expenditure program is for the exclusion of contributions to employment-based medical insurance and services. In 2012, the tax expenditure programs for private health care insurance cost the U.S. Treasury around $150 billion. These tax expenditure programs accrue more income to wealthier households for many of the same reasons as tax expenditures for private retirement plans. Gruber (Reference Gruber2010) finds that the design of employment-based health care tax expenditure programs accrues more benefits to those with higher incomes, and that employees with higher incomes spend more on their health insurance, which results in a regressive distribution of federal income from tax expenditure programs. Table 6.2 presents the distribution of tax benefits for the primary tax expenditure program for health care – employer-based health care insurance premiums. The majority of these tax benefits accrue to the families in the top income quintile, although the income benefits here are more evenly distributed in comparison to the tax subsidies for private pensions. The top income quintile's share of tax money is more than double that of the middle class, and higher than the lowest three income quintiles combined. The top 1 percent receives about $5,000 on average from just this one social tax expenditure program for health care. The implication of the discussion here is simply that as tax expenditures increase at the expense of public spending then national income moves from the middle and working classes to the rich. In the next section, I empirically test to determine if changes in the proportion of social tax expenditures to total social spending result in widening the income gap between the rich and the poor in the United States.
| Income Quintile | Share of Total Tax Benefits |
|---|---|
| Lowest | 0.3 |
| Second | 8.6 |
| Middle | 17.1 |
| Fourth | 22.6 |
| Top | 51.4 |
| Top 1 Percent | 3.8 |
The Relationship between Social Spending and Income Inequality
I have argued, throughout the book, that political parties make changes to social policy as a means to distribute both social welfare and financial benefits to their constituencies and to alter the ideological direction of policy. In the previous chapter, I demonstrated that political party control of government determines which side of the divided social system, public or private, receives more federal money. In particular, I found that increased Republican power caused a higher ratio of social tax expenditures to aggregate social spending in both the immediate and the long term. Social policy not only helps citizens receive tangible benefits such as health insurance and old-age pensions; it also takes money from one socioeconomic group and redistributes it to another. Therefore, I argue that the two political parties are keenly aware of the redistributive effects of social policy and consider these effects when crafting social policy.
If changes to the modality of social spending alter the government's role in the distribution of federal income then changes to the social expenditure ratio should be observable in corresponding changes to the level of income inequality. A partial model showing the relationship among political parties, social spending, and income distribution is shown in Figure 6.4 (the full model can be found in Chapter 1). I argue that political parties contribute to the level of income inequality, in part, through changes to the modality of federal social spending. Therefore, as political party control in government changes so too will the proportion of tax expenditures to total social spending and by extension the level of income inequality. For both electoral and ideological reasons, Republicans favor public policy outcomes that regressively distribute federal income up to wealthier households. In particular, I expect that increased Republican Party control results in more social tax expenditures and lower levels of discretionary public spending – together resulting in higher levels of income inequality.Footnote 12

A change in the modality of federal social spending affects the level of income inequality in both the short and the long term. First, and as argued in the previous chapter, political parties design social policy with the intent of spending some federal money now to assist their members in reelection and also to create institutional changes that allocate spending over time in ways that reflect the party's ideology. Next, the social expenditure ratio includes some new spending, expanded spending, or contracted spending, all of which have an immediate impact on the after-tax income share of wealthy versus poorer families. Next, most changes to tax expenditures for private benefits will have income effects that extend out over multiple periods of time (a new or expanded tax deduction claimed in year one, for example, can also be claimed in years two, three, etc.). Therefore, I again use an error correction model (ECM) since the relationship between the modality of federal social spending and income inequality will have both short-run and long-run effects.Footnote 13
I measure income inequality using the T10B10 ratio, which is the top 90th percentile's (wealthiest 10%’s) share of the national income as opposed to those families in the bottom 10th percentile. My period of analysis is from 1970 to 2010 since this period overlaps with the two variables of interest. The dependent variable – the T10B10 measure – runs from 1967 to 2010 and the social spending data is between 1970 and 2012. This measurement comes from the U.S. Census Bureau and is a comparison of the mean income level for households in the 90th percentile (top 10%) with the mean income level for households in the 10th percentile (bottom 10%).Footnote 14 In 1970, the average household in the wealthiest 10 percent of income earners had an annual income a little over nine times that of the poorest 10 percent. By 2010, the T10B10 ratio had grown so that the wealthiest families accrued an average income over eleven times larger than the average household income in the 10th percentile. The T10B10 measure correlates with the Gini coefficient at a 0.95 level but is a better measurement of income inequality, for this study, since it focuses on incomes at the very top and bottom of the distribution. As was discussed previously, social tax expenditures and discretionary social spending are often targeted at the rich and the poor.
I am primarily concerned with the influence of social policy on changes in income inequality so the main variable of interest is the social expenditure ratio that measures the annual amount of social tax expenditures as a proportion of total social spending (tax expenditures plus discretionary social spending). This variable best captures the policy tradeoff between increased tax expenditures and stagnant or decreased levels of discretionary social spending. As the ratio of tax expenditures to all social spending goes up, so, too, should the government distribution of federal revenues to those households in the top 10 percent versus those in the bottom 10 percent. For each independent variable, there are two estimates of the population parameters: one is an estimate for the immediate change in income inequality resulting from the annual change in the social expenditure ratio and the other estimator along with the error correction rate is used to determine the long-term effect of the various independent variables on changes in the ratio of income going to the top 10 percent versus the bottom 10 percent.
I present a graphical representation, in Figure 6.5, of the relationship over time between the social expenditure ratio and changes in income inequality. The changes to the social expenditure ratio are measured on the left Y-axis, the change in income inequality is measured on the right Y-axis, and time is represented on the X-axis. First, income inequality has grown steadily over the years. The T10B10 ratio starts the series in 1970 at over a nine-fold difference and then steadily increases over the decades to finish the series with the wealthiest households having twelve times the income of the bottom ten percent. Similarly, tax expenditures start at around 30 percent of total social spending – decrease to below 20 percent during the mid 1970s – and then increase at a faster pace than discretionary spending to finish the study at over 70 percent of total social expenditures. The two trend lines move together remarkably well, correlating at over a 0.9 level. While these two variables correlate highly, the absence of other control variables in a full model can only offer the suggestion of a statistically significant relationship over time.
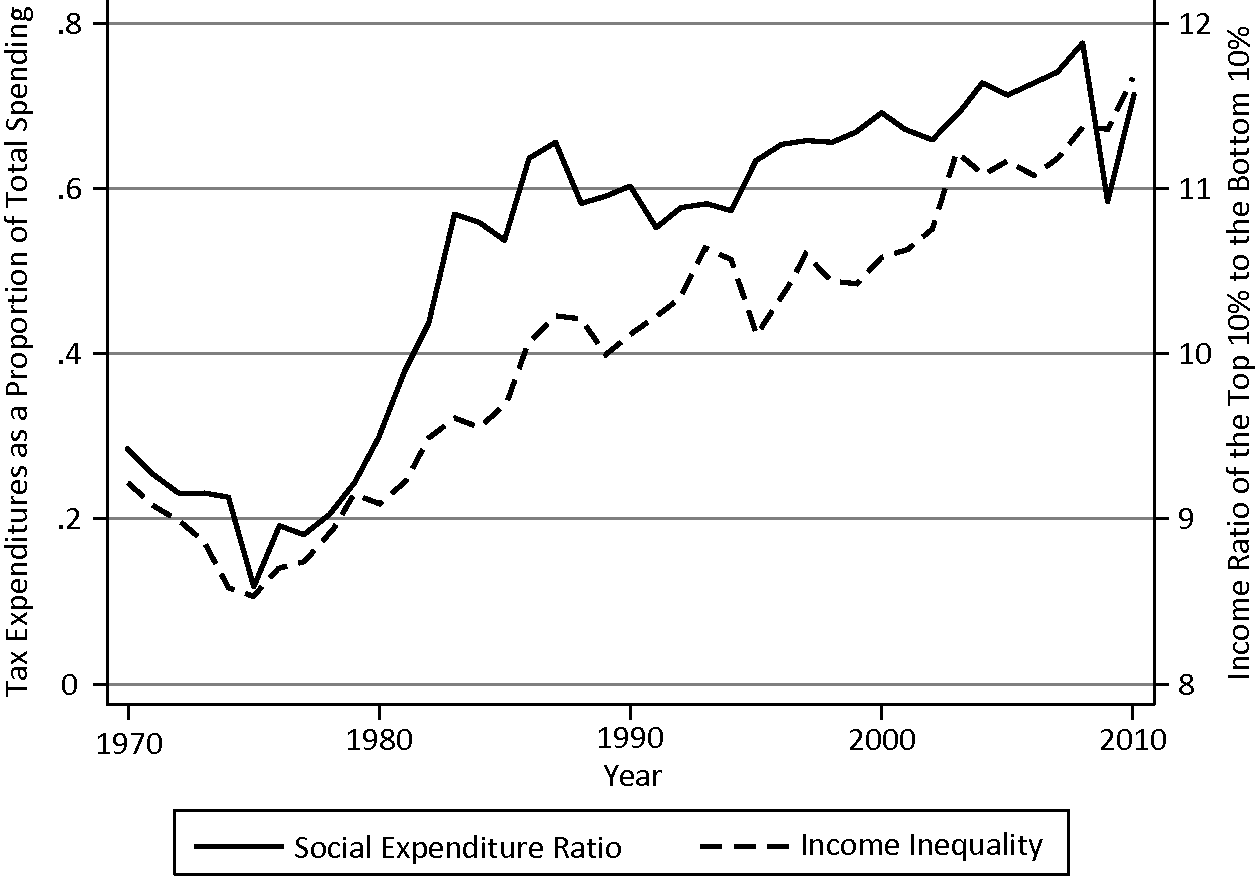
Figure 6.5. The social expenditure ratio and income inequality, 1970–2010.
I include a number of economic and political control variables in the full model, which represent relevant ideas about potential causes in changes to the level of income inequality. First, I include a dummy variable for Republican control of the White House. I use this measure since Republican control of the executive branch has been shown to influence income inequality in multiple studies (Bartels Reference Bartels2008, Kelly Reference Kelly2009). In addition, the inclusion of a Republican presidency captures potential regressive redistributive policies not included in public social spending or social tax expenditures. In fact, two of the most regressive tax expenditure programs, the mortgage interest deduction and the deduction for capital gains, are not included in my data set of social tax expenditures. The inclusion of this variable also accounts for the fact that Republican control of the federal government results in a higher social expenditure ratio.
The control variables are divided between the models, with factors that influence the income share of low-wage families in the first model and variables that determine higher income growth for wealthier families in the second model. In model one, I include popular economic and sociological explanations for recent changes to the bottom end of the national income distribution, such as changes in the national immigration rate and changes to the industrial sector of the economy. As the national immigration rate rises, wages for low-income jobs should experience downward pressure from the increased competition among low-skilled workers. In addition, as immigrants flow into the service sector and drive down prices, it allows wealthier citizens to keep more disposable income since they pay less for the same high-end goods and services. Next, the industrial sector in the twentieth century has been responsible for creating good paying jobs for citizens with lower levels of formal education and manufacturing skills. Therefore, any decrease in the proportion of manufacturing jobs in the overall economy might cause an increase in income inequality as low-skilled workers get laid off, fight for fewer jobs, have to enter retraining activities, or take other jobs in different sectors of the economy. Altogether, I expect that in the first model an increase to the social expenditure ratio will result in higher income inequality even when controlling for party control of government, immigration, and changes in the manufacturing sector.
In the second model, I control for trends that exacerbate the incomes of the wealthiest Americans, thereby increasing income inequality. First, I include a variable that controls for changes in the top marginal income tax rate for the wealthiest families. The wealthiest Americans benefited recently from large cuts to their marginal income tax rates that should increase their share of the total national income. During the course of this study, the top marginal rate for the wealthiest households went from 70 percent down to 35 percent. After a cut to the highest marginal tax rate, wealthier families benefit in the following year and each subsequent year. Second, I incorporate a variable that represents the financial sector as a proportion of all domestic economic activity. The deregulation of the financial industry along with increased globalization has increased the profit ceiling for financial institutions and by extension their share of GDP. As the financial sector has grown, more money has been concentrated at the very top of the income distribution. In total, I expect that an increase in the federal social expenditure ratio will cause higher levels of income inequality, all else being equal.
The Social Expenditure Ratio and Changes in U.S. Income Inequality
A change in the modality of social spending causes an increase in the level of income inequality in the United States. Specifically, as the proportion of tax expenditures to total social spending grows, so, too, does the level of income inequality. The first model in Table 6.3 shows that an increase to the social expenditure ratio has both an immediate and a long-term effect on increasing income inequality (a little over 1.01). The two control measures, immigration and the manufacturing sector, are not statistically significant from zero in the short run (although manufacturing is signed in the right direction with income inequality). In addition, Republican control of the presidency is also negatively signed and not statistically significant. In the long-run portion of the model, all of the variables are signed in the right direction and again the social expenditure ratio correlates with an increase in income inequality (although the impact on income inequality is smaller and noisier than the short run relationship). A Republican executive is positively signed with increases in income inequality, but not significant. A decrease in the size of the manufacturing sector significantly relates to higher levels of income inequality. As manufacturing has declined, low-skilled laborers have had to accept pay cuts in the industry or even have been structurally shifted out to the service industry. An increase in the immigration rate, in the long term, is positively associated with more income inequality although not statistically significant from zero. Altogether, the movement of federal social policy from discretionary spending on public programs to tax expenditures for private social benefits has an observable impact on changes in the level of income inequality even when controlling for political party power, immigration rates, and changes in the role of manufacturing in the economy.
Table 6.3. The Social Expenditure Ratio and Changes in Income Inequality, 1970–2010
| T10B10 | T10B10 | |
|---|---|---|
| Independent Variable | (1) | (2) |
| Short-Term Effects | ||
| Δ Social Expenditure Ratio | 1.03** | 1.16** |
| (.516) | (.507) | |
| Δ Republican President | −.066 | −.126* |
| (.083) | (.085) | |
| Δ Manufacturing | −7.97 | |
| (7.70) | ||
| Δ Immigration | −.128 | |
| (.135) | ||
| Δ Financial Sector | 20.11* | |
| (11.89) | ||
| Δ Income Tax Rate | −.006 | |
| (.007) | ||
| Long-Term Effects | ||
| Social Expenditure Ratiot−1 | .462* | .481 |
| (.351) | (.484) | |
| Republican Presidentt−1 | .038 | .052 |
| (.061) | (.064) | |
| Manufacturingt−1 | −7.53*** | |
| (2.23) | ||
| Immigrationt−1 | .069 | |
| (.123) | ||
| Financial Sectort−1 | 23.51*** | |
| (6.54) | ||
| Income Tax Ratet−1 | −.001 | |
| (.004) | ||
| Long-Run Multiplier | ||
| Social Expenditure Ratio | 1.01** | 1.02 |
| (.494) | (.883) | |
| Error Correction Rate | ||
| Income Inequality (T10B10)t−1 | −.489*** | −.467*** |
| (.123) | (.128) | |
| Constant | 5.87*** | 3.02** |
| (1.50) | (1.05) | |
| Adj. R2 | .325 | .295 |
One-Tailed Significance Levels: *p ≤ .10, **p ≤ .05, ***p ≤ .001.
Model two in Table 6.3 shows that an increase to the social expenditure ratio results in higher levels of income inequality – in the short term – even when controlling for political party control of government, and factors known to increase the income share of the rich. An increase in the social expenditure ratio produces a larger gap between the income share of the wealthiest and poorest households than in the first model. The long-run multiplier for social spending is signed in the right direction but not statistically significant from zero.Footnote 15 Finally, an increase in the social expenditure ratio produces long term growth in the income gap between the wealthiest and poorest families in both models (although the long-run multiplier is only significant in the first model). The results of the two models provide evidence, unsurprisingly, that when tax expenditures increase at a faster pace than discretionary social spending the income share of the top 10 percent grows larger and the national income share of the poorest 10 percent of households goes down. Since a household's income level relates to its economic security, as the social expenditure ratio increases both government financial assistance for social insurance and federal money are distributed upward, so that wealthier families experience a twofold gain in income security.Footnote 16
The economic and policy controls are both signed in the right direction. Yet only the growth of the financial sector measure is statistically significant and this variable reports the largest coefficients in both models. The financial sector doubled during this time period from representing just over 4 percent of GDP to accounting for over 9 percent of GDP by 2010. The profits for Wall Street firms and the large bonuses enjoyed by their highly paid workers are, by now, legend, so it comes as no surprise that the growth of the financial sector is so highly correlated with the recent rise in economic inequality. The top marginal income tax rate is related to income inequality in the direction we would expect (when the top rate goes down, income inequality goes up), yet there's too much variance in the reported coefficient for the relationship to be statistically significant. A switch from a Democratic to Republican president results in an immediate decrease in the T10B10 ratio, however, in the long run the relationship is positive yet not statistically significant from zero. This surprising short-term relationship is probably due to two reasons. First, Republican presidents George H. W. Bush and George W. Bush presided over two recessions during their terms in office. These recessions in the early 1990s, 2001, and 2007 when the income share of the top 10 percent took a bigger hit relative to other income cohorts.Footnote 17 Next, it is possible that many of the party control effects are being soaked up by the inclusion of the social expenditure ratio and the regressive distribution effects it represents.
Conclusion
In conclusion, increases in social tax expenditures at the expense of direct spending redistribute national income from the working class to wealthier households in both the near and the long term. This relationship is true even when accounting for partisan control of government, income tax rates, and economic theories of income inequality. In putting together the empirical analysis from the last two chapters, I have shown that greater Republican control of the federal government produces a higher level of social tax expenditures and less discretionary social spending and that these social policy changes, as represented by the social expenditure ratio, correlate with rising levels of income inequality. One of the important political implications of these results is that political parties can target their socioeconomic constituencies through choosing public policies with clear distributive effects. Previous studies have shown that increased spending for public social programs reduces income inequality (Bartels Reference Bartels2008, Kelly 2009); however, the inclusion of social tax expenditures highlights a mechanism whereby the federal government distributes income toward wealthier households all in the name of economic security. The irony for many social tax expenditure programs, such as the ones for private retirement accounts, is that citizens who enjoy the most economic security also receive the largest federal subsidies. In an era of tight budgets, large deficits, and constant demands to cut Social Security, the U.S. government spends hundreds of billions of dollars every year to subsidize the retirement security of the least vulnerable citizens. While the wealthy have experienced steady and significant gains in their income, middle-class incomes have been stagnant for fifteen years, and middle-class families have lost the ability to save and create wealth through the values of their homes and due to increases in household debt. It would be unjustifiable in normal economic times for the federal government to annually allocate hundreds of billions of federal funds to the wealthiest citizens but this level of regressive distribution during a period of extreme income inequality defies logic.
Next, while the analysis here shows that an increase in social tax expenditures influences the rise of income inequality, it is hard to imagine that the rise of tax expenditures has not contributed to the growing gap in wealth inequality as well. Piketty (2014) has argued that when the rate of return on capital income grows faster than the rate of return from economic growth there will be a corresponding concentration of wealth. Tax expenditures along with rate structures privilege capital income over wage income in the United States. The analysis here does not contain the tax expenditure for capital gains, the home mortgage interest deductions, and estates – all subsidies that help wealthy families pass down huge amounts of wealth to their children. The large numbers of tax expenditures that subsidize capital income have encouraged businesses, financial institutions, and wealthier individuals to transfer as much income as possible over to capital, assets, and investments. And while income inequality has grown tremendously in the United States, wealth inequality has grown faster and is higher than income inequality. The high level of wealth inequality (that can be passed from generation to generation) is the largest threat to reduced social mobility in America now and moving forward. It would be important for future studies to examine the politics of tax expenditures in contributing to the rise of wealth inequality in America.
Finally, my analysis of social tax expenditures and changes in the level of income inequality provides a tangible policy mechanism for what other scholars have categorized as market effects or market conditioning. The best analyses of the political effects on income inequality, to date, show that majority parties’ main effect on changes in the national income distribution is found in pre-tax and transfer income patterns (Bartels Reference Bartels2008, Kelly Reference Kelly2009). One of the main puzzles of these works is why political party control of the federal government has more influence on pre-tax and transfer income inequality than it does on post-tax and transfer inequality (which takes into account public social spending). The answer has been that a political party's general fiscal policy determines certain macroeconomic outcomes and that these patterns of unemployment and economic growth are then translated into income distribution patterns that either benefit the working class under Democratic presidents or the wealthy under Republican presidents. I would argue that the direct role of public policy on patterns of income distribution has been vastly understated because changes to tax policy, which disproportionately impact the rich, have not been formally theorized, operationalized, and tested. There is more work needed so that we may fully evaluate the impact over time of changes in federal and state-level tax policies on the rise of income inequality in America.
Appendix to Chapter 6
Baseline Model of the Social Expenditure Ratio and Changes in Income Inequality, 1970–2010
| Variables | Income Inequality | Income Inequality |
|---|---|---|
| Social Expenditure Ratio | 1.14* | |
| (.512) | ||
| Social Expenditure Ratio (-EITC) | 1.06* | |
| (.527) | ||
| Republican President | –.080 | –.079 |
| (.087) | (.088) | |
| Constant | .046 | .048 |
| (.029) | (.029) | |
| Adjusted R2 | 0.062 | 0.050 |
N = 40, ARIMA specifications with standard errors in parentheses.
Two-Tailed Significance Levels: *p ≤ .05.
Republican Power and Changes in Income Inequality, 1970–2010
| Gini Coefficient | Gini Coefficient | |
|---|---|---|
| Short-Term (Immediate) Effects | ||
| Δ Social Expenditure Ratiot | .016* | .010 |
| (.012) | (.013) | |
| Δ Republican Presidentt | –.005* | –.005* |
| (.002) | (.002) | |
| Δ Manufacturingt | –.035 | |
| (.220) | ||
| Δ Financet | .283 | |
| (.350) | ||
| Long-Term Effects | ||
| Social Expenditure Ratiot-1 | .017** | .018** |
| (.008) | (.008) | |
| Republican Presidentt-1 | –.001 | –.003* |
| (.001) | (.001) | |
| Manufacturingt-1 | –.035 | |
| (.100) | ||
| Financet-1 | .681** | |
| (.358) | ||
| Error Correction Rate | ||
| Gini Coefficientt-1 | –.130** | –.424*** |
| (.059) | (.141) | |
| Constant | .050* | .165** |
| (.022) | (.075) | |
| Adj. R2 | .102 | .161 |


