
1.1 Perspectives on Urbanization
Urbanization is one of the most important global change processes. As the share of people in, and the footprint of, urban areas continue to grow globally and locally, understanding urbanization processes and resulting land use – both their patterns and intensity – is increasingly important with respect to natural resource use, sociodemographics, health, and global environmental change (Seto and Reenberg Reference Seto, Reenberg and Lupp2014). For decades, urban studies have been grappling with the question of how to define “urban”; the definition of urban includes comparatively straightforward official definitions, such as those that use the administrative unit with a set minimum number of inhabitants (McIntyre et al. Reference McIntyre, Knowles-Yánez and Hope2000), but, in some cases, it also includes such factors as population density, built-up area (urban morphology), commuting density, travel distance (Nilsson et al. Reference Nilsson, Nielsen, Aalbers, Bell, Boitier, Chery, Fertner, Groschowski, Haase, Loibl, Pauleit, Pintar, Piorr, Ravetz, Ristimäki, Rounsevell, Tosics, Westerink and Zasada2014), and proportion of workforce engaged in nonagricultural economic activities (Census of India 2011). In spite of this variety, official definitions do not accurately represent the urban in all its diversity. Even scholarly studies tend to adopt one or a subset of many perspectives in understanding the urban as a phenomenon, from the most well-understood demographic perspective (Kazepov Reference Kazepov2005) to relatively more recently formulated or reformulated perspectives based on space (Angel Reference Angel2010; Seto et al. Reference Seto, Fragkias, Güneralp and Reilly2011); urbanity (Boone et al. Reference Boone, Redman, Blanco, Haase, Koch, Lwasa, Nagendra, Pauleit, Pickett, Seto, Yokohari, Seto, Reenberg and Lupp2014); material and energy flows (Kennedy et al. Reference Kennedy, Cuddihy and Engel-Yan2007; Bai Reference Bai2016); teleconnections (Seto et al. Reference Seto, Reenberg, Boone, Fragkias, Haase and Langanke2012); network and power hierarchies (Sassen Reference Sassen2001); ecology (Grimm et al. Reference Grimm, Foster, Groffman, Morgan Grove, Hopkinson and Nadelhoffer2008); social ecology (Elmqvist et al. Reference Elmqvist, Fragkias and Güneralp2013); and urban policy and governance (Bai et al. Reference Bai, McAllister, Beaty and Taylor2010). Building an integrated systems approach in urban science and practice has also been called for (Bai et al. Reference Bai, Surveyer, Elmqvist, Gatzweiler, Güneralp and Parnell2016; McPhearson et al. Reference McPhearson, Pickett, Grimm, Niemelä, Alberti and Elmqvist2016).
Here, we will elaborate on a subset of these perspectives and discuss their roles in improving our understanding of the urban and urbanization processes. Note that some of the perspectives are covered in other chapters; for example, urban material energy flows are addressed in Chapter 4, urban ecology and cities as complex systems in Chapter 1.2, and urban policy and governance in several chapters and provocations in Parts II and III.
1.1.1 The Demographic Perspective
The first cities appeared many millennia ago (Kazepov Reference Kazepov2005; Childe Reference Childe1950). Since then, urbanization dynamics evolved substantially in time and space, but the most fundamental ingredient remained the same: people. In 1800, only 3 percent of the world’s population lived in cities, but this figure rose to 47 percent by the end of the twentieth century. In 1950, there were 83 cities with populations that exceeded 1 million; by 2010, this number had risen to more than 460.
There is a linkage between demographic transition and urbanization in the form of a systematic trend whereby less developed economies tend to be more rural and to have higher birth rates (Lesthaeghe Reference Lesthaeghe2010). As the economy of a country develops, more of its population resides in urban areas with an accompanying fall in intrinsic birth rates (Lesthaeghe Reference Lesthaeghe2010); this can also be observed for the demographic (fertility) behavior of migrants (Milewski Reference Milewski2010) (see also Chapter 6). Thus, for example, rapidly growing African cities can be viewed as being in the early stages of this transition, while cities in Europe or the United States can be seen as reaching the later stages.
If we use the administrative definition of the urban, the most urbanized regions worldwide are North America (82 percent), Latin America and the Caribbean (80 percent), Europe (74 percent), and Oceania (71 percent) (UN 2014). In contrast, Africa and Asia remain mostly rural, with 41 percent and 49 percent of their respective populations living in urban areas. In particular, Nigeria, Ethiopia, Tanzania, and Kenya in Africa, and China, India, Indonesia, and Myanmar in Asia feature large rural populations. Regions that are less urbanized, such as Africa and Asia, are currently urbanizing faster than those with an already high share of urban population (Dahiya Reference Dahiya2012b). Notwithstanding the current level of urbanization or the growth rate of their cities, all regions are expected to continue urbanizing over the coming decades.
Today, as in the past, the majority of the world’s cities have been growing with a population growth rate of ≥1 percent up to >5 percent per year (Oswalt and Rieniets Reference Oswalt and Rieniets2006; UN-Habitat 2016). However, there have always been cities and conurbations exhibiting negative net growth rates (Haase and Schwarz Reference Haase, Schwarz, Seto, Solecki and Griffith2016; Figure 1.1). There are approximately 350–400 shrinking cities worldwide, most of them in the post-industrialized Western world, namely Europe and the United States, but also in Japan (Haase Reference Haase, Seto, Reenberg and Lupp2014). Urban shrinkage is by no means a new phenomenon: Several cities whose history goes back millennia – such as Rome, the first megacity on the planet (Haase Reference Haase, Seto, Reenberg and Lupp2014), and Istanbul, capital of four empires over a span of two millennia (Necipoğlu Reference Necipoğlu2010) – have undergone several cycles of growth and shrinkage.
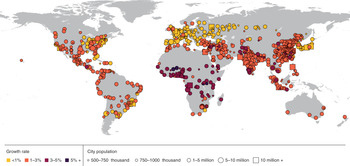
Figure 1.1 Growth rates of urban agglomerations by size class, 2014–2030.
Over the next few decades, urbanization will continue, particularly in Asia and Africa. According to the most recent estimates from the United Nations, two out of three inhabitants in 2050 will live in urban areas (UN 2014). Most of this urban growth will take place in Asia and the West African urban belt, with population growth rates of 3–5 percent per year (UN 2014a). However, global data also show that the growth rate of the urban population in the developing world is expected to fall from 3–5 percent per year to under 2 percent per year in 2030 (UN-Habitat 2010a, 2014). The UN predicts that, by 2050, 65 percent of populations in developing countries and nearly 90 percent of populations in developed countries will live in urban areas (UN 2014).
In many parts of the world, the physical expansion of urban areas has been faster than urban population growth (Angel et al. Reference Angel, Parent, Civco, Blei and Potere2011a, Reference Angel, Parent, Civco and Blei2011b), suggesting declining densities. Studies have also reported an accelerated decline in average household size over the past decades (Haase et al. Reference Haase, Kabisch and Haase2013; Liu et al. Reference Liu, Daily, Ehrlich and Luck2003). Consequently, on the one hand, most cities in developed countries have been facing an increase in per capita living space, definitely one of the many factors significantly influencing the spatial (built space) growth of cities. On the other hand, such decline in household size in developing countries has exacerbated the lack of urban housing stock, which results in large slum populations, the global total of which were estimated at 862.6 million people in 2013 (UN-Habitat 2010a and 2010b). However, in some East Asian cities (particularly in China) and in Europe, significant increases in urban-built densities have also been observed over the last decade (Frolking et al. Reference Frolking, Milliman, Seto and Friedl2013).
1.1.2 Aging of the Urban Planet
Global population aging, including urban aging, is a process known as the “demographic transition,” in which first mortality, then fertility decline. Decreasing fertility coupled with increasing life expectancy has been reshaping the age structure of the populations in most regions of the planet by shifting relative weight from younger to older age groups (Lesthaeghe Reference Lesthaeghe2010). In less developed regions, the aging index is 23; that is, we currently count 23 people older than 60 years of age for every 100 children younger than 15 years old. By 2050, the aging index is projected to almost quadruple, reaching 89 (UN 2017). Over the same period, in the developed world, the aging index is projected to increase from 106 to 215. The only exception to this trend is Africa, where, compared to all the other regions of the world, the aging index is forecasted to remain under 50 through 2050 (Figure 1.2). In cities, where women are comparatively more educated, financially more independent, give birth later and where single-parent families are much more common, these trends are stronger.
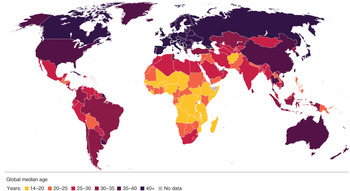
Figure 1.2 Median age by country for 2015. A youth bulge is evident for Africa and to a lesser extent for South and Southeast Asia and Central America.
There is another difference between urban aging in the developed, affluent urban areas and in the less developed, less affluent urban areas: Although the highest proportions of elderly persons are found in more developed cities, this age group is growing considerably more rapidly in the poorer and less affluent parts of the urban world, such as China and Thailand. As a consequence, older populations will increasingly be concentrated in less developed regions. Regardless of these trends, in both affluent and less affluent cities, older women generally greatly outnumber older men (UN 2017), as women tend to outlive men.
1.1.3 The Spatial Perspective
Global urbanization is a physical phenomenon as much as it is a demographic one. Although there has recently been an increase in attention given to global spatial patterns of urbanization, we have few theoretical explanations for the spatial configuration of large urban areas across regions and countries (Lynch Reference Lynch1961). Whatever theoretical knowledge on urban form exists has originated in urban planning and architecture, with an emphasis on intra-urban patterns and shapes (Jabareen Reference Jabareen2006).
This trend, however, may be slowly changing. Over the past few years, several studies have shed light on the global patterns of actual built-up urban land and how it changed over the last four decades. A subset of these studies presents a “window into the future” (Fragkias et al. Reference Fragkias, Güneralp, Seto, Goodness, Elmqvist, Fragkias, Goodness and Güneralp2013: p. 418). Estimates of global urban land range from 0.2 percent to 2.4 percent of the terrestrial land surface (Potere and Schneider Reference Potere and Schneider2007; World Bank 2015). What is clear is that urban land is not equally distributed across the world due to geographic, climatic, and resource-related opportunities and constraints. Urban expansion over the last 30 years has been greatest along coastlines and low-lying coastal zones (Seto et al. Reference Seto, Fragkias, Güneralp and Reilly2011). Current urban hotspots are situated on the coastlines of South Asia, Southeast Asia, Southeast China, the United States’ East Coast, Western Europe, Japan, West Africa, and the Atlantic coast of Latin America. With regard to coastal flood risks, nearly all of the 10 largest megacities are in developing countries. With regard to the value of property and infrastructure assets’ exposure to coastal flood risks, a global ranking of megacities includes eight from Asia: Miami, Guangzhou, New York, Kolkata, Shanghai, Mumbai, Tianjin, Tokyo, Hong Kong, and Bangkok (Nicholls et al. Reference Nicholls, Hanson, Herweijer, Patmore, Hallegatte, Corfee-Morlot, Chateau and Muir-Wood2008). Indeed, a recent study found that, at the turn of the twenty-first century, 11 percent of all urban land (over 70,000 km2) was located within low-elevation coastal zones (Güneralp et al. Reference Güneralp, Güneralp and Liu2015), defined as “the contiguous area along the coast that is less than 10 m above sea level” (McGranahan et al. Reference McGranahan, Balk and Anderson2007: p. 17). In addition, emerging coastal metropolitan regions in Africa and Asia are expected to have larger areas exposed to flooding than those in developed countries.
There is wide variability in terms of the spatial configuration of urban areas across different geographies around the world. An analysis of the similarities and differences in urban form and growth across 25 midsized cities from different geographical settings and levels of economic development revealed that although all 25 cities are expanding, those outside the United States do not exhibit the dispersed spatial forms characteristic of North American cities (Schneider and Woodcock Reference Schneider and Woodcock2008). There is a diversity of urban landscapes around the world with significant differences in spatial configuration among individual cities. However, there also seems to be a scale effect: While there is a tendency for increased landscape heterogeneity at individual-city scale, urban landscapes are increasingly becoming homogeneous at the global scale (Jenerette and Potere Reference Jenerette and Potere2010). Though a variety of socioeconomic and biophysical factors influence the spatial growth of cities and their relative influence varies from region to region (Seto et al. Reference Seto, Reenberg, Boone, Fragkias, Haase and Langanke2012), it is claimed that globalization leads to a proliferation of similar urban forms across different geographies (Leichenko and Solecki Reference Leichenko and Solecki2005). At least one study found that income, in interaction with city size, appears to have a pronounced effect on urban growth, particularly in relatively smaller cities (Jenerette and Potere Reference Jenerette and Potere2010). Importantly, the emerging urban agglomerations in the developing world appear to be more compact than their counterparts in Europe and North America (Huang et al. Reference Huang, Lub and Sellers2007).
Urbanization is arguably the most significant form of land-use and land-cover change because it has considerable effects on the pattern, dynamics, and functionality of ecosystems (Elmqvist et al. Reference Elmqvist, Fragkias and Güneralp2013). The process of urbanization can be clearly observed along the rural-urban gradient – that is, the ideal typical transect that links the urban (built, populated) and the rural (open, vegetated), which displays a typical configuration of population density, coverage of built-up area, respective impervious cover, and demographic structure, including lifestyles and travel behavior (Haase and Nuissl Reference Haase and Nuissl2010). Along the rural-urban gradient, an increasing amount of land consumption – namely the transformation of green spaces to built-up areas, described as landscape urbanization, in contrast to demographic urbanization (Bai et al. Reference Bai, Chen and Shi2011) – has been reported by many authors on the basis of field research and statistical data analysis (including McDonnell et al. 1997; Luck and Wu Reference 42Luck and Wu2002; Lewis and Brabec 2005; Irwin and Bockstael Reference Irwin and Bockstael2007; Weng Reference Weng2007; Yu and Ng Reference Yu and Ng2007; Schwarz 2010). Likewise, the transformation along the rural-urban gradient has been detected by analysis of satellite imagery (including Lausch et al. Reference Lausch, Blaschke, Haase, Herzog, Syrbe, Tischendorf and Walz2015).
In regard to those cities whose populations are stagnating or declining, Scheuer et al. (Reference Scheuer, Haase and Volk2016) show a similar phenomenon at work for the age of built-up urban land and its relative variability; they identified “mature” and “expanding” urbanization along a polynomial fit for all large cities across the globe. Their study therefore suggests that growing and shrinking cities lie along a continuum – in what appears to be a cyclic process – of demographic transition, economic development, and urbanization (Scheuer et al. Reference Scheuer, Haase and Volk2016).
1.1.4 Re(new)ed Perspectives
Urbanization is a multifaceted phenomenon, with profound changes in land, socioeconomics including consumption patterns, institutions, and environment (Friedmann Reference Friedmann2006; Bai et al. Reference Bai, Shi and Liu2014). This diversity provides fertile ground for introduction of new – or renewed – conceptualizations to characterize the urban and different urbanization processes. In one of the more recent such conceptualizations, Boone et al. (Reference Boone, Redman, Blanco, Haase, Koch, Lwasa, Nagendra, Pauleit, Pickett, Seto, Yokohari, Seto, Reenberg and Lupp2014: p. 313) proposed the concept of “urbanity,” defined as “the magnitude and qualities of livelihoods, lifestyles, connectivity, and place that create urban-ness of intertwined human experiences and land configurations”. The concept of urbanity emerges from of a growing consensus that the classic urban versus rural classification to categorize land is insufficient for planning, research, and analysis. Importantly, the concept of urbanity underscores a continuum which can be applied beyond the administrative boundaries of cities, and therefore can extend to multiple dimensions, including livelihoods, land uses, and economies. Urbanity can also be used to understand how land-use changes in nonurban areas are connected to underlying urbanization dynamics. In this way, urbanity is closely tied to another recent conceptual framework in land-use science: urban land teleconnections (ULTs). The ULT concept seeks to uncover the linkages between land-use change and underlying urbanization dynamics (Seto et al. Reference Seto, Reenberg, Boone, Fragkias, Haase and Langanke2012).
ULTs “refer to the distal flows and connections of people, economic goods and services, and land use change processes that drive and respond to urbanization” (Seto et al. Reference Seto, Reenberg, Boone, Fragkias, Haase and Langanke2012: p. 1). ULTs express that the linkages between urban land-use change and the ecosystem resources consumed by urbanites are not exclusively formed over short distances, nor are they exclusively place based. Rather, these linkages include many processes that urbanites influence in distant locations (Seto et al. Reference Seto, Reenberg, Boone, Fragkias, Haase and Langanke2012). ULTs allow us to shed light on rural land-use changes and migration that are driven by distal urban functions. For example, local or regional shifts in dietary preferences and consumption styles driven by urbanization and increasing incomes are reinforced globally, but also have impacts on distal places through information and material linkages. Thus, ULTs link decisions, actions, and land changes at both urban and rural ends of a continuum (Güneralp et al. Reference Güneralp, Seto and Ramachandran2013). “Telecoupling,” a similar but broader concept, refers to the system-level interactions among different human and natural processes across a range of spatial and temporal scales as, for instance, in the case of urban water system (Deines et al. Reference Deines, Liu and Liu2015). These systemic interactions have enormous implications for quality of life, economy, sustainability, and social equity in both urban and rural areas.
Despite being grounded in specific locations, cities can also be described as global entities or functional units whose influence reach far beyond their immediate vicinity. The concept of “global cities” considers some cities to be key nodes in the global economic, communication, and financial system (Sassen Reference Sassen2001). The global cities concept originates from social sciences – especially from urban studies – and follows the idea that global urbanization can be understood as a phenomenon that is largely created, facilitated, and enacted in strategic geographic locations. These locations, in turn, emerge as a consequence of a hierarchical network of the global system of finance, transport, money flows, and trade (Sassen Reference Sassen2001, Reference Sassen2008; see Figure 1.3).

Figure 1.3 Facebook connections worldwide.
Given the multifaceted nature of cities in a globally interconnected world and the sustainability challenges they face, an integrated systems perspective is required in urban research and practice (see, for example, Güneralp and Seto Reference Güneralp and Seto2008). The current framework of cities as social-technological systems is too narrow and should be complemented by a view of cities as complex social-ecological-technological systems, as has recently advanced within urban ecology and social-ecological systems perspectives (Elmqvist et al. Reference Elmqvist, Fragkias and Güneralp2013). This advance is critical given that the continuum of urbanity includes many characteristics and processes other than the particular density of people or land area covered by human-made structures. Bai et al. (Reference Bai, Surveyer, Elmqvist, Gatzweiler, Güneralp and Parnell2016) call for the radical redesign of urban institutional structure and processes along with financing of systems approaches in urban governance and the creation of stronger systemic integration among science, policy, and practice. McPhearson et al. (Reference McPhearson, Pickett, Grimm, Niemelä, Alberti and Elmqvist2016) call for moving urban ecology towards an integrated urban science. A recent example of integrating different urban disciplines is a study attempting to build a conceptual bridge between the large body of empirical works on urban metabolism to urban ecosystem research through identifying eight energy and material flow characteristics of urban ecosystems (Bai Reference Bai2016).
1.2 Urbanization Trends around the World
Throughout history, urban areas have shown immense variety and variability across different cultures and geographies, and even within the same cultural or geographical sphere. The earliest cities in Mesopotamia, the Indus Valley, and the Mediterranean region were highly compact in area, but a few were characterized by sizeable populations and densities. For example, Rome, in its heyday in the early third century CE, had 1.5 million inhabitants, a population count the city did not attain again until the 1930s (Davis Reference Davis1955). The pre-medieval and medieval cities of Europe and Asia are typical examples of compact cities with midrise houses and high population densities. Regions with younger urbanization, such as North America, tend to develop less compact cities as a whole (Angel Reference Angel2010).
Particularly in the developed world, post–World War II motorization, poor planning, and market failures led to urban sprawl, which is defined broadly as “excessive spatial growth of cities” (Brueckner Reference Brueckner2000: p. 161) or, more specifically, as spatial growth of cities that creates forms of suburban development that lack accessibility and open space (Ewing Reference Ewing1997). As a spatio-temporal process, urban sprawl can be seen as a low-density expansion or “leapfrog development” of large urban areas into the surrounding rural landscape (Kasanko et al. Reference Kasanko, Barredo, Lavalle, McCormick, Demicheli, Sagris and Brezger2006; Bengston et al. Reference Bengston, Potts, Fan and Goetz2005). To give an example, from 1990 to 2006, urban land and associated infrastructure across Europe grew at an annual rate of about 1,000 km2, which is equivalent to the entire area of the German capital of Berlin. Nevertheless, the most prominent case of this kind of urban growth has been the expansion of the cities in the United States in post–World War II era (Batty et al. Reference Batty, Xie and Sun1999; Brueckner Reference Brueckner2000).
The development of large suburbanized peripheries around historically compact European cities (Haase and Nuissl Reference Haase and Nuissl2010) came to be known as the “Zwischenstadt” – a settlement form in between the urban and the rural (Sieverts Reference Sieverts2003), which is mainly composed of detached houses and industrial, commercial, and retail sites that dominate the urban-to-rural interface (Meeus and Gulinck Reference Meeus and Gulinck2008; Nilsson et al. Reference Nilsson, Nielsen, Aalbers, Bell, Boitier, Chery, Fertner, Groschowski, Haase, Loibl, Pauleit, Pintar, Piorr, Ravetz, Ristimäki, Rounsevell, Tosics, Westerink and Zasada2014). Conversely, rapidly growing urban areas in Asia and Africa display many rural features in their peri-urban spaces, including various forms of gardening and farming (McGee Reference McGee, Ginsburg, Koppel and McGee1991). This type of growth is distinctly different than suburbanization seen in North America or Europe; such peri-urban spaces in East and Southeast Asia are called “desakota” after the Indonesian words “desa” and “kota” – “village” and “city,” respectively.
Particularly after 1990, a considerable proportion of European cities, but also many cities in Japan, started losing population following significant fertility drops and out-migration; they were shrinking (Haase et al. Reference Haase, Kabisch and Haase2013). Another prominent case of shrinkage – the US case – is less clearly related to fertility drops; rather, there have been large population shifts internal to the United States due to the disintegration of economies that were based on manufacturing and heavy industry in some regions, such as the Rust Belt and to the economic boom in others. Shrinkage today is ongoing, but it is accompanied by regrowth, with a return of the predominantly young and educated population to the city centers (Kabisch et al. Reference Kabisch, Haase and Haase2010) (see Section 1.2.1 for more on urban shrinkage).
The cities in the developing world have also been differentiating over the last three decades. Whereas many millions of urban residents, who are typically concentrated in “informal” or squatter settlements in both inner and outer parts of these cities (Angel et al. Reference Angel, Parent, Civco and Blei2011b; UN-Habitat 2010b; UN-Habitat 2014b), still face significant hardships and lack access to many urban amenities, affluent centers of innovation have also been developing and have been accompanied by increasing wealth, often in the same cities. These apparent contradictions are the most visible in rapidly growing cities of China, Brazil, India, Indonesia, Mexico, and South Africa, where the most affluent households often spatially segregate themselves from the poor majority in gated communities. Still, over the past few decades, declining urban population densities appear to be a hallmark of contemporary urbanization in most parts of the world (Angel et al. Reference Angel, Parent, Civco, Blei and Potere2011a), a phenomenon that needs further investigation.
1.2.1 “Antipodes” of Urbanization: Urban Shrinkage
While rapid urban growth is presenting challenges for urban planners and policy-makers in certain parts of the world, in others, a contrasting phenomenon is presenting a completely different set of challenges: urban shrinkage. Urban shrinkage is characterized by many facets such as population loss; declining industrial and other economic activities accompanying underuse of buildings and urban infrastructure; declining population densities; vacant housing; fiscal constraints; and an increase in derelict land and brownfields as a consequence of land abandonment. A. Haase et al. (Reference Haase, Rink and Großmann2012), D. Haase (Reference Haase, Kabisch, Haase, Kabisch and Rink2012), and Rink and Kabisch (Reference Rink and Kabisch2009) define urban shrinkage as a phenomenon of massive population loss in cities that results from a specific interplay of (1) economic (such as the Rust Belt of the United States), (2) financial, (3) demographic, (4) environmental, and (5) political changes or disruptions (such as in the former socialist countries in Europe) (Figure 1.4). Particularly prominent examples are the systemic changes that occurred across Central and Eastern Europe, including eastern Germany, after 1990, coupled with the introduction of a market economy (Moss Reference Moss2008). Temporary shrinkage might also result from environmental disasters, such as Hurricane Katrina, which devastated the city of New Orleans in 2005, causing the city to lose a considerable part of its population; however, the population increased by 10 percent since 2010. Other examples of this hazard-driven shrinkage include Fukushima, Japan, or Pripjat in the Ukraine, where nuclear accidents led to massive or complete losses of the urban population; in these cases, a return is far from obvious.

Figure 1.4 Regions of urban shrinkage in the world.
Another reason for urban shrinkage is demographic change – namely low fertility and massive out-migration. The current processes determining urban shrinkage in Central and Eastern Europe have emerged in the form of the post-Soviet transition decline of traditional heavy industries. This decline induced general economic crises, unemployment, out-migration to other prospering regions, subsequent declines in fertility, and increases in population aging (D. Haase et al. Reference Haase, Rink and Großmann2012). Furthermore, widespread suburbanization in the peri-urban zones around shrinking cities leads to more residents abandoning the city and, eventually, to the development of “donut-cities,” such as those in eastern Germany after 1990 (Couch et al. Reference Couch, Karecha, Nuissl and Rink2005) or Detroit in the United States.
Since about 2000, a new trend following peri-urbanization has been observed in some parts of the world: A number of cities in Germany, Central and Eastern Europe, and formerly shrinking parts of the eastern United States are no longer experiencing a loss in their population, but are regaining inhabitants. Positive migration balances are mainly based on intraregional in-migration and a considerable decline in out-migration (Kabisch et al. Reference Kabisch, Haase and Haase2010). People are increasingly opting to stay in the city, even as suburbanization progresses. Concurrently, a discourse about a comeback of urban living – dubbed “reurbanization” – as a future scenario for a number of major cities in eastern Germany has come to the fore (D. Haase et al. Reference Haase, Haase, Bischoff and Kabisch2008; Rink et al. Reference Rink, Haase, Grossmann, Couch and Cocks2012). Reurbanization is also currently being discussed in the United Kingdom and other European countries (Buzar et al. Reference Buzar, Ogden, Hall, Haase, Kabisch and Steinfuhrer2007; Colomb Reference 39Colomb2007) as well as in the United States (Cheshire Reference Cheshire2006).
Reurbanization is a recent trend seen in cities that underwent a period of urban stagnation and decay (Wolff et al. Reference Wolff, Haase, Haase and Kabisch2017) followed by a new cycle of the demographic transition, economics, and urbanization. Reurbanization is characterized by a range of socio spatial processes not unlike gentrification, since taking advantage of the increasing affordability of real estate within inner city areas seems to be the main impetus. Its focus is clearly on the household dimension, as reurbanization processes are driven by households representing a range of socioeconomic groups (Kabisch et al. Reference Kabisch, Haase and Haase2010).
Another recent trend, “Cittaslow,” or “slow towns,” originated and developed a firm foothold in Europe but is gradually being adopted in other parts of the world as well (Park and Kim Reference Park and Kim2016). Cittaslow is a network of 182 towns aiming to contribute to local urban development and thus to improve their quality of life (Hatipoglu Reference Hatipoglu2015). The main goal of the Cittaslow approach is to broaden the philosophy of slow food to local communities and to the government of towns, applying the concepts of eco-gastronomy and local/traditional food production to the practice of everyday life. Municipalities which join the Cittaslow association are motivated by the idea of an urban area where humans are still protagonists of the slow and healthy succession of seasons. Cittaslow also means facilitating rich traditions of arts and craft in urban spaces with squares, theaters, shops, cafés, and restaurants, surrounded by unspoiled cultural landscapes. Other hallmarks of Cittaslow cities are spontaneity of religious rites and respect for traditions through the joy of slow and quiet living (see a review about urban cultural ecosystem services by Kabisch et al. Reference Kabisch, Qureshi and Haase2014). Clearly, Cittaslow is a concept for affluent urban areas characterized by slow or no (population) growth. It is also, however, increasingly adopted by small towns and cities as an alternative to sustainable tourism development (Hatipoglu Reference Hatipoglu2015; Park and Kim Reference Park and Kim2016). The Cittaslow approach is complemented by other similarly inspired ideas across the world, such as the “Life-based-City” (see the provocation by Cecilia Herzog in Chapter 21).
1.3 Future Trends of Urbanization
Current observations and statistical trends (UN 2014) suggest that the urbanization process will continue for the next few decades, further tilting the global demographic balance towards cities and towns. The UN projects that the world’s urban population, almost 4 billion in 2015, will grow by about 75 percent until 2050, bringing the urban population up to 6.3 billion (2014). We must expect a highly uneven urban population development in less affluent regions due to segregation of the relatively fewer rich among many poor households – a pattern that we already observe in many fast-growing African megacities. Moreover, a larger number of future urbanites will concentrate in either medium-sized cities – most likely in Europe and parts of Africa and Asia – or megacities (defined as having a population of at least 10 million) mostly in Asia. This form of population concentration will put pressure on rural hinterlands and natural resources located within smaller city-regions and mega-urban areas (UN 2014).
Even more dramatic increases in population are forecasted for urban (built-up) land. In their middle-of-the-road scenario, Angel et al. (Reference Angel, Parent, Civco, Blei and Potere2011a, Reference Angel, Parent, Civco and Blei2011b) forecasted that global urban land cover would be nearly 1.3 million km2 by 2030 and 1.9 million km2 by 2050, increases of 110 percent and more than 210 percent, respectively, since 2000. Seto et al. (Reference Seto, Reenberg, Boone, Fragkias, Haase and Langanke2012) forecast that there will be a 185 percent increase in global urban land cover, with areas having a high probability of urban expansion amounting to 1.2 million km2 from 2000 to 2030; urban expansion in Asia is expected to account for nearly half of this increase. More recently, Güneralp et al. (Reference Güneralp, Zhou, Ürge-Vorsatz, Gupta, Yu and Patel2017) projected that in all regions around the world, urban population densities will continue to decline with significant consequences for building energy use. They forecast that even if it is assumed that urban areas do not grow to be as geographically expansive as they have over the past few decades, urban population densities around the world are likely to continue to decline. For example, in North America, urban population densities overall are expected to decline from 2,100 capita per km2 in 2010 to between 1,000 and 2,000 capita per km2 in 2050. Comparatively, in South Asia, urban population densities are expected to decline from about 19,000 capita per km2 to between 4,800 and 17,600 capita per km2 over the same period.
Scenario analysis can be a powerful approach to studying the relative influence of different demographic, economic, technological, and environmental trajectories on the growth and spatial configuration of urban areas. The European Union’s project, PLUREL (Peri-Urban Land Use Relationships), is a good example of this approach (Nilsson et al. 2015). Among the total of four scenarios they considered, a “Hypertech” scenario is likely to see small- and medium-sized towns becoming even more prominent, leading to increased peri-urbanization of rural areas. In a “Peak Oil” scenario, most people attempt to return to large cities because high transport costs will limit commuting distances. In their “Self-Reliance” scenario, considerable budgets will be spent on adaptation to climate change; people gravitate towards living in small, self-supporting communities. In the fourth scenario, where urbanized areas “Fragment,” cities become more dispersed and more segregated as younger migrants inhabit city centers, while older residents escape to enclaves outside the city. Across all future scenarios that researchers explored in the project, urban expansion will continue at rates that are higher than those of any other land use (Boitier et al. Reference Boitier, Da Costa, Le Mouel and Zagame2008).
1.4 Towards a Synthesis: A Typology of Urbanization?
Spatial-temporal typologies of urbanization have been studied intensively by geographers, economists, and other social scientists for many decades (Haase and Nuissl Reference Haase and Nuissl2010). The major factors that are thought to influence the aforementioned processes and types of urbanization are related to economic competition between different land uses/users (Thünen Reference Thünen von, Wartenberg and Hall1826; Alonso Reference Alonso1964) or between social/ethnic groups (Burgess Reference Burgess, Park, Burgess and McKennzie1925; Hoyt Reference Hoyt1939; Harris and Ullmann Reference Harris and Ullmann1945). More recent models regard the changing concentration of population in an urban area/agglomeration as key, and formulate a sequence of four phases of urban development: urbanization, suburbanization, desuburbanization, and reurbanization (Berg et al. Reference Berg, Drewett, Klaassen, Rossi and Vijverberg1982; Champion Reference Champion and Paddison2001; Kabisch and Haase Reference Kabisch and Haase2011). Others approached the dynamics and transformation of urban development based on complex systems theory (Wilson Reference Wilson1976), the theorem of fractal development represented by means of cellular automata (White and Engelen Reference White and Engelen1993; Batty Reference 38Batty2008) or systemic self-organization (Portugali Reference Portugali2000).
The multifaceted nature of urban areas and urbanization defies sweeping categorizations. Nevertheless, scholars have proposed several typologies of urban areas; most are grounded in specific geographies based on their various characteristics, such as peri-urban areas (Gonçalves et al. Reference 40Gonçalves, Gomes, Ezequiel, Moreira and Loupa-Ramos2017; von der Dunk et al. Reference Von Der Dunk, Grêt-Regamey, Dalang and Hersperger2011); city-industry dynamics (Hatuka and Ben-Joseph Reference 41Hatuka and Ben-Joseph2017); urban energy use (Creutzig et al. Reference Creutzig, Baiocchi, Bierkandt, Pichler and Seto2015); urban green infrastructure (Koc et al. Reference Koc, Osmond and Peters2016); urban form (Jabareen Reference Jabareen2006; Gil et al. Reference Gil, Beirão, Montenegro and Duarte2012); metropolitan land-use patterns (Cutsinger and Galster Reference Cutsinger and Galster2006); national urban policy (Holland Reference Holland2015); urban planning theories (Yiftachel Reference Yiftachel1989); and urban conflicts (Trudelle Reference 44Trudelle2003). For example, a rare attempt to develop a formal typology of urban areas across the world proposed four city types based on the rates and patterns of their spatial growth (Schneider and Woodcock Reference Schneider and Woodcock2008): low-growth cities with modest rates of infill development (residential densification); high-growth cities with rapid, fragmented development; expansive-growth cities with extensive dispersion at low population densities; and frantic-growth cities with extraordinary land conversion rates at high population densities. Another attempt at a formal, global urban topology, based on design concepts, proposes a different set of types of sustainable urban forms (Jabareen Reference Jabareen2006): the neo-traditional development, the urban containment, the compact city, and the eco-city. These limited-scope typologies and the collective body of work on the similarities and differences in urbanization trends around the world suggest that a broad typology of contemporary urbanization may be possible (see this volume’s concluding chapter, “Synthesis”).
1.5 Challenges and Opportunities of Urbanization Heading into the Twenty-First Century
Where will we stand at the end of the twenty-first century regarding urbanization? At 99 percent urbanites on earth? At 10 percent global urban land cover? These scenarios may seem preposterous, but they reflect an increasing realization that urban areas play increasingly influential roles in global change processes. It is this realization that led the United Nations General Assembly in September 2015 to adopt a full-fledged Sustainable Development Goal (or SDG) with a specific urban focus, SDG 11 (see https://sustainabledevelopment.un.org). The focus of SDG 11 is to “make cities and human settlements inclusive, safe, resilient, and sustainable.” While the various targets under SDG 11 are laudable, moving towards them means considerable effort and creativity will be needed to overcome the challenges urban areas face today. One potential caveat of SDG 11 in this respect is its apparent overreliance on techno-managerial approaches and institutional arrangements (Caprotti et al. Reference Caprotti, Cowley, Datta, Broto, Gao, Georgeson, Herrick, Odendaal and Joss2017). While metrics, indicators, and evaluation systems – all hallmarks of “smart cities” initiatives – can have their uses, they are not a panacea for the full spectrum of contemporary urban challenges. The issues revolving around the availability and veracity of the data that are needed to operationalize these metrics, indicators, and evaluation systems aside, there is a need to complement – and even contextualize – those data by approaches that heed political aspects and realities of urban challenges.
The challenges that urban areas will increasingly have to grapple with in the future involve climate change, access to basic services to secure human life, such as drinking water, food, clean air, healthcare (including basic sanitation requirements); and resilience to disasters (Dahiya Reference Dahiya2012a, Reference Dahiya2016); resilience is also listed among other SDGs to be met by 2030. By 2025, the annual rate of change of urban population is expected to be about 2 percent in developing regions and 0.5 percent in developed regions (UN-Habitat 2013), including extremely rapidly growing urban areas in the West African Belt and Asia, and shrinking cities in Europe, Russia, and the US Rust Belt (Dahiya Reference Dahiya2012a; Haase Reference Haase, Elmqvist, Fragkias and Güneralp2013). This will result in an increasing number of affluent, stagnating, or shrinking cities mainly in developed countries, and less affluent, fast growing cities mainly in developing countries. Both trends create enormous challenges in terms of infrastructure management and local governance, as nearly 37 percent of the world’s urban population currently lives in slums under inequitable conditions, and lack access to many urban amenities.
The notions of “circular urbanization,” “circular migration,” or “floating population,” all of which describe rural residents who come to cities to work but can be mobile, moving between the urban and the rural, further complicate the picture (Overseas Development Institute 2006; UN-Habitat 2010b). For example, the floating population in all of China’s cities amounts to 260 million individuals (UN-Habitat 2016). To accommodate such different trajectories of urbanization and types of cities, new approaches in urban policy and governance are needed. These approaches should take into account the spatial, temporal, and institutional scales inherent to urban governance. Furthermore, they need to be designed to empower urban stakeholders and to enhance public participation (Bai et al. Reference Bai, McAllister, Beaty and Taylor2010; Dahiya Reference Dahiya2012b, Reference Dahiya2014). To this list of challenges one can add promoting a fine-grained mix of housing types and providing attractive public realms, green-blue spaces, pedestrian-friendly streetscapes, and efficient, accessible public transportation, all of which are put forward by proponents of such urban design movements as New Urbanism.
Sustainable urbanization strategies need to focus on pro-poor dwelling developments, improved resource utilization, and better access to local economies to reduce unemployment and poverty as well as poverty-driven migration. New approaches of urban governance must be flexible to address emerging challenges effectively; for example, conceptual frameworks of urban planning may be more useful than an actual detailed plan, preparation of which often lags behind on-the-ground developments. Such an approach should also address formalization and regularization of land tenure, which represents a huge problem, especially in the cities of developing countries. Linkages among urban, peri-urban, and rural areas require improved coordination between urban governance and regional, national, and even international development planning. None of these challenges are insurmountable, and the very fact that there is an SDG – however imperfectly formulated – that directly addresses them raise hopes that they will be effectively tackled in the near future by urban and national governments.
Acknowledgments
We would like to thank the editors of the book for their inspiring ideas, intense discussion, and critical comments on earlier versions of this chapter, which helped to improve this piece of work tremendously. Dagmar Haase thanks the AXA Fund and the Royal Swedish Academy of Agriculture and Forestry Stockholm for generous financial support.
2.1 Cities in the Context of the Anthropocene
In this chapter, we argue for the need to take a complex systems approach to understand urbanization and its impacts based on its key variables and drivers: agents, emergence, self-organization, and criticality. A complex systems approach will necessitate a shift from viewing cities only as social-technological systems to viewing them also as social-ecological systems and, even further, as complex social-ecological-technological systems, or SETs (McPhearson et al. Reference McPhearson, Pickett, Grimm, Niemelä, Alberti and Elmqvist2016a; Depietri and McPhearson, Reference Depietri, McPhearson, Kabisch, Korn, Stadler and Bonn2017), involving the interactions and coevolution of social systems, living systems, and built systems.
Cities are one of the most distinctive features of the Anthropocene – a new geologic epoch characterized by the dominant influence of humanity on the environment – yet one of the least understood Earth systems. Philosophers have been curious about how cities emerge and function since the first appearance of human settlements 10,000 years ago, but both formal conceptualization and study of urban systems are more recent (Geddes Reference Geddes1915; Mumford Reference Mumford1961; Park 1925; Lynch Reference Lynch1961; Forrester Reference Forrester1969; Jacobs Reference Jacobs1969; Hall 1998). Over the last century, scholars in a broad array of disciplines have advanced various theories to explain urban dynamics. Such theories have evolved separately, in discrete domains, for more than a century, and strongly reflect a view of humans and natural systems as essentially separated from each other. Conceptualizations have commonly preceded attempts to study such systems empirically. The emergence of a new urban ecology beginning in the late 1990s represents the first significant attempt to integrate a diversity of approaches from a broad set of disciplines to advance understanding of cities as complex, coupled human-natural systems (Pickett et al. Reference Pickett, Wu, Cadenasso and Walker1999; Grimm et al. Reference Grimm, Grove, Pickett and Redman2000; Alberti et al. Reference Alberti, Marzluff, Shulenberger, Bradley, Ryan and Zumbrunnen2003; Grimm et al. Reference 64Grimm, Faeth, Golubiewski, Redman, Wu, Bai and Briggs2008; Alberti Reference Alberti2016; Bai Reference Bai2016; McPhearson et al. Reference McPhearson, Pickett, Grimm, Niemelä, Alberti and Elmqvist2016a).
Earlier theories of cities have been useful for describing a variety of urban phenomena, but cannot provide a general explanation of how cities emerge, persist, or collapse. The development of complexity theory has enabled scholars to begin asking such questions and making sense of various aspects of city function and dynamics. Cities across the globe exhibit unique patterns visible from space (Figure 2.1), reflecting diverse socioeconomic and biophysical characteristics, as well as their history and stage of development (Bai and Imura Reference Bai and Imura2000; Bai Reference Bai2003). Yet, the emerging patterns hint at universal principles of emergence, growth, and evolution of cities. We can ask: What do cities have in common, regardless of their geographical location and size? And which elements are specific to historical or geographic circumstance? Are there underlying mechanisms and universal laws of urban evolution (Bettencourt et al. Reference Bettencourt, Lobo, Helbing, Kuhnert and West2007; Batty Reference Batty2008)? As urban scientists have introduced mathematical rigor to the exploration of common urban properties across the world’s cities and high resolution data have become increasingly available, we begin to discover new insights for planning and policy-making. Yet the application of complex models and empirical explorations remain at an early stage (McPhearson et al. Reference McPhearson, Haase, Kabisch and Gren2016b). Urban ecology advances the need of a science of cities as coupled human-natural systems.

Figure 2.1 Cities’ patterns from space. NASA City Night Lights 1) New York City, 2) Paris, 3) Cairo, and 4) Tokyo.
2.2 The City as a Complex System
As major drivers of global change, cities have a prominent role in enabling the Earth’s transition to sustainability (see Chapter 1). Understanding the complex dynamics linking urban changes to social-ecological-technical change is critical to gaining new insights for the future of ecological and human well-being.
2.2.1 Agents
Cities are characterized by complex interactions among multiple heterogeneous agents and components across multiple scales. Agents are members of households, individual businesses, real estate developers, local and regional governments, nonprofit organizations, and academic institutions that make a variety of decisions affecting resources and land use. These agents are highly heterogeneous within and across cities and their decisions. Empirical evidence suggests that household residential location choices (Waddell 2013) or landscape management practices (Polsky et al. Reference Polsky, Grove, Knudson, Groffman, Bettez and Cavender-Bares2014) are influenced by their diverse characteristics, perceptions, and preferences. These decisions directly and indirectly affect the biophysical system through land conversion, exploitation of resources, and generation of emissions and waste. Businesses make decisions about production, location, and management practices. Members of households make choices about employment, residential location, housing type, travel mode, and other activities. Real estate developers make decisions about housing development and redevelopment. Governments shape urban resource flows and environmental impacts about investing in infrastructures and services, as well as adopting policies and regulations that influence agents’ interactions and the decisions they make (Bai Reference Bai2016). Decisions are made at the individual, community, city, and regional levels through both economic and social institutions.
2.2.2 Emergence
In cities and urbanizing regions, agents interact dynamically within communities and through social networks, economic markets, and many public institutions (including governmental and other nonprofit and nongovernmental organizations), giving rise to emergent properties. It is through these multiple interactions across time and space that urban agents generate observable emergent physical (for example, sprawl), behavioral (for example, travel), social (for example, neighborhood segregation), economic (for example, income, real estate values), ecological (for example, biodiversity), and environmental (for example, atmospheric pollution) patterns.
Urban segregation and inequality are examples of emergent patterns resulting from dynamic interactions among many agents and social groups and their residential choices which, in turn, are simultaneously influenced by personal preferences, job markets, land and real estate markets, and public policies and investments (Box 1.1). Emerging contemporary patterns of urban segregation are far more complex than typically represented by the average center-periphery pattern of early urbanization. In Brazilian cities, for example, Feitosa (Reference Feitosa2010) shows how political and socioeconomic changes that occurred in the 1980s significantly altered the patterns of urban segregation and the dynamic interactions that govern urban spatial configurations. The poor were not able to afford dwellings in the “legal city” or to build houses in irregular settlements (do Rio Caldeira Reference do Rio Caldeira2000; Torres et al. Reference Torres, Marques, Ferreira and Bitar2002). Instead, they initiated the proliferation of favelas in central areas even closer to wealthy neighborhoods. The emergent pattern challenges the spatial duality and socioecological homogeneity of urban spaces – the traditional allocation of affluent families in central neighborhoods, with poor families pushed to the peripheries – by diffusing and intermixing favelas located in different regions of the city, including those closer to wealthy neighborhoods (Torres et al. Reference Torres, Marques, Ferreira and Bitar2002).
Multiple feedback mechanisms between urban segregation and individual choices reinforce such patterns. Urban segregation has consistently led to negative consequences for the lives of urban inhabitants by reinforcing social exclusion, concentration of poverty, limited access to natural resources, environmental degradation, and greater exposure to environmental risks. As a result, segregation and institutionalized inequality substantially affects the capacity of cities to contribute to social and economic development (Sabatini et al. Reference Sabatini, Caceres and Cerda2001; Torres et al. Reference Torres, Marques, Ferreira and Bitar2003).
2.2.3 Self-Organization
As cities grow, they increase in complexity, yet such complexity is not fully guided or managed by an outside source; this development is self-organizing. In self-organizing systems, patterns and organization develop through interactions internal to the system. In Self-Organization and the City, Portugali (2002) introduces the notions of stability and instability across scales. Building on the example of urban segregation, the emergence of slums can be seen as the emergence of instability pockets essential to ensure global stability of the urban system (Portugali Reference Portugali2000; Barros and Sobriera Reference Barros and Sobriera2002). But a more in-depth examination uncovers the emergence of slums – traditionally considered to be and defined as “informal settlements” – as a complex socioecological phenomenon: the social production of habitat resulting from social exclusion (Zárate 2016).
Complexity and self-organization pose challenges to the dominant planning paradigm. Despite the increasing attention of planning scholarship to resilience science, planning practice has just begun to incorporate resilience principles and to move away from a steady-state approach and a view of planning as an outside agent controlling and directing urban change. There is an inherent tension between the self-organization properties of complex socioecological systems and the idea of planning towards a desirable societal goal. Transforming such tension towards a novel planning paradigm might be key to advancing both the discipline and the practice. Self-organization has important implications for the way systems evolve (Jorgenson Reference Jorgensen1997; Phillips Reference Phillips1999). Yet, various theories draw different conclusions. Phillips (Reference Phillips1999) suggests that the key question is how divergent self-organization and patterns are linked to instability and chaos, and how, together, they affect system evolution. The extent to which cities are self-organized and how this drives system dynamics is critical to understanding how to intervene in this complexity to achieve desirable goals for urban societies.
2.2.4 Criticality
Self-organized systems are at a critical state – a state in which perturbations are propagated over long temporal or large spatial scales (Bak Reference Bak1996). Such systems exhibit scale-invariance characteristic of the critical point (or attractor towards which a system tends to evolve) of a phase transition. An example is a sand pile in which local interactions result in frequent, small avalanches and infrequent large ones. In such systems, transitions can be triggered by external forces or internal changes in system feedbacks. Such “phase transitions” may be triggered by unpredictable external events, but often they result from endogenous underlying processes that maintain their stability and resilience.
There is increasing evidence indicating that major transitions in financial systems and ecosystems are typically preceded by gradual change in internal processes until they reach a threshold: a small external perturbation can trigger a domino effect that propagates through the system and causes a shift to a new state (Sheffer et al. Reference Sheffer, Hardenberg, Yizhaq, Shachak and Meron2013).
There are several documented examples of regime shifts in ecological systems: in lakes, coral reefs, oceans, and forests (Scheffer et al. Reference Scheffer, Carpenter, Foley, Folke and Walker2001). The literature also documents examples of regime shifts in human societies both in prehistoric human societies, such as Easter Island (Flenley and King Reference Flenley and King1984), and more recent examples across multiple regions of the world (Kinzig et al. Reference Kinzig, Ryan, Etienne, Allison, Elmqvist and Walker2006). But how the coupling between human and environmental systems adds to such complex dynamics is not fully understood (Liu et al. Reference Liu, Dietz, Carpenter, Alberti, Folke and Moran2007). In such systems, further nonlinearities affect the interactions between external and internal conditions and drive the system to a critical threshold that might cause a regime shift and/or system reorganization (Holling Reference Holling1973).
Hurricanes Sandy and Katrina clearly illustrate the unexpected shocks cities are likely to face in the next decades; both storms were a result of increasing climate extremes driving fast variables (that is, storm formation) and interacting with the slow, variable processes of wetland loss; increased human and infrastructure vulnerabilities associated with land cover change (that is, coastal development); transportation, housing, and energy sector vulnerabilities; and the build-up of system complexity over time (Sanderson et al. Reference Sanderson, Solecki, Waldman and Parris2016; Blum and Roberts Reference Blum and Roberts2009).
2.2.5 Biodiversity and Urban Areas as Socioecological Systems
Emergent patterns of biodiversity in cities illustrate the complex socioecological dynamics of urban ecosystems. Humans are affecting the abundance and distribution of species across the planet, and these impacts are projected to increase in this century (Pereira et al. Reference Pereira, Leadley, Proença, Alkemade, Scharlemann and Fernandez-Manjarrés2010; Pimm et al. Reference Pimm, Jenkins, Abell, Brooks, Gittleman, Joppa, Raven, Roberts and Sexton2014). The expansion of cities will triple urban land cover by 2030, compared to 2000, and will occur in areas of significant biodiversity hotspots (Seto et al. Reference Seto, Güneralp and Hutyra2012; see also Section 1). The future of urban biodiversity will depend on how cities spread, but also on socioecological interactions and on how habitat is preserved within cities. Attention to habitat size and connectivity will maintain not only species, but ecosystem processes and the evolutionary processes that allow adaptation and diversification within cities (Loreau et al. Reference Loreau, Mouquet and Gonzalez2003).
Urbanization transforms the biophysical structure of the landscape, which contributes to biodiversity change both directly within cities (McKinney Reference 65McKinney2008; Elmqvist et al. Reference Elmqvist, Fragkias, Goodness, Güneralp, Marcotullio and McDonald2013; Aronson et al. Reference Aronson, La Sorte, Nilon, Katti, Goddard and Lepczyk2014) as the expanding built environments alter habitat quality and connectivity, and at much larger scales as it indirectly drives habitat loss through trade demands for food and resources (Seto et al. Reference Seto, Güneralp and Hutyra2012). Cities also constitute habitat for many species. Many anthrophilic species do well in urban environments, and trends in the diversity of these species may increase as urban land cover increases (Aronson et al. Reference Aronson, Handel, La Puma and Clemants2015).
Aronson et al. (Reference Aronson, La Sorte, Nilon, Katti, Goddard and Lepczyk2014) compared 54 cities and found that the density of bird and plant species (number of species per km2) in cities has declined substantially: only 8 percent of native bird and 25 percent of native plant species are currently present compared with estimates of nonurban densities of species. Aronson et al. (Reference Aronson, La Sorte, Nilon, Katti, Goddard and Lepczyk2014) found that the density of species in cities and the loss of density of species was best explained by land cover and city age rather than by nonanthropogenic factors (such as geography and climate).
Beninde et al. (Reference Beninde, Veith and Hochkirch2015) conducted a meta-analysis of the factors mediating intra-urban bird, insect, and plant species richness across 75 cities worldwide. Their focus was on within-habitat species richness as opposed to city-scale species richness. They found that habitat patch areas and corridors (connected linear strips of habitat) have the strongest positive effects on species richness, along with vegetation structure. Large habitat patches of greater than 50 hectares in size are necessary to prevent the loss of area-sensitive species in cities. They only analyzed data for corridors from two cities, but the effects were marked for multiple taxa. Functional connectivity is vital to increasing the effective area of urban habitat, so networks of corridors are likely to help biodiversity conservation in cities (Rayfield et al. Reference Rayfield, Pelletier, Dumitru, Cardille and Gonzalez2015; Albert et al. Reference Albert, Rayfield, Dumitru and Gonzalez2017).
Our most complete data on urban biodiversity are from European and North American cities. We expect to find similar patterns of biodiversity change in cities in Asia and Africa, but monitoring is required to establish whether similar patterns of change will be observed over the coming century. Widespread adoption and implementation of a common indicator set, such as the City Biodiversity Index (Kosaka et al. 2013), will further foster comparisons across cities. Biodiversity is integral to the ecosystem services that benefit people in urban environments (such as microbial diversity, which influences human immune system health (Rook Reference Rook2013); as such, these monitoring programs would also reveal how changes in biodiversity affect the quality of ecosystem services.
2.2.6 Adaptation and Eco-Evolutionary Dynamics of Biodiversity
Evidence that cities drive microevolutionary change poses new challenges for the study of urban sustainability (Palkovacs et al. Reference Palkovacs, Kinnison, Correa, Dalton and Hendry2012; Alberti Reference Alberti2015; Alberti et al. 2017a). By examining more than 1,600 observations of phenotypic change in species across the globe, Alberti et al. (2017a) were able to detect a clear urban signal. Examples of phenotypic changes driven by urbanization have been documented for many species of birds, fish, plants, mammals, and invertebrates (Yeh and Price Reference Yeh and Price2004; Carlson et al. Reference Carlson, Quinn and Hendry2011; Haas et al. Reference Haas, Blum and Heins2010; Cheptou et al. Reference Cheptou, Carrue, Rouifed and Cantarel2008; Jacquemyn et al. Reference Jacquemyn, De Meester, Jongejans and Honnay2012; Alberti et al. 2017b). Humans in cities affect species composition and their functional roles by selectively determining phenotypic trait diversity and causing organisms to undergo rapid evolutionary change. Changes in individuals, populations, and communities have cascading effects on ecosystem functions and human well-being, including biodiversity, nutrient cycling, seed dispersal, food production, and human health (Alberti Reference Alberti2015).
Several scholars of urban ecology are exploring the link between phenotypic change and their effects on ecosystem functions in urbanizing regions (Marzluff Reference Marzluff2012; Donihue and Lambert 2014; Alberti Reference Alberti2015; Alberti et al. 2017a). The emergence of eco-evolutionary feedbacks on contemporary time scales (Pimental Reference Pimentel1961; Schoener Reference Schoener2011) might affect ecosystem productivity and stability of cities (Matthew et al. Reference Matthews, Narwani, Hausch, Nonaka, Peter, Yamamichi and Sullam2011). For example, the physical structure of estuarine and coastal environments is maintained by a diversity of organisms, particularly dune and marsh plants, mangroves, and seagrasses. Evolution in traits underlying their ecosystem-engineering effects has potentially significant functional impacts on coastal cities’ resilience. Other examples of ecosystem functions relevant to both ecosystem and human well-being include nutrient cycling and primary productivity regulated by consumers’ traits, which control their demand for resources. Understanding the mechanisms by which human agency affects evolutionary feedback is critical to anticipating future evolutionary trajectories in cities.
2.2.7 Resilience
One important attribute of a complex system is resilience, which, for cities, can be translated to the ability to maintain human and ecosystem functions simultaneously over the long-term (Alberti and Marzluff Reference 62Alberti and Marzluff2004; see also Chapter 7). In cities, ecological and human functions are interdependent. Urban sprawl can cause rapid shifts in the quality of natural habitat, from a well-connected natural land cover to a state in which the natural land cover is greatly reduced and highly fragmented (Dupras et al. Reference Dupras, Alam and Revéret2015). Sprawl is a dynamic gradient of urban land cover that results when urban dwellers and real estate developers operate without taking into account the full social and ecological costs of providing human services to low-density development (Alberti and Marzluff Reference 62Alberti and Marzluff2004).
Patterns of urban development and infrastructure play a key role in maintaining the capacity of urban regions to adapt in the face of urban growth and environmental change. For example, we know that urban sprawl drives loss of forest cover and natural habitat and threatens biodiversity (Elmqvist et al. Reference Elmqvist, Fragkias, Goodness, Güneralp, Marcotullio and McDonald2013). The amount of impervious surface and the density of roads is associated with loss of ecological integrity of streams, and hydrological changes associated with urbanization and shoreline hardening increase the vulnerability of coastal cities to floods. Yet, we do not know how different urban forms, densities, land-use mix, and types of infrastructures affect the diverse ecological processes that affect ecological conditions and human well-being. Nor do we fully understand the trade-offs associated with different housing or infrastructure alternatives (Alberti Reference Alberti2010). New patterns of urbanization pose additional challenges to characterizing mismatches between supply and demand of ecological goods and services that require cross-boundary and cross-scale considerations (Kremer et al. Reference Kremer, Hamstead, Haase, McPhearson, Frantzeskaki and Andersson2016; McPhearson et al. Reference McPhearson, Andersson, Elmqvist and Frantzeskaki2015).
Resilience in urbanizing regions depends on variable biophysical and socioeconomic conditions as well as stage of urban development; resilience in a city and its surrounding region is highly affected by its infrastructure. Cities provide unique opportunities to rethink and establish novel, integrated infrastructure systems such as, sustainable energy systems that rely on renewable energy sources (Kammen and Sunter Reference Kammen and Sunter2016). Technological developments, in turn, have the potential to influence future urban trajectories. Using two cases of large hydraulic works in the Dutch delta, van Staveren and van Tatenhove (Reference van Staveren and van Tatenhove2016) illustrate how past technological interventions can profoundly shape the direction in which deltas develop.
2.3 Urban Social-Ecological-Technical Systems and Innovation
Advancing social-ecological conceptual frameworks for understanding complex dynamics of urbanization requires explicitly representing the built infrastructure and technological components of urban systems (Ramaswami et al. Reference 66Ramaswami, Chavez and Chertow2012; McPhearson et al. Reference McPhearson, Pickett, Grimm, Niemelä, Alberti and Elmqvist2016a; Depietri and McPhearson, Reference Depietri, McPhearson, Kabisch, Korn, Stadler and Bonn2017) and the relative change in urban metabolism that their development implies (Kennedy et al. Reference Kennedy, Cuddihy and Engel-Yan2007; Kennedy et al. 2009). More recent studies attempt to provide conceptual bridges between urban metabolism and urban ecosystem studies (Bai Reference Bai2016). Cities depend on larger-scale built infrastructures (such as electric power, water supply, and transportation networks) that sustain flows of resources over large distances. The new, emerging patterns of urbanization (including city regions, urban corridors, and mega-regions) result from the evolution of technology and generate new demand for infrastructure systems that require further technological innovation. Urban regions operate as hubs of global and regional flows of people, capital, services, and information that drive the global economy (Sassen Reference Sassen2012). Yet, the rapid socioeconomic and environmental changes cities are both causing and experiencing pose new challenges to infrastructure systems, exacerbated by the inability of many cities to keep pace with rapid urban growth and the lack of appropriate institutional and governance structures to respond to emergent problems.
Transitions in complex systems pose great challenges to system stability and resilience, but are also an important source of novelty and transformation (Alberti Reference Alberti2016). While cities are often associated with poverty concentration, slum proliferation, and social and environmental problems, they have also traditionally been the centers of economic growth and innovation. Urban areas house 54 percent of the global population and generate more than 70 percent of global GDP (UN-Habitat 2016). Empirical data across many cities show that close interactions among diverse people in cities foster collaborative creativity and the capacity to innovate. Recent studies have explored the relationships between important measures of outputs from socioeconomic processes in cities and population size, providing ample evidence that important properties of cities of all sizes increase, on average, faster (socioeconomic superlinearity) or slower (material infrastructure sublinearity) than city population size (Bettencourt 2013). Bettencourt et al. (2010) found that income and innovation change in a consistently superlinear manner (with exponent β ~1+ 1/6) in response to growth, showing increasing returns, while infrastructure responds sublinearly (β ~ 1–1/6), suggesting economies of scale in material infrastructure relative to population growth (Figure 2.2).
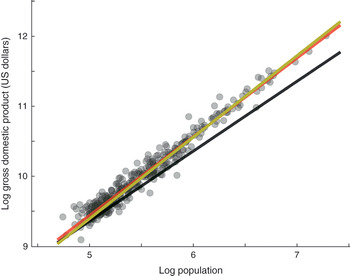
Figure 2.2 The scaling of gross domestic product as a function of city population.
To explain why the emergent patterns observed in cities are a special case of complex natural systems, Bettencourt (2013) compares cities to stars. Cities attract people and accelerate social interaction and social outputs in a manner that is analogous to the way in which stars compress matter and burn brighter and faster with increased size. Social interactions – efficient social networks, embedded in space and time, that evolve – make the city a new phenomenon in nature. Yet, in spite of a city’s fast pace and rapid evolution, achieving sustainability depends not only on the ability to innovate, but also on the type of innovation that is performed.
As centers of innovation, cities have the potential to play a prominent role in reorienting patterns of urbanization and infrastructure towards sustainability – for example, through integrated renewable energy systems (McPhearson et al. Reference McPhearson, Parnell, Simon, Gaffney, Elmqvist and Bai2016c). Yet, innovation and novelty are part of a tightly coupled system of socioeconomic and environmental drivers mediated by both built infrastructure and technological systems. For example, the generation and adoption of efficient technologies (including those that relate to energy, water, and CO2 emissions) are driven by a complex interplay between increasing social interactions (such as social networks), the quality of urban ecosystems, and increasing environmental changes (such as extreme climatic events), but also by the vulnerability and resilience of the city to these changes. In cities, the built infrastructure and natural infrastructure play critical roles in reducing vulnerability, mitigating hazards, and responding to disasters. Technological innovation and its diffusion depend on socioeconomic conditions, urban development policies, and institutional capacity. Scholars have begun to explore the relationships between emerging novel governance and management systems and socioecological innovation (Walker et al. Reference Walker, Holling, Carpenter and Kinzig2004; Chapin et al. Reference Chapin, Carpenter, Kofinas, Folke, Abel and Clark2010; Folke et al. Reference Folke, Carpenter, Walker, Scheffer, Chapin and Rockström2010; Westley et al. Reference Westley, Olsson, Folke, Homer-Dixon, Vredenburg and Loorbach2011; Olsen et al. Reference Olsson, Galaz and Boonstra2014). Furthermore, the importance of these factors can vary across cultures and biomes.
Recent work by international organizations focused on improving slum conditions and preventing their formation is reflected by a decrease from 39 percent to 30 percent of urban populations living in slums in developing countries between 2000 and 2014. Yet, absolute numbers of people living in slums continue to rise as a result of rapid urbanization and overall global population growth, as well as the failure of cities to provide appropriate housing and manage growth. Transforming slums into sustainable urban settlements requires a new understanding of slums as complex phenomena emerging from the interactions of multiple forces and the recognition of these emergent settlements not as “informal,” but as a “social production of habitat” – a definition intended to describe people producing their own habitat: dwellings, villages, neighborhoods, and even large parts of cities (Zárate 2016).
Slum settlements are an example of a complex urban phenomenon with significant implications for the sustainability of an urban planet. Across the globe today, one in eight people (approximately 881 million) lives in slums, and this number is expected to increase in the near future (UN-Habitat 2016). According to the UN, the number of slum dwellers continues to increase, despite the decline in the proportion of the urban population residing in slums. Slums are a challenge to sustainable transitions for humanity: they increase poverty and demands on basic services in urban areas, threaten human health, and exert stresses on the environment. Spontaneous settlements typically occur in the most environmentally vulnerable areas, and their lack of proper sanitation and waste management systems are major sources of both environmental pollution and the spread of infectious diseases.
Among the various informal settlements associated with rapid urbanization, slums are a particularly challenging and urgent global phenomenon due to the perpetual poverty, deprivation, and sociospatial exclusion of slum dwellers, and due to their impacts on the overall prosperity of the cities in which they exist.
Both the emergent patterns of informal settlements and their evolution reflect the interaction of multiple factors and contrasting forces: population growth; rural-to-urban migration; weak governance; economic vulnerability and underpayment for labor; displacement caused by conflict, natural disasters and climate change; and, significantly, the lack of affordable housing options for the urban poor as governments increasingly disengage from a direct role in provision of housing. The complex interaction of these diverse factors often causes the housing sector to become susceptible to domination by speculative forces that tend to benefit affluent urban residents (UN-Habitat 2015).
For example, by comparing the current patterns of urban segregation to the traditional center-periphery pattern in Brazilian cities, Feitosa (Reference Feitosa2010) shows that complex interactions among bottom-up and top-down processes and mechanisms operate at multiple scales. A new pattern of segregation has resulted from the political and socioeconomic changes of the 1980s, superimposed on the typical center-periphery pattern that separates the wealthy from poor urban dwellers (do Rio Caldeira Reference do Rio Caldeira2000; Lago Reference Lago2000; Torres et al. Reference Torres, Marques, Ferreira and Bitar2002). The slowing of the Brazilian economy during the 1980s and a corresponding decline in per capita income led to an impoverishment of the population and an increase in social inequalities. The simultaneous establishment of the Federal Law for Urban Land Parceling (6766/79), which regulates the minimal requirements for development of urban settlements and was intended to improve access to infrastructure and public facilities of the periphery, promoted a larger social diversity in areas that were only occupied by the lower classes (do Rio Caldeira Reference do Rio Caldeira2000; Lago Reference Lago2000) while increasing the number of urban dwellers unable to afford the “legal city” or even to build their own dwellings in “irregular” settlements (Feitosa Reference Feitosa2010). Together, these factors prompted the emergence of favelas, the Brazilian slums found throughout various regions of the city, even in close proximity to wealthy neighborhoods (Torres et al. Reference Torres, Marques, Ferreira and Bitar2002).
What characterizes slums, from an urban complex dynamic perspective, is not location, but the living conditions experienced inside them. A slum, according to UN-Habitat, is a settlement in which the inhabitants suffer one or more of the following “household deprivations”: lack of access to an improved water source, lack of access to improved sanitation facilities, lack of sufficient living area, lack of housing durability, and lack of security of tenure (UN-Habitat 2011). The persistence of slums is the result of a reinforcing mechanism or positive feedback. Increased poverty and lack of basic infrastructure and services, together with a degraded and unhealthy environment, drive the emergence, persistence, and growth of slums both in developing and developed countries. Actions to improve slum living conditions require promoting policies and incentives that operate simultaneously on multiple levels, linking urban planning, financing, and legal and livelihood components from the bottom up. Transition to a sustainable future for urban slums implies acknowledgment of the self-organizing nature of such phenomena and the opportunities inherent in this self-organization for reorienting urban slums towards urban sustainability.
2.4 Complexity of Coupled Human-Natural Systems
Over the last three decades, complexity theory has provided a new basis for understanding how myriad local interactions among multiple agents can generate simple behavioral patterns and ordered structures. Cities are nonequilibrium systems; random events produce system shifts, discontinuities, and bifurcations (Krugman Reference Krugman1993, Reference Krugman1998; Batty Reference Batty2005), and patterns emerge from complex interactions that take place at the local scale, suggesting that urban development self-organizes (Batten Reference Batten2001). Emergent patterns are often scale-invariant and fractal, indicating that the emergent morphology of cities results from self-organizing processes operating at the local scale (Batty and Longley Reference Batty and Longley1994; Allen Reference Allen1997).
Understanding the complex relationships between patterns of urban development and the processes that maintain ecosystem function and resilience in urban areas requires a new framework to uncover the mechanisms that determine the relationship dynamics of urban ecosystem services and their roles in maintaining resilience of urbanizing regions (McPhearson et al. Reference McPhearson, Andersson, Elmqvist and Frantzeskaki2015). Urban systems are hybrid ecosystems and several types of new hybrid functions may emerge from these interactions. For example, barrier islands in urbanizing estuaries are part of a tightly coupled system of human and ecosystem processes; they perform the hybrid function of protecting estuary biodiversity and controlling coastal flooding (Alberti Reference Alberti2016).
The rapid advancement of computer power, together with the remarkable emerging availability of high-resolution social and ecological data, provides unprecedented opportunities to reframe our questions (Figure 2.3). Insteadof asking how patterns of human settlements and activities affect social and ecosystem processes, we can ask: How do humans, interacting with their biophysical environment, generate emergent phenomena in urbanizing ecosystems, and how do these patterns selectively amplify or dampen human and ecological processes and functions? Cities are coupled human-natural systems in which people are dominant agents with a new capacity to redefine the rules of nature’s game (Alberti Reference Alberti2016). Although extensive urban research has focused on the dynamics of urban systems and their ecology, efforts to understand urban systems in an integrated manner are relatively recent and are only beginning to address the processes and variables that couple human and ecological functions (McPhearson et al. Reference McPhearson, Pickett, Grimm, Niemelä, Alberti and Elmqvist2016a; Bai Reference Bai2016).


Figure 2.3 Examples of high-resolution tree species diversity (Street Tree Census, NYC), property values (Assessor data, NYC), and energy intensity (Energy consumption, NYC).
Scholars of both urban development and ecology have begun to recognize the importance of explicitly considering human and ecological processes in studying urban systems. Yet building an integrated approach to advancing such understanding challenges scholars from different disciplines to revise fundamental assumptions in their disciplines with regard to humans and ecosystems.
2.5 Insights for Urban Planning from Complexity Science
To navigate the transition towards a sustainable urban future, it is necessary that we understand cities as integrated social, economic, and physical systems in more precise and predictive ways. This requires quantitative models of the internal structures of cities and of the interactions between cities and the Earth’s natural environments that account for the processes of human development and economic growth, as well as their feedbacks on patterns of urban development. It also poses new challenges and offers insights for rethinking planning theory to more effectively contribute to urban governance in an era of global change (Wilkinson Reference Wilkinson2012). Emerging socioecological innovations across world cities indicate possible pathways to set new trajectories for the future of our urban planet. By developing and analyzing qualitative scenarios combined with modeling grounded in new empirical analysis, we can begin to assess strategies and uncover transformational pathways for cities to transition to more desirable and sustainable futures (McPhearson et al. Reference McPhearson, Iwaniec and Bai2017).
How can we plan in the face of complexity? What can we learn from complexity science that will help guide urban design and planning? An initial series of questions directs planners towards new perspectives on problem definitions: How do we define the problem? What are the boundaries of the system? What is the spatial scale of the analysis? What is the time horizon? What are the components (ecological, social, political, economic) within the system? What are the connections and feedbacks (physical, biogeochemical, biotic, social, economic, political)? What are the drivers? What is controllable? Where are the control points? What is known? What is ambiguous or uncertain? What might plausibly be changed? What information do we need to assess alternative problem solving strategies?
Complexity science provides new tools to conceptualize the city and urban regions as complex systems (Bettencourt 2013) and indicates key principles to guide their planning and management (Ahern Reference Ahern2013; Alberti Reference Alberti2016):
1. Diversity and modularity: Create and maintain diverse development patterns and modular infrastructure systems that support diverse human and ecosystem functions under different conditions and uncertain scenarios.
2. Self-organization: Focus on maintaining self-organization and increasing the capacity of coupled human-natural systems to adapt instead of aiming to control change and to reduce uncertainty.
3. Uncertainty: Expand the ability to consider uncertainty and surprise in urban decision-making by designing strategies and built infrastructure systems that are robust to the most divergent plausible futures.
4. Adaptation: Create options for learning through experimentation, and opportunities to adapt through flexible policies and strategies that mimic the diversity of environmental and human communities.
5. Transformation: Expand the institutional capacity for change through transformative learning by challenging assumptions and actively reconfiguring problem solving.
2.5.1 Conclusion
The increasing pressure from climate change (Rosenzweig et al. Reference Rosenzweig, Solecki, Hammer and Mehrotra2010), rapid urbanization (UN 2014), and the rapid development of infrastructure to prepare for these changes all pose new challenges to urban decision-makers to make important investment decisions while navigating complexity (McPhearson et al. Reference McPhearson, Haase, Kabisch and Gren2016b). Tackling complexity and uncertainly in urban systems is challenging and will require new evidence, approaches, and tools. It will demand a new level of collaboration among ecologists, geographers, sociologists, political scientists, economists, planners, designers, and other disciplines to advance the field of urban ecology into a new urban science (McPhearson et al. Reference McPhearson, Pickett, Grimm, Niemelä, Alberti and Elmqvist2016a; Alberti Reference Alberti2017). To meet this demand, scholars will need to be able to identify examples of new practices that highlight opportunities for improving urban resilience and sustainability at the local and global scales (McHale et al. Reference McHale, Pickett, Barbosa, Bunn, Cadenasso and Childers2015).
3.1 Introduction
Eighty percent of the world’s population is expected to live in urban areas by 2050 and will demand a high density of infrastructure in order to meet human development aspirations. Occupying nearly 3 percent of the total global land surface, cities are also the centers for nearly 80 percent of the global domestic product, or GDP (UNEP 2012) (see Chapter 6). Meanwhile, cities are also global catalysts for 50 percent of solid wastes, 75 percent of natural resource consumption, and between 60 and 80 percent of greenhouse gas, or GHG, emissions (UNEP 2012). These functions present a plethora of infrastructure-related opportunities for efficiency integration, as infrastructure provides access to essential goods and services that are linked to human development and health. Yet, infrastructure, while essential, is also the source of many environmental problems caused through direct and indirect emissions. It is estimated that present-day infrastructure is responsible for 122 gigatonnes (Gt) CO2, with developed countries owning a per capita infrastructure footprint five times larger than their developing country counterparts (Müller et al. Reference Müller, Lui, Løvik, Modaresi, Pauliuk, Steinhoff and Brattebø2013). Moreover, Müeller and colleagues estimate that if all infrastructure needs are met using typical Western technologies, the environmental impact would amount to 350 Gt CO2, or seven times the current global GHG emissions of 50 Gt CO2.
Urbanization will continue to be the stimulus for new infrastructure; although global average annual urbanization rates in 2050 are projected to occur at half of today’s rate (from 2 percent today to 1 percent in 2050), urbanization in less-developed regions will occur at an annual rate of change of approximately 1.5 percent, while it will occur at a rate of more-developed regions at a rate of 0.25 percent, leading to a continued high demand for infrastructure in developing regions. What is not as clear, and what is often overlooked, is where the impacts of urbanization will be most observed. And while large urban agglomerations, for a host of reasons, are often centers of research about urbanization phenomena, we should also consider the suite of smaller urban areas that are in the midst of substantial transformations of their own. Of the global urban population, most – 51 percent – of urban dwellers reside in communities of less than 500,000 inhabitants (see Figure 3.1). Moreover, by 2030, almost 40 percent of the global urban population will be located in communities of less than 300,000 inhabitants, many of which will demand infrastructure and whose activities may incur substantial environmental impacts, if not adequately designed. Thus, in the face of urbanization and infrastructure development, it is imperative that we understand the effects that urbanization and associated infrastructure development can have on the material and energy demands associated with cities and communities everywhere. Such an understanding may trigger efficiency gains related to the services that infrastructure provides. One way to understand and measure changes in efficiency gains is through the concept of “urban metabolism.”

Figure 3.1 Urban population by community size for cities of five unique sizes. Note that smaller cities/communities of 500,000 inhabitants or less will continue to house the majority (approximately 50 percent) of the world’s urban population.
In this chapter, we discuss the concept of urban metabolism and how it has been and can be used to understand the resource flows and environmental impacts associated with cities. Even though in this chapter we loosely adopt the commonly used nomenclature of urban metabolism to represent all communities, it is important to note that urban and rural communities alike, have associated metabolic flows; some scholars have begun articulating the concept of community metabolisms (Chávez Reference Chávez, Dhakal and Ruth2017) and rural metabolisms (Haas and Krausmann Reference Haas and Krausmann2015). Thus, the urban metabolism framework is a form of modeling and assessing community processes, whether individually or in aggregation, to gain greater understanding of material and energy flows associated with communities. Since the seminal work of Abel Wolman (Reference Wolman1965), many lines of research inquiry about urban metabolism have been undertaken, and some cities have adopted the concept to study their own resource flows associated with material and energy in their aims to integrate efficient, sustainable, and resilient material and energy flows. As we will show later in this chapter, urban metabolism analysis has also undergone its own transitions in terms of its definition of the urban boundary – early studies took a strictly “boundary-limited perspective,” whereas the latest studies define the boundary to include a community’s hinterlands, encompassing the supply chains associated with a community. The chosen definition of boundary has substantial impacts on the scope of resilience that must be incorporated to hedge against resource shocks.
We will begin by presenting an overview of research focusing on urban metabolism. Then, recalling that urban metabolism is ultimately concerned with measuring material and energy stocks and flows, we will describe some of the conceptual and methodological advances that have emerged from the urban metabolism foundation. Next, we will present how communities have and might consider incorporating the metabolism framework for sustainable and resilient system development. Last, we will comment on the challenges that lie ahead.
3.2 Urban Metabolism: Material and Energy Flows
3.2.1 A Historical Perspective and Updated Understanding
Urban metabolism is a socionatural metaphor originally developed in the 1960s by Abel Wolman as a form to study city-scale material and energy flows. Though various concepts central to urban metabolism have been present since the nineteenth century, Wolman’s work (Reference Wolman1965), in which he attempted to quantify the material and energy flows for a hypothetical US city of one million people, organizes them under one idea: a city’s metabolism, which he defined as “all the materials and commodities needed to sustain the city’s inhabitants at home, at work and at play” (Wolman Reference Wolman1965). Since then, there has been an intensification of urban metabolic research yielding several new questions and novel understanding of city metabolic flows. Figure 3.2 represents a modern urban metabolism concept.

Figure 3.2 Conceptual diagram of urban metabolism. A proportion of the resources that flow into cities become urban stock, while others enable and drive various anthropogenic functions and eventually produce intended or unintended outputs that stay within the system boundary or are exported beyond the boundary, with various impacts on the physical environment, flora and fauna, and associated ecological processes. Urban metabolism is shaped and regulated by factors such as urban policy, urban governance, culture, and individual behaviors.
Building on Wolman’s foundation, the 1970s produced the first set of actual urban metabolism case studies. Under the UNESCO Man and Biosphere Program, researchers applied urban metabolism approaches in Brussels (Duvigneaud and Denaeyer-De Smet Reference Duvigneaud, Denaeyer-De Smet, Duvigneaud and Kestemont1977), Hong Kong (Newcombe et al. Reference Newcombe, Kalma and Aston1978) and Tokyo (Hanya and Ambe Reference Hanya and Ambe1976). After a hiatus in the 1980s, interest in urban metabolism reemerged in the 1990s with research by Stephen Boyden and Peter Newman for Australian cities (Boyden et al. Reference Boyden, Millar, Newcombe and O’Neill1981; Newman Reference Newman1999); in Austria and Switzerland with work by Peter Baccini and Paul Brunner (Baccini and Brunner Reference Baccini and Brunner1991); and with work by French ecologist Herbert Girardet (Girardet Reference 88Girardet1992). As more studies emerged, Kennedy et al. (Reference Kennedy, Cuddihy and Engel Yan2007) conducted a comparison of the metabolisms of eight metropolitan regions, identifying metabolic processes that potentially undermine the sustainability of cities, including changing groundwater levels, build-up of toxic materials, exhaustion of local materials, heat islands, and accumulation of nutrients. Barles completed a metabolic assessment for Paris (Barles Reference Barles2009) and later explored the relation of urban metabolism to sustainable urban development (Barles Reference Barles2010). Standardized and quantitative urban metabolism models also emerged from this work (Niza et al. Reference Niza, Rosado and Ferrão2009). In this body of work, we observe a progression of urban metabolism research based on increasing understanding of coverage, scale, links to socioeconomic contexts, and spatial and temporal variations of metabolic flows (Bai Reference Bai2016).
From the first urban metabolism studies to today’s cross-cutting research, urban metabolism has witnessed much transformation. Earlier, urban metabolism studies developed and applied methods that measured “economy-wide” material flows that were primarily defined by a community’s physical boundary. These studies, including Wolman’s Reference Wolman1965 work, considered water and fuel inputs coupled with outputs such as sewage and air pollutants. With time, the scope of economy-wide activities expanded to include additional inputs such as land, food, and building materials, along with a set of emerging socioeconomic indices by which to benchmark cities’ metabolic flows (see Newman Reference Newman1999, for example). More recently, a growing amount of research has examined the metabolisms associated with biogeochemical fluxes due to their substantially higher resource intensities, even though such fluxes represent only a small portion of a city’s material flows. Flows of nitrogen and phosphorus, for instance, have been shown to merit additional research because their impacts transcend a city’s boundaries (Baker et al. Reference Baker, Hope, Xu, Edmonds and Lauver2001; Metson et al. Reference Metson, Iwaniec, Baker, Bennett, Childers and Cordell2015; Lin et al. Reference Lin, Wang, Bai, Zhang, Li, Ge and Ye2016; Cui et al. Reference Cui, Xu, Huang, Bai, Huang and Li2015). Finally, as the understanding of the true inputs and outputs associated with a typical community has evolved, so has the collective understanding of what “economy-wide” means. Early urban metabolism studies frequently adopted a purely boundary-limited definition (that is, a purely jurisdictional definition) of a community and accounted for direct flows only. However, more recent applications of the urban metabolism approach conform with global standards, which call for the inclusion of indirect or embodied flows. For example, Chester et al. (Reference Chester, Pincetl and Allenby2012) were one of the first research teams to couple the concept of urban metabolism with life cycle analysis, offering twofold benefits: providing a robust perspective on a community’s metabolism while assisting in avoiding the shifting of burdens or responsibilities to other communities.
The usefulness of urban metabolism studies increased with the recognition that they provided the necessary activity data required to conduct greenhouse gas inventories for cities (Kennedy et al. Reference Kennedy, Steinberger, Gasson, Hillman, Havránek and Hansen2009, Reference Kennedy, Steinberger, Gasson, Hillman, Havránek and Hansen2010). Some studies have used the urban metabolism framework to develop measures of resource efficiency in cities (Baccini and Oswald Reference Baccini, Oswald and Hadorn2008; Zhang and Yang Reference Zhang and Yang2007; Browne et al. Reference Browne, O’Regan and Moles2009). Bai (Reference Bai2007) emphasizes the importance of policy and regulations in regulating metabolic flows. Other applications of urban metabolism include the development of sustainability indicators, mathematical modeling for policy analysis, and use as a basis for design (Newman Reference Newman1999; Kennedy et al. Reference Kennedy, Pincetl and Bunje2011; Chávez and Ramaswami Reference Chávez and Ramaswami2013).
The literature on urban metabolism has increased substantially in the past decade. A search using Scopus, a database of peer-reviewed literature, showed that the number of papers on urban metabolism increased from about two per year in 2000 to about 50 per year in 2014 (Kennedy Reference Kennedy, Clift and Druckman2015). This is encouraging for efforts to make collection of metabolism data a mainstream activity for cities (Kennedy and Hoornweg Reference Kennedy and Hoornweg2012). Included among the later literature are spatially disaggregated studies within cities, studies about life cycle extensions of urban metabolism, and various studies considering particular components of the urban metabolism; for instance, moving away from the early work’s limited focus on specific flows, bulk, and boundary-limited scope, more recent work has measured above- and below-ground infrastructure-related material flows (see Tanikawa and Hashimoto Reference Tanikawa and Hashimoto2009, for example) as well as delving into cross-cutting, multidisciplinary, and life-cycle-based research (see Kennedy Reference Kennedy, Clift and Druckman2015 and Chávez and Ramaswami Reference Chávez and Ramaswami2013). The study of urban metabolism now includes increasingly broader interdisciplinary contexts, engaging urban planners, engineers, political scientists, ecologists, and industrial ecologists, among others (Castán Broto et al. Reference Castán Broto, Allen and Rapoport2012; Newell and Cousins Reference Newell and Cousins2014).
Textbooks by Ferrão and Fernández (Reference Ferrão and Fernández2013) and Baccini and Brunner (Reference Baccini and Brunner2012) provide extensive details on the urban metabolism. Literature reviews on urban metabolism include those by Kennedy et al. (Reference Kennedy, Pincetl and Bunje2011), Holmes and Pincetl (Reference Holmes and Pincetl2012), Zhang (Reference Zhang2013), Bai (Reference Bai2016), and Beloin-Saint-Pierre et al. (Reference Beloin-Saint-Pierre, Rugani, Lasvaux, Mailhac, Popovici and Sibiude2016). Weisz and Steinberger (Reference Weisz and Steinberger2010) discuss the challenges of reducing material and energy flows in cities. Kennedy (Reference Kennedy, Weinstein and Turner2012) provides a simple mathematical model broadly linking the quantity and performance of infrastructure stocks to urban metabolism.
On a more conceptual level, Bai (Reference Bai2016) argues that the approach and empirical findings of urban metabolism studies have the potential, although not fully realized, to contribute significantly to the understanding of cities as human dominant, complex socioecological systems. In an attempt to build conceptual bridges between urban metabolism studies, which views the city as an organism, and urban ecosystem studies, which view cities as an ecosystem, Bai (Reference Bai2016) identified eight urban ecosystem characteristics that urban metabolism research reveals: energy and material budget and pathways; flow intensity; energy and material efficiency; rate of resource depletion, accumulation, and transformation; self-sufficiency or external dependency; intrasystem heterogeneity; intersystem and temporal variation; and regulating mechanisms and governing capacity.
3.2.2 Urban Boundaries
One of the cross-cutting questions in all of the urban studies is where to draw the boundary around a city, recognizing that the boundary itself has most likely changed over time. Drawing the boundary too narrowly carries the risk of insufficient recognition of the “urban system.” Drawing it too broadly can dilute the unique elements of the urban core. Because researchers approach urban issues from so many different disciplinary directions, many overlapping approaches and tools arise that can lead to confusion and need to be sorted out.
Recent iterations of urban metabolism have redefined the definition of “economy” to extend the urban boundary beyond the traditional boundary-limited approach, which has allowed for the inclusion of linkages between cities and their hinterlands – where the hinterland itself can vary between regional to global (for example, Pichler et al. Reference Pichler, Zwickel, Chávez, Kretschmer, Seddon and Weisz2017). While still considered urban metabolism, said studies yield a footprint such as ecological, water, or carbon footprints. Moreover, these footprints can include industrial and/or supply-chain impacts further up the chain of production, but can also be focused on consumption-based footprints involving households and governments in cities, which are the “final consumers” of what has been produced whether locally or imported from outside (Chávez and Ramaswami Reference Chávez and Ramaswami2013; Ramaswami et al. Reference Ramaswami, Chávez and Chertow2012). For example, in a study looking at consumption-based (that is, household) GHG emissions, Lin et al. (Reference Lin, Yu, Bai, Feng and Wang2013) found that up to 70 percent of GHGs can be attributed to regional and national activities beyond the urban boundaries that support household consumption (see Pichler et al. Reference Pichler, Zwickel, Chávez, Kretschmer, Seddon and Weisz2017).
Expanding the boundary of a city, and thus the scope of urban metabolism research, from purely boundary-limited to including the hinterlands is captured by transboundary footprinting. The method of transboundary footprinting recognizes that there are often key infrastructural facilities, such as power plants, landfills, and airports, that may not be within the city limits, but nevertheless are part of what keeps the city operating and producing, and which could be counted as part of the city’s overall environmental impact. Both transboundary footprinting and urban metabolism use material flow accounting and analysis and can trace an array of substances through the system under study (Zhang Reference Zhang2013). Some have suggested the addition of life cycle accounting to further analyze external supply relationships to match specific urban areas and the places on which they depend (Pincetl et al. Reference 90Pincetl, Bunje and Holmes2012).
One particular greenhouse gas, carbon dioxide (symbolized as CO2), is the focus of a great deal, but not all, of urban metabolism and transboundary footprinting studies. Indeed, there is a peer-reviewed and robust protocol for city-scale greenhouse gas inventorying in cities called the Global Protocol for Community-Scale Greenhouse Gas Emission Inventories, or GPC, that is increasingly being adopted. It is a joint project by ICLEI, the World Resources Institute, and the C40 Cities Climate Leadership Group, with additional collaboration by the World Bank, UNEP, and UN-Habitat. As a global reporting standard, the GPC enables cities and communities to consistently measure and report greenhouse gas emissions and to develop climate action plans and low-emission urban development strategies while using coupled production and consumption-based approaches (ICLEI 2016).
Finally, urban metabolism helps a city understand the physical basis of what occurs within its boundaries by measuring its inputs and outputs. There are many more social, political, and economic elements to examine beyond cities and their hinterlands, but urban metabolism is an essential aspect for understanding important biophysical interactions.
3.3 Global and National Trends in Material and Energy Flows
Our knowledge of historical resource use trends gives us an imperfect guide to the future. This knowledge is imperfect because a number of countries are entering an unprecedented phase of socioeconomic maturity, while others are poised to undertake rapid urban development. The latter have the opportunity to avoid the resource-intensive path taken by the developed world in the twentieth century, but this outcome is far from certain.
Globally, trends in material and energy flows present interesting metabolic challenges. Overall, when resource use is divided by the number of people on Earth, as of 2010, each person yearly demands 10 tons of materials. Using the standardized System of National Accounts, UNEP (Reference Schandl, Fischer-Kowalski, West, Giljum, Dittrich and Eisenmenger2016) illustrates the vast disparities in material use between economies in the Global North and those in the Global South. In North America and Europe, each person requires approximately 20 and 14 tons, respectively – far exceeding material demand across other economies. Regional contexts offer critical insights into understanding these material flows at finer scales.
Several studies have looked closely at physical material flows at the scale of disaggregated world regions. Using distinct methodological approaches, Krausmann et al. (Reference Krausmann, Gingrich, Eisenmenger, Erb, Haberl and Fischer-Kowalski2009), Schaffartzik et al. (Reference Schaffartzik, Mayer, Gingrich, Eisenmenger, Loy and Krausmann2014), and Wiedmann et al. (Reference Wiedmann, Schandl, Lenzen, Moran, Suh, West and Kanemoto2015) each examined global scale material flows that uncovered parallel trends by material type (that is, minerals, ores, fossil energy, biomass, etc.). Others have examined flows for specific regions: Gierlinger and Krausmann (Reference Gierlinger and Krausmann2012) studied the United States; Weisz et al. (Reference Weisz, Krausmann, Amann, Eisenmenger, Erb, Hubacek and Fischer-Kowalski2006) studied Europe; Krausmann et al. (Reference Krausmann, Gingrich and Nourbakhch-Sabet2011) studied Japan; Russi et al. (Reference Russi, Gonzalez-Martinez, Silva-Macher, Giljum, Martínez-Allier and Vallejo2008) studied some of Latin America; Gonzalez-Martinez and Schandl (Reference Gonzalez-Martinez and Schandl2008) studied Mexico; and Giljum (Reference Giljum2004) studied Chile. And while these several studies illustrate that the overall rate of material flows is accelerating, the following important dimensions merit careful understanding.
Until 2000, Japan’s total energy needs were generally always rising, but since then there has been a persistent decline. Europe’s total primary energy demand has declined more than 8 percent since 2005 (3 percent between 2013 and 2014) (EEA 2015). While Africa and South Asia are entering a phase of industrialization that will likely lead to an increase in construction, some contend that China’s construction of residential buildings will plateau after 2035. Although China is expected to add another 225 million urban dwellers, its national population will peak and start to decline in the next 10 years, which could influence the direction of China’s urban expansion (for example, driving lower-density development or new settlements). The centrality of China’s construction and manufacturing sectors is likely to be replaced over the next 15 years with more service-oriented production (NBSC 2016; Magnier Reference Magnier2016); this has broad implications for material and energy flows from the buildings sector (You et al. Reference 91You, Hu, Zhang, Guo, Zhao, Wang and Yuan2011; Hu et al. Reference Hu, You, Zhao, Yuan, Liu and Cao2010).
To highlight some of the material and energy flow challenges facing China, between 2011 and 2013 China consumed more cement (6.6 Gt) than the United States did between 1901 and 2000 (4.5 Gt) (Smil Reference Smil2014). This rate far exceeded prior expectations (Fernández Reference Fernández2007), and it is uncertain if this trend can persist. The International Energy Agency (IEA) estimates that although China will remain the largest producer and consumer of coal and overtake the United States in oil consumption, it will require 85 percent less energy to produce each future unit of economic growth (that is, energy/GDP will decrease by 85 percent) (OECD/IEA 2015). Accounting for six main construction materials used in urban residential buildings in Beijing from 1949 to 2008, Hu et al. (Reference Hu, You, Zhao, Yuan, Liu and Cao2010) report that a total of 510 million tons of material were imported into the city, of which 470 million tons (or 92.5 percent) were retained in new stocks, that is, built environment and infrastructure; 33 percent of those new stocks emerged between 2003 and 2008.
Since record-keeping began, the United States has had the world’s largest total primary energy supply, a trend that had been increasing until 2009, when China took over this rank. The United States has since seen a decline in both per capita and overall energy needs (OECD/IEA 2014) and there has been a similar decrease in domestic material consumption (UNEP Reference Schandl, Fischer-Kowalski, West, Giljum, Dittrich and Eisenmenger2016).
From a global urban perspective, Africa and India combined will add more than one billion new urban residents by 2040 (UNDESA 2014). To provide electricity for these residents, India’s power sector needs to quadruple by 2040; this will likely lead India to becoming the world’s biggest importer of coal. In developing countries, urbanization will demand materials to create infrastructure, vehicles, and buildings. China has experienced a rapid expansion of builtup urban area, which is both driving and driven by economic growth in and around the cities (Bai et al. Reference Bai, Schandl, Douglas, Goode, Houck and Wang2011), with the built-up urban area growing much faster than the urban population (Bai et al. Reference Bai, Shi and Liu2014). Müller et al. (Reference Müller, Lui, Løvik, Modaresi, Pauliuk, Steinhoff and Brattebø2013) estimate that if the developing world proceeds to construct its new cities with the same intensity and type of infrastructure we see in developed countries, the potential carbon cost is more than a third of the world’s cumulative carbon budget to 2050 (if we seek to restrain global warming to 2°C above preindustrial averages).
While the direct material needs of the developing world will enlarge and those of the developed world might stabilize – and possibly even decouple from economic activity – it is important to be wary of indirect material needs embodied in trade. The overall material footprints of Japan, the United States, and the United Kingdom are all more than 150 percent greater than their direct domestic material consumption (Wiedmann et al. Reference Wiedmann, Schandl, Lenzen, Moran, Suh, West and Kanemoto2015). For residence and service-oriented urban centers that typically import energy and energy-intensive materials and goods, consumption-based approaches, such as input-output footprints, may yield higher energy-use estimates compared to territorial accounting, though the opposite may be true in net-producing urban centers (Chávez and Ramaswami Reference Chávez and Ramaswami2013). However, in the end, this may continue to follow the trajectory presented by Bristow and Kennedy (Reference Kennedy, Clift and Druckman2015) (see Figure 3.3), who portray a strong linear relationship between global energy use and global urban population.

Figure 3.3 Global energy use for urban and rural population, 1965 to 2010.
Meanwhile, as we collectively enhance data collection and analysis methods for measuring aggregate and global level material flows, one paramount challenge to robust assessments is likely to persist going forward. Data-rich economies, mostly those in the Global North (also known as “OECD economies”), are the epicenter of most comprehensive material flow and metabolic studies; these studies continue to provide important insights for the planning of new communities. Conversely, communities in the Global South are often restricted from further metabolic assessments due to their limited available data. Samples of studies show that research-community partnerships are employing a suite of novel data techniques to be able to inform local communities of important challenges, including e-waste in Nigeria (Nnorom and Osibanjo Reference Nnorom and Osibanjo2008); energy, material, and greenhouse gases for Delhi, India (Chávez et al. Reference 87Chávez, Ramaswami, Dwarakanath, Ranjan and Kumar2012); and food consumption for Manila, Philippines (Chakraborty et al. Reference Chakraborty, Sahakian, Rani, Shenoy and Erkman2016). However, some obvious gaps exist, which elevate the potential for successful open-source data efforts to fill them (see Chapter 11).
3.3.1 Drivers of Material and Energy Flows
Global drivers of material use have generally been linked to both per capita income and per capita consumption (UNEP Reference Schandl, Fischer-Kowalski, West, Giljum, Dittrich and Eisenmenger2016). At a more granular scale, researchers have proposed various characteristics of cities that drive urban material and energy flows; these driving characteristics can generally be categorized as natural environmental, socioeconomic, urban function and integration energy system characteristics, and urban form (GEA Reference Johansson, Patwardhan, Nakicenovic and Gomez-Echeverri2012). The global energy assessment indicates that the natural environment relates to attributes of geographic location, climate, and resource endowments, while socioeconomic drivers typically relate to household characteristics, economic structure, and demography.
As of 2010, a study of the material and energy flows of the world’s 27 megacities showed that electricity use per capita is also strongly related to urban area per capita. The authors found that the underlying cause of this relationship was the increase in building floor space. As cities sprawl, there is more room for bigger buildings, which consume more electricity. Building floor area per capita also influences heating fuel use in cities, although heating degree days (a measure of coldness below a base of 18°C room temperature) is the dominant driver (Kennedy et al. Reference Kennedy, Steinberger, Gasson, Hillman, Havránek and Hansen2010, Reference Kennedy, Stewart, Facchini, Cersosimo, Mele and Chen2015).
Researchers have also observed a high level of correlation between drivers. Kennedy et al. (Reference Kennedy, Stewart, Facchini, Cersosimo, Mele and Chen2015) illustrated high correlation (r2 > 0.7) between urbanized area per capita and electricity use, transportation fuel use, and water consumption (Table 3.1; all per capita). There is also, however, a strong correlation (r2 = 0.8)between GDP per capita of the metropolitan region and urbanized acre per person. Hence, GDP has medium to strong correlation with electricity, transportation, and water use. Many of the variables are interrelated, and overall, cities appear to develop more consumptive metabolisms as they become wealthy and spread out. These findings agree with previous studies, which established that when reporting metabolic energy and carbon flows from cities, one should carefully normalize by the appropriate metrics, namely economic metrics such as GDP for production-based flows, and population metrics for consumption-based flows (Ramaswami and Chávez Reference Ramaswami and Chávez2013). Additional studies observe changing patterns of metabolic flows across the income axis. For example, in a study looking at phosphorus metabolism through food consumption in Chinese cities, Li et al. (Reference Li, Bai, Yu, Zhang and Zhu2012) observed an increasing trend of overall phosphorus flow in and out of cities, while an inverted U shape described the share of phosphorus remaining within the urban boundaries. Taking a longitudinal perspective, Cui et al. (Reference Cui, Xu, Huang, Bai, Huang and Li2015) conclude that the quantity, configuration, and efficiency of phosphorus metabolism through cities can change drastically in response to changes in consumer and producer behavior, as well as in socioeconomic structure. All of the drivers, trends, and outcomes discussed in this section have directional impact on urban metabolism.
Table 3.1 Simple univariate correlation matrix between per capita parameters for 27 of the world’s megacities as of 2010
| Correlations | ||||||||
|---|---|---|---|---|---|---|---|---|
| Electricity cons. | Heating and indust. fuel | Transp. fuel | Water cons. | Solid waste | Heating degree days | Area per pers. | GDP | |
| Electricity consumption (MWh) | – | |||||||
| Heating and industrial fuel (GJ) | 0.40 | – | ||||||
| Transportation fuel (GJ) | 0.61 | 0.70 | – | |||||
| Water consumption (kL) | 0.51 | 0.51 | 0.69 | – | ||||
| Solid waste production (t) | 0.44 | 0.23 | 0.57 | 0.45 | – | |||
| Heating degree days | 0.45 | 0.59 | 0.50 | 0.17 | 0.27 | – | ||
| Area (km2) per person | 0.78 | 0.60 | 0.79 | 0.72 | 0.68 | 0.42 | – | |
| GDP ($) | 0.68 | 0.41 | 0.68 | 0.46 | 0.55 | 0.58 | 0.80 | – |
3.4 Theory for Measuring Urban Material and Energy Flows
This chapter has introduced a number of urban metabolism frameworks and models to assist with measuring urban-scale material and energy flows. Baynes and Wiedmann (Reference Baynes and Wiedmann2012) present a robust set of approaches often used in urban metabolism, such as transboundary footprinting, input-output consumption-based approaches, and complex systems science. One additional approach is a network-oriented method termed “ecological network analysis,” or ENA, which presents a set of strong tools for examining structure and function of ecosystem flows (Patten Reference Patten1978; Finn Reference Finn1976; Fath and Patten Reference Fath and Patten1999). ENA is a variant of economic input-output analysis (Leontief Reference 89Leontief1951). ENA has been used to model various metabolic flows, including energy, carbon, water, and others, in a range of cities (Zhang et al. Reference Zhang, Yang and Fath2010; Liu et al. Reference Liu, Yang, Chen and Zhang2011; Chen et al. Reference Chen, Chen and Su2015). The most notable benefit of the network approach is that it can provide information about relationships between urban sectors in a holistic way, in which both direct and indirect (remote) interactions can be captured.
Increasingly, current research has been striving for urban metabolism data that includes both in-boundary activities and out-of-boundary (or life cycle) impacts (Chen et al. Reference Chen, Chen and Fath2014). Input-output models (Smith and Morrison Reference Smith and Morrison2006) and life cycle analysis (Pincetl et al. Reference 90Pincetl, Bunje and Holmes2012) have been utilized to include activities that occur “upstream” and “downstream” of the city in the framework of urban metabolism. With their embodied material and energy inputs for urban growth, they are both capable of assessing the footprints of cities. Recent work integrating input-output and life cycle data with ENA is promising for assessing and regulating urban sectors to mitigate resource overuse and unintended emissions (Chen and Chen Reference Chen and Chen2015, Reference Chen and Chen2016). Novel integrations could assist metabolic understanding of cities.
Future theoretical frameworks can consider integrating multiple metabolic lenses into understanding the complexities of cities. For example, considering the multiple possibilities for parceling cities into territorial, production, and consumption footprints (see Chávez and Ramaswami Reference Chávez and Ramaswami2013) can help us gain a stronger appreciation for the metabolisms of cities and the relevant approaches for maximizing their respective material and energy flows.
3.4.1 Efficient, Sustainable, and Resilient Metabolisms
Creating efficient, sustainable, and resilient metabolism models, while challenging, is imperative in our rapidly expanding and urbanized world. Resource use is increasing, many production systems are peaking, and the consumption and demand for goods and services are at unprecedented highs. Methods and principles of industrial ecology, such as those mentioned in Section 3.3 (material and energy flow analysis and life cycle footprinting), as well as others (dematerialization, recyclability, urban industrial symbiosis, and so forth) (Chertow et al. Reference Chertow, Zhu, Moye, Seto, Solecki and Griffith2016), can become the cornerstones for assisting the range of stakeholders who are integrating and implementing three vital characteristics – efficiency, sustainability, and resilience – into community metabolisms. While sometimes perceived as interchangeable, these three attributes are unique in the following ways:.
Efficiency concerns the quantity of inputs to produce an output. Typically, an efficient metabolism is characterized by relatively low levels of material use and energy flows to achieve a standard level of output. Examples of key indicators for measuring and tracking efficiency in community metabolisms are electricity per economic or sector output, energy per sector output, or material inputs per waste generation.
Sustainability in urban metabolism addresses the impacts associated with the material and energy flows of a particular system. Sustainability can be measured via environmental (such as CO2 per sector or CO2 per GDP), economic (such as income, energy use, and energy-use intensity), and social (such as education and public health) indicators (see Katehi et al. Reference Katehi2016).
Resilience of metabolism relates to the capacity of a particular flow, or to the entire metabolism, for recovery after a disruption. While linkages between metabolism and resilience are ripe for new lines of inquiry, their coupling with disciplinary extensions can yield a practical suite of options for metabolisms to absorb or mitigate against shocks. Industrial ecology – and, specifically, supply-chain analysis – has the potential to reveal key areas of material substitutability, helping inform alternate material uses should system disruptions occur. Example of key indicators of resilience may include metrics for diversity, alternatives among inputs, and measuring impacts from shocks (see Chapter 7).
3.4.2 Gaps in Current Understanding
To embark on and successfully complete effective metabolism assessments requires a wide array of local- and community-level data. It is true that many communities have rich data collection and processing teams. Cities such as New York City, Tokyo, Berlin, and Mexico City have robust data caches, which facilitate metabolism assessments. Many data-rich cities have, coupled with rich secondary data found in the literature. Anecdotally, we note that cities with rich data are often megacities or larger urban centers located in Annex 1 countries (see UNFCCC 2014 for country classifications). Meanwhile, cities in non-Annex 1 countries and/or smaller communities do not display these benefits; in most instances, they are data poor.
Beyond larger urban areas in Annex 1 countries and/or megacities, most communities do not have easily or publicly accessible data to complete vital metabolism assessments that would enhance community and infrastructure planning. As we illustrate using Figure 3.1, much of the world’s projected population growth will occur in communities under 500,000 habitants – all of which require substantial and effective planning in order to achieve efficient, sustainable, and resilient metabolisms. Understanding the intricacies of metabolic demands is necessary and imperative – it is also a gap that reasonable data can help close. As an example of this problem, completing coupled and detailed production and consumption footprints that compare cities in the Global North (Annex 1) and in the Global South (non-Annex 1) has proven to be impossible with the current state of data (UCCRN 2016). Should data limitations prevent a community from actively embarking on and a creating efficient, sustainable, and resilient metabolisms?
Given the vast differences in data availability and community development stages, understanding the material needs of communities in relation to their development may yield novel understandings for a sustainable and resilient future. Thus, classifying communities into three broad types may provide new lines of inquiry for the research community. Communities that are unbuilt (rapidly growing), built (mostly stable), and unbuilding (shrinking) each have distinctive attributes in terms of their metabolic flows. We posit that Type A, unbuilt communities, include many of the small(er) communities throughout the Global South that are currently experiencing rapid rates of population and GDP growth. These communities have a very high demand for materials and are poised for styles of planning that can avoid a negative infrastructural and material legacy. Type B, built communities, are the mostly stable communities of North America, Europe, Japan, and Australia, where rates of growth (as indicated by GDP) are not bulging as those elsewhere are. These economies are experiencing an increased level of efficiency in material use per GDP, an outcome likely driven by their primarily service-based economic structure. Type C – unbuilding communities that are shrinking and depopulating – are a phenomenon currently observed in the United States’ Rust Belt (see Schilling and Logan Reference Schilling and Logan2008)) and Europe’s east (see Bontje Reference Bontje2004). As shrinking communities transition from materials-intense outputs towards tertiary sector production, they may well be poised for exemplary green infrastructure development.
Innovative Policies and Levers: Exemplary Case Studies
Beijing, the capital of China, has one of the largest gross domestic products, or GDPs of Chinese cities (350 billion USD in 2014) and is home to more than 20 million people. Beijing is also the leading city of the Jing-Jin-Ji economic region, the development of which has a substantial impact across the entire country. With a fast-growing population and expanding urban areas, Beijing has an increasingly high demand for energy and resources from Jing-Jin-Ji and the rest of city operations, raising a significant challenge to supplying energy for the city sustainably.
Taking Beijing’s 2012 energy use as an example, the three major sources are reported as coal (37 percent), diesel oil (16 percent) and gasoline (14 percent) (Chen and Chen Reference Chen and Chen2015). Meanwhile, energy flow analysis shows that the most energy-consuming components of Beijing at this time were manufacturing (45 percent of total direct energy consumption), services (29 percent), and transportation (16 percent). Using input-output analysis, researchers found that the total energy embodied in Beijing’s supply chains associated with urban sectors was almost seven times higher than its direct energy use within the urban boundary. Since Beijing is also in a severe water shortage, it is important that we take both energy use and water consumption into consideration, together.
The resilience and sustainability (or lack thereof) of coupled energy and water metabolism has been a central problem for fast-growing cities such as Beijing. By applying network resilience metrics to urban systems, some scholars hope to show efficiency gains and how stable an urban system can be while facing both energy and water challenges. The resilience of energy-water coupled systems in Beijing is lower than that of natural ecosystems in general (Chen and Chen Reference Chen and Chen2016). The relationships among urban sectors are altered by the competition of energy and water flows. It is clear that coordinated regulation of different metabolic flows in cities, particularly in megacities (for example, Beijing), is essential for more sustainable and rational development.
3.5 Conclusions
Throughout this chapter, we have presented several motivations for the increased use of urban metabolism as a governing framework for understanding the materials and energy flows associated with cities. While the methodological foundations for adopting urban metabolism may have matured through research, development of a typological framework could greatly benefit its scalability and cross-city applicability. Having an urban metabolism typology can help uncover nuanced city details that, in turn, can lead to inquiry and understanding for metabolic flows as they relate to various types of cities. Typological development has seen some momentum recently.
A typology can simply be described as a form of classification, separation, or presentation that segments groups based on a number of key features. For example, a rudimentary typology for cities can adopt a scale based on affluence from less affluent to more affluent. Alternatively, a typology can examine city growth and adopt a scale from rapidly growing to no growth, or even to shrinking. While these are only some of the several typological options, the few early urban metabolism typologies have accounted for added complexities. For example, Chávez and Ramaswami (Reference Chávez and Ramaswami2013) propose a typology based on a city’s import and export of GHG emissions to classify three types of cities – net consumer, balanced, and net producer. Another effort, rooted in Saldivar-Sali (Reference Saldivar-Sali2010), is led by Massachusetts Institute of Technology’s Urban Metabolism team, which has developed a typology that uses four independent variables (climate, GDP, population, and density) to reveal clusters (or groups) of cities in terms of eight dependent variables (energy, electricity, fossil fuel, industrial and construction minerals, biomass, water, and domestic material). The opportunities to build on the early work to bring added understanding to urban metabolic flows continues.
3.5.1 Future of and Opportunities Surrounding Urban Material and Energy Flows
Tools based on urban metabolism have witnessed several iterations and many transitions since early research in the 1960s. Analysis that was initially boundary limited by bulk mass flows has transitioned to robust life cycle assessment approaches with the ability to examine from the jurisdictional boundary across the complete supply chain into a city’s hinterland(s) – which often include multiple economies in multiple countries (Pichler et al. Reference Pichler, Zwickel, Chávez, Kretschmer, Seddon and Weisz2017). Additionally, the early studies quantified the total physical flows for a limited number of sectors, such as energy or waste. Over time, however, urban metabolism studies have expanded in sectors to include transportation, buildings, materials, and others – as well as economic, social, and environmental indicators. Moreover, recent studies including a fuller set of metabolic flows can provide estimates beyond non-visual material uses, such as those associated with underground infrastructures in cities. The latest estimates of urbanization and urban resource (material and energy) demands increase the need for deeper understanding across communities and their metabolisms.
The creation and use of typologies can help establish more robust understanding of urban metabolisms. Although some attempts have been made in the recent past which can serve as foundations for future typological frameworks, there are additional research opportunities for developing an overarching typology for urban metabolism. Completing such a typology could help drive efficiency, sustainability, and resilience for communities of all sizes everywhere, while merging urban metabolism typologies with global community standards that are being developed in parallel. Such products can also help reduce the knowledge gaps related to sharing best practice and forging partnerships across communities of similar clusters (or types).
Several unknowns and opportunities for new lines of inquiry remain within the analytical field of urban metabolism. For example, it is understood that we are becoming more material inefficient at the global level; in other words, the global economy now requires more material inputs per unit GDP than it once did. Our continuing global shift to materially inefficient economies, which are experiencing unprecedented transformations, contributes to this worldwide trend of increasing resource use and inefficiency. However, due to data limitations, we are still uncertain how these global trends transpire at local, community scales. Are there significant and important differences between the material requirements in subnational economies, for example? The emerging opportunities for integrating material efficiencies, especially in rapidly growing communities, may be many.
As we consider the future of urban metabolism, we can look back at its origins, appreciate its present, and innovate towards the future. From urban global population projections and the strength of GDP emerging from cities, to the expansive opportunities for efficiency resulting from natural resource use and waste and emissions output, communities face plenty of opportunities and challenges. Considering that the bulk of future urban growth is projected to occur in cities of less than 500,000 inhabitants, the questions surrounding material and energy needs for developing high-quality livelihoods will continue to evolve. Many data gaps remain, inhibiting our nuanced understanding of urban metabolism, and these gaps slow the channelling of necessary resources to their required uses in cities. As researchers, practitioners, policy-makers, and interested citizens, it is up to us to continue employing, deploying, and innovating urban metabolism approaches to increase our understanding of resource flows across the urban boundary – and to implement genuinely resilient systems.
4.1 Introduction
Urban areas can play a key role in the transformation that is required in humankind’s ways of understanding and responding to climate and sustainability challenges. These new ways, however, will require bringing together urban planners, social scientists, business leaders, engineers, and other diverse knowledge and power domains – an undertaking that creates its own set of seemingly intractable complications. As documented by scholars studying diverse fields of human endeavor, from scientific inquiry to governmental planning and private or public sector construction of infrastructure, one of the most difficult problems in creating change lies in moving people beyond the mental models, ways of knowing, tools, and analytical systems they learn during their academic training and professionalization.
Scholarship on urban risk and vulnerability offers an example of this trend. While research on risk and vulnerability has grown considerably in recent years, it has consisted primarily of case studies based on the assumption that both risk and vulnerability depend on context. Often, scholars and practitioners offer conflicting theories and conceptualizations that tend to shed light only on certain aspects of the problem, while other areas remain in the dark. This trend has implications for politics, equity, and sustainability. For instance, the vast majority of epidemiological studies on health risks from heat waves quantify the relationship between heat waves and health outcomes, while controlling for age and other factors. However, these studies omit underlying historical processes of sociospatial segregation (such as land-use development) that explain urban populations’ differentiated access to green areas, air conditioning, health services, and other assets and options – and thus, their differentiated exposure to temperature, capacity to adapt to heat stress, and ability to mitigate heat risks. The development of approaches that can explain these differences may help us move towards cohesive and policy-relevant narratives.
This chapter starts with a brief discussion of existing definitions and approaches to the interactions between urbanization, urban risk, and vulnerability. We outline the necessary components of an interdisciplinary understanding of how environmental and societal processes, such as global warming and urbanization, contribute to intra- and interurban inequalities in vulnerability to heat waves, floods, droughts, and other climatic hazards. We highlight some of the mechanisms by which vulnerability and risk are shaped by the dynamics of urbanization, acting on urban centers as places with unique social and environmental histories, opportunities, and constraints. We close with some remarks on ways forward for reducing risk and enhancing populations’ capacity, within and across urban areas, to deal with risk.
4.2 Conceptualizing Urbanization, Urban Vulnerability, and Risk
Before exploring the influence of urbanization and urban areas on risk, we will briefly consider the conceptualizations of “urbanization,” “urban,” and “risk.” Urbanization dynamics and the urban areas they produce are altering forests, open spaces, agricultural lands, wildlife, energy, food, and water resources and, consequently, are altering risks in complex and accelerating ways. These changes not only threaten the quality of life that urban and rural residents have come to expect, but they also offer opportunities for innovative risk mitigation and adaptation options. Urban-regional infrastructure systems that facilitate critical services, such as the delivery of water and energy and the provision of mobility and shelter, have enabled the growth of urban areas, populations, and activities, but have often resulted in detrimental environmental impacts.
4.2.1 Urbanization and the Environment
Determining the impacts caused by urban areas is difficult, as little agreement exists about the definition of urbanization and urban areas (Marcotullio et al. Reference Marcotullio, Hughes, Sarzynski, Pincetl, Peña, Romero-Lankao, Runfola and Seto2014). We define “urbanization” as a series of interconnected development processes or dynamics that shift how humans interact with each other and the environment to create risks (Romero–Lankao et al. Reference Romero-Lankao, Gurney, Seto, Chester, Duren, Hughes, Hutyra, Marcotullio, Baker, Grimm and Kennedy2014b). These processes include:
Particularly in middle- and low-income countries, an increasing number of people living in urban areas;
Processes of stabilization and even population shrinkage related to post-industrialization and deindustrialization, particularly in high-income countries;
Changes in lifestyles and cultures (living on coasts, for example) that motivate people to live in hazard-prone areas;
Economic shifts from primary activities, such as agriculture, to manufacturing and services, which compete for access to water, land, and ecosystem services;
Changes in the patterns of land use of urban areas and associated infrastructure that affect shifts in resource use and hazard risk;
The ecological and physical transformations implied by these processes.
At the local level, the effects of urbanization can exacerbate the climate changes affecting urban populations. These effects, such as the urban heat island, or UHI, effect, might amplify the outcomes of global climate change (Ntelekos et al. Reference Ntelekos, Oppenheimer, Smith and Miller2010). UHI refers to increased temperatures in urban areas compared to their rural surroundings, driven by human activities and alterations of land surface characteristics and their thermal properties. The UHI effect, which varies across and within cities, often in relation to affluence and urban planning, can increase human health risks differently across the urban-rural gradient (Miao et al. Reference Miao, Chen, LeMone, Tewari, Li and Wang2009). These variations are mostly due to physical and socioeconomic factors, such as land cover patterns, city size, and the ratio of impervious surfaces to areas covered by vegetation or water (Grimm et al. Reference Grimm, Faeth, Golubiewski, Redman, Wu, Bai and Briggs2008; Harlan and Ruddell Reference Harlan and Ruddell2011). Also of importance are intra-urban sociospatial inequalities in access to air conditioning and green and open space. Based on these differences, lower socioeconomic and ethnic minority groups are more likely to live in warmer neighborhoods with greater exposure to heat stress and higher vulnerability (Harlan et al. Reference Harlan, Brazel, Darrel Jenerette, Jones, Larsen, Prashad and Stefanov2007). In summary, urbanization dynamics entails shifts in land use, infrastructure, economic activity, demographic structure, and lifestyle. The patterns of interactions between society and the environment have created differences in risk and vulnerability within and across urban areas.
4.2.2 Urban Areas
Notwithstanding the importance of urban areas, scholars and communities of practice disagree about what defines urban areas. Some define urban areas as a specific form of human association or settlement that can be characterized based on criteria of population size, physical form, and economic function. Others define cities as growth machines that tend elite interests, induce social inequality and injustice, and deteriorate the environment. Yet, others conceive of cities as socioecological systems (or SES) of interacting biophysical and socioeconomic components whose dynamic organization and management have many consequences for sustainability and resilience. As such, urban areas shape the level of environmental pressure populations exert on ecosystems and their natural resource base, and shape the vulnerability of urban populations to climatic and environmental hazards. Recent scholarship has pointed to the relevance of urban infrastructure as the sociotechnical system defining the material – and mostly unsustainable – metabolism of city regions (Monstadt Reference Monstadt2009; Smith and Stirling Reference Smith and Stirling2010; McFarlane and Rutherford Reference 111McFarlane and Rutherford2008). Metabolism refers to the flows of materials and energy through cities and regions (see Chapter 3). Infrastructure is a physical manifestation of metabolism and is deeply embedded in societal and political imaginations of how a city shall function. As infrastructure has become increasingly complex in terms of physical interconnectedness and the institutions and rules that govern it, the mechanisms by which we can significantly transform infrastructure to make it more sustainable have become less clear.
However, while the SES concept is useful, it is too abstract to yield an operational understanding of lower level system urban interactions. Therefore, we suggest a definition of “urban areas” as socioecological systems (Folke et al. Reference Folke, Hahn, Olsson and Norberg2005; Ostrom et al. Reference Ostrom, Janssen and Anderies2007), with five dynamic development domains: sociodemographic, economic, technological, ecological, and governance (SETEG) (Arup Reference Arup2014; Romero-Lankao and Gnatz Reference Romero-Lankao and Gnatz2016). These development domains reflect processes of change affecting risk and people’s vulnerabilities. The sociodemographic domain includes a set of factors conditioning people’s preferences for living in risk-prone areas based on lifestyles (including the aesthetic desirability of location); on social practices of living, commuting, or eating; or on lack of options. The economic domain shapes differences in wealth creation and inequality in access to assets and options (such as insurance) to respond to floods, water scarcity, and other hazards. The technological domain involves knowledge of techniques, processes, and so forth that can be embedded in machines, infrastructures, and the built environment, and can shape risk of environmental impacts, such as those that arise from lack of green areas to mitigate risks from floods and heat waves. Technology also offers options to retrofit or introduce “green” infrastructure or hazard protection measures, or to improve house quality and design in order to keep people protected (see Section 4.3 and Figure 4.1). The ecological domain, defined by such factors as topography, temperature, and precipitation, affects an urban area’s endowment of natural resources, ecosystem services, susceptibility to and capacity to mitigate droughts, floods, and heat waves. The governance domain affects patterns of urban growth, land-use regulations, and proactive or reactive risk mitigation and adaptation responses.

Figure 4.1 A flooded house in Mexico City. Floods are major contributors to infrastructure and housing damage among poor populations in cities.
4.2.3 Urban Vulnerability and Resilience
Human experience of the environment in terms of risks and threats constitutes a key theoretical foundation of vulnerability research (Blaikie et al. Reference Blaikie, Cannon, Davis and Wisner2014). Studies on urban vulnerability portray it as the degree to which a city, a population, infrastructure, or an economic sector (that is, a system of concern) is susceptible to and unable to cope with and adapt to the adverse effects of hazards or stresses, such as heat waves, storms, and political instability (Field et al. Reference 110Field, Barros, Stocker and Dahe2012). Urban vulnerability is a relational concept. Besides referring to a system or group sensitivity to heat waves, floods, and other hazards, it is also a relative property defining the capacity of that system or group to adapt to and cope with those hazards.
Vulnerability is a function of exposure, sensitivity, and capacity (Adger Reference Adger2006; Field et al. Reference Field, van Aalst, Adger, Arent, Barnett, Betts, Field, Barros, Dokken, Mach, Mastrandrea and Bilir2014). “Exposure” is the presence of populations, infrastructure, or economic, social, or cultural assets in places that could be adversely affected. “Sensitivity” refers to factors, such as age or preexisting medical conditions that determine susceptibility to hazards. “Capacity” is the potential of a population or a system to modify its features and behavior to respond to existing and anticipated hazards. Capacity relates to the unequally distributed pool of resources, assets, and options that governmental, private, and nongovernmental urban actors can draw on to manage environmental risks, while pursuing the lives and development goals they value. In a study of urban heat waves, for example, Wilhelmi and Hayden (Reference Wilhelmi and Hayden2010) adopted this definition and proposed a people- and place-based vulnerability framework. This framework integrates quantitative and qualitative data and focuses on social and behavioral elements of capacity, including social networks, knowledge, attitude, and practices; household resources; and access to existing risk reduction programs.
For the most part, scholarship on urban vulnerability consists primarily of case studies and analyses based on incompatible theories and paradigms that can be grouped in three traditions: “vulnerability as impact” or top-down (the most commonly applied approach); “inherent or contextual vulnerability”; and “urban resilience”(Patricia Romero-Lankao and Qin Reference Romero-Lankao and Qin2011).
“Vulnerability as impact” scholars conceive population vulnerability as an outcome (for example, a health impact or property damage) from exposure to heat waves, floods, and other hazards (O’Neill Reference O’Neill2005). Thanks to this body of research, we have learned that the relationship between people’s exposure to extreme temperature and mortality has a V or J shape, with mortality generally increasing both above and below some temperature threshold. These scholars have also examined the role of specific individual- and city-level characteristics (such as green areas) in modifying the temperature-mortality relationship. Furthermore, through epidemiological studies, we are able to state with some confidence that the elderly and people with preexisting medical conditions are particularly sensitive to extreme heat, and that higher levels of education in a population are associated with decreased risk of mortality. However, by looking at populations at the city level, urban vulnerability as impact studies fail to encompass intra-urban inequalities. For example, they do not examine what specific populations and places are at risk, to what they are vulnerable, and how and why they are differentially affected; whether they possess necessary skills, awareness, and assets to be able to adapt; and how their choices are constrained by the sociodemographic, economic, technological, ecological, and governance domains in which they operate.
The above questions are addressed by “inherent or contextual vulnerability” scholars, who examine the influence of historical patterns of sociospatial segregation on differences in populations’ capacity to draw on income, education, social networks, and other resources to respond to hazards and to mitigate risk. Earlier approaches, rooted in geography, natural hazards, and livelihoods research, had already pointed out that hazards disproportionately affect poor and marginalized populations and those living in hazard-prone geographic areas (Moser Reference Moser1998; Burton Reference Burton1993; Hewitt Reference Hewitt1983). Contextual studies shed light on the role of equity and affluence, the two faces of the urban development coin; on the capacity of upper income, privileged populations to live in lower density, greener, and cooler neighborhoods and, hence, to be more able to adapt to extreme heat, floods, and other hazards (Harlan et al. Reference Harlan, Brazel, Darrel Jenerette, Jones, Larsen, Prashad and Stefanov2007). Structural disadvantages at the neighborhood level, such as concentrated affluence, formality, or commercial vitality, play a fundamental role in health and quality of life outcomes, such as heat wave mortality; fires from illegal connections to the electricity grid; or morbidity associated with exposure to hazardous materials (Hayden et al. Reference Hayden, Brenkert-Smith and Wilhelmi2011; Qin et al. Reference Qin, Romero-Lankao, Hardoy and Angélica2015). For example, a study in neighborhoods of Buenos Aires, Argentina; Bogota, Colombia; Mexico City, Mexico; and Santiago, Chile found that low-income and informal neighborhoods are more at risk because they lack high-quality housing and easy access to jobs, and have precarious electrical connections. As stated by informants in Buenos Aires,
Most of the families are hanging from the electrical network … and these are bad connections, and the houses are made of wood and are very precarious. We have had several fires. Yes, in those cases we’ve had evacuees here”
More integrative analytical approaches have emerged in recent years. The natural hazards and human ecology approaches to societal vulnerability have been increasingly expanded to include the concepts of complex human-natural system resilience to climate change (Hewitt Reference Hewitt1983). Other approaches expanded the concepts of physical and place-based vulnerability to social factors, especially those related to coping and adaptive capacities, institutions, and governance systems (Adger Reference Adger2006; Turner Reference Turner2010; Romero-Lankao and Qin Reference Romero-Lankao and Qin2011). “Urban resilience” offers an example of integrative approaches.
While dozens of definitions of resilience exist, scholars tend to conceive of it as the ability of a system or population to absorb disruptions, persevere, self-organize, learn, and adapt. The notion of capacity is fundamental to connecting the analytic with the normative dimensions of urban resilience. This concept helps us in analyzing the unequally distributed pool of resources, assets, and options that populations and decision-makers can draw on to manage risks, while pursuing the lives and development goals they value. It also helps connect the underlying SETEG domain contexts that give rise to those resources and to explain inequalities in exposure and vulnerability. Urban resilience is related to normative and ethical principles such as the unequally distributed resources that individuals and organizations have (or potentially have) to effectively mitigate and adapt to the hazards and stresses they encounter.
Resilience has one of its two main roots in mathematics, physics, and engineering, where it is defined as the capacity of a system to “bounce back” or return to a steady-state equilibrium after such stressors as floods, political turmoil, or a banking crisis. In the second main root we find an ecological, or “bounce-forward” approach, in which resilience is defined according to how much disturbance an urban community or system can adapt to while remaining within critical thresholds, after which it can move to another regime. In this “safe-to-fail” paradigm, resilience is conceived of as the ability of cities and communities to change, adapt, and, crucially, transform in response to both internal and external hazards and pressures (Davoudi et al. Reference Davoudi, Shaw, Haider, Quinlan, Peterson and Wilkinson2012; Gunderson Reference Gunderson2001; Ahern Reference Ahern2011).
Cities as diverse as Dhaka, Bangladesh, and Boulder, Colorado, in the United States are such examples of this capacity to bounce forward. After 1991, when a hurricane hit Bangladesh, killing at least 138,000 people and leaving 10 million people homeless, people undertook efforts – promoted by local authorities, the national government, and international organizations – to decrease the risks faced from tropical cyclones. These efforts included the development of an early warning system and the construction of public shelters to host evacuees; Cyclone Sidr, which hit Bangladesh in 2007, subsequently tested these infrastructural developments. Although between 8 and 10 million Bangladeshis were exposed to Sidr – perhaps the strongest cyclone to hit the country since 1991 – there were approximately 32 times fewer deaths (4,234 people lost compared to approximately 138,000), illustrating Bangladesh’s capacity to learn and adapt (UN-Habitat 2011).
The unprecedented flood of September 11–18, 2013, in Boulder, Colorado – which killed 10 people, resulted in 18,000 evacuees, and caused the destruction of 688 homes, and damages to an additional 9,900 homes – brought into sight many of the interdependencies between urban risk and resilience (MacClune et al. Reference MacClune, Allan, Venkateswaran and Sabbag2014). Although Boulder was exposed to a flood estimated to be between a 25-year and 100-year magnitude (that is, a flood big enough to occur only once every 25 or 100 years), the city’s Greenways Program allowed green areas to mitigate flood damage. Impact damages were also conditioned on historic development pathways and social, political, and economic factors. Apartments impacted by sewage upwelling, for instance, had been below-grade and frequently were occupied by lower-income families and university students. Although Boulder’s utility staff was aware of the need to upgrade the sewage drainage system, the cost of such an improvement was prohibitively high. Combined with a fear of potential litigation, these factors led the city to either inaction or minimal action, which increased citywide vulnerability to the floods. Six out of seven key roads that follow creeks up mountain canyons in Boulder failed, leaving affected populations isolated and unable to leave flood-damaged areas. Yet, even amidst the near chaos and extensive damages wrought by the flood, strong preexisting relationships and a culture of cooperation among city and county governmental and nongovernmental actors were key assets that sped up response and enabled effective recovery through learning from previous experiences, such as the Four Mile Fire of 2010.
4.3 A System Approach to Risk
In recent years, scholars and practitioners have focused on the interface of urban areas and risk – how urban populations and actors from the private, public, and social sectors, including the institutions and infrastructure they create, affect the environment – and vice versa, encompassing how environmental impacts feedback and affect the social fabric of a city. To understand the risks and the challenges that cities face in reducing them, we need a system analysis of the interactions between multiple development and environmental domains. Yet, when it comes to understanding risk in cities, there is comparatively less knowledge about the interactions between the different SETEG domains shaping risks.
The concept of risk is characterized by differences in definition and scope (Renn Reference Renn2008). Risk can be defined, for example, as the probability of occurrence of a hazard, such as a flood or landslide, multiplied by the consequences if the event occurs (Field et al. Reference Field, van Aalst, Adger, Arent, Barnett, Betts, Field, Barros, Dokken, Mach, Mastrandrea and Bilir2014). We define “urban risk” as the potential for uncertain outcomes, such as economic loss and mortality, where something of value such as lives, livelihoods, or property is at stake. Risk results from the interaction of the vulnerability and exposure of populations, assets, and economic activities to hazards, such as floods and heat waves (Figure 4.2). Urban populations are frequently exposed to multiple hazards. These hazards can be one-offs, extreme events of short duration – such as storms or landslides – often striking with little warning. They can also be slow-onset events (such as century-long increases in urban average temperatures), as well as a range of subtle, everyday threats that are the product of a variety of factors (for example, UHI). Hazards can result from broader drivers, such as climate change and climate variability (including sea-level rise and weather extremes), from regional environmental degradation (mudslides resulting from land-use changes induced by urbanization, for instance), and from broader social changes such as globalization, urbanization, and political turmoil that affect the well-being, wealth, and feasibility of urban populations’ livelihoods (Figure 4.2).

Figure 4.2 Urban risk. This conceptual diagram shows urban risk not only as a result of hazard exposure and vulnerability, but also as shaped by five interacting development domains: sociodemographic, economic, technological, ecological, and governance. These domains operate within a wider context of interactions between environment and society.
While the majority of place-based studies focus on the links between urbanization and hazard exposure, or examine the interactions between exposure and sensitivity, fewer studies explicitly characterize or analyze the capacity of the affected populations to perceive and adapt to hazards (Morss et al. Reference Morss, Wilhelmi, Downton and Gruntfest2005; Hayden et al. Reference Hayden, Brenkert-Smith and Wilhelmi2011; Romero-Lankao et al. Reference 112Romero-Lankao, Gnatz and Sperling2016). Scholarship suggests that there is a clear value of deepening analysis of capacity, which needs to be complemented by a wider understanding of how adaptive behavior and practices are likely to be socially and institutionally structured, and economically constrained and modified over time (Few Reference Few2012).
4.3.1 The Multiple Domains of Urban Risk
Understanding urban risk requires analyzing the complex, context-specific, and nuanced interactions between sociodemographic, economic, technological, ecological, and governance domains shaping hazard, exposure, and vulnerability (Figure 4.2).
Sociodemographic: There is increasing evidence that a population’s capacity to mitigate and adapt to risks is not strictly an artifact of its intrinsic individual factors, such as age or preexisting medical conditions. Structural dynamics of the sociodemographic domain, such as the younger or older age population balance of cities, which is related to shifts to service-oriented economies, can make certain populations more sensitive to particular hazards, with the elderly being more sensitive to extreme temperatures. Because women experience unequal access to assets and decision-making processes, and are most often responsible for household needs, women can be more exposed and vulnerable to such hazards as indoor pollution.
Economic: Citywide economic vigor and advantages may enhance the effectiveness of urban safety nets by determining the city’s capacity to respond to risks through avenues such as charitable organizations, churches, businesses, social services, and more formal social networks (Browning et al. Reference Browning, Wallace, Feinberg and Cagney2006). Beyond that, in cities around the world, the dynamics of uneven economic growth shapes social inequality, thus influencing all dimensions of risk and urban populations’ vulnerabilities. These dynamics create and perpetuate the relative differences in vulnerability between poor and wealthy populations. Because of uneven economic development, cities as diverse as Mexico City, Buenos Aires, Santiago, and Mumbai have deficits in key determinants of capacity, such as health services and education, as well as high-quality housing and water and sanitation infrastructure – key elements of the technological domain. However, context-specific differences also exist. For example, access to sanitation in Mumbai is low, with 35 percent of people living in informal settlements having sanitation, and revolves around the use of improved toilet facilities that are not shared with other households. In Latin American cities, access to single-family toilets is relatively higher, and relates more to connection to sewage systems (Chatterjee Reference Chatterjee2010; Romero-Lankao et al. Reference Romero-Lankao, Gurney, Seto, Chester, Duren, Hughes, Hutyra, Marcotullio, Baker, Grimm and Kennedy2014b and Reference 112Romero-Lankao, Gnatz and Sperling2016).
Technologic: Particularly in urban contexts, this domain materializes in water, energy, sanitation, and other infrastructure areas that shape availability of and access to resources and services that define populations’ capacities to respond. Technology shapes response capacity because infrastructure unequally mitigates or amplifies people’s resilience to climatic and non-climatic threats. However, the mechanisms by which infrastructures unequally shape risk are context-specific and result from economic and political processes of investment, which privilege some technologies, sectors, and places over others. For instance, in cities of developing countries, such as Mumbai, the proportion of people with access to reliable electricity tends to be much higher (80.8 percent) than the proportion with access to water (61 percent) (Romero-Lankao et al. Reference 112Romero-Lankao, Gnatz and Sperling2016). Three reasons explain why, historically, economic compulsions led to a fast expansion of Mumbai’s electricity distribution network and not of the water network (Zérah Reference Zérah2008). While public policies facilitated investments in electricity, public investments in water and sanitation suffered from competition with other priorities. Once an electricity grid is constructed, the cost of individual connection is marginal, while the costs of extending connections to the water distribution network and transporting water are high. Hence, in contrast with electricity, the spread of the water network correlates with the spread of formal housing development. Because over half of Mumbai’s population lives in informal settlements, its water distribution is also one of its most profound expressions of social inequality and differentiated vulnerability.
Ecological or environmental: This domain refers to the biophysical, climatic, ecological, and hydrological factors (such as topography and precipitation) affecting an area’s susceptibility to hazards, such as floods. New insight into how this domain interacts with the technological to affect urban populations’ ability to mitigate risk and protect themselves from hazards is emerging, as illustrated by research on extreme heat. A number of studies have shown that having a low income, advanced age, preexisting health conditions, social isolation, linguistic isolation, limited access to healthcare, and working outdoors increase an urban population’s vulnerability to heat (Harlan et al. Reference Harlan, Declet-Barreto, Stefanov and Petitti2013; Hondula et al. Reference Hondula, Balling, Vanos and Georgescu2015; O’Neill Reference O’Neill2005). Yet, limited but increasing knowledge exists of how ecological and built environmental services can mitigate or exacerbate this vulnerability. Consider two scenarios. In the first, a vulnerable person lives in an older structure of poor heat-protective design (with low-quality insulation and inexpensive doors that absorb a large amount of incoming solar radiation, for example) and has to spend more on electricity to keep their unit running to cool the living space. In the second, the same person lives in a newer structure with modern energy codes and central air conditioning. We could hypothesize that the person in the second scenario is less vulnerable given that their residence offers protective features against the hazard. Similar hypotheses could be developed for tree shading, xeriscaping, material use, and a plethora of other factors related to ecological and built environmental services.
In Phoenix, Arizona, in the United States, we have observed that, over time, households with higher incomes have been able to afford to plant and shade their properties in a way that may reduce their vulnerability to heat (Jenerette et al. Reference Jenerette, Harlan, Stefanov and Martin2011). Related questions exist about the built environment. As we have mentioned, air conditioning is a critical protective measure; those without air conditioning, those who are unable to afford to use it; or those who have inefficient air conditioning may be more vulnerable to heat (Fraser et al. Reference Fraser, Chester, Eisenman, Hondula, Pincetl, English and Bondank2016). Yet home (private) air conditioning represents only a fraction of the heat refuge space that we experience. We spend a good deal of our day in publicly cooled spaces, whether those be our offices or shopping areas. A comparison between Los Angeles and Phoenix shows that the mixed land uses of Los Angeles, coupled with its gridded roadway network, make obtaining access to publicly cooled spaces easier than in Phoenix (Fraser et al. Reference Fraser, Chester, Eisenman, Hondula, Pincetl, English and Bondank2016). Additionally, the thermal characteristics of residential and nonresidential buildings can make air conditioning more costly. Thus, as buildings have gotten newer, their ability to retain cooled air for a longer period has also improved (Nahlik et al. Reference Nahlik, Chester, Pincetl, Eisenman, Sivaraman and English2016). However, it is possible that affording to live in a newer building requires one to have a relatively high income. As we advance our understanding of vulnerability to climate change, it will become more and more important to understand not only the effects of social, ecological, and technological factors, but – perhaps more importantly – how these factors interact.
Governance: This domain shapes risk inequalities through the legacies of political decisions and policies around urban land-use planning and investments in infrastructures and services; through some of the mechanisms of social exclusion (by class and race, for example); and through decisions made about where to locate energy, water, and other infrastructure networks. In many cities of low- and middle-income countries, growth of both low-income informal housing and higher-income gated communities often occurs in areas that provide ecosystem services (such as wetlands or forests providing flood protection and water infiltration) or are prone to storm surges, landslides, and floods. Still, while some forms of growth in risk-prone areas enjoy state sanction, others are criminalized. In these cases, informal status becomes both a source of stigmatization that disempowers populations living in informal neighborhoods and a systemic determinant of lack of access to land tenure, high-quality housing, infrastructure, services, and other assets and options to mitigate risks and/or to adapt (Box 4.1) (Roy Reference Roy2009).
In urban areas of middle- and low-income countries, large sections of the population work within the informal economy or are living in housing that was constructed informally. As such, they face the possibility that governments may forcibly remove them from sites deemed to be vulnerable to risks – and away from their means of livelihood. They may also be moved simply because other actors want the land they occupy for more profitable uses. Informality is a state of regulatory flux, where land ownership, land use and purpose, access to livelihood options, job security, and social security cannot be fixed and mapped according to any prearranged sets of laws, planning instruments, or regulations (Roy Reference Roy2009; McFarlane Reference McFarlane2012). This leads to an ever-shifting relationship between the legal and the illegal, the legitimate and the illegitimate, and the authorized and the unauthorized. Informality can create advantages and disadvantages along lines of sociospatial stratification. For instance, informality becomes the site of considerable state power when some forms of growth in risk-prone areas enjoy state sanction while others are unauthorized and criminalized. Informal status becomes a systemic determinant of lack of access to assets and options to mitigate risks and/or to adapt. Conversely, the regular, legal, or formal status of a source of livelihood, neighborhood, and/or settlement provides security from eviction; formal recognition becomes an incentive to invest in more structural adaptation actions (such as house improvements to effectively prevent fires and respond to floods). Obtaining formal status not only is a requirement for infrastructure and service provision for urban populations, but also helps to prevent stigmatization and disempowerment. Studies of informal settlements in Buenos Aires found that their residents tended to be stigmatized. As suggested by a respondent in Greater Buenos Aires: “There were times that services would not come in the neighborhood because it was considered a red (dangerous, insecure) zone” (Romero-Lankao et al. Reference Romero-Lankao, Hughes, Qin, Hardoy, Rosas-Huerta, Borquez and Lampis2014a: 5). This study documented that similar arguments are frequently offered as reasons not to provide services in Bogota, Colombia; Mexico City, Mexico; Mumbai, India; and Santiago, Chile (Romero-Lankao et al. Reference Romero-Lankao, Hughes, Qin, Hardoy, Rosas-Huerta, Borquez and Lampis2014a).
4.3.2 The Relevance of Scale
Urban risk depends on scale. Hazards and adaptation capacities, and their domains and drivers, vary through time and across households, neighborhoods, and city regions (Figure 4.3). For example, a family with a two-level house may only have enough economic resources to move its belongings to the upper part of the house when faced with a flood (as happens in many coastal cities, such as Mumbai and Buenos Aires). This action, however, is not as effective a long-term response at the city and region levels as the construction of flood protection infrastructure, or the implementation of urban policies that strengthen the asset base of low-income groups, can be.

Figure 4.3 Capacity and actual responses vary across scale, that is, across a household, neighborhood, and city region.
While we need citywide studies to compare patterns and differences in risk and vulnerability across urban areas, they can obfuscate the importance of understanding how variation in SETEG factors can contribute to people’s vulnerability. While we are accustomed to seeing maps of variations in socioeconomic conditions, such as income, ecological services and physical infrastructure can also vary significantly across a city. Consider the metropolitan area of Phoenix, Arizona, where residential structures constructed in the middle of the twentieth century dominate the city’s downtown core, while its outlying regions – largely constructed from 1990 onward – use modern energy codes and thermally preferable materials, which protect people from extreme temperatures. These examples highlight the importance of assessing vulnerability at neighborhood scales, where we can capture the largest differences in the underlying SETEG factors.
One of the challenges in understanding urban risk and vulnerability is our ability to assess spatial heterogeneity of social and environmental characteristics in a changing urban landscape. While prior research offers theoretical and methodological conceptualizations of vulnerability in cities, many studies do not explicitly connect vulnerability concepts to actions we can take to reduce vulnerability to weather hazards and to improve overall quality of life. Observing, mapping, and modeling human behavior, social practices, and decision-making in the context of climatic and meteorological hazards are intricate research problems. Whether people take protective measures during a hurricane event such as evacuating, or alter daily routines or go to air conditioned places, to prevent heat-related illnesses, action is influenced by a combination of individual characteristics and capacities, such as risk perception, social capital, and access to resources – which vary across space and over time (Riad et al. Reference Riad, Norris and Barry Ruback1999).
Determining the differential vulnerabilities and adaptive capacities at a neighborhood to household level is essential to reducing negative outcomes from hazards (Morss et al. Reference Morss, Wilhelmi, Meehl and Dilling2011). Smit and Wandel (Reference Smit and Wandel2006: 282) note that “in the climate change field, adaptations can be considered as local or community-based adjustments to deal with changing conditions within the constraints of the broader economic-social political arrangements.” This highlights the importance of scale as internal to the system, indicating that what occurs at the household level also affects the community, which is in turn influenced by the citywide and macroscopic forces that shape the ability of individuals to adapt to or cope with challenging conditions. Previous research on extreme heat, for example, emphasizes the variability within cities, especially in terms of differences among households and communities, on adaptive capacity (Uejio et al. Reference Uejio, Wilhelmi, Golden, Mills, Gulino and Samenow2011; Harlan et al. Reference Harlan, Declet-Barreto, Stefanov and Petitti2013). At the individual level, factors such as advanced or very young age, preexisting medical conditions, and disability contribute to higher vulnerability, while exposure and capacity vary among neighborhoods. In Indian and Latin American cities, researchers have found that low-income neighborhoods have relatively more precarious working, housing, and living conditions than in middle-income neighborhoods, and inhabitants still rely on neighbors and family to respond to disruptions. Households in higher-income neighborhoods are able to move beyond coping to undertaking structural building modifications to withstand floods and extreme temperatures. However, it is common for a low proportion of households across socioeconomic statuses to have strong social networks on which to fall back to mitigate risks and adapt (Romero-Lankao et al. Reference Romero-Lankao, Hughes, Qin, Hardoy, Rosas-Huerta, Borquez and Lampis2014a; Romero-Lankao et al. Reference 112Romero-Lankao, Gnatz and Sperling2016).
Vulnerability studies also highlight the importance of sociodemographic factors such as social practices, perceptions, and behavior at an individual or household scale (Hayden et al. Reference Hayden, Brenkert-Smith and Wilhelmi2011; Morss et al. Reference Morss, Wilhelmi, Downton and Gruntfest2005; Qin et al. Reference Qin, Romero-Lankao, Hardoy and Angélica2015). Knowledge, attitudes, and practices (KAPs), as well as social capital, household resources, and access to community programs that reduce hazard risk, play important roles in minimizing vulnerability. For example, insofar as it relates to hurricane risk, KAP can substantially influence individual and collective responses, though the literature recognizes gaps in our knowledge about the links between perceptions and actions (Pidgeon and Butler Reference Pidgeon and Butler2009; Pidgeon and Fischhoff Reference Pidgeon and Fischhoff2011). People rely on knowledge, media coverage, local weather patterns, and their perceptions of organizations to create their personal views of reality (Dessai and Sims Reference Dessai and Sims2010). Natural hazards research has examined how perception of risk is determined by prior experience, knowledge, proximity to a hazard, and demographic characteristics, (Botzen et al. Reference Botzen, Aerts and Van Den Bergh2009; Lindell and Hwang Reference Lindell and Hwang2008), finding that prior experience may either increase or decrease perception of risk, depending on local context and other sociobehavioral characteristics (Riad et al. Reference Riad, Norris and Barry Ruback1999). Studies of evacuation decisions after Hurricanes Hugo and Andrew concluded that a simple warning is often not enough. Instead, individuals and communities require a multifaceted and tailored approach. For example, Hayden et al. (Reference Hayden, Brenkert-Smith and Wilhelmi2011) illustrate that extreme heat vulnerability is nuanced and may be offset by information that is not readily captured through demographic data, such as important social ties and reliance on neighbors for help during emergencies. These connections among households at a neighborhood level may provide a degree of protection in the event of a weather hazard.
Work in cities from low- and middle-income countries shows the nuanced ways in which socioeconomic status determines the extent to which urban populations rely on their networks and which sources of information they rely on to respond to extreme events such as floods, storm surges, and heat waves. In Mumbai, for instance, a low percentage of households relies on more formal social networks, such as political organizations). Although wealthier, more resilient households had more frequently participated in social networks as safety nets, more vulnerable household groups were more likely to fall on personal support during extreme emergencies (Romero-Lankao et al. Reference 112Romero-Lankao, Gnatz and Sperling2016). In Latin American cities, people with higher socioeconomic status were more likely to rely on individual means, such as by searching the Internet for state-supplied hazard information, while people with lower socioeconomic status relied on neighborhood networks and personal knowledge to respond to floods, landslides, and other hazards. These varied results point to the need to understand the importance both of scale (Figure 4.3) and of context-specific combinations of vulnerability attributes at play within and across urban households and neighborhoods.
4.4 Looking Forward: Critical Pathways for Reducing Risk and Vulnerability
Research on urban vulnerability and risk has grown considerably in recent years. Still, it is characterized by differences in conceptualizations and scope. More narrowly focused studies have helped identify many of the numerous parts of the risk puzzle. However, we still lack a cohesive picture of the dynamic whole created by the interaction of these parts. Through the application of more integrated approaches and frameworks, such as the examples in this chapter, scholars and communities of practice working across traditions, disciplines, and framings might be able to create an integrative knowledge that will aid in the design and implementation of more sustainable risk mitigation and adaptation actions and policies.
Decision-makers and stakeholders involved in designing and implementing risk mitigation and adaptation actions need to consider not only the multiple local hazards to which a population is exposed, but also the set of SETEG domains that shape differentiated vulnerabilities and adaptive capacities of populations. These factors arise from household, neighborhood, and citywide processes and from the larger, countrywide social and environmental drivers that may support or undermine the capacity to respond. Both urbanization and climate change are two such large forces; they are simultaneously fueled by local conditions and the imperatives of individual lives and livelihoods, hopes for a better life, and challenges to pursuing that life. In order to understand the whole, we need to pull it apart and look at its hazard exposure, sensitivity, and capacity facets; to understand these parts, we must look back and see the whole. It is only through such iterative approaches that we may hope to understand urban vulnerability and risk.
We must recognize that cities – like people, ecosystems, infrastructure, and governing bodies – are complex. Therefore, the context-specific and dynamic interactions between the urban system SETEG domains leads to emergent behaviors that we still struggle to understand. We must recognize this complexity when developing strategies that reduce climate and environmental change risk. We need to be acknowledged that solutions that target a single system domain are likely to lead to effects in the others, including outcomes that we may not have experienced in the past. In an increasingly urban world with greater hazards ushered in by climate and environmental change, scholars, decision-makers, and communities need to bring together their knowledge systems in search of integrative and socially relevant solutions.
5.1 Introduction to Global Health Challenges
To improve global health and well-being for cities, three global realities must be considered: the demographic shift related to aging of the population, the epidemiologic shift from infectious to noncommunicable diseases as the major threats to health, and climate change – which is changing disease patterns and quality of life, as well as, for some cities, creating serious challenges to their physical infrastructure. All of these critical challenges to health around the world converge in cities and the rapid rate of urbanization worldwide make attention to urban health a critical component of sustainable development.
The number and size of cities is expanding in all regions of the world, with China positioned as the world’s largest urban nation (see Chapter 1.1). Rapid urbanization is already presenting challenges to all countries, but its pace and scale are greatest in low- and middle-income countries, not only because of the rise of megacities (those with populations over 10 million), but primarily due to the rapid development of midsized cities of 250,000 to 500,000 inhabitants.
While the rapid rise in the world’s population of people aged 60 years or older is a public health triumph, it adds an additional challenge to advancing the health of people in cities: in the next four decades, 21 percent of the population will be over 60 years old, though the rate of increase of this demographic will still be higher in developed countries than in developing ones. Creating urban environments that support active, healthy aging, and health-promoting conditions for all ages is critical to preventing unsustainable pressures on health and social service systems and to maintaining a healthy workforce and active, engaged citizens.
The epidemiologic shift towards noncommunicable diseases, or NCDs –including primarily cardiovascular disease, or CVD; diabetes; cancer; and pulmonary disease – has made NCDs the number one cause of death globally, with a disproportionate impact in low- and middle-income countries and their already fragile healthcare systems. Deaths from NCDs are projected to increase 77 percent between 1990 and 2020, growing from 28.1 million to 49.7 million deaths annually (Report of the Obesity Working Group 2013). The rise in NCDs is tied to globalization and urbanization, as well as the aging of the population.
The environmental impacts of urbanization – increasing energy use and related greenhouse gas emissions, soil degradation, biodiversity loss, and severe water stress – have also had tremendous health consequences: In 2012, approximately seven million people died prematurely as a result of exposure to air pollution (WHO 2014), making air pollution the world’s single largest environmental health risk.
In order for cities to evolve as engines for national economic development and as hubs for technological innovation, social progress, and environmental sustainability, city leaders must respond to these challenges with evidence-based policies and programs that can promote the health of urban residents. For example, when plans for the built environment (including housing, land use, and transport) include consideration of their health impacts, cities can facilitate healthy choices in terms of food, exercise, and social engagement; address the physical and mental health issues linked to NCDs, infectious diseases, violence, road accidents, unemployment, poverty, and natural disasters; and maximize the resilience of its residents. In contrast, a failure to address the health of people living in cities can place urban residents at serious health, economic, and security risks. Since healthy people are critical to social and economic development, addressing the health impacts of urbanization must be central to national, regional, and local sustainable development agendas.
5.2 Determinants of Urban Health
Health experts now know that there are broader and more important determinants of health than the availability of medical care (Figure 5.1), which has often been the major focus of global and national health policy attention and investment (Dahlgren and Whitehead Reference Dahlgren and Whitehead1991; Woolf et al. Reference Woolf, Johnson, Phillips and Philipsen2007). Age, sex, and genetic makeup, as well as other “constitutional factors” such as ethnicity, influence people’s health, as does access to quality health care. But other factors, including safe natural and built environments (housing, transportation, parks, and urban design), and the socioeconomic environment (the availability of education, jobs, and social support) can prevent or exacerbate risky health behaviors (such as diet, exercise, tobacco use, and unhealthy alcohol and drug use). In addition, the public policies and political environment that shape these environments, including the societal impact of racism, have far greater impacts on health than the environments alone. These can be modified to affect the health of entire populations.
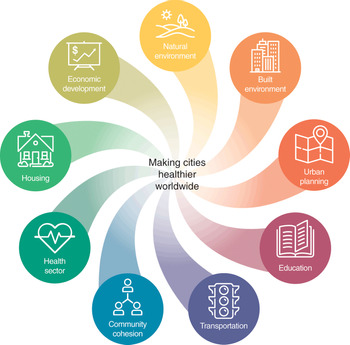
Figure 5.1 Broad determinants of health. Urban health experts now know that the built, physical, social, and economic environments are crucial factors in maintaining and improve health.
Because cities are the places with the highest human population densities and concentrations of physical, social, and economic infrastructure, they pose challenges to and yet provide opportunities for action on these variables to improve the health and well-being of the majority of the world’s population. The multifactorial nature of these challenges calls for a multisectoral approach to governance and for an approach that is inclusive – involving multiple stakeholders and communities in identifying and solving priority problems themselves. A systems approach to such governance, along with a commitment to decisions that advance health and health equity, will be critical to urban health and, therefore, to global health.
5.3 A Conceptual Framework for a Systems Approach to Urban Health and Well-Being
Figure 5.2 aims to explain how urban health and well-being emerges and is further changed by urban systems functions. Because the city is an open system, it is also influenced by processes outside the urban system (see Chapter 1.2).

Figure 5.2 Urban health and well-being emerges as an outcome of urban system structure and processes and change factors from outside the system.
In identifying the various goods and services that urban systems provide, this framework also supports action based on the evidence that the key factors influencing urban health are primarily located outside the traditional healthcare system. Table 5.1 concentrates more deeply on the components of “urban system services,” drawing on the processes described in Figure 5.2. Habitat and supporting services provide space and infrastructure to meet the basic needs of life. These are the preconditions for energy and information flows, such as houses, roads, marketplaces, water pipes, sanitation infrastructure, and telephone lines. Provisioning services provide products and energy for consumption and production. Regulation services generate benefits from governing interactions and exchange processes. Cultural services generate nonmaterial benefits for cognitive and knowledge development. Understanding the interconnections of these systems and aligning them to produce health is the challenge for a “Health in All Policies”Footnote 1 governance of a city and can be facilitated by a systems approach to identifying the problem and exploring solutions.
Table 5.1 Urban system goods and services and examples of health benefits and risks
| Type of urban system service | Description of urban system services | Examples of health benefits and risks |
|---|---|---|
| Habitat and supporting | These are physical spaces and infrastructure for living and working in the city. Green (such as parks), blue (such as lakes), and gray (such as roads and buildings) environments are created to provide basic needs, including shelter, waste management, water treatment and sanitation, production of goods, and energy provision. | Housing-related health risks:
|
| Habitat functions make the city a livable place by providing the hardware that enables material, energy, and data flows, thereby facilitating urban metabolisms. | Health benefits from urban green space:
| |
| Provisioning | These include goods and services provided by the urban system – some of which can be exchanged on markets, provided by the public, or coproduced. Goods include food, water, manufactured goods, medicines, computers, and books, among many others. Services include access to and use of roads, communication and other public infrastructure, security, waste management, health care and education systems, and disaster response and emergency systems. The provision and production of goods and services can be organized publicly, privately, or in public-private combinations. |
|
| Regulating | These are benefits derived from having a system of rules and regulations in place, by means of which the urban system is governed (in the social space) and managed (in the economic and technological space). Regulating services include institutional infrastructure, which determines social interactions and other urban metabolic outcomes, such as regulating access to public places and services, markets and businesses, traffic, the collection and use of data, the implementation of food safety protocols, and the application of environmental standards in the urban economy. Formal and informal rules, norms, and conventions are part of the urban institutional environment. |
|
| Cultural | These are benefits created in urban sociocultural spaces; they include social spaces and liberties for economic and political innovation; exchange of ideas; creativity from exposure to cultural diversity and different forms of cultural expression; recreation and leisure; space for spiritual enrichment; and places to do art and undertake cognitive development. Examples include cultural events, religious places, “Heimat” (sense of belonging), exhibitions, libraries, cultural heritage values (such as historical places), and cultural diversity. |
|
5.4 A Systems Approach to Some Common Urban Health Challenges
5.4.1 Transportation
The following examples reveal the breadth of interconnected urban health problems related to complex interrelations between transportation (Figure 5.3), food security (Figure 5.4), and public health as examples of a systems approach to common urban health problems.

Figure 5.3 Simplified interconnections between urban transportation, air quality, climate change, and public health.

Figure 5.4 Dynamic relationships between variables for food security and the proportion of obese people in urban communities.
Increased road use by private vehicles, for instance, takes advantage of and eventually wears down an intact road infrastructure. Urban planning that favors the use of cars can lead to increased air pollution and road traffic injuries, as well as contribute to a reduction in physical activity, with implications for public health and heath care costs from obesity, cardiovascular disease, chronic and acute pulmonary disease, and certain cancers. In contrast, positive health impacts can be expected from reducing the amount of private cars on roads and improving public transport infrastructure (Lung Reference Lung2014).
5.4.2 Access to Affordable, Nutritional Foods
Today, the prevailing rates of weight- and diet-related chronic diseases, such as diabetes and hypertension, are increasing in every region, but especially in low- and middle-income countries. Population growth, rising incomes, urbanization, and globalization are some of the major drivers of changes in dietary patterns (Figure 5.4). Estimates suggest that by 2030, the number of overweight and obese people will have increased from 1.33 billion in 2005 to 3.28 billion, around one-third of the projected global population (GPAFS 2016).
Urban food security refers to the access to, availability of, and use of food. This includes production, distribution, safety, and quality of food, but it often ignores the nutritional value of diets and individual choices. The Food and Agriculture Organization, or FAO, defines food security as a “situation that exists when all people, at all times, have physical, social and economic access to sufficient, safe and nutritious food that meets their dietary needs and food preferences for an active and healthy life” (FAO 2015). Food insecurity has substantial negative impacts on the physical and mental health of adults and children and is a major problem for many urban populations.
Food insecurity can also exist in communities where sufficient food is not available and/or where diets are not nutritious or safe. These low-quality diets contain insufficient calories, vitamins, and minerals or contain too many calories and too much saturated fat, salt, and sugar. The risk that poor diets pose to mortality and morbidity is now greater than the combined risks of unsafe sex and alcohol, drug, and tobacco use. To achieve healthier diets, food systems must focus on quality and on making the healthy and affordable food choice the easy choice.
To improve diets, healthy eating must be the easiest available choice; likewise, to reduce obesity, physical activity must be desirable and accessible. No single intervention can address the many factors (as identified in Figure 5.2) that contribute to obesity. Priorities for policy-makers include addressing drivers of caloric overconsumption within the food system; supporting access to healthy and affordable foods, especially in low-income communities; incentivizing production of fresh produce; establishing public procurement guidelines that support these producers; developing workplace/school setting interventions that promote healthy eating and physical activity; and providing nutrition education that is culturally appropriate (Libman et al. Reference Libman, Beatty, Fiedler, Abbot, Green and Weiss.2016).
An example of a successful intersectoral partnership for obesity control is the Ensemble Prévenons l’Obésité Des Enfants (Together Let’s Prevent Childhood Obesity), or EPODE, an international network that aims to connect a network of stakeholders that takes a “whole community approach” to reducing obesity in a particular locale by coordinating action across school-based interventions, parent and community engagement, municipal support for environmental changes (such as new sports facilities), and media coverage (Report of the Obesity Working Group 2013).
A school meal initiative to improve child nutrition and school enrollment rates that incorporated procurement rules addressed multiple local needs – for fresh, high-quality food as well as a stable market for small local producers. Similarly, the UN World Food Programme’s Home Grown School Feeding Program, as implemented in the municipality of Campinas in São Paulo, Brazil, transitioned the community from unpopular and low-quality processed foods to broadly approved, high-quality fresh vegetables, fruits, and meats when regulations were added that required 30 percent of the national school food budget to be spent on food sourced directly from family farmers in the local region served by the school (Otsuki Reference Otsuki2011).
As these examples illustrate, a systems approach offers an exciting framework for multisectoral definitions of problems and problem solving that incorporates evidence-based solutions for promoting health in urban planning, housing, transportation, food systems, education, and other sectors. Indeed, researchers have applied a systems science approach to other health issues such as obesity, and this technique is a growing area of interest for public health scholars.Footnote 2
In addition to exploring the complex interconnectedness of system variables that determine urban health, the systems approach, as developed by the Urban Health and Wellbeing programme of the International Council for Science, integrates human health concerns into questions about urban system function. It also addresses knowledge creation in science and society in order to harness urban complexity by solving complicated, wicked types of problems, and the different types of knowledge needed to solve them (ICSU 2011; Gatzweiler et al. Reference Gatzweiler, Ayad, Boufford, Capon, Diez Roux, Donnelly, Hanaki, Jayasinghe, Nath, Parnell, Rietveld, Ritchie, Salem, Speizer, Zhang and Zhu2016).
Accordingly, for society, a systems approach to urban health and well-being means scientists coproducing knowledge for urban health in collaboration with affected communities, government agencies, and civil society organizations; recognizing how different urban system functions and modes of urban life are connected to particular health and well-being outcomes; raising awareness and educating the public and policy-makers on interrelated issues of health and well-being; creating demand and opportunities for entrepreneurship, business, and civil society engagement for health and well-being; and creating networks of like-minded system thinkers and agents of change for improving health and the quality of life in cities.
For science, a systems approach means:
1. The development of new conceptual models that incorporate dynamic relations of the processes leading to health in urban settings. These conceptual models must be specific to a given research problem or question; the development of these models may involve input from stakeholders as well as scientists, as appropriate to the research problem and context.
2. The use of systems tools and formal simulation models, such as agent-based models, systems dynamic models, or other systems modeling tools, to better understand the functioning of the integrated urban health system or to predict changes to health under various hypothetical interventions.
3. The integration of various sources and types of data (including spatial, visual, quantitative, and qualitative data) in the conceptual models and/or the formal simulation models as well as the identification of important data gaps that need to be filled in order to advance understanding of how the system works.
5.5 Governance to Advance Urban Health and Well-Being
Effective, inclusive, and representative “government” – including the institutional means to ensure provision of infrastructure – requires goods and services to address urban health problems. Such a government must also be able to engage other stakeholders to achieve agreement on the nature of the problem, potential solutions, and how to measure success. Alignment on aspects of a given problem and its solution is often referred to as “governance.” An extensive literature shows that effective government is part of good governance and both are important determinants of urban health; particularly important is a strong public health infrastructure that can work cooperatively to examine potential risks and benefits to health policies, programs, and investments across sectors.
This need for broad-based action underlies a governance framework for health called a “Health in All Policies” approach, which reflects the importance of a public policy focus on the broader determinants of health, such as housing, transportation, built and natural environments, education, and economic development to create communities that actually support and permit healthier behaviors. The complexity of these determinants and their solutions further requires the input of a broad range of stakeholders beyond healthcare providers, such as community-based organizations, academia, business, and the media. The public health system can help to catalyze actions that bring the many stakeholders in urban health together to systematically consider the health implications of decisions, to seek synergies, and to avoid harmful health impacts to improve population health and health equity.Footnote 3
The World Health Organization’s recent Global Report on Urban Health: Equitable, Healthier Cities for Sustainable Development devotes its third section to the need for a renewed focus on urban governance to achieve the Sustainable Development Goals globally, as well as to achieve healthier cities in countries (WHO 2016). Since local governments may have responsibility for multiple functions that affect health (including land use, roads and transportation, and environmental protection), governance for healthy and sustainable cities requires an integrated approach across agencies and sectors that facilitates meaningful community participation. Empowering citizens with information is key to their involvement in decision-making on urban health initiatives, especially to ensure sustainable action on health inequities. Data sharing and transparency are also important for enabling civil society, government, and the private sector to work together effectively. With rapid urbanization constraining government capacity to provide quality services, the private sector serves an increasingly important role as a partner in meeting the needs of urban residents. Above all, the report emphasizes the importance of adopting a “Health in All” approach to policy and decision-making processes across city governments, with health equity as a core value.
An example of governance for health that addresses one of the important urban health challenges of aging is the Age-Friendly New York City Initiative. Using the WHO age-friendly frameworkFootnote 4 that promotes healthy aging using a life-course approach to help cities plan for the needs of older adults. The WHO identified eight domains of age-friendliness that, if addressed through improvements to policies, practices, and programs, can reverse or slow the disability trajectory.
One comprehensive example is the Age-Friendly New York City Initiative (hereinafter Age-Friendly NYC), a public-private initiative that brings key people from multiple sectors and government agencies together to improve the lives of older adults by changing their physical and social environments to promote the maintenance of independence and active engagement of older persons in the life of the city. Launched in 2007, Age-Friendly NYC is a partnership between a nongovernmental organization – the New York Academy of Medicine – and local government offices, including the Office of the Mayor of the City of New York and the New York City Council. Age-Friendly NYC attracted the support of local policy-makers during the global financial crisis because of several factors: the number of older persons in New York City was projected to grow by 40.7 percent within the next 20 years; this subpopulation would be one of the most diverse groups of older persons in the world; and older people live in all parts of the city and vote and shop locally, thus they are engines for community economic development. A mayor-appointed Age-Friendly Commission, with representatives from business, city government, NGOs, and the private sector, oversees the initiative, which includes input from older persons via public hearings held across the city. Mayor Michael Bloomberg also mobilized 22 city agencies around the initiative, asking them to examine the programs and capital investments already planned over the next five years to determine how they might be changed if the needs of older persons were taken into account. The result was a report with 59 city government commitments that continue to be tracked by the commission, which has also promoted complementary private sector activities.
One area in which Age-Friendly NYC has had a visible impact is in addressing transportation challenges faced by older adults that decrease their ability to leave their homes, to engage actively in their communities, and to exercise and access healthy food. Solutions are aimed at creating “Complete Streets”; these provide for safe and active movement for all users by improving the safety of seniors and other pedestrians, as well as all road users in New York City. Aspects of Complete Streets include bus shelters with seating and signage, paid for by advertising; school buses repurposed during the school day for grocery store trips; benches installed with older adult input; and improvements to streets and signage in neighborhoods with the most pedestrian accidents, including extending pedestrian crossing times, altering curbs and sidewalks, restricting vehicle turns, and narrowing roadways. When all of these improvements are implemented, officials expect an estimated 10 percent reduction in pedestrian fatalities among older people.
Lessons learned in creating and implementing cross-sectoral strategies for age-friendly cities are equally applicable to efforts to prevent NCDs, where there is increasing evidence that incidents over a lifetime seem to make individuals more vulnerable to premature morbidity and mortality. Approaches that change the environment will have a broader impact than efforts to change individual behavior and should be a priority for city action. Initiatives that can address more than one need are more likely to gain and sustain the support of political leaders. Low-cost and no-cost interventions can have a tremendous impact on health and may be easy to incorporate into existing plans and activities. Because the determinants of health are affected by all sectors, planning for health should leverage financial resources from within and outside the health sector; partnerships outside of government and public engagement are key to sustainability.
5.6 Conclusions
As we have gained information about and understanding of the multiple determinants of health, we have found that the systems approach to urban health and well-being permits individuals charged with and concerned about improving the health of cities to better develop strategies that identify the multisectoral origins of the problem; encourages research for solutions that advance health; and engages effectively with multiple stakeholders to increase the likelihood of sustainable implementation of new initiatives.
We must remember to keep inequity at the forefront of any discussion of urban policies. Since cities are the locus of vast inequities of opportunity, compounded by poverty, race, ethnicity, gender, age, and migration status, urban dwellers bear the consequences of unplanned urbanization differently than nonurban residents, with adverse impacts falling disproportionately on the vulnerable and poor (see, for example, Marmot Reference Marmot2015). Moreover, in cities, concentrations of deprivation often exist at the neighborhood level. This phenomenon emphasizes the importance of identifying problems, creating appropriate solutions, and tracking progress in partnership with local communities, which are the experts on their neighborhood. The evidence clearly indicates that locally owned solutions are critical to achieving and sustaining a community’s health (see Cummins et al. Reference Cummins, Curtis, Diez-Roux and Macintyre2007; Kershaw et al. Reference Kershaw, Osypuk, Do, De Chavez and Diez Roux2015).
Ultimately, the effective governance of cities in general – and, specifically, of cities seeking to achieve goals of health and well-being – depends on political will. As we move to engage political officials at the city level, we must first understand that they may not be familiar with the evidence for the multiple determinants of health, and may still see the solution to achieving health as primarily an issue of assuring access to health care and strengthening personal healthcare systems. Further, as national governments increasingly move to identify their own models for local government and the decentralization of authority, it is important to understand whether local government entities have the authority to address such problems and, even where such authority does exist, whether they have the basic information systems and infrastructure to solve them. A systems approach to these challenges can help to facilitate understanding and action to improve the health and well-being of people in cities, and to achieve the Sustainable Development Goals for improved health for all.
Acknowledgments
We thank Indira Nath, Pierre Ritchie, Anthony Capon, Carlos Dora, Yong-Guan Zhu, Ilene Speizer, Gérard Salem, Luuk Rietvald, Ana Diez Roux, José Siri, Saroj Jayasinghe, Christl A. Donnelly, Keisuke Hanaki, Hany M. Ayad, and Susan Parnell for constructive comments and contributions to the chapter.
6.1 Introduction: Cities as the Locus of Productivity, Value Creation, and Income Generation
In the twenty-first century, cities offer the potential of economic opportunity. Historically, as an increasing share of the total population of a country’s population lives in urban areas, GDP has increased (World Bank 2009). As displayed in Figure 6.1, this is more than an accidental correlation: It reflects the clear relationship between the efficiencies and productivity of agglomeration economies and location. Agglomeration, when accompanied by growing density and proximity, allows the reduction of costs of production of goods and services and growing consumption by an ever-wealthier urban labor force. The process of value creation itself is a quintessential process of bringing factors of production together in time and space.

Figure 6.1 The relationship between per capita GDP and urbanization across countries (1996 dollars).
Economies of scale can generate higher productivity as shown in studies in Brazil, which concluded that productivity increased roughly 1 percent for every 10 percent increase in the number of workers employed in an industry or in a city. This very large increase means that by growing from a city of 1,000 workers to one with 10,000 workers, productivity would increase by a factor of 90 (Spence et al. Reference Spence, Annez and Buckley2009). Thus, over time, aggregate economic growth is closely associated with the urban percentage of total population. Historically, “very few countries have reached income levels of US$10,000 per capita before reaching about 60 percent urbanization” (Spence et al. Reference Spence, Annez and Buckley2009: 3). All high-income countries are 70 to 80 percent urbanized (Spence et al. Reference Spence, Annez and Buckley2009).
In 2016, all countries generated more than half of their GDP in urban-based economic activities (Cohen Reference Cohen1991). Projections for future economic growth in all countries demonstrate that the trend towards greater concentration of economic activity will occur in urban areas of all sizes. Even in the rare case of countries in which urbanization occurred without growth, a pattern that Spence et al. (Reference Spence, Annez and Buckley2009: 8) call “pathological urbanization,” there is little evidence that urbanization exacerbated poverty.
Productivity is a highly localized phenomenon. Location, in turn, greatly impacts a person’s opportunities. The country, region, city, and neighborhood in which a person grows up affect that person’s income mobility, living standard, and quality of life. The stark divide between rich and poor countries is therefore a highly localized issue, too. We then have to ask ourselves, what factors encourage some cities to prosper and others to decay? More importantly, what can be done to change it? How can gaps between labor productivity be reduced, and how can labor from low-productivity activities flow to high-productivity activities?
This chapter attempts to respond to these questions in the light of the adoption of the New Urban Agenda, the outcome document of the Habitat III conference held in 2016, which is set to guide the urbanization efforts of the next 20 years.
6.2 Productivity Enhancing and Constraining City Characteristics
In 1991, the World Bank identified four major constraints on urban productivity – infrastructure deficiencies, regulatory effects, weak local governments, and the absence of urban finance institutions (Cohen Reference Cohen1991) – that help to answer our motivating questions.
While the weaknesses of urban infrastructure have been observed all over the world, a comparative study from Lagos, Jakarta, and Bangkok concludes that small- and medium-sized enterprises spent from 35, to 20, to 12 percent of gross fixed investments, respectively, to provide water supply; electricity; solid waste collection and disposal; and worker transport in cities where these services were largely unreliable and frequently unavailable (Anas et al. Reference Anas, Lee and Gi-Taik1996). It was thus no surprise that these firms had limited profits and did not grow to be very large. These heavy “infrastructure taxes” constrained firm size and employment growth. In this way, infrastructure deficiencies undermine economic productivity. These direct impacts are accompanied by other negative externalities from infrastructure failure, such as the traffic problems in Bangkok, flooding in Jakarta, or air pollution in Mexico City, each of which has generated citizen action and political demands for remedial action.
The second major constraint to urban productivity is costly regulation. While many forms of regulation are essential for public safety, whether in the form of fire laws or environmental protections, some forms of regulation greatly increase the cost of urban economic activity. A 1989 study of the housing sectors in Kuala Lumpur and Bangkok found that, while Malaysia is much richer than Thailand, Bangkok produced better and cheaper housing than Kuala Lumpur. The answer to this puzzle lay in the 55 steps and three years required to obtain a building permit in Kuala Lumpur – delays that amounted to about 3 percent of GDP. Regulations imposed heavy taxes on households and firms hoping to start new construction (Hannah et al. Reference Hannah, Bertaud, Malpezzi and Mayo1989). Colonial housing regulations in former British colonies in West Africa had similar effects. When apartheid ended in South Africa in 1994, builders had to complete 24 steps to obtain necessary permits. The number has now been reduced to nine.
These constraints do not exist in an institutional vacuum. A third important constraint on urban productivity is the many institutional, technical, and financial weaknesses of local government. In many cases, national governments keep local governments closely constrained, dependent on monthly or annual financial transfers that are conditional on fulfilling national objectives and policies. The financial constraints to local governments are clear in the low percapita amounts of budgetary resources available for local spending.
It follows, then, that local governments fail to maintain local infrastructure or social services, while at the same time providing notably slow and inefficient services to urban residents in such matters as renewing drivers’ licenses. Moreover, local governments should be given the institutional capacity to introduce policies that improve the welfare of their citizens by, for instance, adjusting the local minimum wage to the high costs of living in some cities.
A fourth constraint is the lack of urban finance institutions to finance long-term, durable assets, such as infrastructure or housing. While cities need long-term finance for these important assets, most developing countries lack robust financial sectors to provide the quantity of finance needed on reasonable terms. This dearth of financial resources contributes to the presence of infrastructure deficiencies and the slow rate of investment in public goods.
Taken together, these four constraints – identified more than 20 years ago – continue to be relevant in explaining why cities are not more productive than they already are. While these local constraints are the basis for enhancing or reducing productivity levels, exogenous factors might be just as influential. The following section will shed light on the influence of global exogenous forces and how they affect urban economic performance.
6.3 Urban Areas as Sites of Impact of Global Economic Change
The position of urban economic activities in macroeconomic performance becomes increasingly complicated as we consider the multiple and shifting impacts of global economic processes. The global economic crisis, which began in 2008–2009 generated diverse impacts in cities, including the initial freezing of credit, reduced demand for manufactured goods and exports, growing unemployment, lost incomes, reduced public revenues, and contracting local economies. These impacts were well recorded in the Asian financial crisis of 1997 and in Argentina after the crisis of 2001–2002, and have been noted in the ongoing European recession.
The process of urban economic contraction is very painful and also very visible. As public and private spending declines, street vendors and service purveyors lose demand for their services. As sales decline, so do tax revenues, which finance public expenditures.
Studies of Latin American economies in the 1990s showed that when economic growth occurred, the urban poor benefited. But when recession hit, the poor fell farther than the rich, and they stayed down for a longer time (Morley Reference Morley1998). The worsening income distribution in Latin American countries the resulted cannot be easily separated from the patterns of volatility that have affected the region. This is also exacerbated by drastic reductions in the flow of important cash remittances that have dwarfed any official aid to Latin America (Terry Reference Terry2005).
Cities can be expected to continue to feel the impact of global economic crises, leaving deep footprints on the urban social fabric and the physical conditions of urban areas. Within the public sector, there is an obvious need for expenditures to provide basic services and to operate and maintain urban infrastructure, but these are challenged by low levels of public investment and the lack of credit. These shortages of funds have serious effects on the quantity and quality of public goods in cities. Both the reduced level and the changing composition of public expenditures have been observed within regions and for the world as a whole (World Bank 2009).
6.4 The Urbanization of Poverty, Productivity, and Rising Inequalities
As cities have generated higher incomes, they have also become the preferred destinations of migrants, whether from rural areas or from other countries (Harris and Todaro Reference Harris and Todaro1970). In 1970, about half of urban growth in developing countries could be attributed to migration, the other half to natural increase. By 1990, that ratio had shifted towards 70 percent from natural increase and 30 percent from migration (Preston Reference Preston1990; see Chapter 1). While in most countries of Latin America, the Middle East, and East Asia, the large population shifts to urban areas have already occurred, newer accelerated international migration – by Syrian refugees to Europe in 2015–2016, for example – has added new demographic pressures to receiving cities and countries.
Though we reached a tipping point in 2008 when the world’s total population became more than half urban, this shift has not led to a deceleration in urbanization; rather, new projections for the 2015–2030 period predict another two billion residents will be added to cities. That number is equivalent to adding about 70 million people per year, or the population of Pittsburgh or Hanoi every week.
While people in cities generally live at higher income levels than in rural areas, this massive demographic transformation is also reflected in what has been called “the urbanization of poverty” (Martine Reference Martine2012). For example, in Latin America, a region that experienced economic growth rates of about 5 percent on average from 2005 to 2007, more than 350 million people continue to live on less than $3,000 a year, and 120 million are living on less than $2 a day.
Moreover, increasing numbers of the world’s urban population live in slums. The Millennium Development Project estimated this number of people at 924 million in 2003. Projections suggest that the additional two billion urban residents expected to move into cities by 2030 will live in poor housing conditions that lack a clean water supply and sanitation, as well as other infrastructure services such as drainage, solid waste collection, and electricity. To this we must add significant deficits in essential social services, such as schools and clinics, as well as increasing levels of air pollution and congestion.
Poor living conditions also contribute to lowering the productivity of the urban labor force. Poor sanitary conditions create health problems, which reduce physical strength and the number of days people are capable of earning wages. High-density settlements with large numbers of unemployed youth are frequently the sites of violence and despair. Often, these slums are located on dangerous sites that are highly vulnerable to flooding and other natural disasters. Slums become the loci of cumulative vulnerabilities, creating scenarios in which it is difficult even for educated youth to overcome their living environments (UN-Habitat 2003).
Two primary conclusions can be drawn from this discussion. First, urban areas are the places of economic and social opportunity, including higher incomes, jobs, and upward mobility. Yet, the combination of rapid demographic growth, growing demand for essential urban infrastructure and social services, and inadequate resources to deliver these services creates severe challenges for urban governance. Local governments are increasingly unable to satisfy the scale and complexity of demands coming from urban civil society.
While many exogenous forces contribute to urban poverty and inequality, public policies can directly contribute to their reduction. Developments and challenges in two dimensions are critical to this endeavor: 1) productivity, unemployment, and inequality and 2) the informal sector.
6.4.1 Productivity, Unemployment, and Inequality
Much of the period spanning the 1990s to the present has been dominated by a policy and strategic focus on macroeconomic management, heavily influenced by arguments for liberalization of the “Washington Consensus” and the unproven belief that growth over time will reduce unemployment. This perspective supported the view that state intervention in employment issues was inefficient, harkening back to the New Deal or state-backed programs in the former Soviet Union or in China. Such beliefs have had a lasting and negative impact on efforts to strengthen the abilities of municipalities to address urban employment and underemployment by developing unrealistic expectations from the private sector, and by side-stepping the public sector – that is, city government – rather than working to strengthen its areas of comparative advantage for job creation.
For these reasons, we should be surprised that the past decades have been marked by increasing inequality. Although aggregate economic growth and local productivity have increased, wages have stagnated, and structural inequality of both income and wages has become a social and economic concern (Bivens and Mishel Reference Bivens and Mishel2015).
In 17 out of 22 OECD countries, inequality has increased since 2000 (OECD 2015). Industrialized countries are currently experiencing levels of inequality not seen since the nineteenth century, and many developing countries have become more unequal over the past decade. Asia, the region that experienced the highest growth rates in the world (with a GDP growth rate of about 7 percent) and the largest reduction in poverty ever recorded in history (from 54 percent living in poverty in 1990 to 21.5 percent living in poverty in 2010), is also the region in which the rich-poor divide is widening most quickly (OECD 2015).
Piketty’s (Reference Piketty2014) ground breaking historical analysis of inequality offers an explanation for this surge in inequality. The present state of affairs, which he refers to as “patrimonial capitalism,” favors capital owners and “rentiers” over the working population. According to his analysis, the reason for this scenario is the rate of return on capital (r), which has increased at a much greater level than the rate of economic growth (g): in mathematic terms, r > g. For the last 300 years, the rate of return on capital has increased at a steady rate of about 5 percent, while g, conversely, has shown severe fluctuations and lower growth rates. As wealth grows faster than economic output, economic growth is accumulated in the hands of a few, increasing the wealth gap between the famous 1 percent and the rest of society.
Piketty (Reference Piketty2014) stresses that conditions vary across countries, depending on the level of government intervention in the market. Figure 6.2 displays the relationship between GDP per capita and the Gini coefficient – a measure of inequality – in selected countries in Latin America and the Caribbean. The relationship illustrated here confirms Piketty’s theory, revealing that there is no clear link between these two variables. Mexico and Brazil, for example, have similar levels of income per capita, yet starkly contrasting levels of inequality (Mexico’s Gini is .45; Brazil’s reached .57 in 2010).

Figure 6.2 The relationship between income per capita (current USD) and Gini coefficient in Latin American countries.
Among many developed countries, there is increased concern about a productivity-pay gap, where wage growth has fallen greatly behind productivity growth. The case of the United States is particularly striking. Figure 6.3 presents the cumulative growth in net productivity of the total economy and inflation-adjusted average compensation of workers in the private sector since 1948. In the decades following World War II, hourly compensation of workers increased in tandem with economy-wide productivity. After 1973, however, hourly wages stagnated for the majority of US workers, while productivity continued to rise. This trend became even more severe after 2000, after which a mere 1.8 percent of the net productivity growth of 21.6 percent was translated into compensation for workers.

Figure 6.3 Cumulative change in productivity (orange) and hourly compensation (green) in the United States between 1945 and 2015.
According to the Economic Policy Institute’s Bivens and Michel (Reference Bivens and Mishel2015), the central driver of this productivity-pay gap is inequality, inequality of compensation, and the falling share of income allocated to workers relative to capital owners, which confirms Piketty’s theory of r > g, where rate of return on capital has become greater than the rate of economic growth.
Because cities play an important role in national economic development and productivity growth, the next logical step provoked by these patterns is to consider possible implications of these national trends on urban areas, and to identify how urban areas impact developments on a national level.
In a study of 220 metropolitan areas in the United States, Hsieh and Moretti (Reference Hsieh and Moretti2015) found that the most productive cities, including New York and San Francisco, are not contributing to national GDP growth as one might expect. The New York metropolitan area serves as a prime example. It ranks among the top 20 most productive metropolitan areas in the United States (Parilla and Muro Reference Parilla and Muro2017). According to Hsieh and Moretti’s analysis, however, the New York metropolitan region was only responsible for 5 percent of the country’s aggregate output growth. While cities like New York are more productive and offer higher nominal wages, these pull factors are offset by extremely high costs for housing, which present constraints to worker mobility and a spatial misallocation of labor across the country.
The case of Colombia’s capital, Bogotá, is a more positive example of shared economic growth. After the 1998 crisis, both Colombia and Bogotá experienced economic recovery; in 2007, Bogotá’s GDP grew by approximately 7 percent (UN-Habitat 2014). As depicted in Figure 6.4, the economic growth occurred in tandem with a constant reduction in the city’s Gini coefficient, as well as a reduction in the differential between the salaries earned by the richest and the poorest 10 percent of the population. A study by UN-Habitat (2014) finds that this reduction in income inequality is a result of structural changes and the introduction of local social policies aimed at reducing inequality, including a wide provision of public services. Even in times of economy recovery from the 2008 crisis, when economic growth slowed significantly, inequality in Bogotá continued to decrease, falling below the national urban Gini coefficient.

Figure 6.4 Changes in the Gini coefficient, as well as the differential between the salaries earned by the richest and the poorest 10 percent (a metric called D10/D1) in Bogotá between 1991 and 2010.
In sum, increased urban productivity does not always go hand in hand with more equitable income distribution and better working conditions. This is not to say that economic growth and the generation of inequalities are inextricably linked, but rather point to the importance of national and local government efforts to limit increases in inequality.
6.4.2 The Informal Sector
The informal economy is widespread and increasing in size in most parts of the world, especially in low- and middle-income countries, where it accounts for half to three-quarters of all nonagricultural employment (Chen Reference Chen and Chant2010; ILO 2013). Informal employment comprises about 65 percent of nonagricultural employment in developing Asia, 51 percent in Latin America, 48 percent in North Africa, and 72 percent in sub-Saharan Africa; in these regions, this labor force produces between 20 and 40 percent of GDP.
How the informal sector fits into and develops within individual regions and countries varies considerably. Asia has felt the impacts of globalization, with its effects on capital and labor flows, movement of technology, and wage rates, most intensely. The East Asian financial crisis of 1997–1998 affected the small-scale sector, weakening the demand for locally produced products while increasing interest rates and reducing purchasing power. Bank credit became scarce at a time when input prices for energy and other raw materials increased. At the macro-level, economists nonetheless assumed that local economies were relatively sheltered from this regional crisis. Some observers with their feet on the ground wrote about “the geography of change” in this period (Amin and Robins Reference Amin and Robins1990), raising questions about the resilience or vulnerability of the urban and local economies to external shocks.
Many studies on the informal sector have argued that there is a negative correlation between the size of the informal sector and the growth rate of per capita GDP, as is illustrated in the downward sloping trend line in Figure 6.5 (Slonimczyk Reference Slonimczyk2014).

Figure 6.5 The relationship between GDP per capita and the shadow economy as a percentage of total GDP on a global average.
In contrast, other studies (for example, Heintz Reference Heintz2006) point out that the correlation between informality and slow growth of GDP does not necessarily imply causality. In fact, slow growth could explain a certain degree of informality, rather than the other way around. Rather than perceiving the formal and informal sectors as conflicting, the two economies may work in symbiosis. In an era of globalization and outsourcing, many key components and services used by the formal sector are outsourced to the informal economy.
The perception of the informal sector as a pool of potential entrepreneurs whose wealth creation capacity is constrained by a regulatory burden sidesteps the fact that most workers in the informal economy are engaged in disguised employment relationships (Chen Reference 145Chen2006). This alternate vision views the informal economy as linked, in a dynamic and often subservient relationship, with the formal economy, and indicates that efforts to “formalize” the informal economy are doomed to failure without addressing the broader dynamics that stimulate job creation in the larger economy – formal and informal, rural as well as urban.
Heintz (Reference Heintz2006: 5) recognizes the growing importance of urban informal employment “as rapid urbanization continues and the growth of formal job opportunities lags behind the expansion of the urban labor force.” He further argues that “municipal regulations frequently fail to recognize urban informal activities as legitimate.”
The International Labour Organization (ILO 2013) argues that the root of the informal economy problem is the inability of economies to create sufficient numbers of quality jobs. Employment growth in the formal segment of the economy in most countries has lagged behind the growth of the labor force, trends that are likely to continue in the future (ILO 2008). Even in China, where the rates of economic growth and poverty reduction have been remarkable, the informal economy is growing.
Workers in the informal economy are not only disproportionally affected by global economic forces, but also by changing climate patterns. In turn, the informal economy can, and already does, play a crucial role in greening the urban economy and contributing to climate resilience. Brown et al. (Reference Brown, McGranahan and Dodman2014) encourage local governments to collaborate with the informal sector in achieving more inclusive and green economies.
6.5 Imagining the Future of Urban Productivity
According to a recent OECD (2015) report, global economic growth is projected to slow in most countries. While the OECD considers structural changes, it misses to explore the potential of cities in fostering productivity growth. The Habitat II Agenda of 1996 recognized that urban economies are a prerequisite for improved living conditions and sustained national development. Whether and to what degree economic growth will be sustained over the next decades will therefore depend greatly on the increase of productivity, more specifically, urban productivity. Identifying challenges and opportunities of cities can therefore inform urban agendas for sustained growth in the future.
6.5.1 Future Challenges
The pace of urbanization combined with a lack of institutional capacity presents a major challenge for cities in the developing world. As fiscal powers continue to concentrate at the national level, local governments lack the resources to manage and accommodate the growth of cities. Lagos exemplifies this challenge. Estimates suggest that 2,000 new people arrive in the city daily; it is expected to double in size by 2031 (Obioma 2013). How can a city possibly cope with such a population increase? This challenge manifests itself particularly in increasing demand for infrastructure and access to basic services, including public transportation, water, sanitation, electricity, and access to health care and education. Yet, if urban growth continues to be unplanned and underfinanced, informal settlements will continue to proliferate and overcrowding will become worse, which could lead to the creation and spread of new and old diseases.
Cities in upper-income countries face major challenges regarding their infrastructure, too, as they find infrastructure aging and in desperate need of repair. Especially in large and growing cities, existing systems built in the early phases of industrialization are coming under increasing strain. Insufficient maintenance and expansion efforts limit the transport possibilities within cities, affecting productivity and growth. In the case of New York City, estimates suggest that approximately $47 billion is needed over the next five years to bring the city’s aging infrastructure to a state of good repair (Forman Reference Forman2014). The neglect of public infrastructure will pose a financial and logistical challenge to the city and its capacity for future growth.
Second, adapting to the changing patterns of demographics will present a growing challenge for cities everywhere. Low fertility rates and a declining and aging population pose a particular challenge to cities in Europe and Northeast Asia (see also Chapter 5). This demographic shift places a major burden on the public welfare system and decreases the likelihood of productivity growth; it will further increase the stress on public infrastructure services, too. Shrinking cities negatively affect economic growth, as vacant buildings reduce the capital value of real estate and create a diminishing tax base; financing public sector services, such as schools and hospitals, requires a strong tax base.
Cities in developing countries face demographic challenges, too, yet they are very different in kind than the cities in the developed world. In the developing world, the very young will constitute the majority of the population living in cities. In Uganda, for example, close to 50 percent of the national population is currently below the age of 14, and a mere 5 percent of the population is older than 55 (Indexmundi 2017). If these young people are not successfully absorbed into the labor market, pathological urbanization processes are unlikely to contribute to sustained urban productivity growth, but are likely to exacerbate urban poverty, social and political instability, and emigration of the highly skilled members of the labor force.
This brings us to the next challenge: changing migration patterns. An increasing number of people are fleeing conflict, economic stresses, and climate change hazards in their home countries, and are seeking new homes in cities within developed countries. Strict labor protection laws in the recipient countries often prevent migrants from working in the formal sector, who find themselves either working in activities in the informal sector or as recipients of public assistance programs. If not accounted for, a large influx of migrants increases local pressures on land and housing, and can increase the costs of living in cities. Countries that migrants are fleeing from are also left with challenges, including the emigration of members of a highly skilled labor force. This so-called brain drain reduces the potential of local productivity. Overall, when highly skilled migrants are legally constrained from contributing to high-productivity activities in their recipient countries, the global urban productivity frontier is diminished.
Rising inequalities in wages and wealth present another major challenge for the future of urban productivity. High inequality, paired with distorted land and housing prices, results in spatial misallocations of labor away from high-productivity and into low-productivity cities. Inequality disproportionately affects women, minority groups, and lower-income earners, reinforcing differences among classes, genders, and races. While inequality is on the rise in cities of developed countries, inequality levels in cities across Africa, Asia, and Latin America continue to be the highest in the world and are increasing in many cities. If unaddressed, inequality levels could reach new thresholds, reducing the labor productivity potential of a large share of the world’s population.
Finally, cities across the world are encountering increasing pressures from global market economies. Cities that have managed to become one of these “global cities” now find themselves with high productivity levels, yet benefits are often captured by a global elite and seldom trickle down to the local workforce. In particular, those employed in the non-tradable sector experience stagnating wages, resulting in increasing polarization of income and wages. Cities that are not one of the “global players” are confronted with declining industries and emigration of skilled labor.
6.5.2 Opportunities
While pessimists are absorbed by these challenges, leading to predictions of economic slowdown in the foreseeable future, optimists believe in the human capacity to find creative ideas for future adaptation, turning challenges into opportunities for future growth. Nobody can predict the future of urban productivity with perfect accuracy. However, judging from the obstacles ahead, preventing these challenges from turning into crises is increasingly important.
For instance, cities experiencing an aging population could strategically incorporate newly arriving migrants into local labor markets to counter their negative population growth, ensuring sustained future economic growth that, in turn, is required to finance local infrastructure services. Wage-led growth could be an equitable strategy for recovery in economic downturns, as wage growth can support demand via consumption expenditures, and can induce higher-productivity growth. Changes in functional income distribution also have important supply side effects.
Moving towards a green economy could have tangible and considerable effects on productivity and economy growth. UNEP suggests that transitioning to a green economy does not only generate wealth and gains in natural capital, but it also produces a higher rate of GDP growth (UNEP 2011). The structural change from extractive capitalism towards a more sustainable system could create new jobs, especially for vulnerable communities. This requires reeducating and re-skilling the labor force, and must include those outside of the formal economy.
In addition, the role that cities and local governments can play in fostering urban productivity has yet to be realized. A great divergence between cities within the same country can be traced back to effective versus destructive policies at the local level. Yet, effective policy-making at the local level alone cannot overcome the challenges that lie ahead. Aside from enabling national policies, the international level is crucial in and of itself, too. Especially in a globalizing world in which cities are deeply embedded in and affected by global dynamics, international collaboration in addressing future challenges is key. According to Piketty for example, the introduction of a progressive global tax on capital is the only way to address patrimonial capitalism and increasing wealth inequality.
Considering the level of international collaboration needed to implement such an endeavor, the years 2015 and 2016 should be contributing to optimism rather than pessimism. In September 2015, more than 150 world leaders came together to adopt the Sustainable Development Goals; in October of 2016, a series of member states reconvened at the Habitat III conference to envision the future of cities. Still, achieving the necessary levels of structural change in the way our world operates will require more than international, high-level conferences that result in commitments without actions, or agendas that will be rapidly forgotten. Local and national governments must be held accountable for their commitments, their misallocation of public resources, and the maldistribution of increased returns on productivity.
In cities across the world, imbalances of labor markets, increasing costs of housing, and a lack of pro-poor policies are damaging. Astronomical levels of income inequality in cities point to institutional and structural failures in income distribution, which must be addressed to ensure inclusive urbanization. Considering Piketty’s findings on the state of today’s capitalism, a more progressive tax on wealth and a fundamental adjustment for the financial system will be necessary to make today’s economy socially equitable and ecologically sustainable. To reduce inequalities, we need accountable institutions, effective social programs, and strong links between the various levels of government in addition to stable economies and productivity growth.
Perhaps we should depart from using efficiency and productivity as the main metrics for judging the performance of urban areas and urbanization, and reintroduce moral philosophy into the equation, as Hausman and McPhearson (Reference Hausman and McPherson2006) suggest. Extensive public transfers and improvements to fiscal policy fostered better social cohesion in many Latin American countries, reducing poverty and widening access to both public services and opportunities at the national level. These strong national institutions must be recreated at the local level to address growing threats of urban inequality. A higher minimum wage, improved overtime thresholds, strengthening workers’ collective bargaining rights, and stronger employment protection legislation would not only improve the situation of the working poor, it would also help reduce the wage gap between men and women, and between minority and non-minority workers. After all, the values of ethics, liberty, justice, and equality influence the outcomes of economics, and therefore could help economies work more effectively.


 Open access