

In Finland, mortality rates for middle-aged men from CVD were the highest in the world in the late 1960s(Reference Puska, Salonen and Nissinen1). The main objectives of pilot programmes like the North Karelia Project(Reference Puska, Salonen and Nissinen1) and of national policies have been to reduce the extremely high-risk factor levels, blood pressure, smoking and serum cholesterol. At that time, serum total cholesterol was the feasible serum cholesterol marker to be monitored in population studies. In this study serum cholesterol refers to serum total cholesterol.
The Finnish diet has traditionally been high in SFA and low in PUFA. The intake of dietary cholesterol was also markedly high some decades ago. There have been major changes in the Finnish diet during the past 25 years. Consumption of major sources of SFA, such as high-fat milk products and butter fat as butter and in butter–vegetable oil mixtures have decreased considerably, by 86 % and 67 % respectively. Conversely, at the same time the consumption of low-fat milk products (≤ 2·5 % of fat during this period) has increased by 16 % and, more importantly, the fat content of low-fat liquid milks has decreased on average from ∼ 2·5 % to ∼ 1 %. The consumption of skimmed milk has increased six-fold during this period, from 8 kg/year to ∼ 48 kg/year(2, Reference Männistö, Laatikainen and Helakorpi3). The total consumption of vegetable oil-containing margarines has not changed considerably, but the fatty acid profile has changed towards a higher proportion of unsaturated fatty acids. Furthermore, since the early 1980s the annual consumption of vegetables has almost tripled and that of fruit and berries increased by ∼ 20 %.
The use of lipid-lowering medication, and especially the use of more effective drugs like statins, has increased continuously in Finland(4). While in the early 1980s the use of lipid-lowering medication was very low and statins were not yet in use, ∼ 10 % of the population aged 25–74 years reported to using statins in 2007(Reference Peltonen, Harald and Männistö5). The use of medication is, however, naturally higher among older age groups, where it exceeds 30 %, compared to only a few percentage among younger adults.
The aim of this study is to assess to what extent the observed dietary changes and increased use of statins can explain the almost 20 % decline in serum cholesterol level observed from 1982 to 2007.
Subjects and methods
Four cross-sectional population surveys, in 1982, 1992, 2002 and 2007, assessed the levels of several CHD risk factors and health-related parameters, including serum cholesterol and the use of cholesterol-lowering medication, in the provinces of North Karelia, Northen Savo (Kuopio) and Southwestern Finland (Turku-Loimaa). For each survey, a stratified random sample for each area was drawn from the national population register. The samples were stratified by sex and 10-year age group. The age range for the data used in the present study was 25–64 years (Tables 1 and 2).
Table 1 Proportion of subjects according to age groups, study areas and use of lipid-lowering medication and boiled coffee in Finnish surveys by study year and gender

NA, not applicable.
*This figure shows the use of boiled coffee in the 1987 study, while no data were available in 1982 (%)Reference Pietinen, Aro and Tuomilehto25.
Table 2 Average age, serum cholesterol and dietary variables of the subjects in Finnish surveys by study year and gender
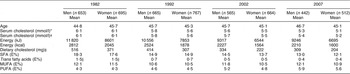
*Raw data of all, including subjects with cholesterol medication.
†The estimated effect of cholesterol medication is taken into account.
‡19 % was added to the dietary cholesterol intake in 2002 and 2007 as an estimated measurement error due to a systematic change in analysed values caused by changes in laboratory methods(Reference Valsta, Lemström and Ovaskainen12).
§Estimated intake of trans fatty acids(Reference Precht and Molkentin23).
Dietary intake
The dietary intakes have been monitored in the FINDIET surveys that have included randomly ∼ 30 % of those participants invited to take part in the National FINRISK studies. Food consumption data were collected using estimated 3 d food records in 1982(Reference Uusitalo, Pietinen and Leino6) and in 1992(Reference Kleemola, Virtanen and Pietinen7). In the FINDIET 2002 and 2007 surveys, the food consumption data were collected using a computer-assisted 48 h dietary recall method to ensure as high a participation rate as possible(Reference Männistö, Ovaskainen and Valsta8, Reference Paturi, Tapanainen and Reinivuo9). Portion size estimation was carried out in 1982 using household measures and known portion sizes, and since 1992, using a validated picture booklet(Reference Pietinen, Hartman and Haapa10), which was expanded and validated for the 2002 and 2007 surveys(Reference Ovaskainen, Paturi and Reinivuo11). The participation rates in the surveys included in the present study have ranged from 60 % to 66 %.
Dietary intakes were calculated in 1982 by an in-house dietary intake calculation software and food composition database of the Department of Nutrition, University of Helsinki; in 1992 with the in-house developed Setti-N calculation software and food composition database; and, since 2002, with the Finessi calculation software and the national food composition database Fineli®(Reference Uusitalo, Pietinen and Leino6–Reference Paturi, Tapanainen and Reinivuo9) (National Institute for Health and Welfare, Helsinki, Finland).
The Fineli® dietary cholesterol database was updated with new values for the 2002 dietary survey. In this analysis, average dietary cholesterol intake for 2002 and 2007 was increased by 19 % in the updated database to account for an estimated measurement error due to a systematic change in analysed values caused by changes in laboratory methods of measuring dietary cholesterol(Reference Valsta, Lemström and Ovaskainen12).
Predicted changes of serum cholesterol were calculated by the Keys’ equation(Reference Keys, Anderson and Grande13):
where SFA ad PUFA are percentages of total energy provided by saturated and polyunsaturated fatty acids, respectively, and Z 2 is expressed as mg dietary cholesterol/4184 kJ (1000 kcal). The result of the equation was finally divided by 38·664 to convert to mmol/l. The effect of trans fatty acids (TFA) was also taken into account in the calculations by assuming the effect of TFA on total cholesterol levels to be similar to SFA, as shown by a recent meta-analysis of thirteen dietary interventions(Reference Mozaffarian and Clarke14).
The effect of cholesterol-lowering drugs was taken into account in two different ways. First, the users of cholesterol lowering drugs were excluded before running the analyses. Second, we estimated the effect of cholesterol-lowering drugs to be 25 % for the drug users and thus calculated the total medication effect. A question concerning the use of cholesterol-lowering drugs has been included in the study questionnaire since 1992. The data were age-standardized by study year to the Finnish population in 2001 for the analyses.
Analyses were also performed excluding energy under-reporters, but the results did not change considerably. Under-reporters were defined by the Goldberg cut-off for energy intake, where energy intake was less than calculated basal metabolic rate. The cut-off points were 1·04 for 3 d estimated food records in the years 1982 and 1992 and 1·0 for the 48 h recalls in the years 2002 and 2007(Reference Goldberg, Black and Jebb15).
Laboratory analyses
In the National FINRISK studies the total cholesterol analyses have been carried out between 1982 and 2002 from fresh serum samples and in 2007 from frozen serum samples in the same laboratory at the National Institute for Health and Welfare. The history of changes and systematic errors during decades for the cholesterol methods were described previously until 2002(Reference Sundvall, Leiviskä and Alfthan16). In 2007, total cholesterol was measured enzymatically (Abbott Laboratories, Abbott Park, IL, USA) using Architect c8000 analyzer (Abbott Laboratories). According to the Lipid Standardization Program organized by CDC (Atlanta, GA, USA), the systematic error (bias; mean and sd) was 1.0 % (sd 0.5) for cholesterol during the course of the FINRISK study comprising 4 months in 2007. The bias has been within the ± 3 % bias limits during the FINRISK population survey between 1982 and 2007(Reference Sundvall, Leiviskä and Alfthan16).
Lipid-lowering therapies
The effects of different lipid-lowering therapies vary quite remarkably. In contrast, the treatment effects received by statins are reasonably constant, varying between 20 % and 40 % reduction in total cholesterol(Reference Jones, Davidson and Stein17). However, these results are from clinical trials in which the compliance rate with treatment is usually better than in the general patient population(18). Thus, in these analyses, a 25 % reduction of total cholesterol was assumed among participants reporting using lipid-lowering medication.
Results
The subjects were reasonably evenly distributed into 10-year age groups, with the group of subjects aged 55–64 years old tending to be slightly larger than that of those aged 25–34 years old. This was most clear among men in the 2007 survey with 16 % belonging to the youngest age group and 30 % to the oldest age group. All study areas were represented by over 30 % of the subjects. The main characteristics of the population of the present study are presented in the Table 1.
During the past 25 years the percentage of energy (E%) from SFA intake has decreased from 18 to 13 among men and to 12 among women. At the same time the intake of PUFA has increased from 4·3 E% to 5·9 E% among men and to 5·6 E% among women. The TFA intake has decreased on average from ∼ 1·5 E% to 0·4 E%. In the whole study sample, serum cholesterol levels were on average 6·1 mmol/l in 1982 and had decreased to 5·3 mmol/l among men and to 5·1 mmol/l among women by the year 2007 (Table 2).
Serum cholesterol levels have decreased by 0·76 mmol/l in men and by 0·92 mmol/l in women not using lipid-lowering medication. Total dietary effect (estimated by the Keys’ equation + TFA change) accounts for a −0·55 mmol/l decline in serum cholesterol (72 %) among men and −0·58 mmol/l (63 %) among women. Intake of SFA is the main contributor, explaining 47 % of serum cholesterol decline in men and 41 % in women. The share of TFA of the total dietary effect is, according to this estimate, 13 % among men and 14 % among women. Dietary cholesterol accounts only for 9 % of the change in both genders. About half of the changes, and in the case of TFA over two-thirds of them, occurred during the first 10 years after 1982 (Table 3, Fig. 1).
Table 3 Contribution of dietary fatty acid and cholesterol changes to the estimated serum cholesterol (mmol/l) and the observed change by study year and gender (n 4761Footnote *)
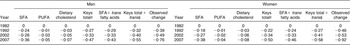
* The users of cholesterol medication excluded.
† Estimated change caused by changes of SFA, PUFA and dietary cholesterol, see the ‘Subjects and methods’ section.
‡ Keys total + trans: Dietary effect is the estimated change caused by changes of SFA, trans fatty acids, PUFA and dietary cholesterol (for more details, see ‘Subjects and methods’ section).

Fig. 1 Observed and predicted decline in serum cholesterol based on dietary changes in all subjects without lipid-lowering medication (n 4761; ○, PUFA; ●, dietary cholesterol; ▵, SFA; ▴, PUFA + dietary cholesterol + SFA; □, PUFA + dietary cholesterol + SFA + trans fatty acids; ▪, observed serum cholesterol)
When all subjects, including those using lipid-lowering medication, are considered, serum cholesterol decline has been 0·86 mmol/l in men and 0·97 mmol/l in women during the past 25 years (Table 4, Fig. 2). The joint effect of dietary factors and medication is estimated to account for −0·70 mmol/l (81 %) in men and −0·65 mmol/l (67 %) in women. Changes in dietary fats and cholesterol intake alone explain 65 % of the change in men and 60 % of the change in women among this group. The impact of cholesterol-lowering medication was found to be 16 % among men and 7 % among women (Table 4, Fig. 2).
Table 4 Contribution of lipid-lowering medication and dietary effect to the estimated serum cholesterol (mmol/l) and the observed change by study year and gender (n 4963)

*Dietary effect: Keys total + trans is the estimated change caused by changes of SFA, trans fatty acids, PUFA and dietary cholesterol (for more details, see ‘Subjects and methods’ section).

Fig. 2 Observed and predicted decline in serum cholesterol based on use of lipid-lowering medication and dietary changes in all subjects (n 4963; ○, medication effect; ●, dietary effect; ▵, medication + dietary effect; ▴, observed serum cholesterol)
Discussion
The present study, carried out using large population surveys taken place during the past 25 years in Finland, is an example of the powerful effects that lifestyle changes, especially changes in fat quality, can have in serum cholesterol lowering at population level. The effect of cholesterol-lowering medication was shown to be clearly less significant.
The present study serves as an example of the value of a long history of collecting dietary and risk factor monitoring data that enable estimations of the kind shown in the present study. In Finland, similar estimations have been possible in the area of observed and predicted declines in mortality from ischaemic heart disease taking into account the major risk factors such as serum total cholesterol, blood pressure and smoking(Reference Vartiainen, Puska and Pekkanen19) as well as the contribution of effective interventions such as cardiac surgery and medication(Reference Laatikainen, Critchley and Vartiainen20). These studies have shown how the remarkable decreases achieved in the population cholesterol level in Finland have decreased the risk of CHD and mortality. However, although the impact of diet as the main contributor to the observed serum cholesterol decline is evident and established, it had not been possible in these earlier analyses to estimate the real contribution of dietary and treatment changes. The present study is the first to systematically screen for the effects of diet and lipid-lowering medication on serum cholesterol levels in the Finnish population.
The effect of medication on the decline in serum cholesterol at the population level has been reasonably low, at only 0·1 mmol/l since 1982. However, the use of statins among the population aged 25–64 years is still quite modest, particularly among women, although their use has increased at a remarkable pace, especially during the past 15 years. In addition to treatment rates, the effectiveness of the treatment of high cholesterol among women seems to be lower than among men in Finland(Reference Vartiainen, Laatikainen and Strandberg21).
The contributions of fatty acids and dietary cholesterol on the change of serum total cholesterol were taken into account using the well-established serum cholesterol changes-predicting equation by Keys et al (Reference Keys, Anderson and Grande13). In that era, trans fatty acids were not separated in the metabolic studies from MUFA. Since the increasing body of evidence suggests that the effects of trans fatty acids are increasing serum cholesterol levels(Reference Mozaffarian, Aro and Willett22), it was decided in the present study to add the effect of TFA into the analysis. This resulted in an additional estimated decline in serum cholesterol of 0·07–0·08 mmol/l in men and women, but did not totally explain the gap between the predicted and observed serum cholesterol values. The TFA intakes were not measured in the early 1980s and were therefore estimated from other types of data, referring to values derived mainly from Germany(Reference Precht and Molkentin23). This estimation of TFA intake to be roughly 1·5 E% in 1982 is thus somewhat uncertain. There is, however, no evidence showing that the intake of TFA would have been higher in Finland at that time even though there were higher intakes in some other European countries(Reference Hulshof, van Erp-Baart and Anttolainen24). In some countries (The Netherlands, Norway) where margarine consumption was high and hydrogenated vegetable or fish oils were used, high intakes of TFA were found in the 1980s. In Finland, it is apparent that the changes between 1982 and 1992 in TFA intake reflected primarily, changes in milk fat intake, and thereafter mainly the effect of removing TFA from margarines in the mid-1990s. This is mainly because the TFA intake in the Finnish diet has, throughout these decades, been largely based on a high proportion of milk and beef fats.
Another dietary factor affecting the serum cholesterol levels has been shown to be the drinking of boiled coffee. It was shown that in 1987 the consumption of boiled coffee accounted for 0·3–0·4 mmol/l of the serum cholesterol values in the late 1980s(Reference Pietinen, Aro and Tuomilehto25). There was no data available on the proportion of people drinking of boiled coffee in the 1982. However, in 1987, ∼ 24 % of men and 23 % of women drank boiled coffee, whereas in 1992 it was only 12 % and 10 %, respectively. Since 1992 the proportion of boiled coffee consumers has further decreased from an average of 11 % to 3 % of the study population.
An increased intake of plant sterols inhibits the absorption of dietary cholesterol and hence lowers the serum cholesterol levels(Reference Miettinen and Gylling26). The main sources of plant sterols in the Finnish diet have been shown to be cereal products, vegetable-fat spreads and vegetable oils as well as vegetables themselves(Reference Valsta, Lemström and Ovaskainen12). Although the consumption of cereal products have decreased, we have witnessed an increase in consumption of plant sterol-containing oils and fats, and a steep increase in the consumption of vegetables during the past decades(2). With these developments the total plant sterol intake from natural foods, excluding consumption of special plant sterol/stanol-enriched margarines, has been shown to have increased from ∼ 220–230 mg/d to ∼ 300 mg/d among Finnish men(Reference Valsta, Lemström and Ovaskainen12, Reference De Vries, Jansen and Kromhout27). It has been shown that ∼ 10 % of that increase may be accounted for by methodological developments in the plant sterol analysis(Reference Valsta, Lemström and Ovaskainen12). The increase of plant sterols from natural foods may have slightly affected the serum cholesterol levels throughout the duration of this analysis, but the effect may be small and does not explain a large part of the difference between the estimated and observed serum cholesterol levels. Since margarines enriched with plant sterols or stanols that have been on the market, i.e. since the 1990s, a 10–15 % decrease in serum cholesterol levels has been achieved(Reference Miettinen, Puska and Gylling28). The increased consumption of plant sterol- and stanol-containing margarines may have had an additional effect on the observed cholesterol levels during the past decade(Reference Simojoki, Luoto and Uutela29). This effect would be mainly seen in the middle-aged and elderly subjects.
In the present study, the observed and predicted decline in serum cholesterol levels were closely similar throughout the time period among men, but diverged notably between 2002 and 2007 among women. One possible explanation for this gap could be the lengthened periods of use of hormone replacement therapies (HRT) in women(Reference Pettee, Kriska and Conroy30). In 1997, 28 % of Finnish women used HRT and in 2007, it was 23 %(Reference Peltonen, Harald and Männistö5). As HRT has been shown mainly to decrease serum cholesterol levels, and discontinuing HRT to increase them(Reference Pettee, Kriska and Conroy30), the observed developments in treatment rates cannot explain the gap between the predicted and observed serum cholesterol levels found in our study.
In conclusion, the present study illustrates that the exceptionally large decrease in serum cholesterol levels in Finland over the past 25 years is mainly a result of dietary changes, especially changes in fat quality. The effect of lipid-lowering medication is less significant, especially in the working-age population.
Acknowledgements
The work of the National FINRISK study and FINDIET survey teams in collecting the data for the present study is gratefully acknowledged.


