





When this article was published in High Power Laser Science and Engineering it contained a display error in Figure 5. The correct version of Figure 5 can be found below.
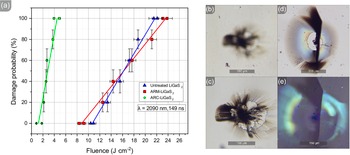
LIDT test with 2.09 μm, 149 ns pulses: (a) LIDT measurement data; (b) typical damage site of the ARM, focused on the surface, in which there is no damage at the surface; (c) typical damage site of the ARM, focused on the volumetric damage, in the same spot as for (b); (d) typical catastrophic damage site of the ARC; (e) typical catastrophic damage site of the ARC, with polarization contrast applied.

Figure 5 Long description
The graphic is divided into five panels labeled a through e.
Panel a is a line graph showing Damage probability in percent on the y-axis from 0 to 100, and Fluence in Joules per centimeter-squared on the x-axis from 0 to 28. Three data series are plotted with linear fits:
- A R C-Li G a S sub 2 represented by green circles shows a steep linear increase from 1 to 5 Joules per centimeter-squared.
- A R M-Li G a S sub 2 represented by red squares shows a linear increase from 8 to 24 Joules per centimeter-squared.
- Untreated Li G a S sub 2 represented by blue triangles shows a linear increase from 10 to 22 Joules per centimeter-squared.
A text box indicates lambda equals 2090 nanometers and 149 nanoseconds.
Panel b is a microscopic photo of an A R M surface showing a dark, blurred subsurface damage spot with a 200 micrometer scale bar.
Panel c is a microscopic photo of the same spot as panel b but focused on the volumetric damage, revealing a sharp, dark fracture network with radial cracks and a 150 micrometer scale bar.
Panel d is a microscopic photo of an A R C catastrophic damage site showing a large circular crater with a dark vertical fracture through the center and a 200 micrometer scale bar.
Panel e is a microscopic photo of the same site as panel d using polarization contrast, highlighting iridescent stress patterns around the central fracture with a 150 micrometer scale bar.
The publisher apologises for this error.

 Open access

