
5.1 Introduction
Secondary and tertiary care (STC) as discussed in this chapter are services provided in a facility such as a hospital or an ambulatory care setting by a specialist that require more specialised knowledge, skill or equipment than can be provided at the primary care level. The Alma Ata Conference on Primary Health Care (PHC) clearly defined the role of STC within PHC:
[T]he support of other levels of the health systems is necessary to ensure that people enjoy the benefits of valid and useful technical knowledge that is too complex or costly to apply routinely through primary health care. The rest of the health system, therefore, has to be organised in such a way as to provide support for primary health care.
Mahler, the Director-General of the World Health Organization (WHO) from 1973 to 1988, furthered the concept, for example, by stating in 1980 that ‘people in need must have access to skilled surgical care at first-line referral hospitals’ (Reference MahlerMahler, 1980). The evolution of STC in the Malaysian health system demonstrates the challenges and achievements in implementing these concepts.
This chapter discusses how access to and quality of STC improved progressively in Malaysia during the 60 years since independence and how the system is currently grappling with the challenge of providing affordable, integrated, seamless care. It discusses the dynamic interactions of various components of the health system and their influence on STC and the influence of the larger Malaysian ecosystem, such as political, socio-economic, demographic and population behaviour.
The appendices provide details of the analysis that underpins the chapter. Appendix I illustrates the application of systems thinking, while Appendix II provides illustrative details of the interactions between components of the health system that are defined in the WHO health system ‘building blocks’ (see Chapter 1) and also the interaction between the health system and the larger ecosystem.
5.2 The Early Phase (1960s and 1970s): Increasing Access and Reducing Disparity
At independence, Malaysia inherited secondary care services consisting of 10 major hospitals and 56 district hospitals concentrated mainly in urban centres in the West Coast states of Peninsular Malaysia (Box 5.1). Many of them were dilapidated (International Bank for Reconstruction and Development, 1955). Doctors and nurses were in short supply, and specialists were almost entirely expatriate.
5.2.1 Socio-demographic Pressures and Political Forces
After independence, political and community forces dictated development. Policies aimed to improve health and social services and reduce disparity between regions and ethnic groups (Prime Minister’s Department, 1961) (see Chapter 3). For secondary care, these policies translated into measures to increase access to secondary care by upgrading existing hospitals where necessary and providing hospitals in districts that had none. Each hospital provided inpatient as well as outpatient (ambulatory) care. Together with rural health centres and dispensaries that also provided outpatient services (see Chapter 4), outpatient services provided first-contact curative care. A report by the then Director-General of Health credits the ‘widespread establishment of outpatient departments and referrals to hospitals’ with ‘provoking awareness of the rural people of the benefits of modern medical treatment’ (Reference IsmailIsmail, 1975).
Pre-independence, specific demands led to the establishment of hospitals.
The colonial government established hospitals for the healthcare of:
◦ Colonial officers and their families
◦ Government employees and their families
Chinese charitable foundations established hospitals that provided a combination of western and traditional Chinese medicine (TCM), basically for the private sector Chinese employees.
Corporate owners of rubber estates provided small estate clinics with a few beds for their employees, mainly Indians.
Christian missionaries established a few not-for-profit hospitals, mainly as part of their charitable work.
The respective target populations resided mostly in the urban centres in the West Coast states of Peninsular Malaysia. The largely rural Malay population had limited access to secondary care services (Reference Tate, Khoo and GabrielTate et al., 2005; Tung Shin Hospital, n.d.).
5.2.2 Hospital Services Supported PHC
Even before Mahler’s historic 1980 address, the Malaysian district hospitals were first-line referral facilities. They provided support for PHC through secondary care for patients referred from the national disease control programmes, such as those for malaria, tuberculosis (TB) and leprosy (see Chapter 6), and the rural health services, particularly for pregnancy, childbirth and illnesses of childhood (see Chapter 4). The staff of these hospitals were mainly nurses, midwives, medical assistants and junior doctors who were able to address emergencies, minor surgery, childbirth and its simpler complications, and the management of illnesses that required hospitalisation. However, the hospitals had neither the staff and the operating theatres for surgery nor the laboratory and imaging facilities for more complex secondary care. However, the district hospitals did have ambulances that provided free transport links on the one hand between district hospitals and state-level hospitals that had more sophisticated facilities and on the other hand between hospitals and health centres that provided PHC. These ambulances ferried patients, staff and laboratory samples and were crucial in providing the referral link between primary and secondary levels of care.
State-level hospitals provided, at a minimum, specialist care in internal medicine, surgery, obstetrics and gynaecology, paediatrics, and anaesthesia, with appropriate support services (Reference IsmailIsmail, 1975). During this period, several existing, dilapidated state-level hospitals were re-built or refurbished. The government highly subsidised medical care in the public sector hospitals and therefore imposed only a nominal charge on patients at the point of care (see Chapter 9).
The development of STC required the production of a sufficient workforce of doctors and nurses. However, the number of doctors produced was small, as there was only one local medical school (later three) (see Chapter 8). Furthermore, there was no local facility for postgraduate specialist training for Malaysian doctors, and very small numbers were sent abroad annually for training, mainly to the United Kingdom. On their return, they slowly replaced the expatriate specialists and provided specialist services and leadership for the different clinical disciplines. However, the rapid production of nurses and assistant nurses (see Chapter 8) facilitated district hospitals in providing selected forms of secondary care services, and this, to some extent, compensated for the much slower production of doctors. Working alone or with doctors, medical assistants provided secondary care for communicable diseases and other common ailments that did not require specialist care. Nurses who had an additional year of midwifery training became nurse-midwives and, assisted by trained midwives, managed uncomplicated childbirth in all hospitals. The number of district hospitals increased, as did hospital beds for TB, leprosy and childbirth. The hospitals also provided support for the rapidly developing primary health care services (Box 5.2).
The hospitals provided support for the evolution of PHC. The key features were:
Ambulances that provided free transport for patients, staff and laboratory samples between front-line PHC facilities, first-line hospitals and higher-level hospitals.
Doctors (particularly obstetricians and paediatricians) who worked in state-level hospitals participated in training nurses and medical assistants who subsequently served in district hospitals or PHC facilities.
This helped establish rapport and trust between staff at PHC and STC level, thereby fostering timely recognition and referrals from peripheral facilities. Such referrals were given priority in the larger hospitals, thereby enhancing the credibility of the staff in the peripheral facilities.
During the subsequent three decades, advances in medical products and the success of the disease control programmes enabled hospitals to reduce the beds provided for acute communicable diseases (Figure 5.1). Also, improved access to STC for pregnant women contributed to the reduction in maternal deaths and sustained the demand for institutional childbirth. Box 5.3 provides illustrative examples.

Figure 5.1 Evolving profile of types of hospitals, number of TB and leprosy beds, and childbirth in hospitals.
Hospital care had a major role in reducing incidence of TB (Reference Suleiman and JegathesanSuleiman & Jegathesan, n.d.).
In 1960, beds reserved for TB patients accounted for 25% of hospital beds.
The aim of hospital management was to treat patients to render them non-infective before sending them back into the community.
The advent of effective drugs shortened inpatient stay and enabled a reduction in TB beds by 1996.
Maternal deaths declined through an effective and credible system that provided safe childbirth care with timely access to STC (Reference Pathmanathan, Liljestrand, Martins, Rajapaksa, Lissner and de SilvaPathmanathan et al., 2003).
Essential obstetric care: By 1976, overwhelming demand for childbirth in hospitals resulted in maternity units having extremely high bed occupancy and turnover rates (Institute for Public Health, 1983).
Emergency and comprehensive obstetric care: Ambulances from rural health centres and district hospitals provided prompt transport for the referral of patients with obstetric complications to hospitals with higher levels of care that included specialist care from obstetricians.1
The rapid increase in the utilisation of hospitals throughout the country demonstrated the rising demand for STC (Figure 5.2).

Although the availability of hospital services increased, they barely coped with the rate of population increase. Fifteen years after independence, the disparity in the availability of STC between the more urbanised West Coast states in the Peninsula and the less developed East Coast states2 remained evident (Table 5.1).
| Acute beds (per 1,000 population) | Admissions (per 1,000 population) | |
|---|---|---|
| West Coast states | 2.16 | 37.25 |
| East Coast states | 1.69 | 22.50 |
| Peninsular Malaysia | 2.08 | 34.58 |
| East Malaysia | 1.94 | n.a. |
| Malaysia | 2.05 | n.a. |
5.2.3 Demand for STC Outstripped Supply
Financial and implementation capacity constraints slowed the progress of building new facilities. In addition, the limited production of doctors led to numerous vacancies in medical officer positions. Meanwhile, societal perceptions were changing. Increased access to hospitals led to a rapid increase in demand for STC. By the mid-1970s, public sector hospitals, particularly the larger ones, faced overwhelming demand, leading to overcrowding. A study of the utilisation of public sector hospitals (Institute for Public Health, 1983) delved into the phenomenon. It found that about 50% of medical officer posts were vacant, although nursing posts had fewer vacancies. Medical staff were unable to cope with the workload. About 25% of patients bypassed smaller district-level hospitals to seek care in larger hospitals. The commonest reason reported was the lack of surgical services. Patients were also dissatisfied with ward conditions (Public Health Institute, 1983). Many doctors, frustrated with conditions in the public sector, resigned to become general practitioners in the private sector. This contributed to the continued shortage of doctors in public sector hospitals (see Chapter 8 re. brain drain). Moreover, it exacerbated the difficulty of improving access in the less-developed states in the country.
5.2.4 STC in the Private Sector Began to Grow
In the meantime, the number of local doctors with specialist qualifications increased steadily, and they served under high pressure in the overcrowded larger hospitals. Recognising the strong demand for more comprehensive STC and exhausted by the high pressure of work, several of them resigned from the public sector during the late 1970s and established four private for-profit hospitals in the largest towns on the West Coast. These hospitals began the trend for the growth in private sector STC in response to demands by the more affluent section of the community for more personalised care and better ‘hotel-type’ facilities. By 1980, 4.3% of all hospital beds were in private hospitals.
The few established non-governmental organisation (NGO) hospitals that predominantly served the ethnic Chinese population had close links with Chinese traditional practitioners and provided some traditional Chinese medicine (TCM) services.
Supplementary Table 5-a in Appendix II summarises the interaction between different elements in the health system and the larger ecosystem as they influenced the evolution of STC during the first post-independence phase.
5.3 The Second Phase (1980s and 1990s): Drive for Better-Quality Access
5.3.1 Political, Socio-economic and Professional Influences
During the 1980s and 1990s, the population became increasingly urban, and literacy rates and socio-economic status rose, as did the population’s expectations of healthcare. Many communicable diseases decreased, while non-communicable diseases (NCDs) increased. A dual thrust in health policy governed the development of STC. The first was the continued struggle to improve equitable access to STC. The second was to respond to the rising expectations of the community and of professional bodies to provide higher-quality care, including care that was:
a. clinically more sophisticated, with more equitable access to surgical interventions, and
b. better quality in terms of
◦ effective outcomes,
◦ higher client satisfaction, and
◦ improved use of resources.
5.3.2 More Sophisticated Clinical Care
Doctors with postgraduate training in specific disciplines had the higher level of competency required to provide comprehensive STC. Specialist training in local universities for doctors began during the 1980s (see Chapter 8) and resulted in the availability of larger numbers of doctors with specialist qualifications and the establishment of a wider range of specialised units in public sector hospitals. This, in turn, triggered the upgrade of laboratory and imaging services and the training of allied health personnel, such as medical laboratory technologists and radiographers, for these services (see Chapter 8). To promote equitable access to specialised medical services, the Ministry of Health (MoH) adopted a regional development approach. State-level and larger district hospitals were categorised into three levels, with Level 1 consisting of five basic medical specialities, Level 2 having six additional specialities and Level 3 consisting of further specialisation within narrow fields of the more general disciplines (such as cardiologists and neurologists within the broader field of internal medicine). Every region in the country had one hospital of Level 3 status and at least one with Level 2 status. The availability of speciality services increased from 12 units per million people in 1970 to 16 units in 1997 (Table 5.2).
| 1970 | 1980 | 1997 | |
|---|---|---|---|
| Peninsular Malaysia | 121 | 220 | 283 |
| Sabah | 4 | 15 | 31 |
| Sarawak | 5 | 25 | 38 |
| All | 130 | 260 | 352 |
| Units1 per million people | 12.1 | 18.9 | 16.2 |
1 One unit was equivalent to one or more specialists in a specialist unit or department.
With the growing numbers and types of specialist qualifications from various universities and countries, professional bodies and the MoH were concerned about safeguarding the standards of competence to preserve the quality of care. This triggered governance actions in the form of the establishment of procedures for credentialing and certifying specialists (see Chapter 8).
The increasing numbers and types of sophisticated clinical services required better laboratory and imaging services. For example, Table 5.3 illustrates that the upgrading of laboratory services in MoH hospitals was linked to the type of specialist services available. The upgraded laboratory services required the appropriate allied health personnel with higher levels of qualifications. Appropriate training programmes and deployment strategies came into place.
Table 5.3 Laboratory services increased in sophistication in tandem with the availability of specialist clinicians
| Type of facility | Laboratory service |
|---|---|
| No specialist doctor | Medical laboratory technologist (MLT) |
| Specialist doctor but no pathologist | Biochemist OR microbiologist plus MLT |
| Pathologist | Biochemist AND microbiologist plus MLT |
| National referral level (IMR) | All plus sub-speciality pathology services |
| IMR and universities2 | Very sophisticated tests and research |
The developments required higher investment and maintenance costs. The rising gross domestic product (GDP) facilitated the financing of these investments.
Figure 5.3 provides a summary of the dynamic interactions in the health system as it moved towards providing more sophisticated clinical services.

5.3.3 Private Sector
Meanwhile, there was high demand for STC in the private sector, leading to the rapid expansion of hospitals (Table 5.4). In 1997, 70% of private hospitals were small, with less than 20 beds, and several were in buildings not suited for providing quality care (Reference Suleiman and JegathesanSuleiman & Jegathesan, n.d.). Concerned about quality standards, the government enacted legislation (Government of Malaysia, 1998) with stringent standards for physical structure and with corporate and clinical governance, including procedures for monitoring quality (see Chapter 12). Enforcement began in 2006.
| Year | No. of private hospitals | No. of private hospital beds | Private as % of all hospitals | Private as % of all admissions |
|---|---|---|---|---|
| 1980 | 50 | 1,171 | 4.3 | n.a. |
| 1985 | 133 | 3,559 | 11.5 | 12 |
| 1990 | 197 | 4,675 | 14.1 | 14 |
| 1996 | 215 | 7,417 | 20.4 | 17.2 |
n.a. – not available
In parallel, there was high demand for care by the few specialist doctors who had established larger private hospitals since the mid-1970s. Recognising a good business opportunity, corporate entities moved in and bought up the larger hospitals. Corporate ownership led to a change in philosophy. While catering for the demands of the well-to-do who could afford private sector fees, these hospitals now also paid serious attention to profit margins. Their expansion and development plans reflected this change (Reference Suleiman and JegathesanSuleiman & Jegathesan, n.d.). One evident feature was the trend towards the rapid proliferation of higher-cost technology in the private sector as compared to the public sector (Table 5.5). These hospitals were concentrated in the wealthier regions of the country, thereby challenging the objective of equitable development.
| MoH hospitals | Private hospitals | |||||
|---|---|---|---|---|---|---|
| CT scan1 | Mammogram2 | MRI3 | CT scan1 | Mammogram2 | MRI3 | |
| Nine West Coast states | 11 | 10 | 2 | 42 | 32 | 11 |
| Three East Coast states | 3 | 3 | 0 | 2 | 1 | 0 |
| Sabah and Sarawak | 3 | 2 | 0 | 4 | 3 | 2 |
1 Computed tomography (CT): The MoH had one unit per state except for the capital city, Kuala Lumpur, which had four units. Private hospitals had 17 units in Kuala Lumpur and neighbouring Selangor and 10 units in Penang.
2 Mammogram: The MoH had one unit per state except Kuala Lumpur, which had three units. Private hospitals had nine units in Kuala Lumpur, four units in Selangor and eight units in Penang.
3 MRI – magnetic resonance imaging.
The MoH initiated health technology assessment (HTA) as a means of rationalising the acquisition of newer technology. The output of the HTA unit provided input into the formulation of policies in the public sector and provided the basis for the development of clinical practice guidelines (CPGs), purchasing decisions, drug regulation and health-related advertisements (Reference Roza, Junainah, Izzuna, Ku Nurhasni, Mohd Yusof and NoormahRoza et al., 2019). However, there is limited information on whether the private sector uses the HTA information for guiding the development of technology.
The development of the private health sector in Malaysia is an example of how solutions to health system challenges can create long-term, irreversible changes to the system. Rising demand for more sophisticated medical care in the 1960s and 1970s led to a gap in public hospital capacity as limits in financial and human resources caused capacity to lag behind demand. This demand continued to increase in the 1980s and 1990s, so the rise and rapid expansion of private sector hospitals was welcomed by the public sector. While the private sector alleviates the burden of the public sector in some ways, it has become apparent that it draws medical practitioners, especially specialists, away from the public sector (Figure 5.4). The public sector thus has had to invest further resources and change policies to retain medical practitioners to keep up with healthcare demands.

Figure 5.4 Rising demand for medical care outpaced public hospital resources, creating a gap in public sector capacity (B1). The expansion of private sector hospitals (B2 loop) offered a means of bridging this gap with private sector resources. However, private healthcare has drawn on medical personnel from the public sector, becoming another source of pressure on public sector capacity (R1 loop). This is a well-known system archetype known as ‘shifting the burden’, in which actions taken to address the outcomes of a problem (a gap in hospital capacity) can exacerbate the underlying causes of that problem (public hospital human resources).
Private sector care has become corporatised and supporting structures such as private insurance and medical tourism have been developed, creating a self-sustaining industry. In addition to health workforce challenges, the resulting fragmentation of healthcare providers and financers has created challenging tensions regarding the locus of responsibility for the provision and payment of healthcare.
5.3.4 Quality: Monitoring and Improving Outcomes
In the late 1980s, the government of Malaysia initiated nationwide efforts to improve quality in the public sector. The MoH was one of the agencies that led the way in implementing the national call to action. The National Quality Assurance Programme (QAP) of the MoH spearheaded efforts to instil concern for quality as a culture at all levels of the organisation. It established a system for the explicit measurement of outcomes. This included monitoring performance trends in clinical care, patient satisfaction and better use of resources (physical, time and human resources). Box 5.5 provides illustrative examples.
Approach and Methods
Peer groups in each clinical discipline or hospital management group selected performance indicators.
The MoH collected data on the indicators, analysed and rank-ordered the performance of individual hospitals, and shared the results with all stakeholders.
Outliers were encouraged to analyse the factors contributing to their status and were helped to remedy issues.
Performance trending enabled peer groups to discard or replace indicators periodically to move towards more sensitive and specific monitoring of performance outcomes.
Examples of Results
Improvement in the management of acute myocardial infarction.
Decreases in waiting time to see doctors and decreases in rejection rates for X-rays and laboratory specimens.
Improved client satisfaction with counter services (e.g. pharmacy counters), cleanliness and facilities. For example, a small district hospital (Kuala Krai) in one of the more disadvantaged states won a national award for improving the quality of public services in 1995.
The thrust for improving clinical outcomes (Figure 5.5) provided a fillip for strengthening clinical governance measures such as the development and use of Clinical Practice Guidelines (CGPs) and for stronger implementation of existing initiatives such as clinical audits and mortality reviews. It also contributed to improving the quality of data for health information (see Chapter 10), particularly in terms of accuracy of International Classification of Diseases (ICD) coding and timeliness of data, as healthcare providers became aware that this had a critical impact on the accuracy of indicators that measured performance.

Figure 5.5 Dynamics of improving clinical outcomes and establishing a quality culture at every level.
The drive for improved outcomes of clinical care led to the establishment of disease registries for selected conditions such as end-stage renal disease (ESRD) and cancer, which are managed largely at the secondary care level. The registries are meant to provide information on disease conditions as well as treatment effectiveness and cost. The National Renal Registry, established in 1993, was a trailblazer, and it monitors trends in the quality, cost and effectiveness of different modalities of care for ESRD (Reference Lim and LimLim & Lim, 2004). It provided the data for a cost analysis that enabled the move to public–private partnership in the provision of dialysis (Reference Lim, Lim, Wong, Ahmad, Singam and MoradLim et al., 1999).
The thrust for better outcomes in patient satisfaction and use of resources (Figure 5.6) stimulated a need for increased managerial competence at all levels of the MoH system (see Chapter 8). It also facilitated the growth of team approaches and the use of health systems research as a management and problem-solving tool. Hospitals won national ‘quality awards’ for improving client satisfaction and reducing waiting times (Reference Suleiman and JegathesanSuleiman & Jegathesan, n.d.). Budgeting systems were modified to provide greater authority to hospital managers to manage funds more flexibly to respond to local requirements (see Chapter 9). However, as the MoH was part of a larger public sector system, there were constraints. The degree of flexibility that could be decentralised was limited due to financial rules and regulations (see Chapter 9). Similarly, as all MoH staff are part of the federal civil service (see Chapter 8), constraints arose. For example, nurses with training and credentials in one discipline had to move to another discipline to further their careers (Institute of Health Management, 2006).

Figure 5.6 Dynamics of improving resource utilisation and client satisfaction.
The thrust for improved resource management extended to strategies for improving the maintenance of building structures and biomedical equipment in public sector hospitals. New posts were created for hospital-based engineers, and maintenance services were outsourced to private contractors, with hospitals retaining oversight of the contractors’ performance (see Chapter 7). Performance indicators of quality applied not only to clinical aspects of care but also to support services.
The quality-improvement measures also strengthened support from STC for PHC services (Box 5.6).
Various measures contributed to further strengthening supportive linkages between hospitals and PHC. Examples include:
In the QAP, the senior specialist for a discipline in each state hospital took responsibility for improving quality in all facilities. For example, the state obstetrician provided oversight to prevent maternal deaths throughout the state and therefore liaised with district hospitals, health centres and rural midwives, resulting in an improvement in the early detection and referral of complications of pregnancy (Reference Pathmanathan, Liljestrand, Martins, Rajapaksa, Lissner and de SilvaPathmanathan et al., 2003).
Outbreaks of dengue fever resulted in health inspectors visiting hospitals for epidemiological investigations that strengthened communication between STC and PHC. Conversely, health centres and private clinics used clinical management protocols originating from hospital-based specialists to improve the quality of care for dengue patients.
Supplementary Table 5-b in Appendix II summarises the interactions in the health system during the 1980s and 1990s (STC development Phase 2).
5.4 The Third Phase (2000–Present): Drive towards Integrated, Seamless, High-Quality Care
By the beginning of the new century, the health sector still fell short of the requirements for equitable access to quality care and faced several threats that arose from the ‘successes’ of the past. Section 5.4.1 and Case Study 5.1 analyse the interactions between various components of the health system in addressing some of these threats.
The major threats to STC included:
In the public sector: Rapid increase in specialisation that led to increasing fragmentation at both clinical and managerial levels.
In the private sector: Increasing conflict between medical care as a profit-oriented business and as a service to improve the welfare of the community.
Conflicts arising from the changing roles in the public–private split of the health sector.
The health sector reactions to these threats included (but were not restricted to):
Implementing organisational change to address the fragmentation that arose from increasing trends of specialisation.
Taking advantage of changes in medical technology and information communication technology (ICT) to improve access and efficiency while reining in escalating costs.
Attempting to use governance measures (legislation, financing) to address the challenges and governance gaps in dealing with the public–private split in the health sector.
5.4.1 Organisational Change
In the public sector, there was a rapid increase in the types of clinical specialist units in hospitals and the types of programme management units at national and state levels. Communication between organisational units deteriorated. For example, communication between hospitals and health centres, between hospital outpatient departments (OPDs) and wards, between departments of different clinical disciplines and between district- and state-level hospitals became more challenging (Reference SuleimanSuleiman, 1999). This carried threats to continuity of care for patients, such as people with diabetes, who required long-term care provided by more than one unit or department. There was an increased risk of worse-than-desired health outcomes.
Furthermore, duplications and missed opportunities could contribute to organisational inefficiencies, resulting in rising healthcare costs. The MoH addressed these threats by adopting a policy to ‘provide seamless health care by enhancing integration’ (Institute for Public Health, 1999). Two structural changes of note occurred. First, OPDs in hospitals were moved to health centres that were better suited to provide seamless preventive, promotive and curative care in ambulatory settings and adopted family and community perspectives in the management of conditions such as NCDs. Chapter 4 discusses this initiative.
The second strategy was the formation of hospital clusters to increase access to specialist care and improve utilisation rates in the smaller hospitals. The smaller hospitals had quite a large proportion of unused beds. During the previous experience in the regionalisation approach to improving access, specialists visited non-specialist hospitals. This proved unsuccessful because the smaller hospitals did not have the facilities or expertise to support specialist care. In the cluster concept, a major hospital that had a wider range of specialities formed a cluster with a few neighbouring smaller hospitals to share financial and human resources and equipment. In addition, there was an initial investment in upgrading surgical facilities in the smaller hospitals. Specialists and their teams from the lead hospital provided specialist services at the smaller hospitals on a visiting basis, negating the need to move patients to the major hospital. There was investment in training to enable staff at the smaller hospitals to provide adequate follow-up care after the team from the major hospital had provided treatment. The pooled budget enabled the sharing of financial and material resources such as drugs, equipment and travel between hospitals. There was shared responsibility for the outcomes of care. Initial assessment indicated that these measures provided relief from overcrowding in the major hospital and increased patient satisfaction and cost–benefit in the management of patients with moderate or serious illness. However, they did not increase utilisation rates in the smaller hospitals. Barriers to sustaining or expanding this initiative included frequent transfer of human resources from the smaller hospitals, thus negating the investment in upgrading capacity, and inadequate recognition of the need for the initial additional investment to prepare smaller hospitals to support specialist services (Institute of Health Management, 2016; 2017). Despite these initiatives, the bed occupancy rates of the non-specialist hospitals remained below 50% (Figure 5.7).

Another aspect was the strengthening of referral systems. Within the MoH system, there were continuing efforts to improve the logistics and communication of referral between primary, secondary and tertiary care levels. This included strengthened governance through the refinement and clarification of procedures, expected standards and technological support, for example, through the telehealth project that enables real-time sharing of patient data between primary and secondary care levels, thereby contributing to quality of continuity of care for patients (Reference AllaudinAllaudin, 2014). However, other major challenges arose from governance features of the health system. For example, patients have direct access to specialist clinics in both the public and private sectors without going through primary care (Reference Yiengprugsawan, Healy, Kendig, Neelamegam, Karunapema and KasemsupYiengprugsawan et al., 2017). This encourages the bypassing of primary care. In addition, in the private sector, it encourages rivalry between primary and specialist care providers, which in turn raises the risk of failure to refer conditions that require higher levels of competency. Additionally, evidence suggests that feedback and referral from STC services to primary care in the public sector is weak (Table 5.6). In larger hospitals in both the public and private sectors, rules for referral between different clinical disciplines have not been established.
Table 5.6 Referral experiences reported by doctors in public sector health centres
| % of doctors stating | |||
|---|---|---|---|
| Usually or always | Occasionally | Seldom or never | |
| Received patient records from previous doctor | 36.2 | 51.6 | 12.2 |
| Used referral letters | 99 | ||
| Received feedback from specialists | 19 | 30.8 | 50.2 |
| Obtained discharge report from hospital | 27 (within 4–14 days) | 13.7 (delayed > 14 days) | 58.4 |
5.4.2 Advances in Technology
Technological advances affected STC profoundly. Two illustrative examples of the influence of technology on the delivery of STC services are telemedicine and day-care surgery.
Telemedicine.
The MoH introduced telemedicine progressively in several districts to increase access and reduce costs by enabling specialists based at larger centres to provide, through teleconsultation, diagnostic and therapeutic advice to doctors in hospitals without specialists or with a smaller range of specialities. Reference Yusof, Neoh, Hashim and IbrahimYusof and colleagues (2002) noted that the introduction of telemedicine increased access to STC in the remote, less accessible districts, such as Beluran and Kudat in Sabah, and led to ‘enhanced diagnostic options, cost savings and better health outcomes’. By 2016, telemedicine had increased to 45 facilities and 60 stations throughout the country (Ministry of Health Malaysia, 2016). Nurazean and colleagues reviewed the system and noted that the careful selection of sites influenced the usefulness and utilisation of teleconsultation. Factors in selection included sufficient need (i.e. inadequate expertise to address more complex problems), difficulty of physical access between sending and receiving sites, and discipline-specific guidelines (certain types of cases in each discipline are not amenable to distance guidance) (Reference Nurazean, Win, Singh and MasromNurazean et al., n.d.).
Day-care surgery.
Medical technology such as advanced anaesthesia and minimally invasive surgical technologies contributed to increasing numbers of day surgeries, for example, cataract surgery, laparoscopy and other endoscopies that require short postoperative monitoring and recovery. The evaluation of day-care cataract surgery has been possible through the National Eye Database, which facilitates the tracking of trends in cataract surgery. It provided evidence that contributed to improvements in techniques and technology, as reflected in practice patterns and outcomes (Table 5.7). An increasing proportion of cataract surgery is being performed as day-care, and visual outcomes have improved, indicating improved quality. The success of the day-care centres for cataract surgery is attributed also to the availability of dedicated, well-trained teams of care providers, including highly trained technicians, nurses, specialists and sub-specialists.
| 2002 | 2015 | |
|---|---|---|
| Cataract surgeries | 12,798 | 44,534 |
| Day-care (%) | 39.3 | 69 |
| Phacoemulsion (%) | 39.7 | 87.9 |
| Local anaesthesia (%) | 93 | |
| Intraoperative complications (%) | 5 | |
| Unaided visual outcome 6/12 or better (%) | 55.1 | |
| Visual outcome 6/12 or better with spectacles (%) | 87 | 95.1 |
Day-care surgery provides an avenue for controlling costs (Evaluation of Specialist Complex and Ambulatory Care Centre, 2018). The day-care centre approach has also contributed to integrated care, with specialists from various disciplines managing patients simultaneously. For example, endocrinologists managing problematic diabetic patients have simultaneous input from orthopaedic and vascular surgeons.

5.4.3 Governance Challenges Affecting STC
The fragmentation of clinical services is a challenge and occurs in at least at two dimensions of care. First, several clinical disciplines are compartmentalised into sub-specialties. Sometimes, the care provider in sub-speciality case management focuses on managing a particular condition to the exclusion of co-morbid conditions. At STC level, technological advancement necessitates multidisciplinary knowledge and skills and cross-discipline references in managing patients with multiple complex conditions. Care providers require the appropriate skills and attributes to recognise when cross-referral is needed and facilitate seamless cross-referrals. Currently, in Malaysia, the policies regarding intra- and inter-facility referral in both public and private sector clinical networks are weak.
Furthermore, clinicians at the PHC level who refer patients to STC levels of care have difficulties identifying the person or department in the hospital responsible for co-ordinating and facilitating such referrals. This situation is further complicated because patients have the right to an informed choice of providers that best fit their medical needs and financial resources. Many patients prefer to skip primary care facilities in favour of direct appointments at specialist clinics or hospitals, particularly in the private sector.
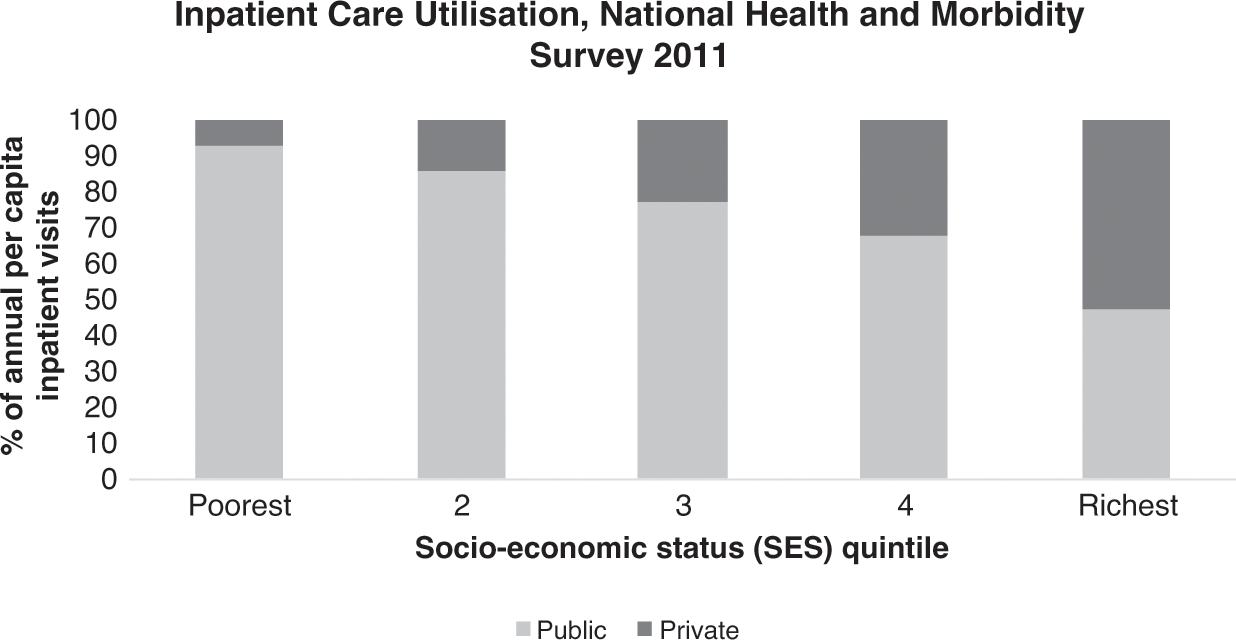
Another dimension of the fragmentation of STC is evident in the fragmentation between the public and private sectors, each with different payment and governance mechanisms. During the first 40 years after independence, the fragmentation of the Malaysian healthcare sector into the public and private sectors appears to have assisted the national goal of improving equitable use of healthcare (see Chapters 3 and 9). Although the schism created tensions, particularly in the distribution of the workforce, it also enabled the wealthier segment of the population who could afford it to utilise private hospitals, thereby facilitating the public sector to provide for the lower-income groups (Figure 5.9) (Health Policy Research Associates et al., 2013).
However, during the most recent two decades, fresh challenges have surfaced, arising largely from underlying governance structures and financing mechanisms.
5.4.4 Rising Expenditure and Costs in the Private Sector
STC accounts for a relatively high proportion (55%) of total health expenditure (THE) (Table 5.8). Private sector hospitals are responsible for an increasing proportion of THE, while that of public hospitals remains steady. Yet the proportion of discharges/admissions in public versus private hospitals has not changed during the period 2012–17. It is not clear whether the increased private sector expenditure is due to investment in new hospitals, investment in new expensive technology or higher cost of patient care.
Table 5.8 Expenditure on and utilisation of public and private hospitals, 2012 and 2017
| 2012 | 2017 | |
|---|---|---|
| THE | 42,764 | 57,361 |
| % public | 55.85 | 51.15 |
| % private | 44.1 | 48.85 |
| All hospitals as % of THE | 51 | 55 |
| Private hospital % of THE | 18 | 24 |
| Public hospital % of THE | 33 | 31 |
| Discharges from private hospitals (millions) | 0.91 | 1.05 |
| Discharges from public hospitals (millions) | 2.21 | 2.49 |
1 2012 data are reported as admissions, not discharges.
Clients are unhappy with the price of care in private hospitals (Table 5.9).
| Satisfaction with | % good to excellent | |
|---|---|---|
| Public | Private | |
| Provider behaviour | ||
| Ability to give diagnosis | 77 | 78 |
| Clarity of explanation | 77 | 79 |
| Courtesy and thoughtfulness | 78 | 82 |
| Characteristics of selected system | ||
| Private room/fewer people | 44 | 72 |
| Allowed to choose doctor | 45 | 73 |
| Waiting time to see doctor | 38 | 72 |
| Amount of time spent by doctor | 65 | 75 |
| Treatment charges | 80 | 27 |
| Outcome of service | 78 | 80 |
| Overall impressions | 81 | 72 |
The rapid increase in high-cost technology experienced in the previous decade continues in the private sector (Table 5.5 and Table 5.10). Are considerations of cost recovery from expensive investments driving costs in private hospitals? In the private sector, there is no overriding guide on technology acquisition. In contrast, reports from health technology assessment guide the acquisition of new technology in the public sector. Furthermore, in contrast to the public sector, no one monitors the outcomes of care and appropriateness of care across the private sector network of hospitals. Therefore, there are no feedback loops to trigger action from the authorities or to modify the behaviour of the providers themselves.
In theory, the public sector could harness the excess capacity of technology in the private sector, and there are examples of small-scale efforts in this direction, such as the purchase of PET (positron emission tomography) and CT (computed tomography) services. Case Study 5.1 on renal dialysis illustrates how imaginative cross-funding between public and private sectors can release private funds for initial investments and facilitate partnership for better utilisation of available private sector healthcare resources. However, this model has not been replicated, suggesting that there are serious barriers, perhaps related to finance and governance.
As there is no social health insurance and individual out-of-pocket payment is the largest source of private sector funding (Table 5.11), no organised entity has the responsibility of influencing rising costs. Private insurers are most likely to protect their own pockets by limiting payouts and passing on additional costs to individuals.
| Sources of funds | 2012 | 2017 |
|---|---|---|
| Private sources of financing (RM million) | 19,795 | 28,023 |
| Out of pocket (%) | 78.7 | 77 |
| Private insurance (%) | 14.0 | 15 |
| MCOs1 (%) | 0.5 | 4 |
| All corporations (%) | 5 |
Managed care organisations (MCOs) increased their participation in managing private sector funds from 0.5% to 4% of private funds over five years (2012–2017) (Table 5.11). This has raised further issues of gaps in governance, as illustrated by Case Study 4.2 on MCOs.
5.4.4.1 Governance Gaps
Corporate entities whose main driver is profit margins have acquired most of the private hospitals. Ironically, many of the larger corporations are government-linked agencies (Reference Chan and ChanChan, 2015), but they too share the profit motive. Additionally, encouragement of health tourism is now a major government policy (Economic Planning Unit, 2010), thereby accentuating the profit motive in the private sector. Thus, while public sector healthcare retains its vision and goal of the health and wellbeing of the population, including addressing inequitable access, quality, safety and cost containment, the private sector strives for return on investment and competitiveness. There is a conflict in vision about whether healthcare is for social wellbeing or whether it is a business enterprise. Few governance measures are in place to address evident or emerging conflicts.
5.5 Conclusion
In summary, STC evolved in response to demand from the larger ecosystem. Economic growth, population behaviour and epidemiological patterns created political pressures that in turn resulted in an ever-increasing demand for STC.
The evolution of STC has moved from selective secondary care towards increasingly comprehensive STC, moulded by the ability of the health workforce to respond to demands for higher levels of competency and by the availability and capabilities of medical products and technology.
The enabling sub-systems, in turn, have influenced the evolution of the healthcare provider sub-system. These sub-systems comprise finance (sources, recipients and modalities), health information (availability, quality and use) and governance (managerial competence, governance structures and legislative tools) that either enable or constrain the evolution of the provider sub-system.
The outcomes of the healthcare system, in turn, have influenced the larger ecosystem, thereby creating a perpetual cycle (Figure 5.10).

5.6 Key Messages from Malaysia’s Experience
5.6.1 What Went Well?
STC ability to respond to people’s desire for more sophisticated care and professionals’ desire to provide the best care available effectively and efficiently. Key factors are:
◦ Human resource production and use (see also Chapter 8).
◦ Systematic quality improvement strategies.
◦ Use of technology assessment for production of practice guidelines.
Investment in strengthening management, and decentralised decision-making.
5.6.2 What Did Not Go So Well?
Smaller hospitals built in response to public demand for access remain underutilised because of system inability to provide the human and material resources expected by the public.
Rapid growth of private sector STC affects social efficiency of STC and PHC.
In private sector STC: Unresolved conflict between the interests of shareholders (of companies owning hospitals) and those of stakeholders (users, providers, public sector STC).


 Open access