To save content items to your account,
please confirm that you agree to abide by our usage policies.
If this is the first time you use this feature, you will be asked to authorise Cambridge Core to connect with your account.
Find out more about saving content to .
To save content items to your Kindle, first ensure no-reply@cambridge.org
is added to your Approved Personal Document E-mail List under your Personal Document Settings
on the Manage Your Content and Devices page of your Amazon account. Then enter the ‘name’ part
of your Kindle email address below.
Find out more about saving to your Kindle.
Note you can select to save to either the @free.kindle.com or @kindle.com variations.
‘@free.kindle.com’ emails are free but can only be saved to your device when it is connected to wi-fi.
‘@kindle.com’ emails can be delivered even when you are not connected to wi-fi, but note that service fees apply.
Let G be a connected graph that is 2-cell embedded in a surface S, and let G* be its topological dual graph. We will define and discuss several matroids whose element set is E(G), for S homeomorphic to the plane, projective plane, or torus. We will also state and prove old and new results of the type that the dual matroid of G is the matroid of the topological dual G*.
In this paper, we study two kinds of combinatorialobjects, generalized integer partitions and tilings of 2D-gons(hexagons, octagons, decagons, etc.).We show that the sets of partitions,ordered with a simple dynamics, have the distributive lattice structure.Likewise, we show that the set of tilings of a 2D-gonis the disjoint union of distributivelattices which we describe.We also discuss the special case of linear integerpartitions, for which other dynamical models exist.
A shuffle ideal is a language which is a finite union of languages of the form A*a1A*...A*ak where A is a finite alphabet and the ai's are letters. We show how to represent shuffle ideals by special automata and how to compute these representations. We also give a temporal logic characterization of shuffle ideals and we study its expressive power over infinite words. We characterize the complexity of deciding whether a language is a shuffle ideal and we give a new quadratic algorithm for this problem. Finally we also present a characterization by subwords of the minimal automaton of a shuffle ideal and study the complexity of basic operations on shuffle ideals.
We study the decidability of the following problem: given p affine functions ƒ1,...,ƒp over $\mathbb{N}^k$ and two vectors $v_1, v_2\in\mathbb{N}^k$,is v2 reachable from v1 by successive iterations of ƒ1,...,ƒp(in this given order)? We show that this question is decidable for p = 1, 2 and undecidable forsome fixed p.
We prove that, with high probability, the space complexity of refutinga random unsatisfiable Boolean formula in k-CNF on nvariables and m = Δn clauses is$O\left(n \cdot \Delta^{-\frac{1}{k-2}}\right)$.
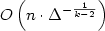
A number of array-based technologies have been developed over the last several years, and technological development in this area is likely to continue at a brisk pace. These technologies include DNA, protein, and combinatorial chemistry arrays. So far, DNA arrays designed to determine gene expression levels in living cells have received the most attention. Since DNA arrays allow simultaneous measurements of thousands of interactions between mRNA-derived target molecules and genome-derived probes, they are rapidly producing enormous amounts of raw data never before encountered by biologists. The bioinformatics solutions to problems associated with the analysis of data on this scale are a major current challenge.
Like the invention of the microscope a few centuries ago, DNA arrays hold promise of transforming biomedical sciences by providing new vistas of complex biological systems. At the most basic level, DNA arrays provide a snapshot of all of the genes expressed in a cell at a given time. Therefore, since gene expression is the fundamental link between genotype and phenotype, DNA arrays are bound to play a major role in our understanding of biological processes and systems ranging from gene regulation, to development, to evolution, and to disease from simple to complex. For instance, DNA arrays should play a role in helping us to understand such difficult problems as how each of us develops from a single cell into a gigantic supercomputer of roughly 1015 cells, and why some cells proliferate in an uncontrolled manner to cause cancer.
Total RNA is isolated from cells at an A600 of 0.5–0.6. Ten-ml samples of cultures of growing cells are pipetted directly into 10 ml of boiling lysis buffer (1% SDS, 0.1 m NaCl, 8 mm EDTA) and mixed at 100°C for 1.5 min. These samples are transferred to 250-ml Erlenmeyer flasks, mixed with an equal volume of acid phenol (pH 4.3), and shaken vigorously for 6 min at 64°C. After centrifugation, the aqueous phase is transferred to a fresh Erlenmeyer flask, and the hot acid phenol extraction procedure is repeated. The second aqueous phase is extracted with phenol:chloroform:isoamyl alcohol (25:24:1, pH 4.3) at room temperature and, finally, twice with chloroform-isoamyl alcohol (24:1). Total RNA is precipitated with two volumes of ethanol in 0.3 m sodium acetate (pH 5.3), washed with 70% ethanol, and redissolved in RNAase-free water. The contaminating genomic DNA is removed from the total RNA with Ambion's DNA-free kit ™ (catalog no. 1906). Since genomic DNA is a common source of high background on DNA arrays, this step is repeated at least once. The quality and integrity of the total RNA preparation is ascertained by electrophoresis in a 1.2 % agarose gel run in 1 × TAE (40 mm Tris-acetate, 2 mm EDTA) buffer. Appropriate modifications of these methods can be used for total RNA extraction from eukaryotic cells.
CyberT is an internet-based program designed to accept data in the large data spreadsheet format that is generated as output by software typically used to analyze array experiment images. Figure D.1 shows a screen-shot of the CyberT window for analyzing control versus experimental data of the type considered in this book.
Each data element may correspond to a single measurement on the array (typical of membrane- or glass-slide-based arrays) or the result of a set of measurements (typical of Affymetrix GeneChips™). This data file is uploaded to CyberT using the “Browse” button in the CyberT browser window. Another window displays a version designed for the analysis of two-dye ratio data that is generated with glass slide arrays probed with Cy3/Cy5-labeled cDNA. Both of these CyberT applications are available for use at the UCI genomics web site (www.genomics.uci.edu). Detailed instructions for using CyberT can be accessed from this web page.
An example of the first few rows of a data file for CyberT is shown in Figure 7.4. The data file can be uploaded either as a whitespace, tab, or comma delimited text file.
After uploading the data file, the user enters experiment comments and defines the columns on which analyses will be performed. In the example shown in Figure D.2, there is only one label column containing gene names; however, any number of label columns containing other gene labels (descriptions) can be designated.
Although many data analysis techniques have been applied to DNA array data, the field is still evolving and the methods have not yet reached a level of maturity [1]. Even very basic issues of signal-to-noise ratios are still being sorted out.
Gene expression array data can be analyzed on at least three levels of increasing complexity. The first level is that of single genes, where one seeks to establish whether each gene in isolation behaves differently in a control versus an experimental or treatment situation. Here experimental/treatment is to be taken, of course, in a very broad sense: essentially any situation different from the control. Differential single-gene expression analysis can be used, for instance, to establish gene targets for drug development. The second level is multiple genes, where clusters of genes are analyzed in terms of common functionalities, interactions, co-regulation, etc. Gene co-expression can provide, for instance, a simple means of gaining leads to the functions of many genes for which information is not available currently. This level includes also leveraging DNA array data information to analyze DNA regulatory regions and finding regulatory motifs. Finally, the third level attempts to infer and understand the underlying gene and protein networks that ultimately are responsible for the patterns observed. Other issues of calibration, quality control, and comparison across different experiments and technologies are addressed in Chapter 7 (see, for instance, also [2, 3]).
From time to time new scientific breakthroughs and technologies arise that forever change scientific practice. During the last 50 years, several advances stand out in our minds that – coupled with advances in the computational and computer sciences – have made genomic studies possible. In the brief history of genomics presented here we review the circumstances and consequences of these relatively recent technological revolutions.
Our brief history begins during the years immediately following World War II. It can be argued that the enzyme period that preceded the modern era of molecular biology was ushered in at this time by a small group of physicists and chemists, R. B. Roberts, P. H. Abelson, D. B. Cowie, E. T. Bolton, and J. R. Britton in the Department of Terrestrial Magnetism of the Carnegie Institution of Washington. These scientists pioneered the use of radioisotopes for the elucidation of metabolic pathways. This work resulted in a monograph titled Studies of Biosynthesis in Escherichia coli that guided research in biochemistry for the next 20 years and, together with early genetic and physiological studies, helped establish the bacterium E. coli as a model organism for biological research [1]. During this time, most of the metabolic pathways required for the biosynthesis of intermediary metabolites were deciphered and biochemical and genetic methods were developed to identify and characterize the enzymes involved in these pathways.
A long-term goal of systems biology, to be discussed in Chapter 8, is the complete elucidation of the gene regulatory networks of a living organism. Indeed, this has been a Holy Grail of molecular biology for several decades. Today, with the availability of complete genome sequences and new genomic technologies, this goal is within our reach. As a first step, DNA microarrays can be used to produce a comprehensive list of the genes involved in defined regulatory sub-circuits in well-studied model organisms such as E. coli. In this chapter we describe the use of DNA microarrays to identify the target genes of regulatory networks in E. coli controlled by global regulatory proteins that allow E. coli cells to respond to their nutritional and physical environments. We begin by describing the design and analysis of experiments to examine differential gene expression profiles between isogenic strains differing only by the presence or absence of a single global regulatory protein which controls the expression of a gene regulatory circuit (regulon) composed of many operons.
Before we can identify the genes of any given regulatory circuit we need to be able to measure their behaviors with accuracy and confidence under various treatment conditions. However, because of the influences of experimental and biological errors inherent in high-dimensional DNA microarray experiments, discussed in Chapter 4, this is not a simple task.
Once a DNA array experiment has been designed and executed the data must be extracted and analyzed. That is, the signal from each address on the array must be measured and some method for determining and subtracting the background signal must be employed. However, because there are many different DNA array formats and platforms, and because hybridization signals can be generated with fluorescent- or radioactive-labeled targets, no single DNA array readout device is suitable for all purposes. Furthermore, many instruments with different advantages and disadvantages for different types of array formats are available. Therefore, since accurate data acquisition is a critical step of any array experiment, careful attention must be paid to the selection of data acquisition equipment.
Reading data from a fluorescent signal
All arrays that emit a fluorescent signal must be read with an instrument that provides a fluorescence excitation energy source and an efficient detector for the light emitted from the fluorophore incorporated into the target. Currently, the fluorophores most commonly used for incorporation into cDNA targets are Cy3 and Cy5. These are cyanine dyes commercially available as dUTP or dCTP conjugates. Cy3 is an orange dye with a light absorption maximum at 550 nm and an emission maximum at 581 nm. Cy5 is a far-red dye with a light absorption maximum at 649 nm and an emission maximum at 670 nm.
In Chapter 7, we studied three global regulatory proteins in E. coli (Lrp, IHF, and Fnr). These proteins are responsible for the direct regulation of scores of genes, and through the use of DNA microarrays we were able to establish a fairly comprehensive list of the genes each protein regulates with good confidence. These results have an intuitive graphical representation where nodes represent proteins and directed edges represent direct regulation. Intuitively these simple graphs should capture a portion of the complete “regulatory network” of E. coli. Within this network, Lrp, IHF, and Frn are like “hubs”, to use an analogy with the well-connected airports of airline flight charts, three of the two dozen or so hubs in the E. coli regulatory chart. In spite of their simplicity, these diagrams immediately suggest a battery of questions. How can one represent more complex indirect interactions or interactions involving multiple genes at the same time? Is there any large-scale “structure” in the network associated with, for instance, control hierarchies, or duplicated circuits, or plain feedback and robustness? What is the relationship between the global regulatory proteins (i.e., the hubs) and the less well connected nodes? How are the edges of the hubs distributed with respect to a functional pie chart classification (biosynthesis, catabolism, etc.) of all the genes?
These questions point towards an ever broader set of problems and ultimately whether we can model and understand regulatory and other complex biological processes from the molecular level to the systems level.
Differential expression is a useful tool for the analysis of DNA microarray data. However, and in spite of the fact that it can be applied to a large number of genes, differential analysis remains within the confines of the old one-gene-at-a-time paradigm. Knowing that a gene's behavior has changed between two situations is at best a first step. In a cancer experiment, for instance, a significant change could be associated with a direct causal link (activation of an oncogene), a more indirect chain of effects (signaling pathway), a non-specific related phenomenon (cell division), or even a spurious event completely unrelated to cancer (“noise”).
Most, if not all, genes act in concert with other genes. What DNA microarrays are really after are the patterns of expression across multiple genes and experiments. And to detect such patterns, additional methods such as clustering must be introduced. In fact, in the limit, differential analysis can be viewed as a clustering method with only two clusters: change and nochange. Thus, at the next level of data analysis, we want to remove the simplifying assumption that genes are independent and look at their covariance, at whether there exist multi-gene patterns, clusters of genes that share the same behavior, and so forth.
In previous chapters, we have discussed the formats, methods of manufacture, and data aquisition instruments required for gene expression profiling with DNA arrays. In this chapter, we consider issues such as: heterogeneities encountered among experimental samples, isolation procedures for non-polyadenylated and polyadenylated RNA from bacteria and higher organisms; advantages and disadvantages of different target preparation methods; and general problems encountered during the execution of such experiments. Throughout this chapter we focus on ways to minimize experimental errors. In particular, we point out the pitfalls of current methods for the preparation of targets from polyadenylated RNA and discuss alternative methods of target synthesis from total RNA preparations from eukaryotic cells based on methods developed for the synthesis of bacterial targets. Regardless of the fact that we model many of our discussions around bacterial systems, it should be emphasized that the lessons of this chapter are applicable to gene expression profiling experiments in all organisms.
Primary sources of experimental and biological variation
Differences among samples
It is, of course, desirable to minimize extraneous biological and experimental variables as much as possible when analyzing gene expression profiles obtained under two defined experimental conditions such as a temporal or treatment gradient, or between two different cell sample types or genotypes [1, 2, 3, 4]. In Chapter 7, we compare the gene expression profiles between two genotypes, lrp+ and a lrp− strains of E. coli.
Array technologies monitor the combinatorial interaction of a set of molecules, such as DNA fragments and proteins, with a predetermined library of molecular probes. The currently most advanced of these technologies is the use of DNA arrays, also called DNA chips, for simultaneously measuring the level of the mRNA gene products of a living cell. This method, gene expression profiling, is the major topic of this book.
In its most simple sense, a DNA array is defined as an orderly arrangement of tens to hundreds of thousands of unique DNA molecules (probes) of known sequence. There are two basic sources for the DNA probes on an array. Either each unique probe is individually synthesized on a rigid surface (usually glass), or pre-synthesized probes (oligonucleotides or PCR products) are attached to the array platform (usually glass or nylon membranes). The various types of DNA arrays currently available for gene expression profiling, as well as some developing technologies, are summarized here.
In situ synthesized oligonucleotide arrays
The first in situ probe synthesis method for manufacturing DNA arrays was the photolithographic method developed by Fodor et al. [1] and commercialized by Affymetrix Inc. (Santa Clara, CA). First, a set of oligonucleotide DNA probes (each 25 or so nucleotides in length) is defined based on its ability to hybridize to complementary sequences in target genomic loci or genes of interest. With this information, computer algorithms are used to design photolithographic masks for use in manufacturing the probe arrays.