Refine search
Actions for selected content:
52617 results in Statistics and Probability
Graph-based information management for retrofitting long-living assets
-
- Journal:
- Data-Centric Engineering / Volume 5 / 2024
- Published online by Cambridge University Press:
- 20 December 2024, e46
-
- Article
-
- You have access
- Open access
- HTML
- Export citation
Evaluation of the Queensland JEV vaccine program response to the 2022 Australian outbreak
-
- Journal:
- Epidemiology & Infection / Volume 152 / 2024
- Published online by Cambridge University Press:
- 20 December 2024, e176
-
- Article
-
- You have access
- Open access
- HTML
- Export citation

Time Series for Economics and Finance
-
- Published online:
- 19 December 2024
- Print publication:
- 19 December 2024
-
- Textbook
- Export citation

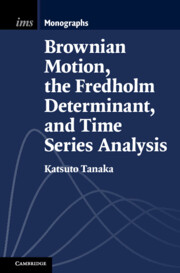
Brownian Motion, the Fredholm Determinant, and Time Series Analysis
-
- Published online:
- 19 December 2024
- Print publication:
- 02 January 2025
Appendices
-
- Book:
- Time Series for Economics and Finance
- Published online:
- 19 December 2024
- Print publication:
- 19 December 2024, pp 397-410
-
- Chapter
- Export citation
Dedication
-
- Book:
- Time Series for Economics and Finance
- Published online:
- 19 December 2024
- Print publication:
- 19 December 2024, pp v-vi
-
- Chapter
- Export citation
Contents
-
- Book:
- Time Series for Economics and Finance
- Published online:
- 19 December 2024
- Print publication:
- 19 December 2024, pp vii-xii
-
- Chapter
- Export citation
10 - Nonlinear Time Series Models
-
- Book:
- Time Series for Economics and Finance
- Published online:
- 19 December 2024
- Print publication:
- 19 December 2024, pp 266-302
-
- Chapter
- Export citation
11 - Nonparametric Methods and Machine Learning
-
- Book:
- Time Series for Economics and Finance
- Published online:
- 19 December 2024
- Print publication:
- 19 December 2024, pp 303-346
-
- Chapter
- Export citation
Appendix C - Laws of Large Numbers and Central Limit Theorems
-
- Book:
- Time Series for Economics and Finance
- Published online:
- 19 December 2024
- Print publication:
- 19 December 2024, pp 401-404
-
- Chapter
- Export citation
Migration scenarios for gender apartheid and asylum: when International Criminal Law and International Refugee Law Meet
- Part of
-
- Journal:
- Data & Policy / Volume 6 / 2024
- Published online by Cambridge University Press:
- 19 December 2024, e77
-
- Article
-
- You have access
- Open access
- HTML
- Export citation
A six-year epidemiological study of selected zoonotic abortifacient agents in ovine and caprine foetuses in Türkiye
-
- Journal:
- Epidemiology & Infection / Volume 152 / 2024
- Published online by Cambridge University Press:
- 19 December 2024, e173
-
- Article
-
- You have access
- Open access
- HTML
- Export citation
9 - Bayesian Methods
-
- Book:
- Time Series for Economics and Finance
- Published online:
- 19 December 2024
- Print publication:
- 19 December 2024, pp 252-265
-
- Chapter
- Export citation
Tables
-
- Book:
- Time Series for Economics and Finance
- Published online:
- 19 December 2024
- Print publication:
- 19 December 2024, pp xvii-xviii
-
- Chapter
- Export citation
7 - Multivariate Linear Time Series
-
- Book:
- Time Series for Economics and Finance
- Published online:
- 19 December 2024
- Print publication:
- 19 December 2024, pp 196-237
-
- Chapter
- Export citation
3 - Linear Time Series Models
-
- Book:
- Time Series for Economics and Finance
- Published online:
- 19 December 2024
- Print publication:
- 19 December 2024, pp 42-101
-
- Chapter
- Export citation
6 - Nonstationary Processes, Trends, and Seasonality
-
- Book:
- Time Series for Economics and Finance
- Published online:
- 19 December 2024
- Print publication:
- 19 December 2024, pp 151-195
-
- Chapter
- Export citation
Preface
-
- Book:
- Time Series for Economics and Finance
- Published online:
- 19 December 2024
- Print publication:
- 19 December 2024, pp xix-xx
-
- Chapter
- Export citation
4 - Spectral Analysis
-
- Book:
- Time Series for Economics and Finance
- Published online:
- 19 December 2024
- Print publication:
- 19 December 2024, pp 102-128
-
- Chapter
- Export citation
Acknowledgments
-
- Book:
- Time Series for Economics and Finance
- Published online:
- 19 December 2024
- Print publication:
- 19 December 2024, pp xxi-xxi
-
- Chapter
- Export citation
