


INTRODUCTION
The existential threat posed by climate change and environmental degradation is growing ever more present. While some of the harsh impacts are already being felt—extreme temperatures, massive wildfires, devastating floods—addressing this threat poses a formidable challenge on two main fronts: technological and political. On the former, much has been written, particularly on the difficulty of developing cost-effective low-carbon technologies to replace the reliance on fossil fuels. Yet even where progress is made on the technological front, the political challenge remains a major barrier to progress.
In France, for example, President Macron introduced in October 2018 a carbon tax hike, with the aim of incentivizing motorists to make environment-friendly behavioral changes. Yet widespread demonstrations and road blockades soon erupted across the country, sparking the “Yellow Vests” movement that protested against the policy, arguing that it disproportionately burdened working-class households. As the demonstrations spread nationally, the government abandoned the proposed policy change. Elsewhere, the Chilean government confronted mass demonstrations in 2019 due to rising metro fares, prompted by the government’s decision to power the national network with renewable energy.
These examples highlight a larger issue: while governments in many countries increasingly view environmental protection as a central priority, advancing green policies is often politically challenging. One reason is that these policies often entail high transition costs that are unevenly distributed. What is the political effect of introducing green policies? How does their distributional impact shape environmental attitudes and voting behavior?
The growing adoption of environmental policies can instigate a backlash, one that we conjecture is particularly well-aligned with the right-wing populist agenda. That is because green policies are fast becoming synonymous with scientific expertise, technocratic management, and involvement of multilateral international institutions, all frequent targets of populist ire (Bonikowski and Gidron Reference Bonikowski and Gidron2016). Indeed, there is evidence that right-wing populist parties and candidates often take a skeptical stance on environmental issues. For instance, UKIP leader Nigel Farage described the fight against climate change as “one of the biggest and stupidest collective misunderstandings in history.”Footnote 1 US President Donald Trump repeatedly expressed climate change skepticism.Footnote 2 In a study of 13 populist right parties—among them the Austrian Freedom Party, the Danish DPP, France’s Front National, and the Swiss People’s Party—the authors conclude that the parties’ positions on global warming are “clearly anti-environmental” and that eleven of the parties are “overwhelmingly against environmental taxes” (Gemenis, Katsanidou, and Vasilopoulou Reference Gemenis, Katsanidou and Vasilopoulou2012).Footnote 3 As green policies often place high costs on citizens, in taking such a stance, parties may hope to attract a sizable swath of discontented voters. Whether that approach succeeds in doing so is an open question.
To address this issue, our study exploits a quasi-natural experiment to provide insight on whether and how the introduction of green policies with uneven costs affects vote choice, as well as environmental attitudes and behavior. Specifically, we focus on the Area B policy advanced in July 2018 in the city of Milan by the social democratic mayor Giuseppe Sala. The policy restricted certain polluting vehicle models from circulating within a large area that covers over 70% of the city of Milan, and where 97% of the city population resides. The policy entailed significant economic losses for owners of the banned car models, who reported a median cost of €3,750, corresponding to about 17% of residents’ median annual gross income.
The policy drew a sharp rebuke from opposition politicians, most vocally from representatives of the populist right party Lega. Massimiliano Bastoni, Lega representative in the regional council, summarized his party’s criticism of the policy and its political backers by warning “…This initiative will create only inconveniences and disasters, depressing the economy and penalizing the weaker social segments… Could you expect anything different from the radical-chic left, that just claims to be the people’s friend, but is actually not?”Footnote 4 In subsequent elections held the following year, such criticism became a prominent feature of Lega’s attack on the incumbent leftist Democratic Party (PD) and its environmental policy approach.
We investigate the electoral impact of the Area B policy, and use this case study to provide insight into the broader political dynamics surrounding the introduction of green policies. To do so, we utilize an original survey with a targeted sampling design that we conducted among residents of Milan. The survey collected detailed information about respondents’ car ownership, environmental views, and political behavior. Employing a set of inferential strategies, we estimate the electoral impact of the introduction of the Area B ban. Specifically, we exploit arbitrary discontinuities in the rules dictating the car models that would be covered by the ban and employ a difference-in-differences estimation to identify the policy’s effect on voting behavior.
Our analysis reveals that the introduction of the Area B ban by the Social Democrats led to an increase in support for the populist right party Lega in the following elections. Specifically, owners of banned cars were 13.5 percentage points more likely to vote for Lega in the European Parliament elections of 2019. This effect, treatment on treated, was even larger when focusing on the likelihood of switching to Lega among affected car owners who had not voted for the party in previous elections.
To investigate the mechanisms underlying this electoral shift, we collected information about respondents’ views on a host of environmental issues. In addition, we embedded in the survey two studies that enabled us to track residents’ propensity to obtain information about, or expend money on, local and global environmental initiatives. Notably, we found no attitudinal or behavioral differences between car owners that were affected by the ban and owners that were not. If anything, affected car owners exhibited slightly more environment-friendly attitudes. In other words, the adverse pecuniary impact of the Area B policy did not shift those car owners to Lega by leading them to adopt the party’s relatively skeptical view on green issues.
Instead, our results suggest that the shift to Lega reflects disaffection with the pocketbook implications of the policy. Owners of vehicles affected by the Area B ban seem to object to being singled-out by the mayor’s approach of placing the bulk of the cost of his environmental policy on a narrow subset of residents. More generally, they tend to think that the government—by spreading the costs across all residents via the tax system—and big businesses, should take greater responsibility in advancing environmental action.
Taken together, our evidence indicates that the electoral response to the policy closely tracked its distributional impact. In line with that, we also find that affected car owners who received compensation from the municipality for their costs were not more likely than unaffected car owners to shift their support to Lega. Due to data limitations and the fact that residents were required to submit a formal application, we cannot ascertain that this differential electoral response represents a causal effect of the compensation scheme. Still, our evidence is very much consistent with the idea that schemes aimed at offsetting costs incurred by residents help alleviate the political backlash from green policies.
To be clear, our research design does not seek to provide an estimate of the general equilibrium effects of the Area B policy. Put differently, the finding of an increase in support for Lega among those adversely affected by the policy does not preclude a possible net gain for the ruling Democratic Party, which may have been rewarded by voters who were unaffected by the traffic ban and liked the policy. Rather, our focus is specifically on analyzing how the losers from the green policy react politically. Given that many green policies entail significant distributional consequences, this is an important constituency to study.
Our work contributes to a growing stream of research that focuses on domestic, rather than interstate, dynamics surrounding environmental politics (Bechtel and Urpelainen Reference Bechtel and Urpelainen2015; Bernauer and Gampfer Reference Bernauer and Gampfer2015). Notably, much of this work analyzes the determinants of public support for green policies (Gaikwad, Genovese, and Tingley Reference Gaikwad, Genovese and Tingley2022; Kono Reference Kono2020; Kotchen, Turk, and Leiserowitz Reference Kotchen, Turk and Leiserowitz2017), with a particular focus on the influence of parties’ stance or other elite cues on the environmental positions voters take (e.g., Birch Reference Birch2020; Guber Reference Guber2013). However, very little research analyzes how the actual introduction of green policies affects electoral outcomes (see Stokes Reference Stokes2016). Our findings add to this strand of work by showing that the introduction of a green policy that imposes large and unevenly distributed costs on citizens has a substantial impact on the voting behavior of those affected by the policy. The findings highlight the central importance of the way environmental policies are designed, including the provision of measures to spread out the transition costs, in countering the potential political blowback from these policies.
Our evidence also relates to the discussion over the possibility that an anti-green shift could hurt left-wing parties (Kono Reference Kono2020). By this view, green policies may create a schism in the support base of the left between a more environmentally minded middle class and a more pocketbook-minded working class. While we find that the Social Democrats’ introduction of Area B led to an increase in support for the populist right party Lega, our analysis indicates that the shift was, in fact, not a result of left-leaning voters abandoning their party. Instead, Lega’s green-skeptical stance appears to have primarily mobilized “on the fence” voters, that is, people who had previously voted, but not for any of the main political parties. These findings suggest that even without a reckoning among traditional left voters, right-wing populists can attract new voters by spearheading the opposition to the green agenda.
Finally, our analysis speaks to the broader literature on the political implications of structural change, be it globalization or automation (e.g., Anelli, Colantone, and Stanig Reference Anelli, Colantone and Stanig2021; Colantone and Stanig Reference Colantone and Stanig2018). A shared characteristic of the green transition and these other phenomena is that they often entail strong distributive repercussions, generating winners and losers. But an important feature of many green policies is that, arguably more than in other cases, people are asked to pay some cost for a certain good—for example, cleaner air or less catastrophic climate events—that they themselves will benefit from, and that is potentially essential to their own well-being. In other words, the benefits from green policies could be more salient to the individuals, and the causal chain between policies and benefits more transparent (e.g., cleaner air as a result of a traffic ban). People may thus view green policies as vital to their own interest, and support these policies even at a substantial pecuniary cost. This makes the politics surrounding environmental action far from obvious, and potentially different from other policies. Our finding that owners of banned car models swung in a significant manner toward supporting the party most opposed to the Area B policy is pertinent beyond this specific case study. Indeed, our evidence speaks to the broader question of how advancing costly green initiatives is likely to play out politically among those asked to shoulder the bulk of the transition costs.
THE POLITICS OF ENVIRONMENTAL POLICY
Despite a strong scientific consensus that environmental degradation is leading to severe economic and ecological damage, policymakers are struggling to adopt the swift policy measures experts are describing as necessary to deal with the looming catastrophe. Most notably, advancing actions toward reduced reliance on fossil fuels and a mitigation of greenhouse gas emissions is proving a formidable political challenge.
To understand the nature of this challenge, much of the earlier research on the politics of environmental protection has focused on the international perspective, viewing it primarily as a collective action problem between states (e.g., Ostrom Reference Ostrom2010; Stern Reference Stern2007). These studies view the mitigation of climate change, specifically the reduction in greenhouse-gas emissions, as a global collective good, whose production requires cooperation between countries and is therefore characterized by free-riding concerns (see review by Keohane and Victor Reference Keohane and Victor2016).
Later studies have pointed instead to the importance of the domestic debate surrounding environmental policy, arguing that a focus on the international level alone ignores key obstacles that are crucial to understanding the political feasibility of environmental policies (e.g., Bechtel and Urpelainen Reference Bechtel and Urpelainen2015; Bernauer and Gampfer Reference Bernauer and Gampfer2015). This view holds that in choosing whether or not to support policies such as carbon pricing or regulations on emissions, politicians are primarily responding to the preferences of their constituents, and doing so largely irrespective of the actions other countries are taking (Colgan, Green, and Hale Reference Colgan, Green and Hale2021).
Consequently, the literature on the domestic politics of climate change has mostly focused on detecting the chief determinants of citizens’ willingness to support and pay for environment-friendly policies (for a review, see Drews and Van den Bergh Reference Drews and Van den Bergh2016). These determinants include personal beliefs and knowledge about climate change, ideological orientations and values, as well as personal experiences with extreme weather events (Egan and Mullin Reference Egan and Mullin2017; Hazlett and Mildenberger Reference Hazlett and Mildenberger2020; Hoffmann et al. Reference Hoffmann, Muttarak, Peisker and Stanig2021; Inglehart Reference Inglehart1995).
Other scholars expanded this line of investigation, utilizing survey experiments to assess how the features of the policy’s design affect public support for domestic and global climate mitigation efforts. A key finding in their analyses is that considerations regarding the potential costs of the policy play a crucial role in shaping people’s preferences (Bechtel and Scheve Reference Bechtel and Scheve2013; Kotchen, Turk, and Leiserowitz Reference Kotchen, Turk and Leiserowitz2017; Tingley and Tomz Reference Tingley and Tomz2014). These studies highlight two major difficulties in promoting politically viable green policies. First, some policies geared toward environmental protection require a massive upfront outlay, while the benefits are disputed or felt only in the distant future (Hovi, Sprinz, and Underdal Reference Hovi, Sprinz and Underdal2009). Second, the distribution of the costs of green policies is often highly uneven, with significant distributive consequences felt not only across but also within countries (Aklin and Mildenberger Reference Aklin and Mildenberger2020; Beiser-McGrath and Bernauer Reference Beiser-McGrath and Bernauer2020; Maestre-Andrés, Drews, and van den Bergh Reference Maestre-Andrés, Drews and van den Bergh2019; Vona Reference Vona2019). This problem is exacerbated by the fact that environmental policies are often regressive, imposing a heavier burden on low-income individuals (see Markkanen and Anger-Kraavi Reference Markkanen and Anger-Kraavi2019 for an overview).
Several studies have thus explored how such distributive conflicts play out in shaping the choice of policy. For example, analyzing roll-call votes from U.S. congress, scholars find that representatives whose constituencies are expected to bear the brunt of the costs (e.g., areas with a high degree of carbon-intensive employment) are less likely to support environment-friendly legislation (Cragg et al. Reference Cragg, Zhou, Gurney and Kahn2013; Kono Reference Kono2020). Notably, the implicit assumption underlying these findings—that the distributive costs of environmental measures will translate into an electoral response—has hardly been tested. Are politicians right to worry about an electoral backlash if they support climate policies that impose high costs on their constituents? To what extent do voters’ responses vary as a function of how the burden of costs is distributed?
We know little about these issues, as not much empirical attention has been given to the question of how the introduction of green policies with distributional costs affects citizens’ preferences and voting behavior. A notable exception is Stokes (Reference Stokes2016), who uses the spatially uneven consequences of a renewable energy policy in Ontario, Canada, as a natural experiment. She shows that voters living in proximity to wind energy projects were more likely to retrospectively punish the incumbent provincial government for liberalizing the installation of wind turbines. Specifically, she documents a NIMBY effect that persists 3 km from wind turbines, resulting in a 4–10% drop in vote share for the incumbent party in precincts with a proposed or operational turbine, as compared to similar precincts without one. These findings shed light on the electoral impact of distributional conflicts induced by green policies on a geographical basis. While the green policy Stokes examined generated aggregate gains in terms of lower carbon emissions, it also created geographically concentrated losers, namely residents living near the wind turbines who suffered from noise and the unaesthetic impact of the turbines on the landscape.
The findings by Stokes (Reference Stokes2016) speak directly to cases in which environmental policies entail distributional consequences that are geographic-based. An important question that remains open is what the electoral consequences are when the costs of the green policy are spread unevenly across individuals without a geographic dimension. That is indeed the case for many green policies (e.g., carbon taxes), and most prominently for vehicle bans such as the one we study in this article. In our setting, losers (i.e., owners of banned cars) reside next to citizens who are not harmed by the policy, as they all live in the same area. Hence, the political conflict the Area B policy instigates is not a NIMBY-type of problem. The relevant unit of analysis is therefore individuals rather than electoral precincts, necessitating the use of data at the individual level. As a result, our research design allows us to also evaluate the mechanisms through which the distributional consequences of the policy translate into voting behavior.
THE AREA B POLICY AND THE POLITICAL CONTEXT
Studies conducted over the past decade by the European Environment Agency have placed the city of Milan consistently among the worst cities in Europe in terms of air pollution. In May 2018, Italy was referred to the EU Court of Justice due to noncompliance with the EU’s air pollution limits in its Northern area, where Milan is located. In an effort to improve the quality of the air in the city, Milan mayor Giuseppe Sala announced in July 2018 the introduction of a new environmental policy: Area B.
Area B is a restricted traffic area that covers 72% of the city’s territory, where 97% of the population resides.Footnote 5 The policy identifies the most polluting categories of vehicles and bans them from accessing and circulating within the area.Footnote 6 Area B is active from Monday to Friday from 7:30 to 19:30, excluding holidays.Footnote 7
Restrictions on the free circulation of vehicles within Area B are based on the European system of exhaust emissions standards, the so-called “Euro categories.” Starting in 1992, every several years the EU has introduced new and increasingly stringent regulations (from Euro1 to Euro6 categories) defining the maximum permitted levels of various pollutants.Footnote 8 All new vehicles produced and sold in Europe at any point in time have to comply with the most recent emission standards. That is, they have to belong to the current active Euro category. Figure 1 provides a graphical representation of the evolution of standards from 1993 onwards.Footnote 9

Figure 1. Area B Traffic Ban
Note: Graphical representation of the impact of Area B. Yellow and dashed red cars are banned, while green cars can still circulate. All official details about Euro categories can be found on the EUR-Lex website at this link: https://eur-lex.europa.eu/homepage.html, searching by category.
The implementation of Area B began on February 25, 2019. In the first stage of the policy, the traffic ban applied to the following car models: Diesel-Euro0, 1, 2, and 3 (i.e., cars produced until the end of 2005), and Petrol-Euro0 (produced before January 1993). These car models are identified in yellow in Figure 1. Diesel-Euro4 cars, identified in dashed red, were added to the list of banned vehicles on October 1, 2019. These will constitute our main focus in the empirical analysis, where the aim is to compare owners of affected cars to owners of relatively similar-yet-unaffected cars.Footnote 10 Specifically, our treatment group will consist of owners of Diesel-Euro4 cars, while the control group will consist of Petrol-Euro4, Diesel-Euro5, and Petrol-Euro5 car owners.Footnote 11
In parallel with the traffic ban, a compensation scheme for the owners of banned vehicles was devised. Starting in April 2019, city residents affected by the ban could apply for compensation from the Municipality of Milan.Footnote 12 The initial 2019 call for compensation was open only to low-income car owners (i.e., with an adjusted household income below €25,000 per year, or €28,000 if aged 65+). In the next year, the income criterion was dropped, and hence the call was effectively open to all residents. The compensation scheme offered a variety of monetary incentives for affected car owners to purchase new or second-hand cars, motorcycles, and bikes, as well as public transport subscriptions.Footnote 13
The Political Context and the Debate Concerning Area B
Although the need for action had been made clear by the legal procedures at the EU level, the design and introduction of Area B was, and still remains, highly controversial, with supporters and opponents of the policy divided along partisan lines. On the left, mayor Sala, from the Democratic Party, emphasized the need to take immediate action and enact the Area B policy. On the right, representatives of Lega, widely considered the least environmentally conscious party in the Italian parliament, championed the opposition to Area B and embarked on a signature-gathering initiative to abolish the policy.Footnote 14
The Governor of Lombardy (Milan’s region) and prominent Lega member, Attilio Fontana, highlighted how Area B would place a disproportionate burden on the shoulders of relatively poorer citizens, who would suffer greatly from a reduction in their mobility. In his words: “Area B penalizes the weaker in society. Milan is becoming a city for the rich only.”Footnote 15 Along similar lines, Lega member of parliament, Fabrizio Cecchetti, accused the Democratic Party and mayor Sala as living “in their radical-chic world, without realizing what the real needs of Milan citizens are.”Footnote 16 Instead of Area B, Lega proposed some alternative measures to deal with the problem of pollution, ranging from increasing investment in public transportation to providing free filters with an improved technology to every vehicle owner, so as to reduce emissions without banning car circulation.
The intense political debate on the Area B policy has not lost much relevance in the Milan political debate. Since the initial implementation of the policy, with spurring demonstrations, protests, and legal actions, Area B has remained an electorally salient issue within the city, along with environmental issues in general.
The electoral trends of the last decade in Italy have seen the emergence of a strong and heterogeneous populist front, at the expense of more traditional parties on both sides of the left-right political space. Within this context, Lega has been one of the most successful forces. Under the leadership of Matteo Salvini, this populist right party went from being a regional party to being competitive on the whole national territory. It redefined its political platform by reducing its emphasis on federalism, and by focusing instead on opposition to immigration, austerity policies, regulations that could disrupt economic activities, and any limitation of sovereignty coming from European institutions. Pertinently, environmental concerns have received little attention in Lega’s new political platform. As an important case in point, in 2016, Lega members were the only Italian representatives in the European Parliament who voted against the ratification of the Paris Agreement. This new direction for the party appeared to pay electoral dividends: at the 2018 national elections Lega received a vote share of 17.4% (5.7 million votes), and at the 2019 elections for the European Parliament it received 34.3% (9.2 million votes), becoming the largest party in Italy.
At the same time, the social democratic party PD, which was part of the government coalitions between 2013 and 2018, saw its support dwindle. Pundits attribute this decline to a growing anti-elite sentiment in the Italian public, coupled with a fractured party leadership and an incoherent platform on a range of issues. Among the few issues on which the Democratic Party did adopt a clear progressive stance were climate change and protection of the environment. The national government led by the Democratic Party was a major proponent of Paris Agreement, on which it signed in 2016. Exploiting the absence of a strong green party in the Italian political arena, the PD made the fight against climate change and the transition to a greener economy one of its signature issues in both the 2018 and 2019 party manifestos.
EMPIRICAL APPROACH AND DATA
To assess the impact of the Area B car ban on residents’ environmental views and voting behavior, we administered a web-based survey of 1,073 car owners in Milan. The survey was carried out by YouGov in January 2021.Footnote 17 All survey respondents reside within Area B.Footnote 18 Within our sample, 293 respondents owned a Diesel-Euro4 car at the time in which the Area B policy was announced (July 2018), and constitute our “treatment” group of residents affected by the ban. As the main control group, we consider 412 owners of cars in three model categories—Petrol-Euro4, Petrol-Euro5, and Diesel-Euro5 cars—which are similar to Diesel-Euro4 cars in terms of emission category or fuel type, but were not covered by the traffic ban.Footnote 19 As another type of control group, we also interviewed 303 owners of new cars in the Euro6 category (both Diesel and Petrol). These car owners serve as a useful placebo test, for reasons we detail below.
Finally, 65 respondents did not know the fuel and/or emission category of their car, and were only able to report whether or not their car was affected by the Area B ban. Since these cars could be outside our target group of comparison (e.g., they could be older car models covered by the ban that we do not consider in our analysis), we estimate all specifications once without and once including those respondents. In the latter case, we allocate respondents to treatment and control based on their self-report on whether or not their car was affected by the ban. Our findings are robust to using either approach.
In cases where respondents owned more than one car, the survey question explicitly noted that the answers should pertain to their main personal car, that is, the one they used most often. Thus, we classify a respondent as treated if their main personal car at the time the policy was announced was included in the Area B ban.Footnote 20
To identify the effect of the Area B policy, our main analysis focuses on the owners of four car types: Diesel-Euro4 (treated), Petrol-Euro4, Diesel-Euro5, and Petrol-Euro5 cars. In selecting these four groups, our aim is to compare affected car owners to owners of relatively similar-yet-unaffected cars. We do so by estimating difference-in-differences specifications of the following form:
 $$ {\mathrm{Outcome}}_i={\displaystyle \begin{array}{l}\alpha +\beta {\mathrm{Diesel}}_i+\gamma \mathrm{Euro}{4}_i+\delta \mathrm{Diesel}\\ {}\times \mathrm{Euro}{4}_i+\theta {X}_i+{\varepsilon}_i,\end{array}} $$
where $ i $
denotes individual respondents,
$ i $
denotes individual respondents, $ {\mathrm{Outcome}}_i $
is either vote choice or individual attitudes and behavior.
$ {\mathrm{Outcome}}_i $
is either vote choice or individual attitudes and behavior. $ {\mathrm{Diesel}}_i $
is an indicator equal to one if respondent
$ {\mathrm{Diesel}}_i $
is an indicator equal to one if respondent $ i $
owned a diesel car at the time of the Area B policy announcement;
$ i $
owned a diesel car at the time of the Area B policy announcement; $ \mathrm{Euro}{4}_i $
is an indicator that equals 1 if respondent
$ \mathrm{Euro}{4}_i $
is an indicator that equals 1 if respondent $ i $
owned a Euro4 car at the time of policy announcement. These two fixed effects are meant to control for any potential differences in individual types that are related to owning diesel versus petrol, and Euro4 versus Euro5.Footnote 21 The
$ i $
owned a Euro4 car at the time of policy announcement. These two fixed effects are meant to control for any potential differences in individual types that are related to owning diesel versus petrol, and Euro4 versus Euro5.Footnote 21 The $ \mathrm{Diesel}\times \mathrm{Euro}{4}_i $
term identifies the treated car owners, that is, those who owned a Diesel-Euro4 car. Finally,
$ \mathrm{Diesel}\times \mathrm{Euro}{4}_i $
term identifies the treated car owners, that is, those who owned a Diesel-Euro4 car. Finally, $ {X}_i $
is a vector of individual controls, including age, gender, education, and income.
$ {X}_i $
is a vector of individual controls, including age, gender, education, and income.
The $ \delta $
coefficient captures the treatment effect of the policy. It can be interpreted in two ways, visualized in Figure 2. In the first interpretation (upper panel),
$ \delta $
coefficient captures the treatment effect of the policy. It can be interpreted in two ways, visualized in Figure 2. In the first interpretation (upper panel), $ \delta $
is the difference in the differences of outcomes by emission category, that is, between Diesel versus Petrol owners of Euro4, and Diesel versus Petrol owners of Euro5. The intuition underlying this estimation is as follows: all Euro5 owners are unaffected by the ban, so the difference between Diesel versus Petrol owners of Euro5 models should reflect potential differences in orientation by type of fuel. In the case of Euro4 cars, Diesel owners are treated while Petrol owners are not. The difference-in-differences then captures the effect of the policy, net of any potential difference in orientations between owners of Diesel and Petrol cars (under the assumption that these different orientations play a constant role across Euro4 and Euro5).
$ \delta $
is the difference in the differences of outcomes by emission category, that is, between Diesel versus Petrol owners of Euro4, and Diesel versus Petrol owners of Euro5. The intuition underlying this estimation is as follows: all Euro5 owners are unaffected by the ban, so the difference between Diesel versus Petrol owners of Euro5 models should reflect potential differences in orientation by type of fuel. In the case of Euro4 cars, Diesel owners are treated while Petrol owners are not. The difference-in-differences then captures the effect of the policy, net of any potential difference in orientations between owners of Diesel and Petrol cars (under the assumption that these different orientations play a constant role across Euro4 and Euro5).

Figure 2. Difference-in-Differences Approach
Note: Graphical representation of the impact of Area B. Dashed red cars are banned, while green cars can still circulate. All official details about Euro categories can be found on the EUR-Lex website at this link: https://eur-lex.europa.eu/homepage.html, searching by category.
In the second interpretation of the treatment effect (bottom panel), $ \delta $
represents the difference in the differences of outcomes by the car’s type of fuel, that is, between owners of Euro4 versus Euro5 Diesel cars, and between owners of Euro4 versus Euro5 Petrol cars. The underlying intuition, in this case, is as follows: all owners of petrol cars are unaffected, so the difference between Euro4 versus Euro5 among petrol owners should reflect only differences in orientation by emission category (e.g., older vs. newer cars). However, among owners of Diesel cars, only those who owned Euro4 models were treated by the ban, while owners of Euro5 models were not. Thus, the difference-in-differences captures the effect of the Area B policy, net of any potential difference in orientations between Euro4 and Euro5 owners (in this case, under the assumption that the different orientations play a constant role across Diesel and Petrol).
$ \delta $
represents the difference in the differences of outcomes by the car’s type of fuel, that is, between owners of Euro4 versus Euro5 Diesel cars, and between owners of Euro4 versus Euro5 Petrol cars. The underlying intuition, in this case, is as follows: all owners of petrol cars are unaffected, so the difference between Euro4 versus Euro5 among petrol owners should reflect only differences in orientation by emission category (e.g., older vs. newer cars). However, among owners of Diesel cars, only those who owned Euro4 models were treated by the ban, while owners of Euro5 models were not. Thus, the difference-in-differences captures the effect of the Area B policy, net of any potential difference in orientations between Euro4 and Euro5 owners (in this case, under the assumption that the different orientations play a constant role across Diesel and Petrol).
Table 1 compares the characteristics of the different groups of car owners in terms of their age, gender, education, and income. These are the same variables that we use as controls in the main analysis (i.e., vector $ {X}_i $
in Equation 1).Footnote 22 As the table makes clear, there are some differences across groups. In particular, Diesel-Euro4 car owners (i.e., the treatment group), are on average more educated, somewhat wealthier and under-represented among the very young and 55+ age groups.Footnote 23 Reassuringly, earlier studies (e.g., Colantone and Stanig Reference Colantone and Stanig2018) show that individuals with these characteristics tend to be less likely to support a radical-right party such as Lega. Hence, the composition of the treatment group should in fact work against finding a pro-Lega effect of the policy.Footnote 24 In line with this observation, our treatment effects are more precisely estimated when including individual-level controls.
$ {X}_i $
in Equation 1).Footnote 22 As the table makes clear, there are some differences across groups. In particular, Diesel-Euro4 car owners (i.e., the treatment group), are on average more educated, somewhat wealthier and under-represented among the very young and 55+ age groups.Footnote 23 Reassuringly, earlier studies (e.g., Colantone and Stanig Reference Colantone and Stanig2018) show that individuals with these characteristics tend to be less likely to support a radical-right party such as Lega. Hence, the composition of the treatment group should in fact work against finding a pro-Lega effect of the policy.Footnote 24 In line with this observation, our treatment effects are more precisely estimated when including individual-level controls.
Table 1. Descriptive Statistics of the Sample

Note: Descriptive statistics on the composition of the sample, overall and by type of car. All figures are shares, summing up to 1 within each column, by section.
Figure 3 shows descriptive evidence on the self-reported costs incurred by treated car owners due to the Area B policy. These costs were substantial, with about 16% reporting losses between 1.5 and 2.5 thousand euros; over 22% between 2.5 and 5 thousand, and another 19% above 5 thousand euros. Less than 10% reported no losses as a consequence of the introduction of the car ban, perhaps because their car had already an ex ante market value close to zero. Overall, treated car owners reported a significant cost as a result of the Area B policy, with the mid-point of the median category indicating a hefty loss of €3,750.

Figure 3. Cost of the Area B Policy
Note: Each bar represents the share of treated respondents reporting Area B costs in the range displayed on the left of the figure.
In an extension of the analysis, we also examine the relationship between receiving compensation from the Municipality and car owners’ response to the Area B ban. To this end, we code an indicator variable based on respondents’ self-report on whether or not they received compensation (of any kind) for substituting their cars. This measure, however, is not ideal, as we do not know the exact timing of the disbursement, that is, whether the compensation was actually received by the time the EU elections took place.Footnote 25 In other words, our indicator variable equals 1 if the respondent has received compensation at any point in time prior to the survey (January 2021), and zero otherwise. Therefore, as we emphasize in the results section, the estimated coefficient on this variable likely captures a mix of both actual and expected compensation.
RESULTS
Voting
Our main interest is in the impact of the Area B policy on individual vote choices. We focus on the May 2019 elections to the European Parliament, the sole elections that took place in Milan between the Area B policy announcement (July 2018) and the time of the survey (January 2021). At the time of these elections, the policy had been announced for almost a year. Importantly, EU Parliament elections tend to be fought largely on national political issues, by the same parties competing at the national elections (see, e.g., Reif and Schmitt Reference Reif and Schmitt1980; van der Eijk, Franklin, and Marsh Reference van der Eijk, Franklin and Marsh1996). Moreover, given that EU elections do not have direct consequences on the composition of national parliaments and governments, voters tend to vote less strategically than in national elections (Hobolt and Wittrock Reference Hobolt and Wittrock2011). Taken together, these two features make EU Parliament elections a good thermometer for parties’ electoral support and future prospects (Marsh Reference Marsh1998).
Our main dependent variable is an indicator that takes the value 1 if the respondent reports voting for Lega, and 0 otherwise. We also investigate potential treatment effects on support for other parties. In particular, to assess potential anti-incumbent effects, we examine support for the Democratic Party, the party of the city’s mayor.
To account for individual trajectories over time, we also collected information on respondents’ vote choice in three earlier elections that were held in Milan before the Area B policy was announced: legislative and regional elections held in March 2018, and municipal elections that took place in June 2016. This information allows us to: (1) control for past vote choice in the main analysis; (2) analyze the treatment effect on voters’ likelihood of switching parties; and (3) run placebo analyses on pre-trends (i.e., choices made before the treatment occurred).
Table 2 reports estimates of Equation 1 on voting. The dependent variable is a vote for Lega in the 2019 elections. The specification in column 1 does not include individual-level controls. These are introduced in column 2, which reports our benchmark estimates where we control for respondents’ age, gender, education, and income. In column 3, we reestimate the benchmark specification, this time including in the sample the additional respondents who were unable to report the type of fuel and/or emission category of their car. We assign these respondents to treatment or control based on their self-reports of whether or not their car was affected by the ban. In columns 4–6, we replicate the benchmark specification of column (2) and add to it indicators that denote a vote for Lega in one of the three previous elections, respectively.Footnote 26
Table 2. Voting for Lega in EU Elections of 2019

Note: Columns 2–6 report estimates from regression models that include controls for age and gender, as well as fixed effects for education levels and income brackets. Column 3 includes respondents that did not report their car’s fuel and/or emission category. Columns 4–6 include dummies for past Lega vote in legislative, regional, and municipal elections, respectively. Robust standard errors are in parentheses. *p $ < $
0.05; **p
$ < $
0.05; **p $ < $
0.01.
$ < $
0.01.
The treatment effect in Equation 1 is captured by the parameter $ \delta $
, that is, the coefficient on the interaction term
$ \delta $
, that is, the coefficient on the interaction term $ \mathrm{Diesel}\times \mathrm{Euro}4 $
. This coefficient is positive across the board, and precisely estimated when including individual controls. The only exception is column 5, where the coefficient is only significant at the 10% level. In terms of magnitude, the average estimated effect is 13.5 percentage points, a substantively sizable shift considering that the baseline rate of support for Lega in the sample was 24.4%. Put differently, owning a car affected by the vehicle ban raised the probability of voting for Lega in the subsequent elections by 55% above the baseline rate. Given the standard errors, the actual increase in vote for Lega could of course be smaller, albeit still statistically significant.Footnote 27
$ \mathrm{Diesel}\times \mathrm{Euro}4 $
. This coefficient is positive across the board, and precisely estimated when including individual controls. The only exception is column 5, where the coefficient is only significant at the 10% level. In terms of magnitude, the average estimated effect is 13.5 percentage points, a substantively sizable shift considering that the baseline rate of support for Lega in the sample was 24.4%. Put differently, owning a car affected by the vehicle ban raised the probability of voting for Lega in the subsequent elections by 55% above the baseline rate. Given the standard errors, the actual increase in vote for Lega could of course be smaller, albeit still statistically significant.Footnote 27
Interestingly, the indicators for Diesel and Euro4 are never significant, showing no systematic differences in voting preferences as a function of the type of fuel or emission category itself. In contrast, the three indicators for past Lega vote in columns 4–6 are positive and highly significant, as one would expect. In fact, their estimated coefficients suggest a relatively high degree of persistence in support for Lega.
So far we have examined the empirical relationship between owning a car banned by the Area B policy and vote for Lega. Next, we use the information on voting preferences in earlier elections to analyze the probability of the policy leading residents to switch their votes from other parties to Lega. Results are reported in Figure 4. In panel a, we focus on respondents who: (1) voted both in the legislative elections of 2018 and in the EU elections of 2019; and (2) did not vote for Lega in the legislative elections of 2018. The dependent variable is an indicator equal to one if the respondent switches to Lega in the first elections after the Area B policy is introduced. From left to right, the specifications in the three coefficient plots follow columns 1–3 of Table 2, that is, excluding individual controls, including them (our benchmark specification), and including respondents with missing car details. Panels b and c replicate the same approach as in panel a, but focus on switching from regional elections of 2018 and municipal elections of 2016, respectively. Consistent with the previous analysis, the coefficient on the interaction term $ \mathrm{Diesel}\times \mathrm{Euro}4 $
is positive and significant in all specifications. Note that the indicators for Diesel and Euro4 are never significant.
$ \mathrm{Diesel}\times \mathrm{Euro}4 $
is positive and significant in all specifications. Note that the indicators for Diesel and Euro4 are never significant.

Figure 4. Switching to Lega in 2019
Note: Coefficient estimates refer to regressions where the dependent variable is an indicator for vote switching to Lega in 2019. Each panel refers to a different earlier election, and reports three different specifications, as in columns 1–3 of Table 2. The bars are 95% CIs. Full results are in Supplementary Table SI-2.
The benchmark estimates indicate that being affected by the traffic ban raises the probability of switching to Lega by about 15 percentage points when using the two elections of 2018 as the baseline, and by 18.6 points if the baseline is the municipal elections of 2016. These effects are substantively large, implying more than a twofold increase in the probability of switching above the baseline rate.Footnote 28
To examine whether this effect was unique to Lega, Table 3 shows the electoral impact of the policy on the three other major parties competing in the 2019 elections: the center-left Democratic Party; the mainstream-right Forza Italia; and the populist left Five Star Movement. For each party, we report the benchmark specification with controls, as in column 2 of Table 2, and three additional specifications where we control for past vote in each earlier election.Footnote 29 The estimated treatment effects are never statistically different from zero, suggesting that the policy had no discernible impact on voting for these parties. The null result on the Democratic Party is particularly interesting, as it suggests that voters did not penalize the party of the incumbent mayor, who was directly accountable for the introduction of the traffic ban.
Table 3. Voting for Other Major Parties in EU Elections of 2019

Note: All columns report estimates from regression models that include controls for age and gender, as well as fixed effects for education levels and income brackets. Columns 2–4, 6–8, and 10–12 include dummies for past vote in legislative, regional, and municipal elections, respectively. Robust standard errors are in parentheses. *p $ < $
0.05; **p
$ < $
0.05; **p $ < $
0.01.
$ < $
0.01.
The question these findings raise, then, is where the switchers to Lega came from. To address this question, Figure 5 provides descriptive evidence on the electoral flows in our sample, from the legislative elections of 2018 to the EU elections of 2019.Footnote 30 As the figure shows, only a tiny fraction of Lega voters in 2019 did not vote in the earlier elections; 3% of switchers toward Lega came from the Democratic Party; 18% were previously voters of the Five Star Movement, and 16% were former supporters of Forza Italia. An additional 7% of the Lega vote came from Brothers of Italy, another populist right party. The bulk of switchers, 49%, came from “Other” parties, namely small outfits that were not specified in our list of eight possible options.

Figure 5. Electoral Flows from Legislative 2018
Note: The figure reports electoral flows from the legislative elections of 2018 (left side) to the EU elections of 2019 (right side).
To further tease out this finding, in Supplementary Table SI-12, we provide a full list of the “other” parties, by elections, along with their official vote share in the city of Milan and their ideological position. The extreme right is well represented in the group (e.g., the well-known “CasaPound”); other ideological positions are also represented, including the extreme left (e.g., “Potere al Popolo”).
Overall, our evidence indicates that the response to the Area B policy was not a shift of center-left Democratic voters toward Lega. Rather, it seems to reflect a coalescence of people who had voted before, but not for any of the main parties.Footnote 31 These voters rallied in support of the populist right party that represented the most visible and vocal opposition to the new policy that adversely affected them.
More generally, our results highlight the fact that the introduction of green policies may induce a backlash in different ways. In addition to an anti-incumbent response, as found by Stokes (Reference Stokes2016), the backlash may also take the form of rising support for green-skeptical parties. This could occur even without a drop in support for the incumbent, and nonetheless hamper the political basis of environmental action.
Robustness
To further substantiate a causal interpretation of our findings, we perform several placebo tests. The first test is one where we analyze the impact of the policy in a similar way as we have done before, only in this case, we compare owners of Euro5 and the newer Euro6 cars, that is, all cars that were not affected by the Area B ban.
Table 4. Vote Lega EU 2019—EURO 5-6

Note: Estimates of Equation 2. Robust standard errors are in parentheses. *p $ < $
0.05; **p
$ < $
0.05; **p $ < $
0.01.
$ < $
0.01.
Table 4 reports estimates of the following specification:
 $$ \mathrm{Vote}\_\mathrm{Lega}\_\mathrm{EU}{2019}_i={\displaystyle \begin{array}{l}\alpha +\beta {\mathrm{Diesel}}_i+\gamma \mathrm{Euro}{5}_i\\ {}\hskip-1pt +\hskip2pt \delta \mathrm{Diesel}\times \hskip-1pt \mathrm{Euro}{5}_i\hskip-1pt +\hskip-1pt \theta {X}_i+{\varepsilon}_i.\end{array}} $$
Compared to the baseline specification in Equation 1, here the $ \delta $
parameter would capture potentially different voting behavior by owners of Diesel-Euro5 cars, compared to owners of Petrol-Euro5 cars and owners of Euro6 cars, both Diesel and Petrol. As noted, none of these cars were affected by the Area B traffic ban. Hence, in this case, Diesel-Euro5 car owners constitute a “fake” treatment group. If we were to find a positive and significant estimate of the
$ \delta $
parameter would capture potentially different voting behavior by owners of Diesel-Euro5 cars, compared to owners of Petrol-Euro5 cars and owners of Euro6 cars, both Diesel and Petrol. As noted, none of these cars were affected by the Area B traffic ban. Hence, in this case, Diesel-Euro5 car owners constitute a “fake” treatment group. If we were to find a positive and significant estimate of the $ \delta $
parameter, it would be concerning as it would suggest the presence of a general shift toward Lega among owners of relatively older diesel cars, independent from the impact of the Area B policy. Reassuringly, that is not the case: the
$ \delta $
parameter, it would be concerning as it would suggest the presence of a general shift toward Lega among owners of relatively older diesel cars, independent from the impact of the Area B policy. Reassuringly, that is not the case: the $ \delta $
estimates reported in Table 4 are not statistically distinguishable from zero, showing a pattern that is very different from the one we observe with the real treatment group.
$ \delta $
estimates reported in Table 4 are not statistically distinguishable from zero, showing a pattern that is very different from the one we observe with the real treatment group.
As a second robustness test, we focus on pre-trends. In Figure 6, we return to the baseline estimation of Equation 1, where we compare Diesel-Euro4 car owners, affected by the traffic ban, to unaffected owners of Petrol-Euro4 and Euro5 cars, both Diesel and Petrol. As before, we examine the probability of vote switching toward Lega from one election to the other, similar to the analysis presented in Figure 4. However, in this case, we consider vote switching over elections that were held before the announcement of the Area B policy. Specifically, in the left panel, the dependent variable is an indicator variable that equals 1 if the respondent switches to Lega in the legislative elections of 2018, coming from a vote to another party in the municipal elections of 2016; in the right panel, the dependent variable captures switching to Lega from the municipal elections of 2016 to the regional elections of 2018. Positive and significant estimates of the $ \delta $
parameter would raise concerns, as they would point to a shift toward Lega by Diesel-Euro4 car owners that pre-dates the announcement of the Area B policy. This would constitute a violation of the parallel trends assumption of the diff-in-diff analysis. Reassuringly, the
$ \delta $
parameter would raise concerns, as they would point to a shift toward Lega by Diesel-Euro4 car owners that pre-dates the announcement of the Area B policy. This would constitute a violation of the parallel trends assumption of the diff-in-diff analysis. Reassuringly, the $ \delta $
estimates reported in Figure 6 are always close to zero and well below statistical significance.
$ \delta $
estimates reported in Figure 6 are always close to zero and well below statistical significance.

Figure 6. Vote Switching Before Area B
Note: Treatment effect estimates from regressions where the dependent variable is an indicator for vote switching to Lega before Area B. Each panel considers switching between different elections and reports results from three different specifications, as in columns 1–3 of Table 2. The bars are 95% CIs. Full results are in Supplementary Table SI-3.
Mechanisms
Having analyzed the treatment effects of Area B on voting, we now turn to investigate possible mechanisms through which the traffic ban may have raised support for the populist right party Lega. We focus on two potential mechanisms, that are not mutually exclusive. First, exposure to the traffic ban may have induced a shift toward less environment-friendly attitudes and behavior, which in turn translated into higher support for Lega, a party widely recognized for its skepticism toward the environmental agenda (Atkins and Menga Reference Atkins and Menga2022; Bulli Reference Bulli2019; Valbruzzi et al. Reference Valbruzzi, Martinelli, Panaro and Soliman2019).
A second potential mechanism holds that being affected by the traffic ban may have generated hostility not to environmentalism in general, but specifically to a green policy approach that places disproportionate costs on a narrow group of people. Such a shift in views could tilt voters toward Lega, the most vocal opponent of the Area B policy. Importantly, and as noted earlier, Lega did not actually deny the need for taking some action to reduce air pollution in the city of Milan; instead, its criticism centered on the specific design of the Area B policy, which concentrated heavy losses on some, particularly less well-off citizens.
Evidence in line with the first mechanism could be read with pessimism regarding the prospects of the green agenda. Indeed, if citizens adversely affected by a specific green policy tend to become more generally opposed to environmentalism, in attitudes or behavior, this would create new hurdles in the effort to advance the green transition. Evidence in line with the second mechanism would be somewhat more encouraging, as it would suggest that measures that soften the distributional implications of green policies would increase their public acceptability.
To evaluate the first mechanism, we examine the impact of the Area B policy on residents’ environmental views and behavior. The top panel of Figure 7 reports estimated treatment effects based on the specification outlined in Equation 1, with individual controls as in the benchmark specification of column 2 in Table 2. The dependent variables are reported on the left of the panel, beside each $ \delta $
coefficient estimate. Beginning at the top of the figure, the first four rows focus on the policy’s impact on environment-friendly behavior. Specifically, the dependent variables reflect respondents’ report of how frequently—on a five-point scale ranging from “never” to “always”—they carry out each of the following: (1) buy products made using recycled materials and/or packaged without plastic; (2) take short showers; (3) use home appliances in Eco mode; and (4) use reusable bottles for water. All the estimated effects are nonsignificant, indicating no systematic differences in behavior between car owners in the treatment and control groups.
$ \delta $
coefficient estimate. Beginning at the top of the figure, the first four rows focus on the policy’s impact on environment-friendly behavior. Specifically, the dependent variables reflect respondents’ report of how frequently—on a five-point scale ranging from “never” to “always”—they carry out each of the following: (1) buy products made using recycled materials and/or packaged without plastic; (2) take short showers; (3) use home appliances in Eco mode; and (4) use reusable bottles for water. All the estimated effects are nonsignificant, indicating no systematic differences in behavior between car owners in the treatment and control groups.
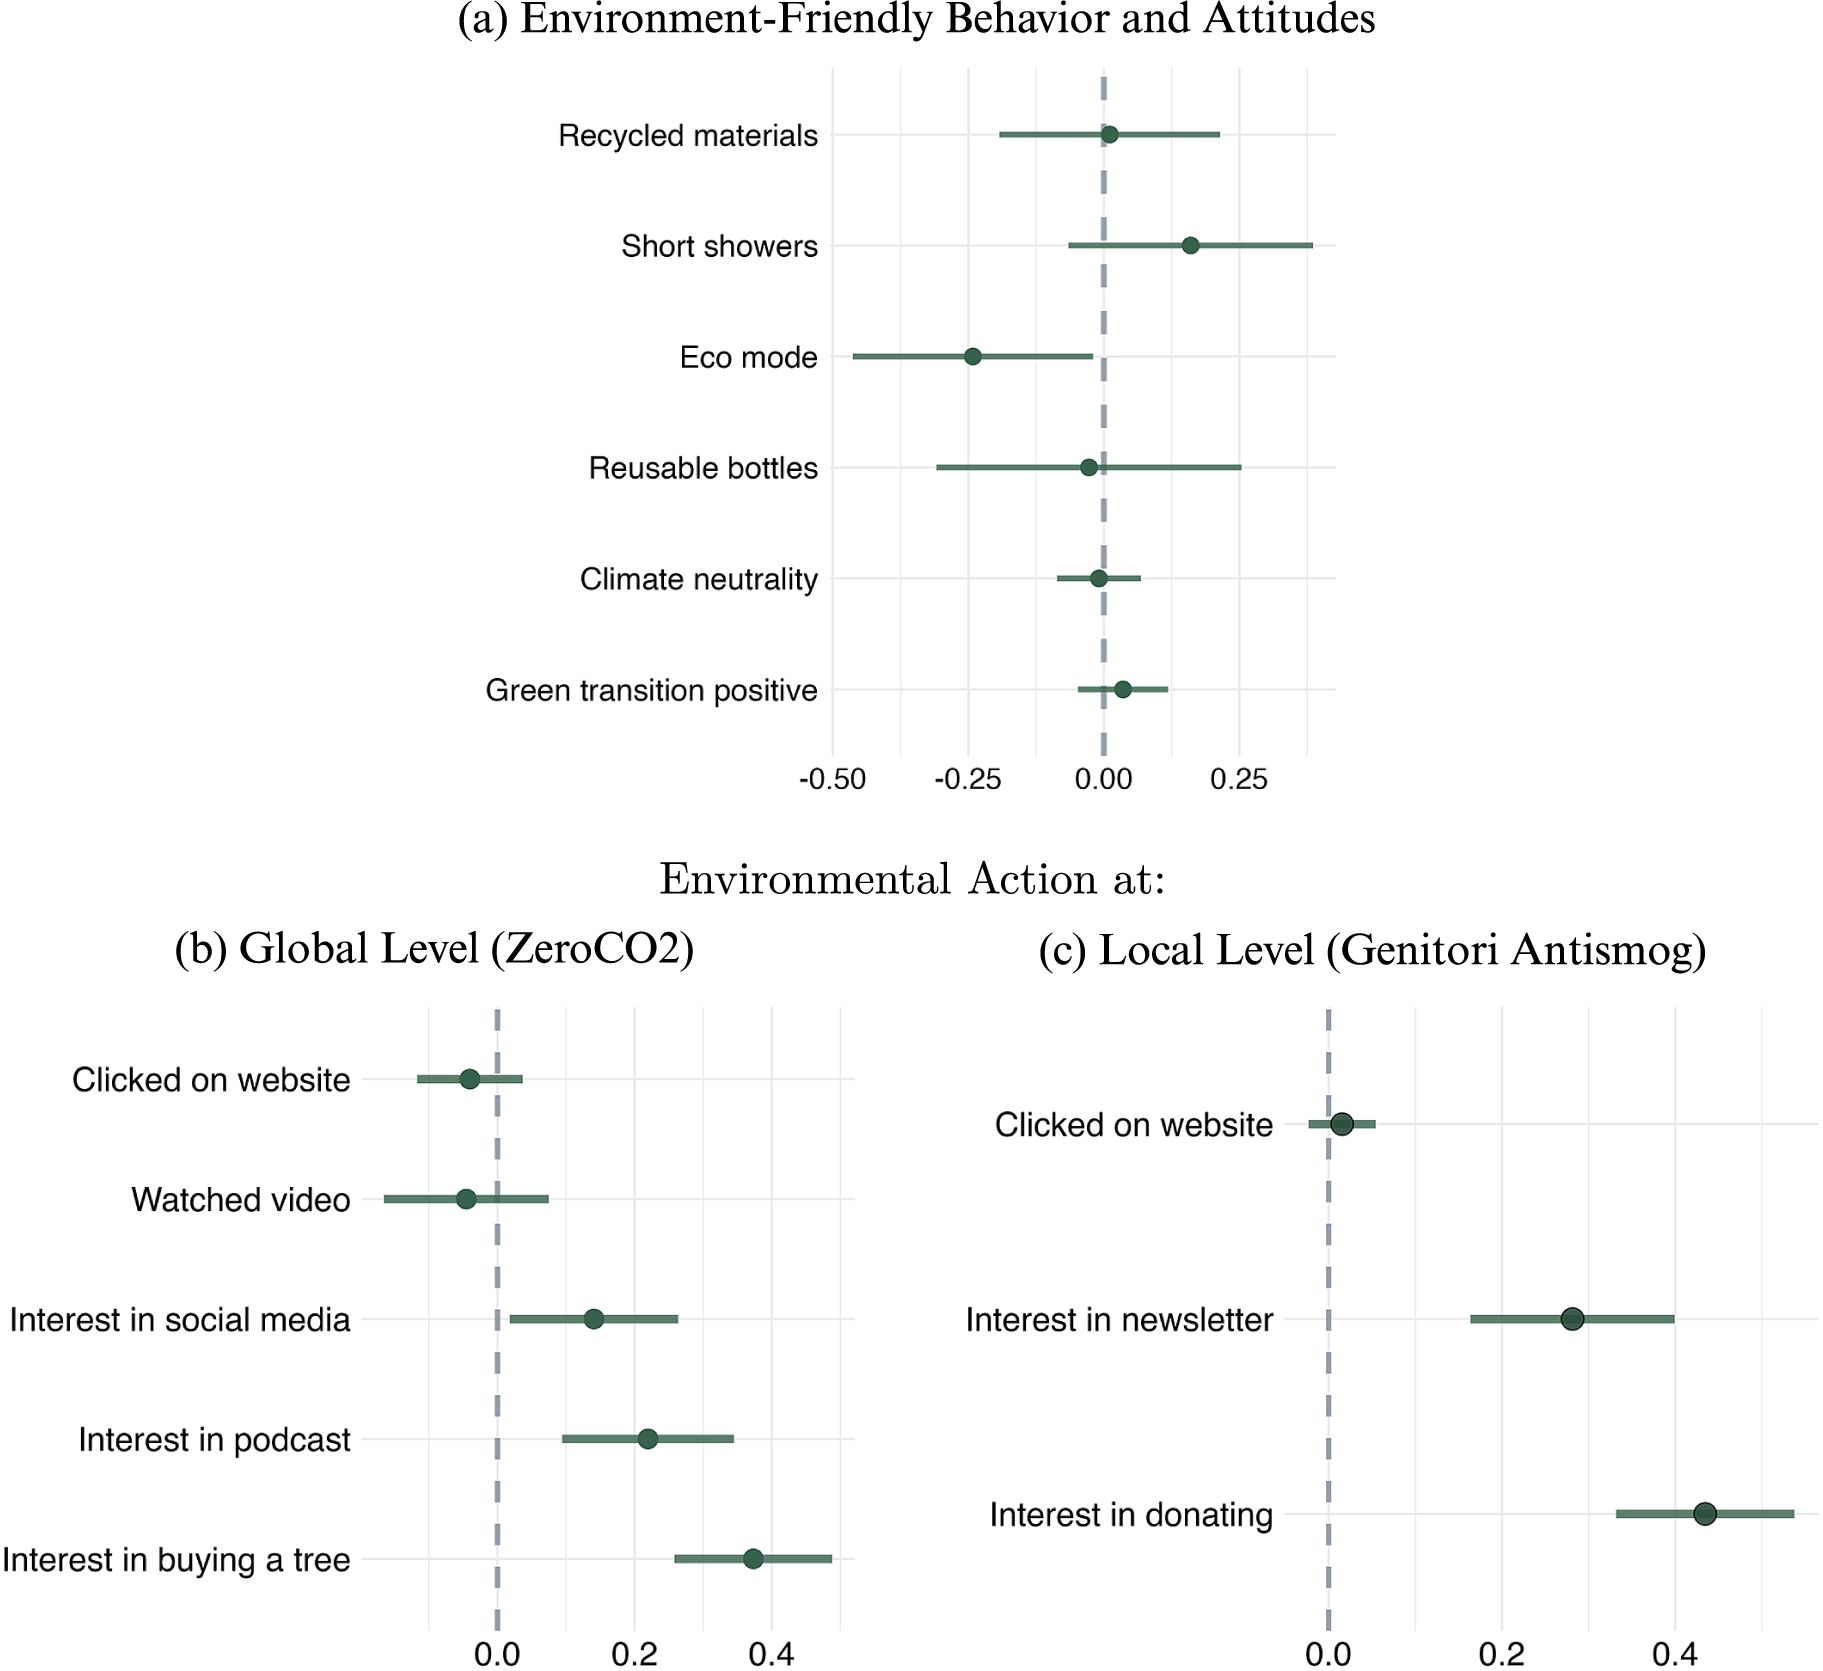
Figure 7. Environmentalism
Note: All panels of this figure report estimated treatment effects according to the benchmark specification of column 2 in Table 2. Dependent variables are indicated on the left of each panel, in correspondence of each coefficient. The bars are 95% CIs. Full results are in Supplementary Tables SI-4–SI-6.
Turning to attitudes, the dependent variable in row 5 is an indicator that equals 1 if the respondent partially or fully agrees with the statement that the government and local institutions should adopt emission-reducing initiatives aimed at achieving climate neutrality in Italy by 2050. In row 6, we consider agreement with the statement that adoption of green policies against pollution and climate change will have a “very positive” impact on citizens. In both cases the estimated effects are very small and not statistically distinguishable from zero, indicating no systematic differences in attitudes on those issues between treated and nontreated respondents.
To further understand how Area B affected locals’ environmental stance, we also embedded in the survey two more behavioral measures. These were designed to shed light on the impact of Area B on respondents’ concern with environmental action at the global versus the local level. Indeed, incurring high costs due to Area B could in theory have turned residents against local air quality concerns while maintaining interest in, and support for, climate action at the global scale.
The first set of quasi-behavioral measures is based on a collaboration with ZeroCO2, a company that offers customers the option of reducing their carbon footprint by paying for the planting of trees in their name in various parts of the world, an action that helps reduce CO2 concentration in the atmosphere.Footnote 32 After providing information about the company and its services, we prompted respondents with the option to: (1) click on the company’s website; (2) watch a short video (40 seconds) about the company; express interest in: (3) following the company’s page on social media (e.g., Instagram); (4) listening to the company’s podcast on environmental sustainability; or (5) planting a tree at a price of €13.6 (discounted by 15% compared to the normal price of €16 charged by ZeroCO2 for pine trees). If people adversely affected by the Area B policy grew consequently more hostile to environmentalism, we would expect them to exhibit less interest in the services offered by ZeroCO2.
Panel b of Figure 7 displays the estimated treatment effects on five indicators based on the survey items just described. All estimates refer to the benchmark specification outlined in Equation 1. As the figure shows, treated respondents were as likely as others to click on ZeroCO2’s website, and to watch the video about the company. However, they were more likely to express an interest in purchasing a tree, as well as in listening to the company’s podcast or in following the company on social media.Footnote 33
Very similar evidence emerges from a second study embedded in the survey. In this case, we investigate potential shifts in attitudes and behavior concerning environmental action at the local level, within a context that is more closely related to the Area B policy. Specifically, we drew respondents’ attention to Genitori Antismog (Italian for “antismog parents”), a nonpartisan association that has been active in Milan for about twenty years, and has two main goals: (1) encourage politicians to tackle air pollution in Milan by acting as a watchdog on legislative initiatives; and (2) informing citizens on environmental issues, with specific attention to children via collaborations with local schools. In this case, we prompted respondents with the options to: (1) click on the association’s website; and express interest in: (2) subscribing to its newsletter; or (3) donating money to the association. Panel c of Figure 7 displays the estimated treatment effects on these three outcomes, using the benchmark specification. As the figure shows, treated respondents were as likely as others to click on the association’s website, but were significantly more likely to express interest in subscribing to the newsletter and donating to the association.
In sum, these results indicate that owning a car banned by the Area B policy did not make residents more hostile to environmental issues in terms of attitudes or behavior. If anything, treated respondents appear to display a higher degree of interest in environmental action, suggesting that personal exposure to the ban may have increased their awareness of, or concern with, environmental issues. Overall then, an anti-green shift in attitudes and behavior does not seem to be the main channel through which exposure to Area B translated into higher support for Lega.
Next, we examine the second mechanism: disaffection from a policy approach that places the transition costs on a small segment of residents, leading them to vote for Area B’s chief opposition. To assess this explanation, in the top row of Figure 8 the dependent variable is an indicator that takes the value 1 if the respondent partially or fully agrees with the statement that preserving the environment is the “responsibility of governments and big firms more than of citizens.” The treatment effect is positive and precisely estimated, indicating that those hurt by the car ban were a whopping 36 percentage points more likely to share this view. In the central row, the dependent variable is an indicator that equals 1 if the respondent is (“somewhat” or “very”) willing to pay higher taxes in order to finance public initiatives aimed at preserving the environment. The treatment effect is again positive, but imprecisely estimated. The same applies to the bottom row, where the dependent variable is an indicator denoting if the respondent is willing to pay more for environment-friendly goods and services (13.2 pp, p < 0.1).

Figure 8. Prices, Taxes, and Responsibility
Note: Treatment effect estimates according to the benchmark specification of column 2 in Table 2. Dependent variables are indicated on the left of the figure, in correspondence of each coefficient. The bars are 95% CIs. Full results are in Supplementary Table SI-7.
Overall, car owners affected by the ban appear more likely to support an active role of government and big firms for environmental action, even if this entails higher taxes, or higher prices to be paid for environment-friendly goods and services. These findings suggest a preference for a different approach to green policies, such as financing them in a more progressive fashion, perhaps through the general tax system.
In line with Lega’s stance on these issues, the political reaction of affected drivers appears to reflect dissatisfaction with the pocketbook losses they incurred. Table 5 provides further evidence consistent with this interpretation. Specifically, in column 1 we augment the benchmark specification of column 2 in Table 2 with an indicator variable $ \mathrm{Compensated} $
, which is equal to 1 for treated respondents who have received economic support from the Municipality of Milan for substituting their cars (and zero otherwise). In columns 2–4, we proceed in the same way with the benchmark specification used in Figure 4, where we consider vote switching toward Lega from earlier elections.
$ \mathrm{Compensated} $
, which is equal to 1 for treated respondents who have received economic support from the Municipality of Milan for substituting their cars (and zero otherwise). In columns 2–4, we proceed in the same way with the benchmark specification used in Figure 4, where we consider vote switching toward Lega from earlier elections.
Table 5. Compensation

Note: In column 1, the dependent variable is an indicator for voting Lega in the EU elections of 2019. In columns 2–4, the dependent variables are indicators for switching to Lega from the legislative 2018, regional 2018, and municipal elections 2016, respectively. All regressions include individual controls, as in the benchmark specification of column 2 in Table 2. Robust standard errors are in parentheses. *p $ < $
0.05; **p
$ < $
0.05; **p $ < $
0.01.
$ < $
0.01.
As the table shows, the treatment effect remains positive and precisely estimated in all columns. At the same time, the compensation indicator is always negative and significant, and has a similar magnitude as the treatment effect. This suggests that treated respondents who received economic support were not more likely than respondents in the control group to shift to Lega. This finding, however, should be interpreted with caution, for two main reasons. First, as explained earlier, our survey includes information about whether respondents received compensation from the Municipality by the time of the survey, but we do not know whether it was received prior to the date of the election itself. Thus, the estimated coefficient on the $ \mathrm{Compensated} $
variable likely captures a mix of both actual and expected compensation. Second, receiving municipal support required a formal application process, which raises a potential issue of selection into compensation. For instance, awareness of the existence of the compensation scheme, as well as willingness to apply for it, may vary along individual characteristics (education, social connectedness, or partisan inclinations). Still, examination of the Municipality’s two calls suggests that it is highly unlikely that the compensation mechanism was targeted at the incumbent’s constituency. In fact, the conditions included in the 2019 call favored low-income residents, who are if anything closer to Lega than the Democratic Party (De Sio Reference De Sio2018; Guiso et al. Reference Guiso, Herrera, Morelli and Sonno2017).
$ \mathrm{Compensated} $
variable likely captures a mix of both actual and expected compensation. Second, receiving municipal support required a formal application process, which raises a potential issue of selection into compensation. For instance, awareness of the existence of the compensation scheme, as well as willingness to apply for it, may vary along individual characteristics (education, social connectedness, or partisan inclinations). Still, examination of the Municipality’s two calls suggests that it is highly unlikely that the compensation mechanism was targeted at the incumbent’s constituency. In fact, the conditions included in the 2019 call favored low-income residents, who are if anything closer to Lega than the Democratic Party (De Sio Reference De Sio2018; Guiso et al. Reference Guiso, Herrera, Morelli and Sonno2017).
Overall then, with these caveats in mind, our results are consistent with the idea that devising proper compensation schemes, that are sufficiently advertised and widely accessible to citizens, can be a useful way to increase the acceptability and political sustainability of green policies.
Our findings are also consistent with the view that issues related to social justice and fairness are central to populist mobilization (see, e.g., Altomonte, Gennaro, and Passarelli Reference Altomonte, Gennaro and Passarelli2019; Betz Reference Betz, Hawkins, Carlin, Littvay and Kaltwasser2019). In this respect, Lega’s opposition to the Area B policy seems to have been appealing to the narrow segment of citizens who felt they were bearing a disproportionate share of the policy’s cost. Along with the pecuniary grievance, affected citizens may have also perceived the policy as singling them out as those most responsible for pollution in the city. This sentiment may have reinforced the shift toward Lega, a party that explicitly criticized the inherently unfair design of the policy. As emphasized for instance by Betz (Reference Betz2021), Franzese (Reference Franzese2019), Frieden (Reference Frieden, Obstfeld and Catão2019), and Gidron and Hall (Reference Gidron and Hall2017), when it comes to social justice and populism, issues of recognition, dignity, and status also play a prominent role.
CONCLUSION
Despite momentous consequences at stake, political leaders are struggling to take the actions needed to deal with the threat of environmental degradation and climate change. One common explanation is that many of the necessary actions entail substantial transition costs, and place burdens on the public that politicians fear would generate significant political blowback. Yet we know strikingly little on citizens’ actual electoral response when costs are imposed on them due to environmental policies. This study offers new insight on this question.
Examining the impact of Area B, a vehicle ban in Milan, we find that car owners who incurred sizable pecuniary losses due to the ban were significantly more likely in the next elections to vote for Lega, a populist right party and chief critic of the policy. Also, for affected residents who voted for other parties in earlier elections, the likelihood of switching to Lega was significantly higher.
These findings highlight the electoral incentives politicians may see in opposing certain green policies and criticizing their economic repercussions. In cases where voters face pecuniary losses from such policies, the electoral implications can be significant. The agenda associated with right-wing populist parties—skepticism toward scientific expertise, disdain of multilateral efforts, and its mantle as representing the interests of the common people—situates them well to gain from a potential backlash against green policies.
Notably, our evidence indicates that the electoral shift to Lega did not happen because affected car owners adopted a more hostile stance toward environmental issues in general. In fact, we find some evidence that, if anything, those car owners adopted more environment-friendly views. This pattern is consistent with recent evidence regarding members of the aforementioned “Yellow Vests” movement in France. Using survey evidence, Bedock et al. (Reference Bedock, Bendali, de Raymond, Beurier, Blavier, Bonin and Courty2019) find that despite their opposition to the fuel tax, Yellow Vest activists expressed significant concern with ecological issues and supported various green policies. What they demanded, however, was greater fairness in the way such policies were designed and implemented.Footnote 34 Our results also suggest that political opposition to green policies does not necessarily stem from a general disregard of the environmental threat.
Overall, the analysis indicates that the electoral shift induced by Area B reflected a pocketbook response and disaffection with the policy approach perceived to impose the high transition costs on a narrow subset of the public. In line with this pattern, we also find that car owners who received financial assistance from the municipality to defray the costs of the car ban were not more likely to switch to Lega than unaffected car owners.
One possible, perhaps contentious implication of these findings, is that if policymakers seek to make meaningful progress on central environmental goals (e.g., 1.5C target), they should be very cognizant of the political trade-offs that green policies entail. Whereas some policies may offer a desirable environmental benefit, if they trigger a political backlash that puts in power parties opposed to the green agenda, advancing these policies may prove detrimental to the broader cause of environmental protection.
In fact, it is hard to overstate the importance of considering the political aspects of the transition to a greener economy. Take for example the workers employed by companies that extract, refine, distribute, and produce electricity from fossil fuels. In 2019, that number in the U.S. alone was approximately 2.8 million (Hanson Reference Hanson2021). This figure is comparable on per capita basis also in other countries, such as Australia and the UK. If the livelihoods of these workers and their families will come under threat due to a transition to cleaner energy sources, without sufficient policies in place to cushion the blow, the political backlash could be substantial. Indeed, as our findings show, even when dealing with a green policy designed to provide a tangible improvement to residents’ well-being, those made to incur sizable economic sacrifices responded electorally in a swift and clear manner.
In the coming years, transitioning toward a greener economy will necessitate policies that entail different costs to different groups of people. To build and maintain political support for environmental action, the design of the distributional repercussions of those policies will be crucial, as without broad popular backing the battle for environmental protection will be that much harder.
SUPPLEMENTARY MATERIALS
To view supplementary material for this article, please visit http://doi.org/10.1017/S0003055423000308.
DATA AVAILABILITY STATEMENT
Research documentation and data that support the findings of this study are openly available at the American Political Science Review Dataverse: https://doi.org/10.7910/DVN/NSC8TJ.
ACKNOWLEDGMENTS
We thank Guido Ardizzone, Maria Carmela Attolini, Charlotte Sophia Bez, Lorenzo Cavaglià, Enrico Cavallotti, Nicolò Cobianchi, Yuri Filippone, Laura Olivero, Lilia Patrignani, and Shir Raviv for excellent research assistance. We thank Paolo Agnolin, Hans-Georg Betz, Vincenzo Galasso, Laura Grigolon, Marc Guinjoan, Jens Hainmueller, Ro’ee Levy, Gian Maria Mallarino, Henrique Marques, Elena Marseglia, Alessandro Olper, Vinicius Diniz Schuabb, Piero Stanig, Francesco Vona, seminar participants at Bocconi University, Haifa, Namur, Stanford, Tel Aviv, Verona, Vienna Institute for International Economic Studies, Yale, the editor, Elisabeth Jean Wood, and three anonymous referees for insightful comments. Y.M. gratefully acknowledges financial support from the Israel Science Foundation (Grant No. 2079/19). The usual disclaimer applies.
FUNDING STATEMENT
The research was funded in part by the Israel Science Foundation (Grant No. 2079/19).
CONFLICT OF INTEREST
The authors declare no ethical issues or conflicts of interest in this research.
ETHICAL STANDARDS
The authors declare the human subjects research in this article was reviewed and approved by Tel Aviv University’s IRB and certificate numbers are provided in the text. The authors affirm that this article adheres to the APSA’s Principles and Guidance on Human Subject Research.


 Open access
Comments
No Comments have been published for this article.