


1. Introduction
Engineering design is a complex activity (Soria Zurita & Tumer Reference Soria Zurita and Tumer2017; Song et al. Reference Song, Soria Zurita, Nolte, Singh, Cagan and McComb2021; Xu et al. Reference Xu, Hong, Soria Zurita, Gyory, Stump, Nolte, Cagan and McComb2023) because it often requires the integration of knowledge and skills from multiple domains (Borsato & Peruzzini Reference Borsato, Peruzzini, Stjepandić, Wognum and Verhagen2015). Prior research has found that interdisciplinary collaboration also facilitates innovation (Sosa Reference Sosa2011; Caccamo, Pittino, & Tell Reference Caccamo, Pittino and Tell2023). For this reason, collaborative engineering and collaborative engineering design are widely studied and deployed (Favela, Wong, & Chakravarthy Reference Favela, Wong and Chakravarthy1993; Kolfschoten & de Vreede Reference Kolfschoten, de Vreede, Haake, Ochoa and Cechich2007; Lu et al. Reference Lu, Elmaraghy, Schuh and Wilhelm2007; Borsato & Peruzzini Reference Borsato, Peruzzini, Stjepandić, Wognum and Verhagen2015; Putnik et al. Reference Putnik, Putnik, Shah, Varela, Ferreira, Castro, Catia and Pinheiro2021). When employed effectively, collaborative engineering design practices can improve team outcomes, including productivity and member satisfaction (Kolfschoten & de Vreede Reference Kolfschoten, de Vreede, Haake, Ochoa and Cechich2007).
However, collaborative engineering is only effective if shared understanding is developed among the team. Adopting the work by Bittner and Leimeister, we define shared understanding as “the degree to which people concur on the value of properties, the interpretation of concepts, and the mental models of cause and effect with respect to an object of understanding” (Bittner & Leimeister Reference Bittner and Leimeister2014). Shared understanding, defined in this way, has been shown to be an essential factor for successful team collaboration (Valkenburg Reference Valkenburg1998; Bittner & Leimeister Reference Bittner and Leimeister2014; Gomes, Tzortzopoulos, & Kagioglou Reference Gomes, Tzortzopoulos and Kagioglou2016).
Boundary objects are a common tool for achieving shared understanding in teams. Boundary objects are artifacts used to convey information and bridge gaps in knowledge domains between different communities (Star & Griesemer Reference Star and Griesemer1989; Marheineke, Velamuri, & Möslein Reference Marheineke, Velamuri and Möslein2016). Boundary objects facilitate information exchange and help people convey ideas by serving as the common ground for further communication and collaboration in engineering design practices (Subrahmanian et al. Reference Subrahmanian, Monarch, Konda, Granger, Milliken and Westerberg2003; Mark, Lyytinen, & Bergman Reference Mark, Lyytinen and Bergman2007).
In the context of engineering design, boundary objects include design representations and design artifacts, such as physical prototypes, sketches and CAD models (Henderson Reference Henderson1991; Tang Reference Tang1991; Bucciarelli Reference Bucciarelli2002; Subrahmanian et al. Reference Subrahmanian, Monarch, Konda, Granger, Milliken and Westerberg2003; Yi-Luen Do Reference Yi-Luen Do2005; Mark et al. Reference Mark, Lyytinen and Bergman2007; Pei, Campbell, & Evans Reference Pei, Campbell and Evans2011). The use of such artifacts is known to promote communication during design and facilitate effective and successful engineering design collaboration (Tang Reference Tang1991; Saad & Maher Reference Saad and Maher1996; Kalay Reference Kalay2001; Gerber & Carroll Reference Gerber and Carroll2012; Krishnakumar et al. Reference Krishnakumar, Letting, Johnson, Zurita and Menold2023).
Commonly used design representations, such as CAD models and design sketches, have unique features beneficial for the design process. However, such features could also obstruct the development of shared understanding in certain circumstances (Veisz et al. Reference Veisz, Namouz, Joshi and Summers2012). For instance, CAD models contain rich information about the design but also require more effect and expertise to create or modify compared to sketching, restricting the ability of team members with less technical fluency to work with the tool (Häggman et al. Reference Häggman, Tsai, Elsen, Honda and Yang2015; Tsai & Yang Reference Tsai and Yang2017; Phare, Gu, & Ostwald Reference Phare, Gu and Ostwald2018). To mitigate the potential adverse impacts on collaborative design, it is crucial for the design community to recognize and understand the role of the design artifact modalities in building team-shared understanding. Although some work has compared and investigated the impact of different modalities of design artifacts on shared understanding and design interpretability (Krishnakumar et al. Reference Krishnakumar, Letting, Soria Zurita and Menold2023; Krishnakumar et al. Reference Krishnakumar, Letting, Johnson, Zurita and Menold2023; Letting et al. Reference Letting, Krishnakumar, Johnson, Zurita and Menold2023), little work has explored the types of representation that are more commonly used in modern work settings, such as engineering CAD models (Hannah, Joshi, & Summers Reference Hannah, Joshi and Summers2012; Veisz et al. Reference Veisz, Namouz, Joshi and Summers2012). The design community has yet to fully explore the exact effect of the modality of the design representations on the development of shared understanding in collaborative engineering design practices.
In response to this extant gap, this work examines the effects of three of the most commonly used design representations in engineering design (namely, textual description, hand sketch and engineering CAD model) on the development of shared understanding in engineering design teams. We hypothesize that the modality of the design artifacts used in the collaborative engineering design process will affect the development of shared understanding within the teams (H1). We also hypothesize that more complex modalities, such as CAD models, will better facilitate the development of shared understanding than a simpler modality like sketches, due to the richer information it contains and the additional functionality it offers (H2).
The insights from this work have the potential to foster best practices for the use of design artifacts in collaborative engineering design tasks. Also, a deeper understanding of shared understanding in teams facilitates better team collaboration and team performance. Such understanding is vital as team interactions increasingly embrace text-dominant online communication, which allows team members to be globally distributed and work asynchronously.
This study directly connects the modality of design artifacts and the development of shared understanding within teams through a between-subject human-subject experiment and mixed-method analysis. Commonly used design representations in the modern era, namely, text-only description, text with a sketch and text with a CAD model, are examined in this study. The values and benefits for communication and understanding, as well as the time cost and potential adverse effects of the design representations in the design process, are considered and organically explored in the experimental design. The design representations are naturally utilized and integrated into the engineering design process, facilitating two-way team communication. The level of shared understanding in the engineering design teams is compared across conditions with different modalities of design artifacts. Both quantitative and qualitative results are obtained through multiple data analyses. The results suggest that the modality of the design representation would affect the development of shared understanding, and teams using visual representations can reach a higher level of shared understanding. The difference in shared understanding mainly showed in the interpretation of the structures of the designs, which describe “the components of the object and their relationships” under the Function-Behaviour-Structure (FBS) ontology (Gero & Kannengiesser Reference Gero and Kannengiesser2004).
This article is organized into the following sections. The background and related work are introduced in the related work section. Next, the methodology section discusses the experimental setup and data analysis approaches in detail. The experiment results are shown in the results section and discussed in detail in the discussion section. Lastly, the limitations of this work and future work are reviewed, followed by the conclusions.
2. Related work
2.1. Shared understanding in design teams
For engineering design, shared understanding is a concept that describes the sharedness or similarity in people’s understanding of the design and related information (Bittner & Leimeister Reference Bittner and Leimeister2013). In this study, we stick to the definition by Eva Bittner and Jan Marco Leimeister, that shared understanding is “the degree to which people concur on the value of properties, the interpretation of concepts, and the mental models of cause and effect with respect to an object of understanding” (Bittner & Leimeister Reference Bittner and Leimeister2014). We found such a definition most suitable and applicable to the scope of this study, compared to some other popular definitions in military applications, which focus heavily on member coordination and execution accuracy (Smart et al. Reference Smart, Mott, Sycara, Braines, Strub and Shadbolt2009; Bittner & Leimeister Reference Bittner and Leimeister2013; Gomes et al. Reference Gomes, Tzortzopoulos and Kagioglou2016).
Prior research has also examined a similar concept, the shared mental model, and its significance in team collaboration and coordination (Stout et al. Reference Stout, Cannon-Bowers, Salas and Milanovich1999; Mathieu et al. Reference Mathieu, Heffner, Goodwin, Salas and Cannon-Bowers2000; Badke-Schaub et al. Reference Badke-Schaub, Neumann, Lauche and Mohammed2007). Some work also deems shared understanding and shared mental model as the same thing and uses the terms interchangeably (Johnson & O’Connor Reference Johnson and O’Connor2008). However, many prior works suggest that shared mental models focus more on the sharedness of team approaches, processes, coordination and team joint decision-making (Stout et al. Reference Stout, Cannon-Bowers, Salas and Milanovich1999; Badke-Schaub et al. Reference Badke-Schaub, Neumann, Lauche and Mohammed2007; Johnson & O’Connor Reference Johnson and O’Connor2008; Van den Bossche et al. Reference Van den Bossche, Gijselaers, Segers, Woltjer and Kirschner2011; Casakin & Badke-Schaub Reference Casakin and Badke-Schaub2017). It is a sub-concept under the definition of shared understanding under the current theoretical framework adopted from Eva Bittner and Jan Marco Leimeister’s work.
The work of Valkenburg (Reference Valkenburg1998) is one of the earliest studies to discuss in detail the significance of shared understanding for collaborative team design. It is believed that shared understanding is crucial for team design activities. Clear shared understanding among a team can lead to better coordination, reduction of re-work and member satisfaction, ultimately improving team performance and design quality (Mathieu et al. Reference Mathieu, Heffner, Goodwin, Salas and Cannon-Bowers2000; Langan-Fox, Anglim, & Wilson Reference Langan-Fox, Anglim and Wilson2004; Hsieh Reference Hsieh2006; Kleinsmann, Buijs, & Valkenburg Reference Kleinsmann, Buijs and Valkenburg2010; Bittner & Leimeister Reference Bittner and Leimeister2014). Conversely, a lack of shared understanding can lead to frustration and setbacks in the design process, leading to inferior designs and inefficiency (Valkenburg Reference Valkenburg1998; Kleinsmann & Valkenburg Reference Kleinsmann and Valkenburg2008). Due to the significance of shared understanding in design teams, studies have put effort into supporting the development of shared understanding, especially with the use of representational artifacts (Arias et al. Reference Arias, Eden, Fischer, Gorman and Scharff2000; Kleinsmann & Valkenburg Reference Kleinsmann and Valkenburg2008; Dijk & Lugt Reference Dijk and Lugt2013; Cash, Dekoninck, & Ahmed-Kristensen Reference Cash, Dekoninck and Ahmed-Kristensen2017).
2.2. Design communication with design representations
2.2.1. Boundary object
Boundary objects are artifacts and carriers of information with interpretive flexibility (Star & Griesemer Reference Star and Griesemer1989; Leigh Star Reference Leigh Star2010). Boundary objects hold different meanings and serve different functions for different groups of people but are similar enough to serve as a common piece for information exchange (Star & Griesemer Reference Star and Griesemer1989). The flexibility of interpretation and the integrity of retaining information across conditions make boundary objects highly effective mediums for conveying information and ideas, especially between people and communities from different knowledge and occupational backgrounds that may hold different interests (Bechky Reference Bechky2003; Nicolini, Mengis, & Swan Reference Nicolini, Mengis and Swan2012). Research in organizational management science has recognized the positive effects of boundary objects in facilitating product development and cross-disciplinary collaboration (Carlile Reference Carlile2002; Nicolini et al. Reference Nicolini, Mengis and Swan2012).
The collaborative nature of modern engineering design practices means design teams can benefit from the use of boundary objects for team collaboration (Carlile Reference Carlile2002; Subrahmanian et al. Reference Subrahmanian, Monarch, Konda, Granger, Milliken and Westerberg2003; Majchrzak, More, & Faraj Reference Majchrzak, More and Faraj2012). Prior works in the engineering design research community have investigated the applications and benefits of using boundary objects in engineering design practices, including crossing and scaffolding for knowledge differences and boundaries in design (Carlile Reference Carlile2002; Subrahmanian et al. Reference Subrahmanian, Monarch, Konda, Granger, Milliken and Westerberg2003). For instance, studies have suggested that prototypes, a common type of boundary object used in engineering design, can help design teams resolve and synthesize conflicting objectives and comprehensions in product design as a temporary and transitional representation of the design and documentation of developed shared understanding (Subrahmanian et al. Reference Subrahmanian, Monarch, Konda, Granger, Milliken and Westerberg2003; Mark et al. Reference Mark, Lyytinen and Bergman2007).
2.2.2. Design communication and design representations
Design representations are an essential piece in engineering design communication. In fact, engineers and designers may not be able to work functionally without the help of design representation, as it would severely hinder their ability to communicate design ideas and even impede their thinking process (Henderson Reference Henderson1991). Louis L. Bucciarelli pointed out that design artifacts, as boundary objects, facilitate communication among team members with different objectives and technical knowledge (Bucciarelli Reference Bucciarelli2002). He also suggested team design communication is commonly achieved with design artifacts in addition to linguistic information (Bucciarelli Reference Bucciarelli2002). Another study found that visualization of design ideas through fast prototyping fosters quick communication about outstanding questions which may help mitigate organizational resistance (Gerber & Carroll Reference Gerber and Carroll2012). Related work in architectural design also found that semantically rich representation of the design can improve team communication and mitigate misunderstanding in multi-disciplinary design collaboration (Kalay Reference Kalay2001). Design representations and design artifacts are not only tightly bonded to design communication, but also important facilitators for effective communication.
2.2.3. Common visual design representation
Sketches and CAD models are the two most commonly used visual design representations in the modern engineering design space (Henderson Reference Henderson1991; Favela et al. Reference Favela, Wong and Chakravarthy1993; Häggman et al. Reference Häggman, Tsai, Elsen, Honda and Yang2015; Tsai & Yang Reference Tsai and Yang2017; Atit Shah et al. Reference Atit Shah, Lim, Molina-Cristobal, Christian and Mei2021). Both sketches and CAD models improve communication and ideation when used in addition to simple text-based communication (Henderson Reference Henderson1991; McKoy et al. Reference McKoy, Vargas-Hern’andez, Summers and Shah2001). Together, they offer complementary values and features in the design process (Veisz et al. Reference Veisz, Namouz, Joshi and Summers2012). For instance, sketching is believed to be one of the best approaches to facilitate ideation and communication in the early design stages (Suwa & Tversky Reference Suwa and Tversky1996; McKoy et al. Reference McKoy, Vargas-Hern’andez, Summers and Shah2001; Tversky et al. Reference Tversky, Suwa, Agrawala, Heiser, Stolte, Hanrahan, Phan, Klingner, Daniel, Lee, Haymaker and Lindemann2003; Heiser, Tversky, & Silverman Reference Heiser, Tversky and Silverman2004; Macomber & Yang Reference Macomber and Yang2012; Worinkeng, Summers, & Joshi Reference Worinkeng, Summers, Joshi and Stark2013). Sketches are widely accessible, with little technical competency needed to convey ideas. However, some technical details might be missing in simple sketches or drawings, making it harder to interpret the detailed mechanism or intent of the design (Hannah et al. Reference Hannah, Joshi and Summers2012). As another example, Computer-Aided Design (CAD) models are digital 3D interactable models of the design. CAD models are becoming the industrial standard for detailed design description and documentation, especially when the product design is approaching its final state (Veisz et al. Reference Veisz, Namouz, Joshi and Summers2012). With modern computer software, CAD models can contain abundant information, have an intuitive interface, and have novel interactions, allowing for more accurate interpretation (Tsai & Yang Reference Tsai and Yang2017). CAD models and CAD software allow viewpoints and dissections that are much harder to replicate with sketches and engineering drawings. However, much more effect and expertise are needed to create or modify a CAD model (Häggman et al. Reference Häggman, Tsai, Elsen, Honda and Yang2015; Phare et al. Reference Phare, Gu and Ostwald2018). Sketches and CAD models are often used jointly, enabling practitioners to take advantage of the strengths of both (Veisz et al. Reference Veisz, Namouz, Joshi and Summers2012).
2.3. Research on design artifacts and shared understanding
Prior works have studied and examined different modalities of design artifacts and their influence on engineering communication and collaboration. One study found there is no significant difference in building shared understanding in teams between using 3D prototypes and 2D sketches (Krishnakumar et al. Reference Krishnakumar, Letting, Soria Zurita and Menold2023). It was also found that using physical prototypes or sketches did not affect team communication, but using physical prototypes would impose higher levels of cognitive load on team members, which can lead to more stress, discouragement and human errors (Hart & Staveland Reference Hart, Staveland, Hancock and Meshkati1988; Krishnakumar et al. Reference Krishnakumar, Letting, Johnson, Zurita and Menold2023). Another related work examined the impact of the quality and information richness of sketches on shared understanding in design teams, but no significant difference was found between different levels of information richness (Letting et al. Reference Letting, Krishnakumar, Johnson, Zurita and Menold2023).
However, a work by Veisz et al. (Reference Veisz, Namouz, Joshi and Summers2012) found that employing CAD tools in the early stages of design could lead to a loss of design efficiency and effectiveness, emphasizing the importance of sketching in the engineering design process, but the findings would benefit from further experimental evidence. In addition, another work found that CAD models are superior to sketches in terms of perceived information, interpretation correctness and interpretation confidence, while both of them are inferior compared to physical prototypes (Hannah et al. Reference Hannah, Joshi and Summers2012).
The inconsistency in the prior findings and the relative insufficiency in experimental evidence of related works in the domain would benefit from further experimental testing and prompted us to directly connect and test the impact of design representation modalities on the development of shared understanding in engineering design teams through a between-subject human-subject experiment.
3. Methodology
To test our hypotheses, a between-subjects experiment was designed to investigate the effect of the modalities of design representations on the development of shared understanding in engineering design teams. The experiment specifically examines the simplest form of team structure, dyads. Studying dyadic teams helps control for variables and focus on the fundamentals of team interactions, and the knowledge gained can also be beneficial for understanding other team structures. The participants in these dyads collaboratively solve a real-world engineering design problem with the help of one type of design representation (text $ \mid $
sketch
$ \mid $
sketch $ \mid $
CAD). The type of design representation is the only independent variable, and the level of shared understanding development in the given time is the dependent variable of interest.
$ \mid $
CAD). The type of design representation is the only independent variable, and the level of shared understanding development in the given time is the dependent variable of interest.
3.1. Participants
In total, 82 participants were recruited from a sophomore-level engineering design course in the Department of Mechanical Engineering at Carnegie Mellon University. Participation was voluntary, and the participants were compensated with extra credit for participating, as well as a $10 Amazon gift card. The ethnicity, age and gender of the participants did not affect the recruitment process.
All 82 recruited participants are students majoring in Mechanical Engineering. Among the 82 participants, 78 are second-year students, three are third-year students and one are final-year students. Among the recruited participants, 36 identified as women, 43 identified as men and three preferred not to identify themselves. All participants were over the age of 18 when recruited. 34 participants identified as White, six identified as Black or African American, 27 identified as Asian, 12 identified as others and three preferred not to disclose their ethnicity.
The recruited 82 participants were randomly assigned into 41 dyadic groups and placed in one of the three experiment conditions: text-only description (N = 13), text with a sketch (N = 14) and text with a CAD model (N = 14).
3.2. Procedure
The study consisted of an in-person design activity, a design report, and two online surveys. During the study, participants worked in pairs to consider an authentic engineering design problem used in multiple engineering design studies (Linsey et al. Reference Linsey, Green, Murphy, Wood and Markman2005; Linsey, Wood, & Markman Reference Linsey, Wood and Markman2008; Fu, Cagan, & Kotovsky Reference Fu, Cagan and Kotovsky2010; Linsey et al. Reference Linsey, Clauss, Kurtoglu, Murphy, Wood and Markman2011; Viswanathan & Linsey Reference Viswanathan and Linsey2013; Durand et al. Reference Durand, Helms, Tsenn, McAdams and Linsey2015; Levy et al. Reference Levy, Hilton, Tomko and Linsey2017; Goucher-Lambert & Cagan Reference Goucher-Lambert and Cagan2019; Patel, Elena, & Summers Reference Patel, Elena and Summers2019). The design problem specifically tasks participants with designing a device to de-shell peanuts for places with no mains electricity available as a power source. An undergraduate level of basic engineering design knowledge and physics is needed to solve the design problem. The design problem is representative of real-world engineering design tasks with reasonable design requirements and constraints. The design problem handout with detailed problem description and design requirements is shown in Appendix A. Overall, the design problem is approachable for the recruited participants.
The experiment timeline is shown in Figure 1. To solve the design problem, a sample design was provided to the participants as a reference, and the assigned design representations were used to demonstrate the sample design. The participants were specifically asked to evaluate the sample design and revise it to better meet the given design requirements. The participants were given 5 min to read the design problem and another 5 min to interpret the sample design before proceeding to the actual design activity. The participants were encouraged to communicate design ideas using the assigned design modality during the design activity. The design activity had a time limit of 20 min. This time limit was found to be sufficient for the design task through pilot testing and aligns with the time given for this problem in prior work.

Figure 1. Experiment timeline.
During the experiment, the design representation assigned to each condition was used to introduce the sample design and to facilitate the collaborative design process. The text description follows the Function-Behaviour-Structure (FBS) ontology to accurately depict the design under a uniform and well-accepted framework (Gero & Kannengiesser Reference Gero and Kannengiesser2004). A copy of the text description used in the study can be found in Appendix B, Figure B1. The text with sketch condition adds a hand-drawn sketch to the text description, as shown in Appendix B, Figure B2. The participants in this condition were allowed to strengthen their sketches with textual annotation and labels if they chose to do so. The text with CAD condition adds a 3D engineering CAD model to the text description. The CAD model is constructed and can be interacted with using the SolidWorks engineering CAD software, as shown in Appendix B, Figure B3. The participants were encouraged to use the designated design representation type to facilitate their collaborative design process during the design activity. After the design activity, the participants had 15 min to complete a short design report individually. The goal of the design report was to comprehensively capture each participant’s understanding of both the original and new designs. The design report included three modules about the provided original design (sample design) and three modules about the revised new design. Namely, the participants answered six factual questions about the original design, briefly evaluated the original design through a short text response, and sketched the original design; then they answered six factual questions about the new design, briefly described the new design through a short text response, and sketched the new design.
Surveys are used in the study to gain insights into participants’ self-evaluation on the individual understanding and shared understanding of the design tasks. There were two short surveys, one distributed before the design activity and the other after the design activity and the design report. The first survey assessed the participants’ self-evaluation of individual understanding and the group’s shared understanding of the original design (sample design) before the collaborative design activity. The second survey was designed to assess participants’ self-evaluation of their individual understanding and the group’s shared understanding of the original design and the revised new design after the design activity.
The survey questions are adapted from the survey used in the Mulder, Swaak, and Kessels (Reference Mulder, Swaak and Kessels2002) paper for shared understanding evaluation. We re-framed the survey’s questions to the design solutions for the task, and specified the areas of shared understanding of function, behavior and structure of the design solutions, in addition to the original general evaluation, based on the well-accepted Function-Behaviour-Structure (FBS) ontology design framework (Mulder et al. Reference Mulder, Swaak and Kessels2002; Gero & Kannengiesser Reference Gero and Kannengiesser2004). The surveys are designed with four sets of multiple-choice questions asking about the individual and shared understanding of the designs, regarding their function, behavior, structure and overall evaluation. The questions would ask the participants to rate their individual understanding and the group’s shared understanding of the designs on a scale of 1–6, from “Very Badly” and “No Shared Understanding At All” to “Very Well” and “Complete Shared Understanding.” The complete survey questions are available in Appendix C. An even scale is used to improve response quality by forcing choices into positive or negative and not neutral. The complete survey can be found in the Appendix C. The participants’ unidentifiable background information was collected in the second survey to minimize the negative impact of stereotypes on the academic competence of the participants (Aronson & Steele Reference Aronson and Steele2005).
3.3. Measurement and data analysis
The dependent variable of interest in this study is the level of shared understanding in the teams. It is measured and captured from three channels: design reports, survey results and team conversations. After data collection, quantitative and qualitative analyses were conducted. The data measurement and analysis strategy are presented in the following subsections.
3.3.1. Design report
The design report serves as a direct and quantitative evaluation of shared understanding. It provides insights by examining and comparing the participants’ interpretations of the designs. In the report, each participant recorded their best understanding through the factual questions and the design sketches. If a high level of shared understanding is present, members of the same team should have design reports representing a similar design. In addition, six groups did not finish the design report within the given 15-min time frame, despite being reminded multiple times of time constraints in the process. Since most groups finished in time, and pilot testing also showed that 15 min was enough to finish the design report, failure to complete the design report within the given time was taken as a sign of a lack of shared understanding within the team. There is no correlation found between the design modality and whether the group can finish in time or not.
Factual questions The six factual questions about the original design and the new design are shown below:
-
• What is the power source of the original/new design solution?
-
• How do the peanut shells get removed (de-shelled) in the original/new design solution?
-
• How do the de-shelled peanut nuts and shells get separated from each other in the original/new design solution?
-
• How many main sub-systems are there in the original/new design solution?
-
• How are the peanuts fed into the device in the original/new design solution?
-
• How many human operators at minimum are needed for the device operation in the original/new design solution?
These questions are rated and compared for each team. A score from 0 (no similarity) to 1 (high similarity) is given to each team on each question based on the similarity of the responses. The scoring is solely determined by the similarity and is not affected by other factors such as design quality, consistency with other parts of the design report, or accuracy of evaluation. A score of 0 will be given when the responses from the two participants in the same team are largely or completely different. A score of 1 means the responses are exactly the same based on the provided information. For questions with multiple answers, the scores are given based on the percentage of similarity. For example, when asked about the power source of the design solution, if participant A in the team responded with choices “Solar,” “Wind” and “Human” while participant B responded with only choice “Solar,” then the team will receive a score of $ 1/3=0.33 $
. The scores for questions about the original design and the new design are summed up. A higher total score indicates a higher similarity between the participants, with a maximum total of 6 points for all six questions. Also, if one of the participants did not finish the factual questions part of the design report on time, the team would receive a total score of 0 for that section. ANOVA (Analysis of variance) tests are conducted on the similarity scores to unveil differences across experimental conditions.
$ 1/3=0.33 $
. The scores for questions about the original design and the new design are summed up. A higher total score indicates a higher similarity between the participants, with a maximum total of 6 points for all six questions. Also, if one of the participants did not finish the factual questions part of the design report on time, the team would receive a total score of 0 for that section. ANOVA (Analysis of variance) tests are conducted on the similarity scores to unveil differences across experimental conditions.
Design sketch The sketches of the original design and the new design are compared and rated for similarity for each team from two aspects. Inspired by geometry-based and feature-based design similarity assessments, the similarity between designs can be evaluated by comparing their components and the relationship between the components (Elinson, Nau, & Regli Reference Elinson, Nau and Regli1997; Chu & Hsu Reference Chu and Hsu2006). The three researchers evaluated each pair of sketches based on the similarity in components and in relationship, and agreed upon a score of 0–2 for each team on each aspect. The researchers were given grading instructions and then rated them individually. Then the researchers compared and discussed coming to an agreement together. Similar to the question responses, the scoring is solely determined by the similarity and is not affected by other factors such as design quality, consistency or accuracy. Each pair of sketches is scored based on the following rules, and the three researchers coded to agreement.
For similarity in components, the parts and structures shown in the sketches will be compared based on the number and completeness. A score of 2 means all the main components presented in both sketches match in number and shape, to the best knowledge of the rater. A score of 1 will be given to the team with roughly matching components, but the number of parts or the shape of parts does not match entirely. A score of 0 indicates that there are more than half of the main components in the sketches that do not match, and it is beyond reasonable doubt that the sketches represent two different designs.
As for the similarity in relationship, the connections and relationships between the components are examined. A score of 2 will be given to the teams when all the main components presented in both sketches are organized and connected similarly, and should work together in the same way to the best knowledge of the rater. A score of 1 shows that the components in the sketches are organized similarly, but there are some minor differences in how they are connected or how they will work. A score of 0 indicates that the main components in the sketches are organized largely differently, or it is unlikely that the components work together in the same way, and it is beyond reasonable doubt that the sketches represent two different designs.
Four examples of design sketches with different scores of similarity in components and relationships are shown in Figure 2. The scores for the two aspects of the design sketch are summed up, for both the original design and the new design. A higher total score indicates a higher similarity between the participants, with a maximum of 4 points. Also, if one of the participants did not finish the sketch part of the design report on time, the team would receive a total score of 0 for that section. ANOVA tests are conducted on the similarity scores to unveil differences across experiment conditions.
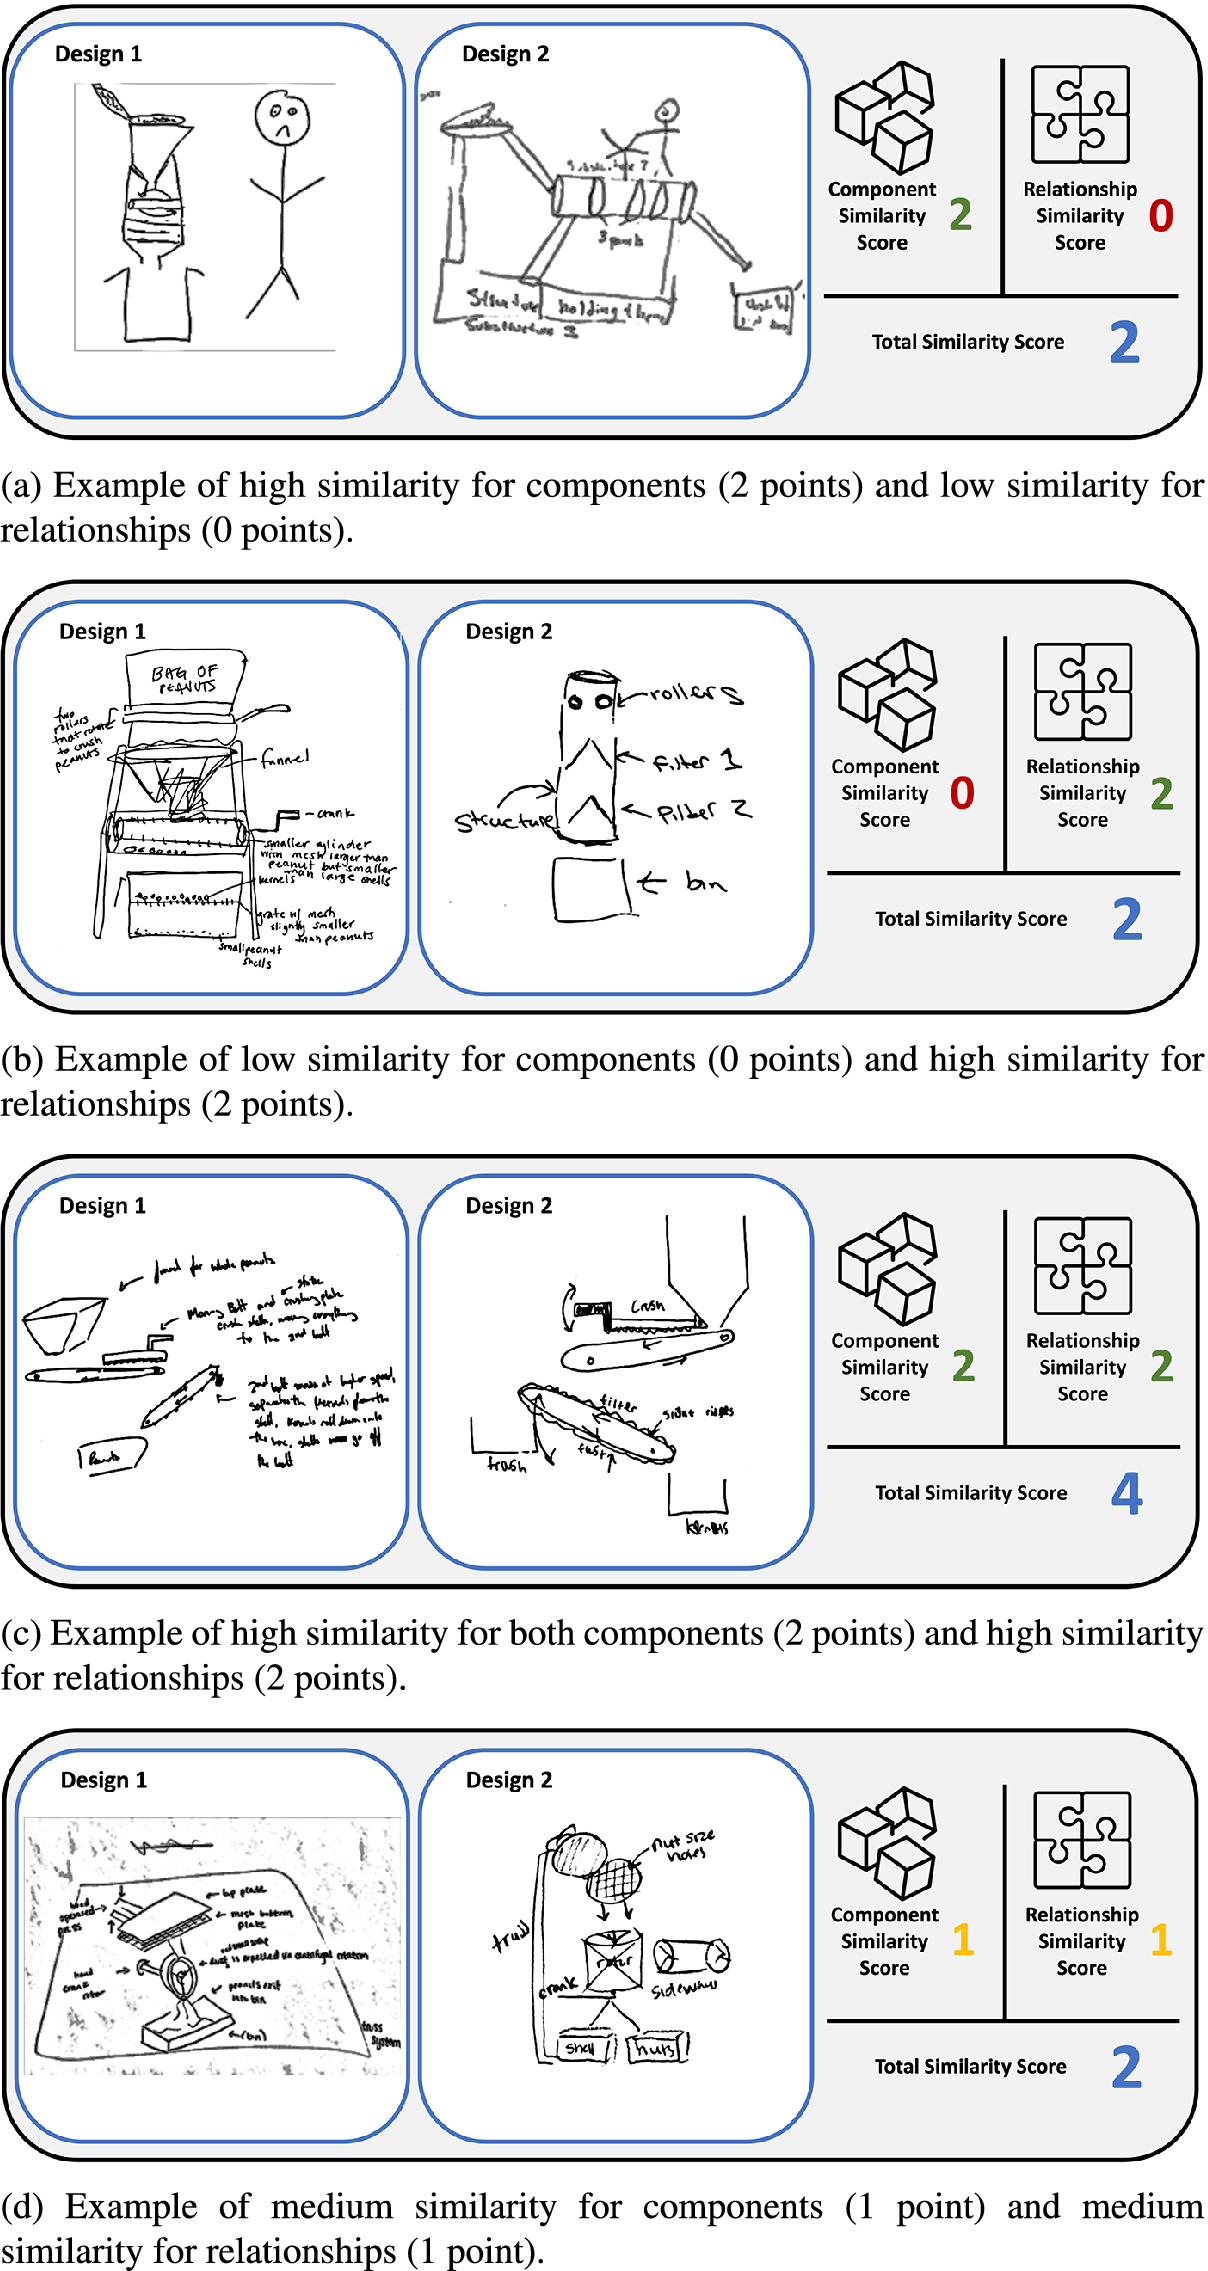
Figure 2. Design report: examples of design sketches with different scores of similarity in components and relationships.
3.3.2. Survey
The survey provides a self-reported quantitative assessment of shared understanding. The answers to questions about the teams’ shared understandings of the designs in the surveys are converted to a numerical scoring from 1 (“No Shared Understanding At All”) to 6 (“Complete Shared Understanding”). ANOVA tests are conducted on the survey results to unveil differences across experiment conditions. The contrast of the shared understanding of the provided sample design before and after the design activity would also unveil the development of shared understanding through the design activity.
3.3.3. Team conversation
Team conversation is an important and organic source for gaining insights into team behavior. Prior work has shown that team conversations can reveal traits of the development of shared understanding in teams (Mulder et al. Reference Mulder, Swaak and Kessels2002). To better understand the process by which teams build shared understanding we conducted a comprehensive analysis of team conversation. In this study, we borrow concepts and methods from education and team constructive learning literature to properly assess the development of shared understanding (Mulder et al. Reference Mulder, Swaak and Kessels2002).
From the perspectives of constructive learning and group problem-solving, the development of shared understanding in engineering design teams can be assessed qualitatively through team conversations (Mulder et al. Reference Mulder, Swaak and Kessels2002). To better capture the creative nature of engineering design practices and to account for the unique design-oriented conversation characteristics we observed in the team design activity, we modify and re-use the concepts used in prior works by Mulder et al. and Norman (Norman Reference Norman1993; Mulder et al. Reference Mulder, Swaak and Kessels2002), and create our own thematic coding scheme. Our analysis focuses on three key factors in conversation to assess the development of shared understanding, specifically regarding design ideas or design-related information: Conceptual Learning, Feedback and Motivation.
-
1. Conceptual Learning: Adapted from the work by Mulder et al. and Norman, we define conceptual learning as the process of introducing, refining or restructuring the knowledge of a design idea or design-related information (Norman Reference Norman1993; Mulder et al. Reference Mulder, Swaak and Kessels2002). Conceptual learning includes
-
• Accretion. We define the term accretion as the introduction of a new design idea or information related to a design solution.
-
• Tuning. We define the term tuning as the fine-tuning of existing design ideas or design information, to further capture the incremental and iterative adjustment made to the design solutions.
-
• Reconstruction. The term reconstruction is used when new relations between ideas or concepts are established without the introduction of new knowledge.
-
-
2. Feedback: We define feedback as the direct response to the other member’s or existing design ideas, design-related information, confusion, uncertainty or check understanding. Feedback in conversation is believed to be a sign of the establishment of a shared understanding (Schober & Clark Reference Schober and Clark1989; Krauss & Fussell Reference Krauss and Fussell1991; Mulder et al. Reference Mulder, Swaak and Kessels2002). Inspired by the work of Mulder et al. (Mulder et al. Reference Mulder, Swaak and Kessels2002), we consider six unique types of feedback modes in this study, including
-
• Confirmation. Following the work by Mulder et al. and Casakin and Badke-Schaub, we define feedback confirmation as the explicit expression of agreement or acceptance of a design idea or information (Mulder et al. Reference Mulder, Swaak and Kessels2002; Casakin & Badke-Schaub Reference Casakin and Badke-Schaub2017).
-
• Rejection. We define rejection as the explicit expression of disagreement or rejection of a design idea or information.
-
• Evaluation. We define evaluation as the general evaluation or reflection on the design idea or information.
-
• Acknowledgment. We define acknowledgment as the expression of active listening and acknowledgment.
-
• Explanation. We define explanation as the explanation of a design idea or information.
-
• Paraphrase. Paraphrase is defined as paraphrasing or repeating existing design ideas or information as a direct response.
-
-
3. Motivation: Motivation is defined as the need for shared understanding or the initiation of establishing shared understanding. Motivation is a crucial factor in the process of reaching shared understanding and, thus, an important indicator for the development of shared understanding (Bandura Reference Bandura1986; Mulder et al. Reference Mulder, Swaak and Kessels2002). We identified five unique types of motivation in this work, including
-
• Uncertainty. Based on the work by Mulder et al. (Mulder et al. Reference Mulder, Swaak and Kessels2002), we define uncertainty as the explicit expression of doubt, unsureness, a lack of confidence or actively seeking confirmation in the speech.
-
• Confusion. We define confusion as the explicit expression of confusion, a lack of understanding or a lack of idea.
-
• Impasse. Impasse is used when there is a clear indication that the team has reached an impending situation where both members lack knowledge about a certain design idea or information.
-
• Check understanding. Check understanding is defined as the explicit expression of the wish to check the understanding of the other member, or the wish to align the understanding.
-
• Review. We define review as the explicit expression of initiating a recap and assessment of the current understanding of the design solution or information.
-
A simplified thematic coding scheme is shown in Figure 3, with the detailed coding scheme available in Appendix D.
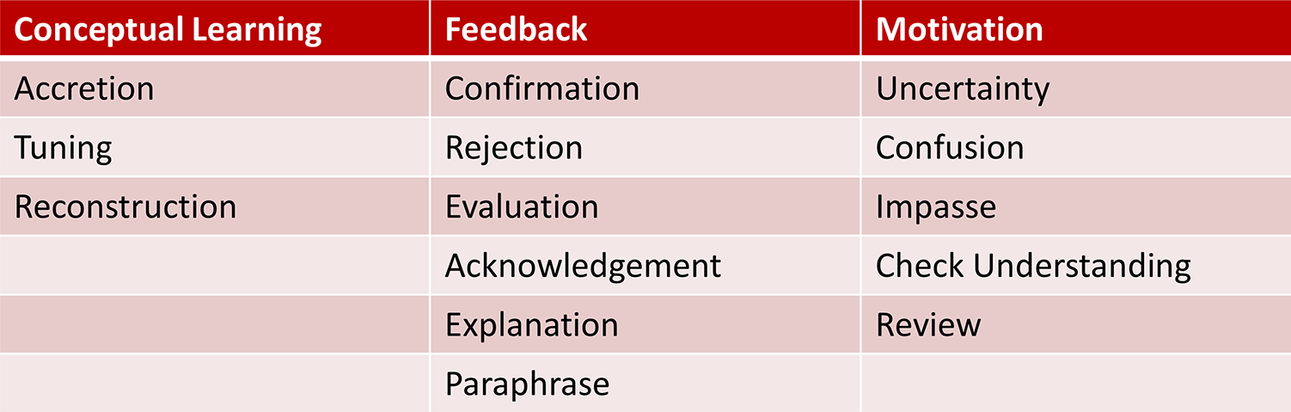
Figure 3. Thematic coding scheme.
4. Results
The results are organized according to the primary dimensions of measurements and data analysis: the design report (both factual questions and design sketches), survey results and team conversation.
4.1. Design report
4.1.1. Factual questions
The average similarities of a dyad’s question responses on the original design in the design reports are shown in Figure 4 with error bars indicating a 95% confidence interval. There is no statistical difference among the three experimental conditions ( $ F\left(2,38\right)=0.434 $
,
$ F\left(2,38\right)=0.434 $
, $ p=0.651 $
,
$ p=0.651 $
, $ {\eta}^2=0.022 $
). The modalities of the design representations did not affect the development of shared understandings about the original design in teams here.
$ {\eta}^2=0.022 $
). The modalities of the design representations did not affect the development of shared understandings about the original design in teams here.
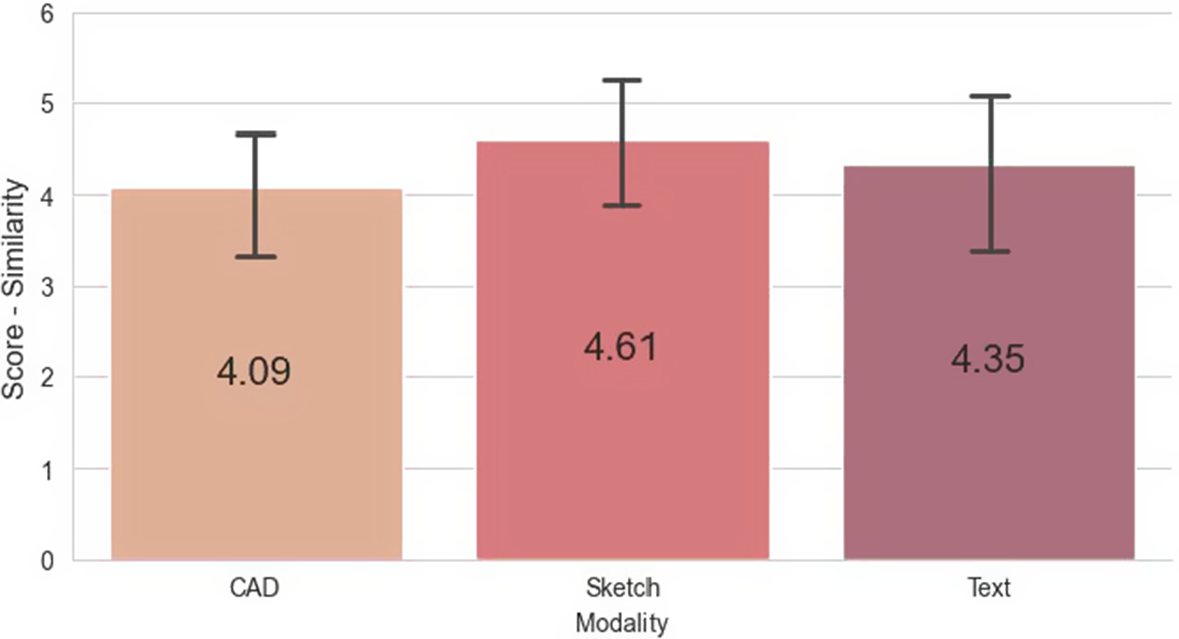
Figure 4. Design report result: similarity of participants’ question responses on the original design in the design reports from the same team. Error bars represent a 95% confidence interval.
The average similarities of a dyad’s question responses on the new design in the design reports are shown in Figure 5 with error bars indicating a 95% confidence interval. Again, there is no statistical difference found among the three experimental conditions ( $ F\left(2,38\right)=0.547 $
,
$ F\left(2,38\right)=0.547 $
, $ p=0.583 $
,
$ p=0.583 $
, $ {\eta}^2=0.028 $
). The modalities of the design representations did not affect the development of shared understandings about the new design in teams either, based on the responses to factual questions in the design report.
$ {\eta}^2=0.028 $
). The modalities of the design representations did not affect the development of shared understandings about the new design in teams either, based on the responses to factual questions in the design report.
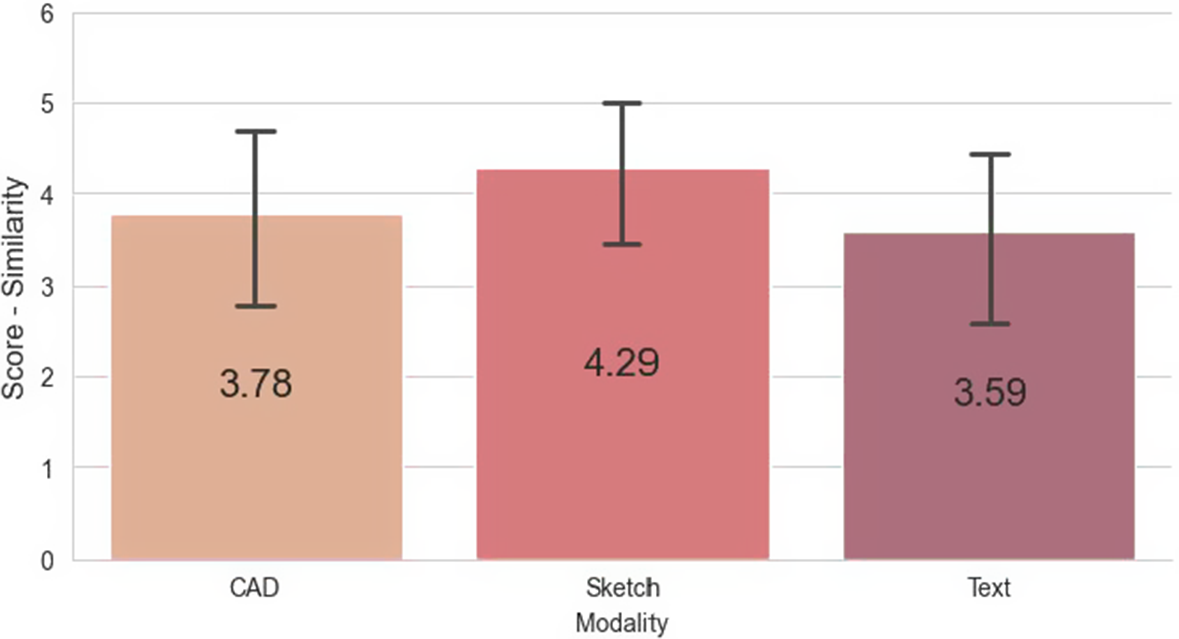
Figure 5. Design report result: similarity of participants’ question responses on the new design in the design reports from the same team. Error bars represent a 95% confidence interval.
4.1.2. Design sketch
The average results of the similarity of participants’ sketches of the original design from the same team are shown in Figure 6 with error bars indicating a 95% confidence interval. The distributions of similarity scores of each team condition are shown in Figure 7. There is a statistical difference with a large effect size found among the three experiment conditions regarding the similarity of the design sketches ( $ F\left(2,38\right)=30.707 $
,
$ F\left(2,38\right)=30.707 $
, $ p<0.001 $
,
$ p<0.001 $
, $ {\eta}^2=0.618 $
). Follow-up t-tests are conducted, and it is found that, for constructing shared understanding in teams about the original design, there is a significant difference with a large effect size between using CAD and text as design representations (
$ {\eta}^2=0.618 $
). Follow-up t-tests are conducted, and it is found that, for constructing shared understanding in teams about the original design, there is a significant difference with a large effect size between using CAD and text as design representations ( $ t(25)=6.039 $
,
$ t(25)=6.039 $
, $ <0.001 $
, Cohen’s
$ <0.001 $
, Cohen’s $ d=2.194 $
), and between using sketch and text (
$ d=2.194 $
), and between using sketch and text ( $ t(25)=5.405 $
,
$ t(25)=5.405 $
, $ <0.001 $
, Cohen’s
$ <0.001 $
, Cohen’s $ d=2.040 $
). The difference in the level of shared understanding between the CAD and sketch teams and the text teams can also be observed in the distribution of the similarity scores in Figure 7. However, there is no significant difference between the CAD model and the sketch conditions (
$ d=2.040 $
). The difference in the level of shared understanding between the CAD and sketch teams and the text teams can also be observed in the distribution of the similarity scores in Figure 7. However, there is no significant difference between the CAD model and the sketch conditions ( $ t(26)=1.600 $
,
$ t(26)=1.600 $
, $ p=0.122 $
, Cohen’s
$ p=0.122 $
, Cohen’s $ d=0.593 $
).
$ d=0.593 $
).
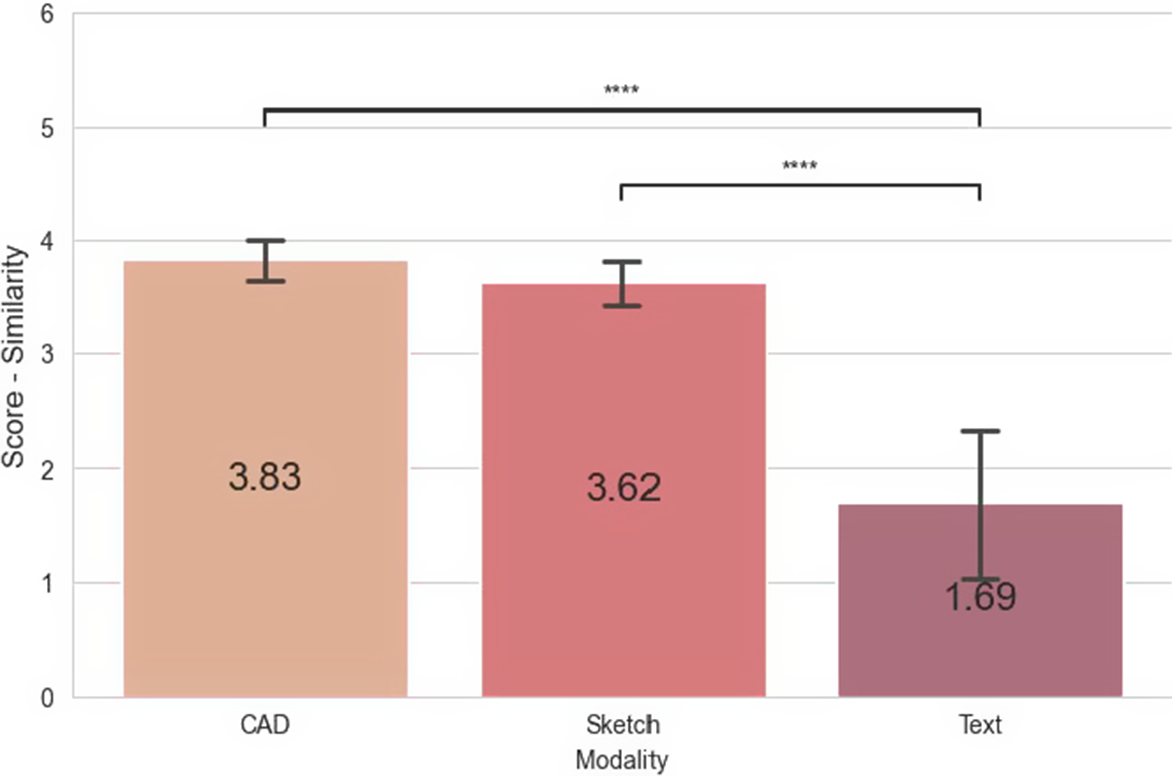
Figure 6. Design report result: similarity of participants’ sketches of the original design in the design reports from the same team. Error bars represent 95% confidence interval.
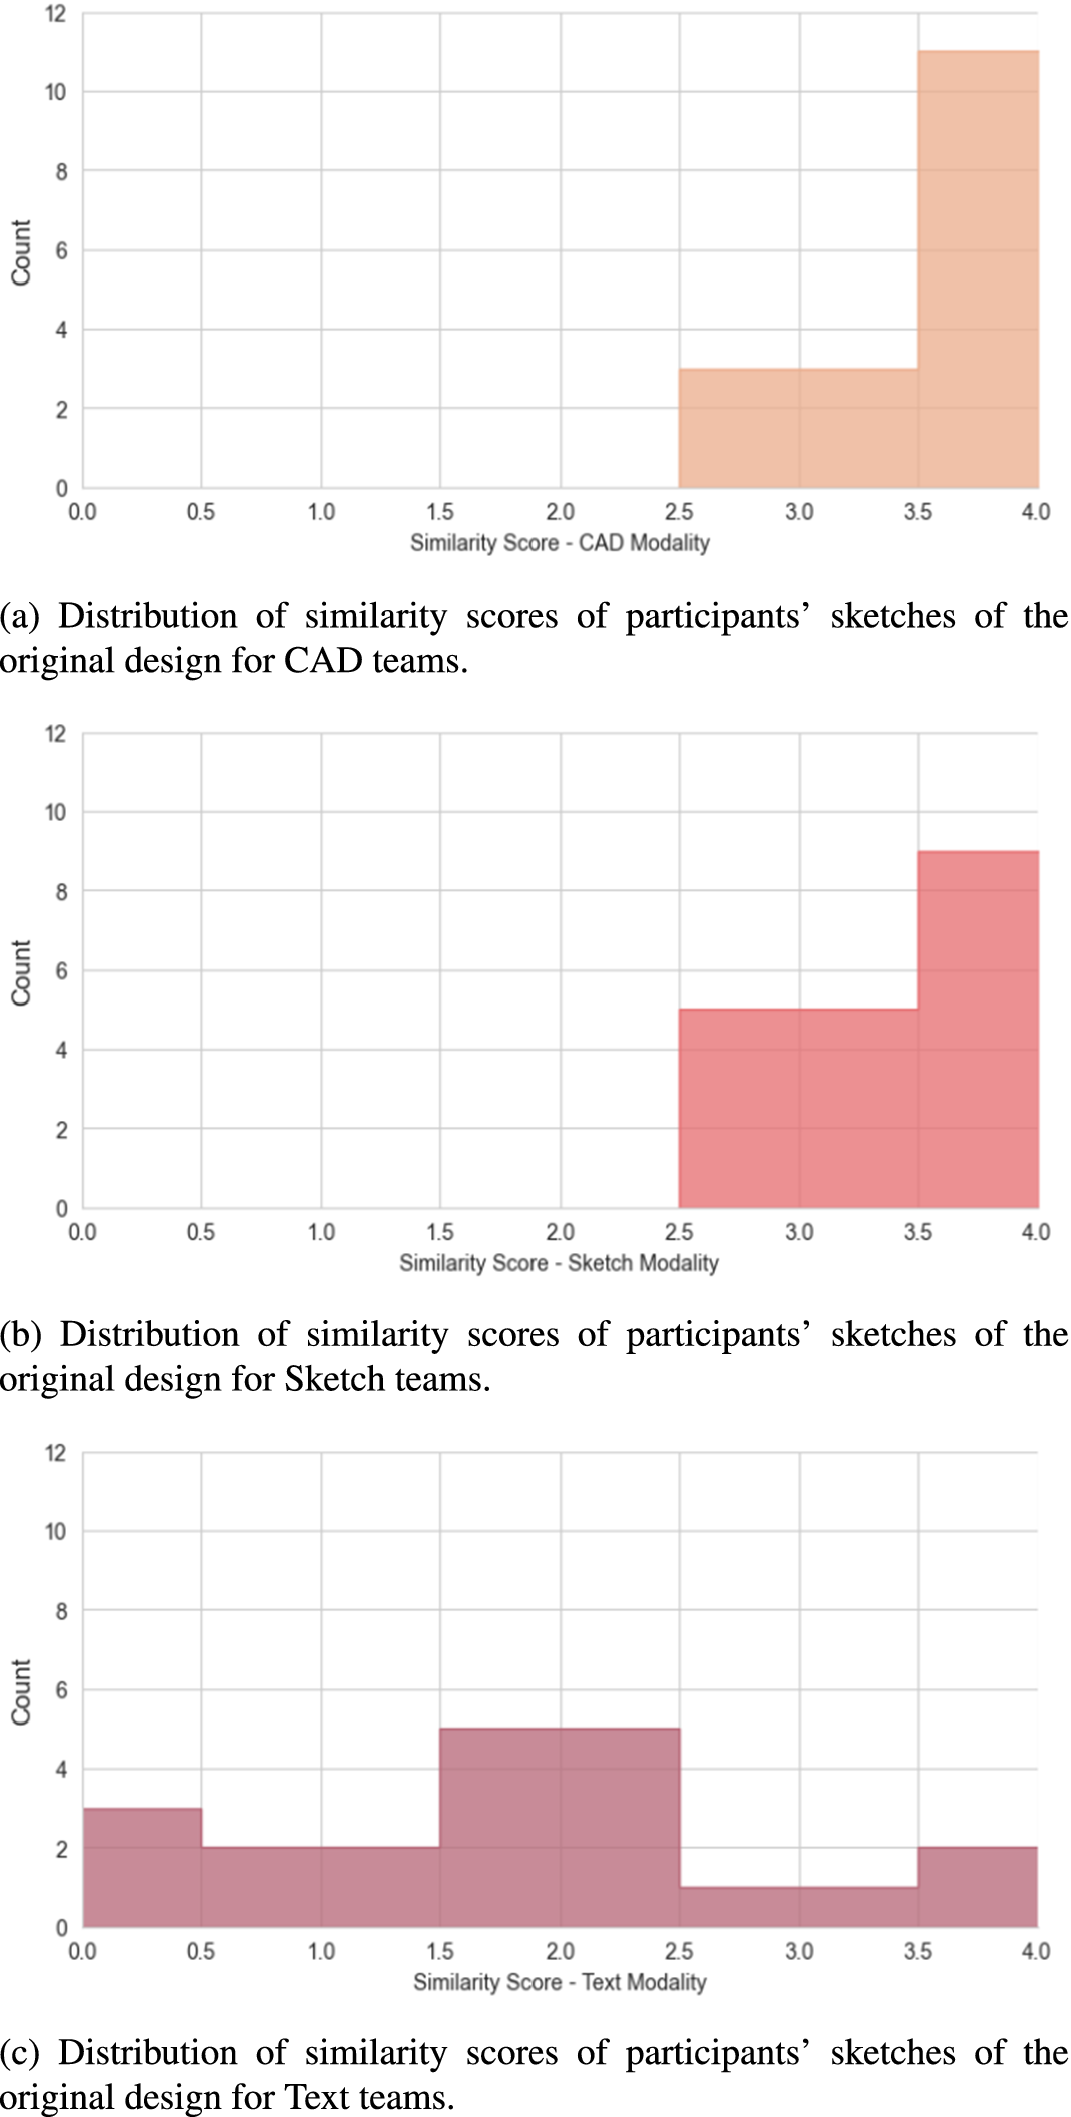
Figure 7. Distribution of similarity scores of participants’ sketches of the original design for different modalities.
The average results of the similarity of participants’ sketches of the new design from the same team are shown in Figure 8 with error bars indicating a 95% confidence interval. The distributions of similarity scores of each team condition are shown in Figure 9. Similarly, there is a statistical difference with a large effect size found among the three experiment conditions regarding the similarity of the design sketches ( $ F\left(2,38\right)=6.373 $
,
$ F\left(2,38\right)=6.373 $
, $ p=0.004 $
,
$ p=0.004 $
, $ {\eta}^2=0.251 $
). Follow-up t-tests are conducted, and it is found that, for constructing shared understanding in teams about the revised new design, there is a significant difference with a large effect size between using CAD and text as design representations (
$ {\eta}^2=0.251 $
). Follow-up t-tests are conducted, and it is found that, for constructing shared understanding in teams about the revised new design, there is a significant difference with a large effect size between using CAD and text as design representations ( $ t(25)=3.754 $
,
$ t(25)=3.754 $
, $ p<0.001 $
, Cohen’s
$ p<0.001 $
, Cohen’s $ d=1.383 $
), and between using sketch and text (
$ d=1.383 $
), and between using sketch and text ( $ t(25)=2.485 $
,
$ t(25)=2.485 $
, $ p=0.020 $
, Cohen’s
$ p=0.020 $
, Cohen’s $ d=0.938 $
). The difference in the level of shared understanding between the CAD and sketch teams and the text teams can also be observed in the distribution of the similarity scores in Figure 9. However, there is no significant difference between the CAD model and the sketch conditions
$ d=0.938 $
). The difference in the level of shared understanding between the CAD and sketch teams and the text teams can also be observed in the distribution of the similarity scores in Figure 9. However, there is no significant difference between the CAD model and the sketch conditions $ \Big(t(26)=0.475, $ $ p=0.639 $
, Cohen’s
$ p=0.639 $
, Cohen’s $ d=0.178 $
).
$ d=0.178 $
).
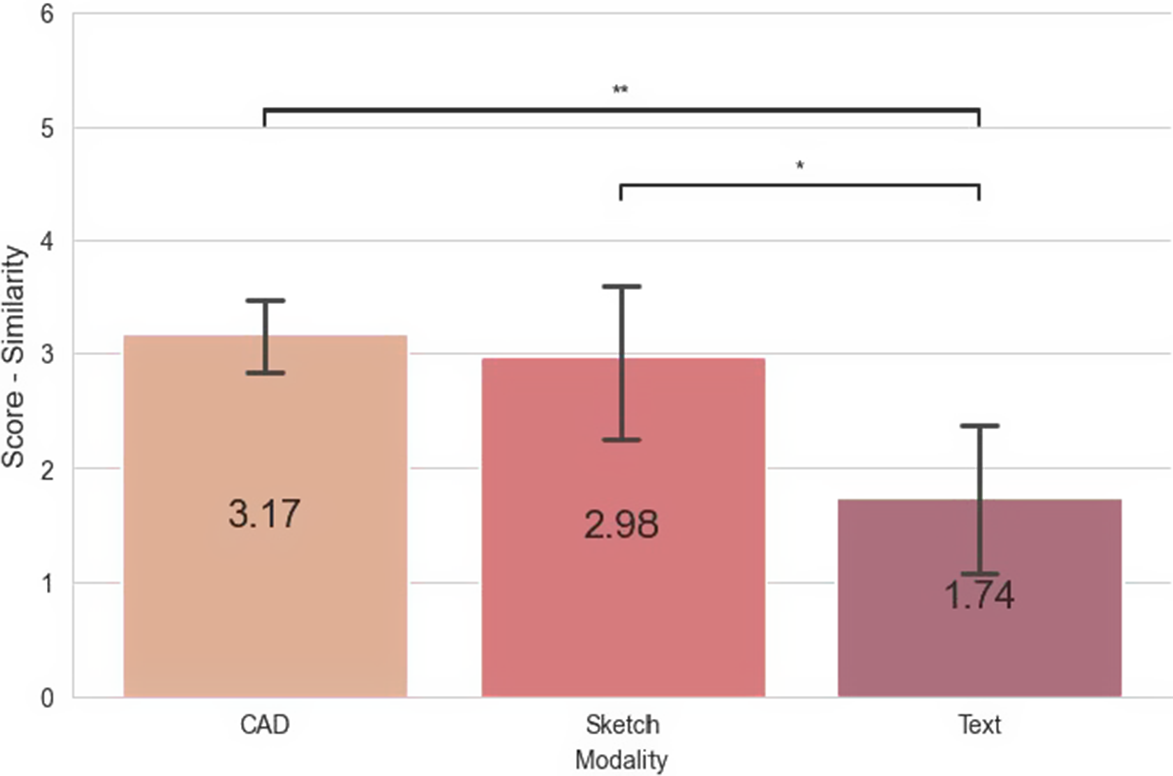
Figure 8. Design report result: similarity of participants’ sketches of the new design in the design reports from the same team. Error bars represent a 95% confidence interval.
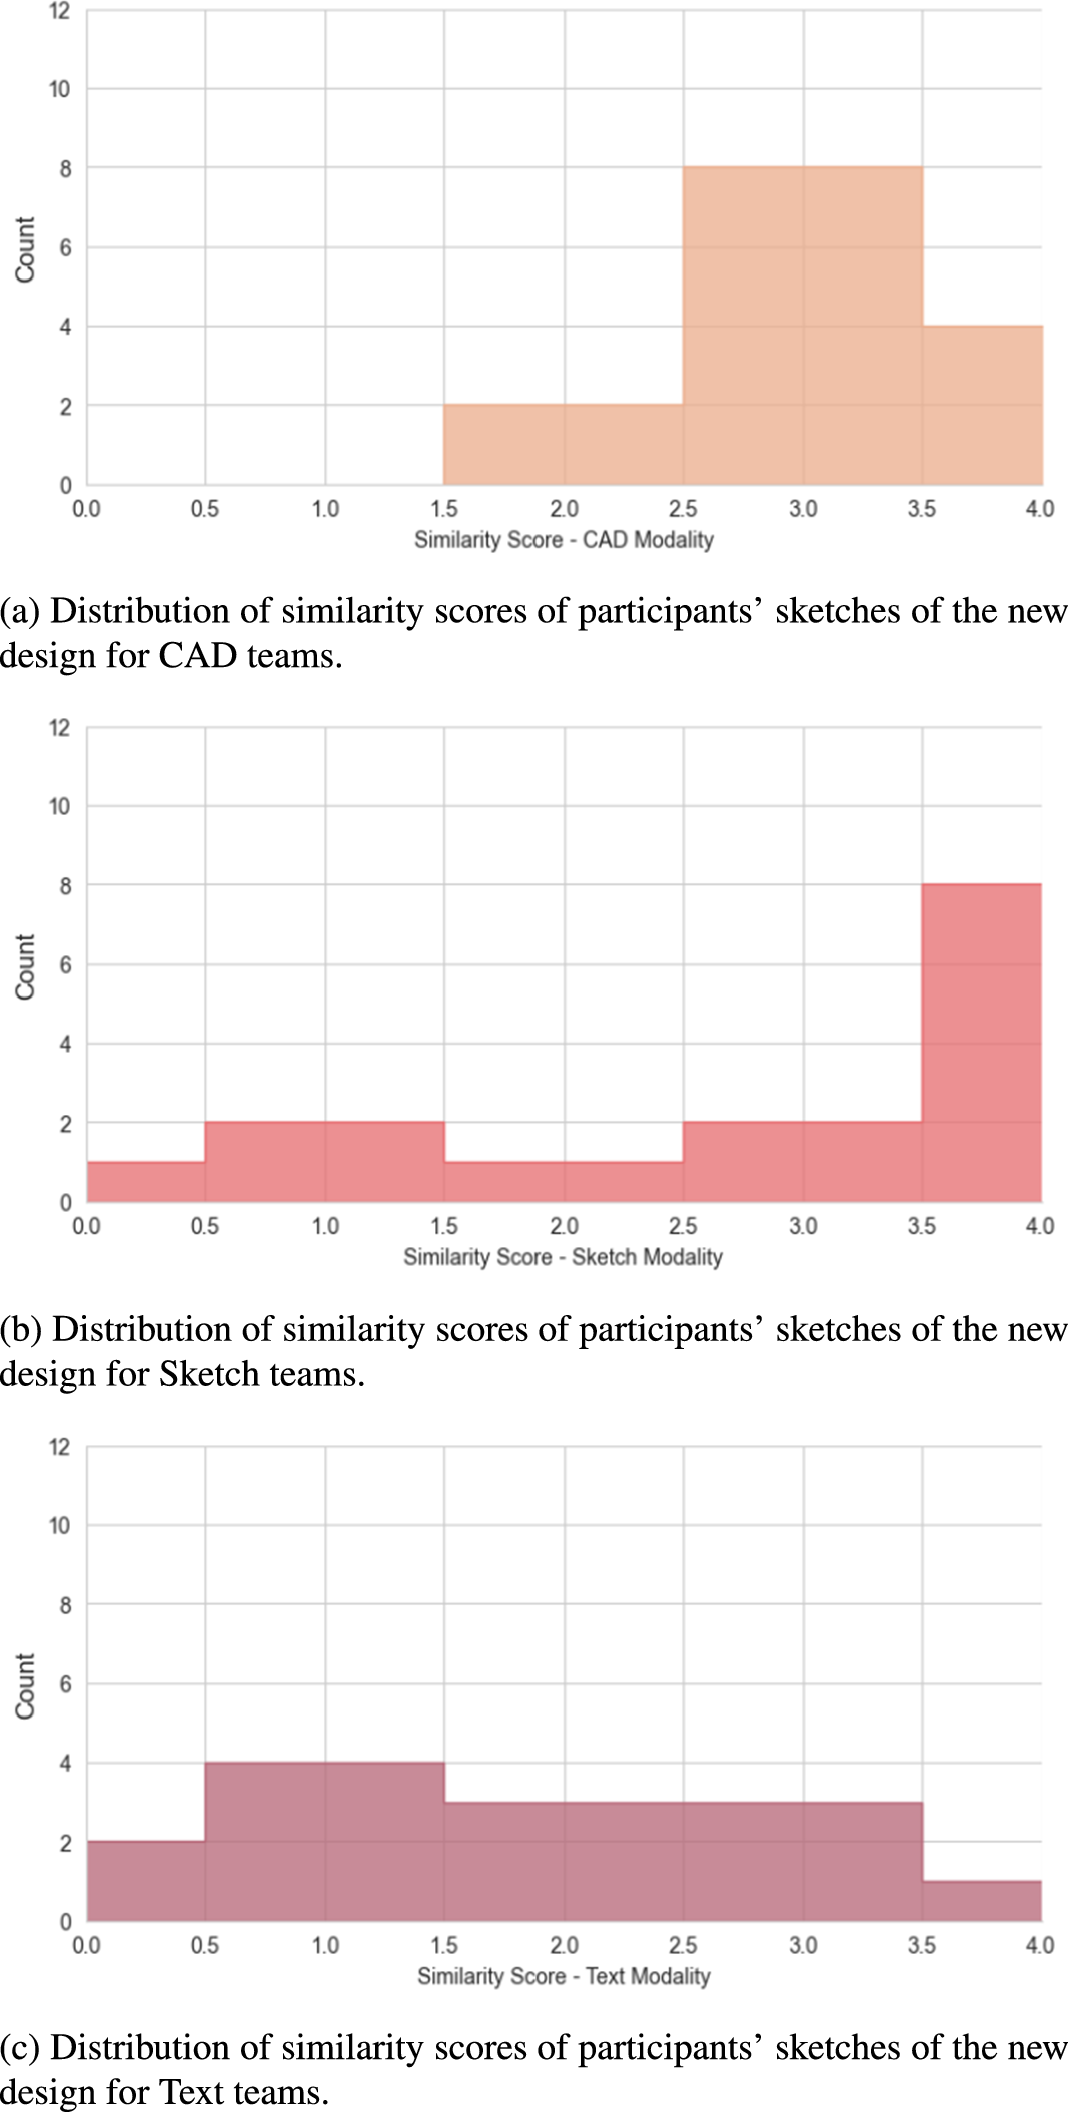
Figure 9. Distribution of similarity scores of participants’ sketches of the new design for different modalities.
4.1.3. Survey
The average results of participants’ self-evaluation on the level of shared understanding in the team about the original design before the design activity, regarding its function, behavior, structure and overall evaluation, are shown in Figure 10 with error bars indicating a 95% confidence interval. There is no statistical difference among the three experiment conditions for Function ( $ F\left(2,79\right)=0.645 $
,
$ F\left(2,79\right)=0.645 $
, $ p=0.527 $
,
$ p=0.527 $
, $ {\eta}^2=0.016 $
), Behavior (
$ {\eta}^2=0.016 $
), Behavior ( $ F\left(2,79\right)=0.025 $
,
$ F\left(2,79\right)=0.025 $
, $ p=0.975 $
,
$ p=0.975 $
, $ {\eta}^2=0.001 $
), Structure (
$ {\eta}^2=0.001 $
), Structure ( $ F\left(2,79\right)=2.994 $
,
$ F\left(2,79\right)=2.994 $
, $ p=0.056 $
,
$ p=0.056 $
, $ {\eta}^2=0.070 $
) and Overall
$ {\eta}^2=0.070 $
) and Overall $ \Big(F\left(2,79\right)=0.487 $
,
$ \Big(F\left(2,79\right)=0.487 $
, $ p=0.616 $
,
$ p=0.616 $
, $ {\eta}^2=0.012 $
). The participants deemed them equally effective in constituting a shared understanding within the teams. However, other results may indicate otherwise, which will be discussed in later sections.
$ {\eta}^2=0.012 $
). The participants deemed them equally effective in constituting a shared understanding within the teams. However, other results may indicate otherwise, which will be discussed in later sections.
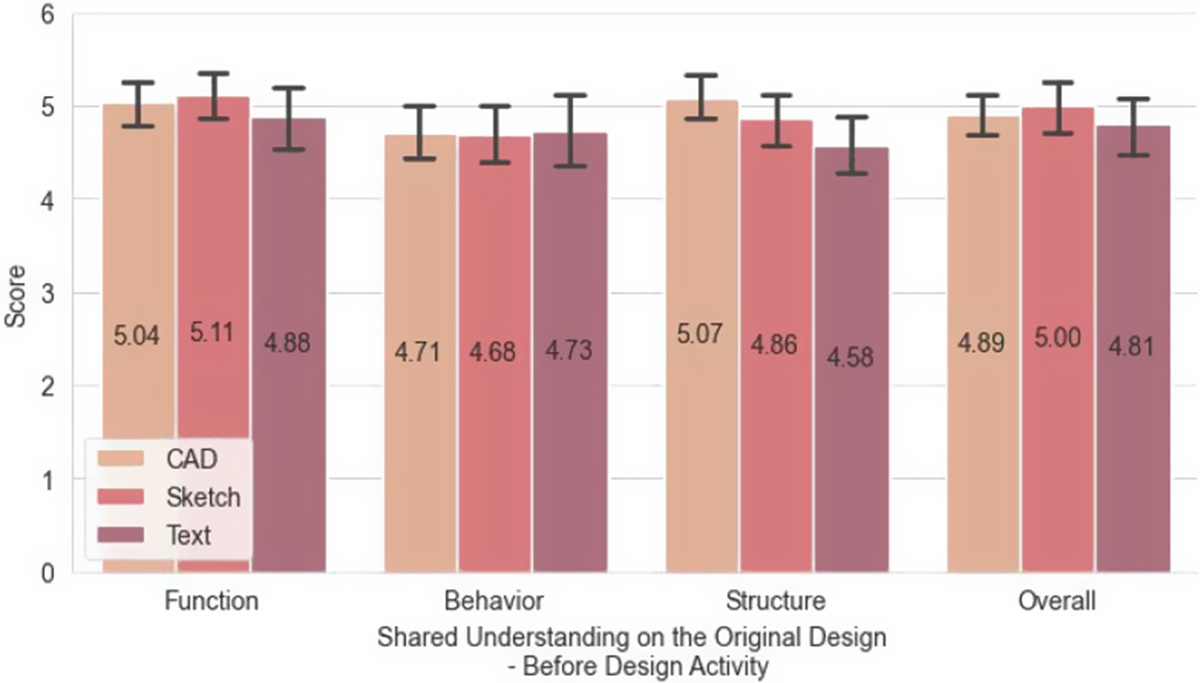
Figure 10. Survey result: self-evaluation on the level of shared understanding in the team about the original design before the design activity, regarding its function, behavior, structure and overall evaluation. Error bars represent a 95% confidence interval.
The average results of participants’ self-evaluation on the level of shared understanding in the team about the original design after the design activity and design report are shown in Figure 11 with error bars indicating a 95% confidence interval. No statistical difference is found among the three experiment conditions for Function ( $ F\left(2,79\right)=0.645 $
,
$ F\left(2,79\right)=0.645 $
, $ p=0.527 $
,
$ p=0.527 $
, $ {\eta}^2=0.016 $
), Behavior (
$ {\eta}^2=0.016 $
), Behavior ( $ F\left(2,79\right)=1.682 $
,
$ F\left(2,79\right)=1.682 $
, $ p=0.193 $
,
$ p=0.193 $
, $ {\eta}^2=0.041 $
), Structure (
$ {\eta}^2=0.041 $
), Structure ( $ F\left(2,79\right)=2.799 $
,
$ F\left(2,79\right)=2.799 $
, $ p=0.067 $
,
$ p=0.067 $
, $ {\eta}^2=0.066 $
) and Overall (
$ {\eta}^2=0.066 $
) and Overall ( $ F\left(2,79\right)=0.905 $
,
$ F\left(2,79\right)=0.905 $
, $ p=0.409 $
,
$ p=0.409 $
, $ {\eta}^2=0.022 $
). Again, the participants deemed them equally effective in constituting a shared understanding within the teams.
$ {\eta}^2=0.022 $
). Again, the participants deemed them equally effective in constituting a shared understanding within the teams.
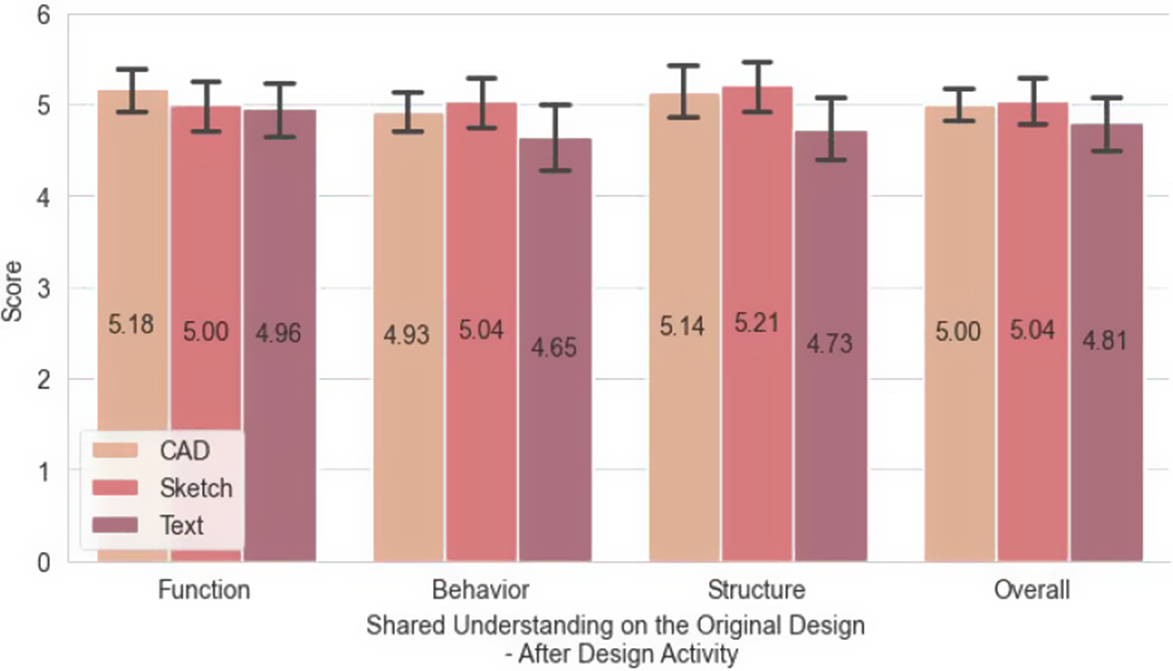
Figure 11. Survey result: self-evaluation on the level of shared understanding in the team about the original design after the design activity, regarding its function, behavior, structure and overall evaluation. Error bars represent a 95% confidence interval.
The average differences between participants’ self-evaluation on the level of shared understanding in the team about the original design before and after the design activity are shown in Figure 12 with error bars indicating a 95% confidence interval. There is no statistical difference found among the three experiment conditions for Function ( $ F\left(2,79\right)=1.090 $
,
$ F\left(2,79\right)=1.090 $
, $ p=0.341 $
,
$ p=0.341 $
, $ {\eta}^2=0.027 $
), Behavior (
$ {\eta}^2=0.027 $
), Behavior ( $ F\left(2,79\right)=2.301 $
,
$ F\left(2,79\right)=2.301 $
, $ p=0.107 $
,
$ p=0.107 $
, $ {\eta}^2=0.055 $
), Structure (
$ {\eta}^2=0.055 $
), Structure ( $ F\left(2,79\right)=0.774 $
,
$ F\left(2,79\right)=0.774 $
, $ p=0.465 $
,
$ p=0.465 $
, $ {\eta}^2=0.019 $
) and Overall (
$ {\eta}^2=0.019 $
) and Overall ( $ F\left(2,79\right)=0.232 $
,
$ F\left(2,79\right)=0.232 $
, $ p=0.794 $
,
$ p=0.794 $
, $ {\eta}^2=0.006 $
), indicating the design representation did not affect the development of shared understanding about the original design, based on participants’ self-evaluations.
$ {\eta}^2=0.006 $
), indicating the design representation did not affect the development of shared understanding about the original design, based on participants’ self-evaluations.
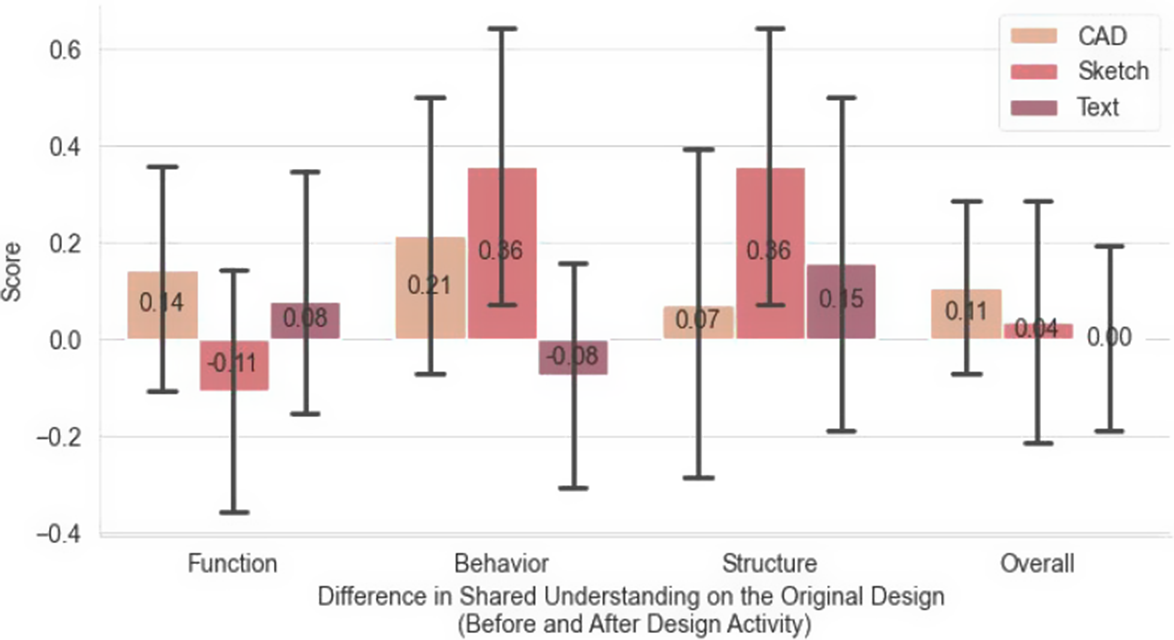
Figure 12. Survey result: difference in self-evaluation on the level of shared understanding in the team about the original design before and after the design activity, regarding its function, behavior, structure and overall evaluation. Error bars represent a 95% confidence interval.
The average results of participants’ self-evaluation on the level of shared understanding in the team about the new design are shown in Figure 13 with error bars indicating a 95% confidence interval. There are statistical differences found among the three experiment conditions for design structure ( $ F\left(2,79\right)=4.968 $
,
$ F\left(2,79\right)=4.968 $
, $ p=0.009 $
,
$ p=0.009 $
, $ {\eta}^2=0.112 $
) and overall evaluation (
$ {\eta}^2=0.112 $
) and overall evaluation ( $ F\left(2,79\right)=3.449 $
,
$ F\left(2,79\right)=3.449 $
, $ p=0.037 $
,
$ p=0.037 $
, $ {\eta}^2=0.080 $
), but not for design function (
$ {\eta}^2=0.080 $
), but not for design function ( $ F\left(2,79\right)=0.881 $
,
$ F\left(2,79\right)=0.881 $
, $ p=0.418 $
,
$ p=0.418 $
, $ {\eta}^2=0.022 $
) and behavior (
$ {\eta}^2=0.022 $
) and behavior ( $ F\left(2,79\right)=1.360 $
,
$ F\left(2,79\right)=1.360 $
, $ p=0.263 $
,
$ p=0.263 $
, $ {\eta}^2=0.033 $
). Follow-up t-tests found that for constructing shared understanding in teams in general, there is a significant difference with a medium effect size between using sketch and text as design representations (
$ {\eta}^2=0.033 $
). Follow-up t-tests found that for constructing shared understanding in teams in general, there is a significant difference with a medium effect size between using sketch and text as design representations ( $ t(52)=2.604 $
,
$ t(52)=2.604 $
, $ p=0.012 $
, Cohen’s
$ p=0.012 $
, Cohen’s $ d=0.703 $
). In addition, there is a significant difference with a large effect size for establishing a shared understanding of the structure of the new design between the sketch and text conditions (
$ d=0.703 $
). In addition, there is a significant difference with a large effect size for establishing a shared understanding of the structure of the new design between the sketch and text conditions ( $ t(52)=3.109 $
,
$ t(52)=3.109 $
, $ p=0.003 $
, Cohen’s
$ p=0.003 $
, Cohen’s $ d=0.839 $
). However, there is no significant difference between the CAD model and the sketch conditions, and between the CAD model and text-only conditions.
$ d=0.839 $
). However, there is no significant difference between the CAD model and the sketch conditions, and between the CAD model and text-only conditions.
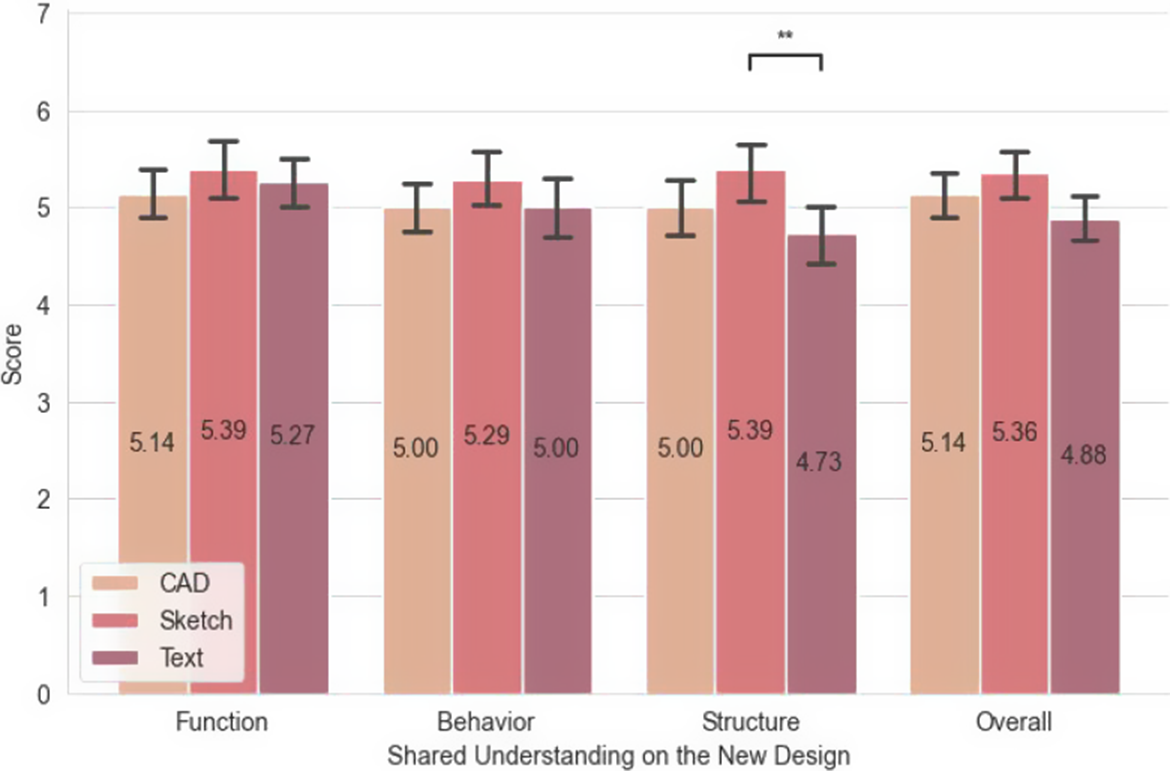
Figure 13. Survey result: self-evaluation on the level of shared understanding in the team about the new design, regarding its function, behavior, structure and overall evaluation. Error bars represent a 95% confidence interval.
4.1.4. Team conversation
Under the current framework of assessing team shared understanding through conceptual learning and the thematic coding scheme, we observed the development of shared understanding in teams through team conversations in all three conditions. With thematic analysis, we found evidence of the teams developing a shared understanding of the design activity, documented by occurrences of both conceptual learning and feedback. However, we did not find noticeable differences across the three experimental conditions in the number of instances showing such development of shared understanding. This largely matches the findings of the analysis on the design report and self-reported survey results. We also observed instances that indicated some deficiencies of shared understanding in teams, mainly in the expression of confusion and impasses. However, the rate of occurrence is not meaningfully different when considered across different design representations.
Even though we did not find distinctive differences across the three experimental conditions in patterns of shared understanding development through quantitative analysis of team conversation, we did observe qualitative evidence that design representations can affect the team’s problem-solving behavior. These insights will be discussed in greater detail in the following section.
5. Discussion
This study partially confirms our first hypothesis (H1) that the modality of the design artifacts used in the collaborative engineering design process would affect the development of shared understanding in engineering design teams. Specifically, the statistical test results indicate that using a visual representation (sketch or CAD) may be associated with an improved team-shared understandings of the design’s structure. However, our second hypothesis (H2), that a more complex modality would better facilitate the development of shared understanding than a simpler modality, is not supported. No statistical differences were found between the sketch modality and CAD modality.
5.1. Modality mainly affects the design structure
The quantitative results suggest that visual representation could potentially improve team-shared understanding of the design structure.
5.1.1. Design structure shows the biggest difference in self-evaluated shared understanding
The surveys found no statistical differences in the self-evaluations of the shared understanding of the original design, either before or after the design activity. From the perspective of the participants, all three tested design representations are equally valuable for establishing team-shared understanding. Interestingly, a trend towards significance is only observed for the evaluation of the structure of the original design, with medium effects found both before ( $ p=0.056 $
,
$ p=0.056 $
, $ {\eta}^2=0.070 $
) and after (
$ {\eta}^2=0.070 $
) and after ( $ p=0.067 $
,
$ p=0.067 $
, $ {\eta}^2=0.066 $
) the design activity. Furthermore, self-evaluated shared understandings of the revised design are significantly higher when using a sketch than text only. The data also reveals significant deficiencies in depicting the structure of the design for the text-only condition. However, no significant difference is found for the function and behavior aspects of the design. These findings lead to the speculation that the overall deficiency in the shared understanding of the text-only condition is a result of a lack of understanding of the design structure.
$ {\eta}^2=0.066 $
) the design activity. Furthermore, self-evaluated shared understandings of the revised design are significantly higher when using a sketch than text only. The data also reveals significant deficiencies in depicting the structure of the design for the text-only condition. However, no significant difference is found for the function and behavior aspects of the design. These findings lead to the speculation that the overall deficiency in the shared understanding of the text-only condition is a result of a lack of understanding of the design structure.
5.1.2. Individual understanding may support the shared understanding
The surveys also captured self-reported quantitative assessments of individual understanding of the designs alongside those of shared understanding. Although the self-reported individual understanding of the designs does not directly connect to shared understanding, the results can be a valuable source for understanding the findings in the assessment of team shared understanding.
Through ANOVA tests, it is found that there are statistical differences among the three experiment conditions for the individual understanding of the original design before the design activity for the design structure ( $ F\left(2,79\right)=12.033 $
,
$ F\left(2,79\right)=12.033 $
, $ p<0.001 $
,
$ p<0.001 $
, $ {\eta}^2=0.233 $
), but not for design function (
$ {\eta}^2=0.233 $
), but not for design function ( $ F\left(2,79\right)=0.597 $
,
$ F\left(2,79\right)=0.597 $
, $ p=0.553 $
,
$ p=0.553 $
, $ {\eta}^2=0.015 $
), behavior (
$ {\eta}^2=0.015 $
), behavior ( $ F\left(2,79\right)=1.163 $
,
$ F\left(2,79\right)=1.163 $
, $ p=0.318 $
,
$ p=0.318 $
, $ {\eta}^2=0.029 $
) and overall evaluation (
$ {\eta}^2=0.029 $
) and overall evaluation ( $ F\left(2,79\right)=0.690 $
,
$ F\left(2,79\right)=0.690 $
, $ p=0.504 $
,
$ p=0.504 $
, $ {\eta}^2=0.017 $
). Follow-up t-tests found that for the self-reported individual understanding of the structure of the original design before the design activity, there is a significant difference with a large effect size between using sketch and text as design representations (
$ {\eta}^2=0.017 $
). Follow-up t-tests found that for the self-reported individual understanding of the structure of the original design before the design activity, there is a significant difference with a large effect size between using sketch and text as design representations ( $ t(52)=3.501 $
,
$ t(52)=3.501 $
, $ p=0.001 $
, Cohen’s
$ p=0.001 $
, Cohen’s $ d=0.945 $
), and between using CAD model and text (
$ d=0.945 $
), and between using CAD model and text ( $ t(52)=4.927 $
,
$ t(52)=4.927 $
, $ p<0.001 $
, Cohen’s
$ p<0.001 $
, Cohen’s $ d=1.328 $
). However, there is no significant difference between the CAD model and the sketch conditions (
$ d=1.328 $
). However, there is no significant difference between the CAD model and the sketch conditions ( $ t(54)=1.146 $
,
$ t(54)=1.146 $
, $ p=0.257 $
, Cohen’s
$ p=0.257 $
, Cohen’s $ d=0.304 $
).
$ d=0.304 $
).
After the design activity, participants reported individual understanding with statistical differences among the three experiment conditions for design structure ( $ F\left(2,79\right)=10.912 $
,
$ F\left(2,79\right)=10.912 $
, $ p<0.001 $
,
$ p<0.001 $
, $ {\eta}^2=0.216 $
) and overall evaluation (
$ {\eta}^2=0.216 $
) and overall evaluation ( $ F\left(2,79\right)=6.546 $
,
$ F\left(2,79\right)=6.546 $
, $ p=0.002 $
,
$ p=0.002 $
, $ {\eta}^2=0.142 $
), but not for design function (
$ {\eta}^2=0.142 $
), but not for design function ( $ F\left(2,79\right)=1.537 $
,
$ F\left(2,79\right)=1.537 $
, $ p=0.221 $
,
$ p=0.221 $
, $ {\eta}^2=0.037 $
) and behavior (
$ {\eta}^2=0.037 $
) and behavior ( $ F\left(2,79\right)=2.693 $
,
$ F\left(2,79\right)=2.693 $
, $ p=0.074 $
,
$ p=0.074 $
, $ {\eta}^2=0.064 $
). Follow-up t-tests found that for the self-reported individual understanding of the structure of the original design after the design activity, there is a significant difference with a large effect size between using sketch and text as design representations (
$ {\eta}^2=0.064 $
). Follow-up t-tests found that for the self-reported individual understanding of the structure of the original design after the design activity, there is a significant difference with a large effect size between using sketch and text as design representations ( $ t(52)=3.535 $
,
$ t(52)=3.535 $
, $ p=0.001 $
, Cohen’s
$ p=0.001 $
, Cohen’s $ d=0.952 $
), and between using CAD model and text (
$ d=0.952 $
), and between using CAD model and text ( $ t(52)=4.203 $
,
$ t(52)=4.203 $
, $ p<0.001 $
, Cohen’s
$ p<0.001 $
, Cohen’s $ d=1.118 $
). However, there is no significant difference between the CAD model and the sketch conditions (
$ d=1.118 $
). However, there is no significant difference between the CAD model and the sketch conditions ( $ t(54)=0.351 $
,
$ t(54)=0.351 $
, $ p=0.727 $
, Cohen’s
$ p=0.727 $
, Cohen’s $ d=0.093 $
). In addition, there is a significant difference with a large effect size for the overall individual understanding between using sketch and text as design representations (
$ d=0.093 $
). In addition, there is a significant difference with a large effect size for the overall individual understanding between using sketch and text as design representations ( $ t(52)=3.256 $
,
$ t(52)=3.256 $
, $ p=0.002 $
, Cohen’s
$ p=0.002 $
, Cohen’s $ d=0.879 $
), and a significant difference with a medium effect size between using CAD model and text as design representations (
$ d=0.879 $
), and a significant difference with a medium effect size between using CAD model and text as design representations ( $ t(52)=2.911 $
,
$ t(52)=2.911 $
, $ p=0.005 $
, Cohen’s
$ p=0.005 $
, Cohen’s $ d=0.782 $
). Again, there is no significant difference between the CAD model and the sketch conditions (
$ d=0.782 $
). Again, there is no significant difference between the CAD model and the sketch conditions ( $ t(54)=0.573 $
,
$ t(54)=0.573 $
, $ p=0.569 $
, Cohen’s
$ p=0.569 $
, Cohen’s $ d=0.152 $
).
$ d=0.152 $
).
However, there is no significant difference found across conditions when comparing individual understanding of the new design.
The results from individual understanding suggest the lower level of shared understanding in design structure could be a result of the lower individual understanding of the design.
5.1.3. Finer design detail is the key
The results from the analysis of the design report provide more insights. Based on the data and the statistical tests conducted, no significant difference is shown in the factual question responses in the design report across three experiment conditions for both the original design and the new design. However, significant differences were found in the level of shared understanding shown in the design sketches. From the design sketch results, sketch and CAD are significantly better at facilitating a shared understanding in the teams than text for both the original and the new designs. The design sketch results support the prior work suggesting that visual representations promote shared understanding and collaboration in prior research (Saad & Maher Reference Saad and Maher1996; Kalay Reference Kalay2001).
A potential cause for the mismatched results found in the factual questions and the design sketches in the design reports is that the factual questions examine broader-scale facts about the designs, such as the function and behavior of the design, while the design sketches also depict the much finer details of the designs, including the design structure. Teams in all three conditions could understand the relatively high-level design mechanisms covered in the factual questions and communicate them well. However, for the much finer details of the design exposed in the design sketch, especially structural details, without spatial information, the information carried in the text description may not be sufficient to re-construct the designs accurately in the finer details. This can lead to a lower level of shared understanding in the text-only teams.
These findings further strengthen the speculation that the lower shared understanding of the text-only teams results from a lack of understanding of the design structure, as the structure of the designs can be much better captured by design sketches over factual questions.
5.2. Sketch and CAD models are equally effective
Throughout the quantitative analysis, the CAD model and the sketch conditions showed similar levels of shared understanding of the function, behavior and structure of the designs. In this study, the CAD model and the sketch are equally effective in building shared understanding in teams, disproving our second hypothesis (H2) that a more complex modality would better facilitate the development of shared understanding than a simpler modality. Our results match the findings in the existing literature that the complexity and information richness of the design artifacts will not affect team communication and the development of shared understanding (Krishnakumar et al. Reference Krishnakumar, Letting, Soria Zurita and Menold2023; Krishnakumar et al. Reference Krishnakumar, Letting, Johnson, Zurita and Menold2023; Letting et al. Reference Letting, Krishnakumar, Johnson, Zurita and Menold2023).
In addition, the CAD and the sketch teams reported similar levels of self-evaluated individual understanding of the function, behavior and structure of the designs. This finding resonates well with prior studies on the interpretability of the different representations, which show that using sketches or CAD models could achieve the same level of understanding of the design for the function of the design (Hannah et al. Reference Hannah, Joshi and Summers2012). However, unlike the prior work, we did not observe the benefit of achieving a higher understanding of the geometry or the structure of the design using CAD models over sketches (Hannah et al. Reference Hannah, Joshi and Summers2012). One potential reason for the different results can be the difference in complexity of the design developed or examined in the study. The designs used in the work of Hannah et al. (Reference Hannah, Joshi and Summers2012) include an Annulus and a Mini-go-round with motors and gear system, which are generally more complex, with more features and components, than the original design and those developed by the participants in this study. With more complicated designs, the 3D view of the CAD models and the additional viewpoints can be beneficial for understanding the structure of the design. However, please note that these findings only apply to individual understanding of the designs, as shared understanding in teams was not assessed in the work of Hannah et al. (Reference Hannah, Joshi and Summers2012).
5.3. Preference for sketches found in team conversation
Some of the findings from the quantitative results could also be found in the team conversations. Through semantic analysis, it is found that the value of visual representations is greatly appreciated by the participants. One of the participants in the CAD model condition stated during the design activity that if they only had the text description of the design, they “would not get it as easily.”[P#45].
The desire for visual representation in design communication is apparent in text-only teams. We noticed that multiple text-only teams expressed frustration not having a sketch or a CAD model, as they found it difficult to understand the design or communicate design ideas without any visual representation. One participant in the text-only condition stated “it’s kind of hard to design without SolidWorks or something”[P#23] while working on the re-design. Another participant from a different session with text as a design representation stated it is “definitely hard to imagine without a model or drawing”[P#65] as they trying to picture the design and understand it. A conversation that happened in another text-only session also shows the challenge of designing without a visual representation. They found “it sucks” that they “can’t really draw” to communicate the design ideas. These insights from the team conversations resonate well with previous findings on the positive impacts of visual representation on the development of shared understanding, as shown in the higher level of shared understanding in design structure reported in surveys and the higher level of shared understanding in general found in design sketches for sketch and CAD conditions.
Interestingly, some teams in the CAD condition expressed a desire to sketch, but not vice versa, even though the previous results show that the CAD model is as effective for building team-shared understanding as sketches. One team in the CAD model condition stated that “it feels so weird not being able to sketch anything,” as they “usually communicate with drawings”[P#45, P#46]for design ideas. Another CAD team also stated they “wish” they “could sketch” the design to express themselves and they feel “it’s hard to not be able to draw.”[P#81, P#82].
It seems that sketch is the more favored modality in this design activity as participants in the other two conditions commented that they would have liked to sketch, whereas no one in the sketch condition asked for another modality. Considering the experiment process focuses on conceptual design and involves ideation and creation, it is not surprising that sketch is generally preferred, as it is regarded by many as one of the best design representations to use for design ideation and early-stage design communication (McKoy et al. Reference McKoy, Vargas-Hern’andez, Summers and Shah2001; Tversky et al. Reference Tversky, Suwa, Agrawala, Heiser, Stolte, Hanrahan, Phan, Klingner, Daniel, Lee, Haymaker and Lindemann2003; Heiser et al. Reference Heiser, Tversky and Silverman2004; Macomber & Yang Reference Macomber and Yang2012; Worinkeng et al. Reference Worinkeng, Summers, Joshi and Stark2013).
Another potential cause for the population of the sketch modality is that the CAD model is generally deemed difficult to modify by the participants, and most participants in the CAD model condition do not want to modify the model even though they are given the option. None of the CAD model teams created a new CAD model and only one team made meaningful modifications to the provided CAD model of the original design. One participant in one of the CAD model teams thought about modifying the CAD model of the original design to reflect their design changes and re-design ideas but immediately gave up and stated “it would be way too difficult to do that.”[P#22] Another participant in a different session complained about the difficulty of modifying the CAD model as they were navigating through the model parts, and stated: “I hope I don’t ever have to do SolidWorks at my job.”[P#57] It is also surprising to see how well the teams in the CAD model condition developed a shared understanding of the design compared to the text-only teams, even if their design ideas were not directly visualized on the CAD model. This might suggest that visualization can support design collaboration even without explicit manipulation of the design artifact.
5.4. Implications
This study carries two major findings. Despite the quantitative results partially supporting our first hypothesis (H1), that modality would affect the development of shared understanding, we also observed that simple modality, such as text, can do just as well in some cases, especially in communicating function and behavior of the design. However, visual representations can sometimes be essential for communicating the structure of the design as they can carry more spatial information. Even though this study focuses on the early stages of design, the benefit of using visualization still shows.
In addition, sketching is found to be as effective as using CAD models to establish shared understanding in teams. This suggests that CAD models might not need to be the first choice for the early stages of design and establishing shared understanding, despite the additional benefits they bring to the later stages of engineering design. The benefits and drawbacks of using different design modalities should be considered comprehensively, given the extra time, cost and effort required to create complex modalities such as CAD models, which can also be perceived as more mentally intensive and challenging in skills to create.
The insights from this work could foster the development and utilization of formalized design artifacts in collaborative engineering design. It has potential implications for the use of textual chat-based communication, such as Slack and Discord (popular in many engineering companies), during stages of design that focus on details, especially spatial information. Such understanding is vital in the current digital age when team interactions lean more favorably towards text-based communication, as team members can be remotely or even globally distributed. In addition, the findings of this study can guide the proper development of automated design tools. Current AI/ML models have a heavy emphasis on text-based processing and communication. This work suggests that to better support engineering design practices, future AI design tool development should focus more on multi-modal capabilities, and making connections among textual, visual and spatial information.
6. Limitations and future work
This work faces several limitations. Firstly, this study only examined dyadic teams. Future work should further investigate teams with more than two members, which is more common in modern engineering design practices. Another limitation of this work lies in the participant pool. All participants are current college students. Though it is a representative sampling to reflect the impact of different experiment conditions, it may not be diverse enough to reflect the whole population of engineers and designers who will be using design representation for engineering design. As a result, certain traits of actual working professionals in the industry could be omitted in the process. Also, since most participants are sophomore students, they may have limited command of the engineering tools used in this study. Their difficulty in manipulating CAD models can be a result of their limited CAD skills. A larger and more diverse participant pool will be needed for future work to investigate the subject further in the context of real-world industrial applications. Thirdly, the design process examined in the experiment is rather short, at 20 min. Future work should also investigate the effect of design representation on team-shared understanding in design projects with increased complexity and a longer time span. Furthermore, the sketch representation given in this study, as shown in Appendix B, is organized with a dissected view without explicit demonstration of how each part or subsystem is connected together. This might lead participants to follow this style of illustration in the design sketches when finishing the design report, resulting in an ambiguous depiction of the design in terms of the relationship between components. As a result, it might lead to lower scores in shared understanding with the affected sketch condition and may affect the results on design reports.
Moreover, our study focused more on early-stage design. Future work should investigate the impact of different design modalities on other stages of the design process. Also, one thing that is important about our study is that designers were brought into the design without having come up with the original concept themselves. So our results might speak to new team members being added, especially to conceptual redesign. More research would need to be done to explore different phases such as coming up with a design from original conceptualization.
In addition, the results of this study could potentially be affected by the inattentiveness of the participants. We noticed various levels of disengagement for the participants in all conditions. Some participants lost focus on the design problem and discussed irrelevant topics despite of the researchers’ multiple reminders. Also, other aspects of team interaction, including turn-taking behaviors in team conversations and whether both team members are contributing equally, could also be a contributing factor to the findings, and further exploration is needed in the future. Furthermore, the inconsistency in self-reported survey results and objective design report results urges for a better way of quantitatively and objectively evaluating shared understanding in teams.
6.1. Limitations with self-reported results
In the survey results, there is no difference found for the self-reported level of shared understanding of the function and behavior of the design. Also, the difference in shared understanding about the structure of the design is much smaller in survey results compared to what design reports indicated. However, the participants in the text-only teams clearly faced difficulty understanding and communicating the design ideas, and stated their desire for a visual representation in the conversation. This shows that the participants overestimated their ability to obtain shared understanding with only verbal communication in general.
Upon further examination, we identify three major potential causes for the seemingly contradictory results. First, each experiment condition provides the participants with a detailed textual description of the original design. The textual description follows the Function-Behaviour-Structure (FBS) ontology to accurately describe the original design, making it possible for people to understand and imagine the design with some reasonable assumptions. Also, the design was relatively simple, reducing the amount of challenges and obstacles the participants needed to face when developing shared understanding.
Second, the experimental procedure does not specifically encourage the participants to scrutinize their understanding of the original design or check whether their understandings align with each other within the team. Moreover, participants do not have the ability to interact with the creator of the original design, which would be the researchers, so they have no way to check if their understanding of the design is correct. This means that participants have no reference point with which to evaluate their individual and shared understandings.
Lastly, the drawbacks generally associated with surveys and self-reported evaluations may also play an important role here. Without an anchor or a reference point for the participants to refer to and compare against, they may hold different interpretations of what each level of shared understanding means in the survey options (Eriksen & Hake Reference Eriksen and Hake1957; Fischhoff & MacGregor Reference Fischhoff and MacGregor1983). Even when the participants hold the same level of shared understanding, they may think and feel the level of shared understanding very differently, and end up with misleading, delusive or fallacious survey results. The error of central tendency could be another factor. The participants may underestimate their shared understanding when the level of shared understanding is high, and overestimate it when the level of shared understanding is actually low (Hollingworth Reference Hollingworth1910). Under the influence of the central tendency of judgment, the survey responses would gravitate toward a medium value, smoothing out the difference among the three experiment conditions. In addition, the problem of social desirability bias might be present as well. The participants may tend to choose the options indicating a higher level of shared understanding to avoid looking incompetent and to stay as one of the majority of the group, even when they have a much lower level of shared understanding in the teams (Nederhof Reference Nederhof1985; Fisher & Katz Reference Fisher and Katz2000). Other common biases of self-reported surveys may also affect the results. All these factors could contribute to the outcome that the survey results for all three conditions look largely the same.
6.2. Control for confounding variables
We identified and controlled for one major confounding variable for the experiment: the background and previous experience of the participants. The technical background may affect the participants’ approach and attitude toward different design representations, and may affect the outcome. Since the participants are recruited from the same task-related course, it could be assumed that they possess similar technical competencies. In addition, this problem is mitigated by random assignment and the collection of their prior experience with each design representation with surveys. Random assignment helps to ensure an unbiased experimental condition as people with different technical efficiencies and skills are randomly matched.
7. Conclusion
This work investigates the impact of design representation modalities on the development of shared understanding in collaborative engineering design. The results show that the modality does affect the development of shared understanding in design teams. Using a visual representation, such as a sketch or a CAD model, better facilitates the development of a shared understanding of the design compared to only using text for communication, but mostly about design structure. This holds true even in the early stages of design. Also, no significant difference is found between using a more complex and sophisticated artifact, like a CAD model, and using a simpler modality, like a sketch. The findings suggest using visual representations for collaborative engineering design practices to yield better team outcomes regardless of the complexity of the visual design representation used. However, team conversations showed that CAD software’s relatively high skill requirement could hinder designers’ ability and willingness to work with the tool, and there are benefits in improvising CAD and related 3D design tools to allow effortless interaction and creation. This work also stresses the need for external, objective and comprehensive measures of shared understanding from more diverse components of shared understanding, as people can falsely perceive a higher level of shared understanding in teams when the developed shared understanding is aggregated but not on specifics. In addition, this work restates the importance of using visual representation, especially sketches, for engineering design collaboration in the current age when companies embrace hybrid or remote working settings and team interactions constantly involve text-dominant online communications. This study also suggests that to better support engineering design practices, there is a need for the development of collaboratively sketching tools and future multi-modal AI design tools that connect textual, visual and spatial information.
Acknowledgments
Thanks are due to Paulo Carvalho and Shiyi Liu for their assistance and feedback on the experiment design of this work. The authors are also grateful to Wenzhuo Xu and Qiwei Shen for their help in creating the design artifacts used in this work.
A. Appendix A: Design Problem Handout
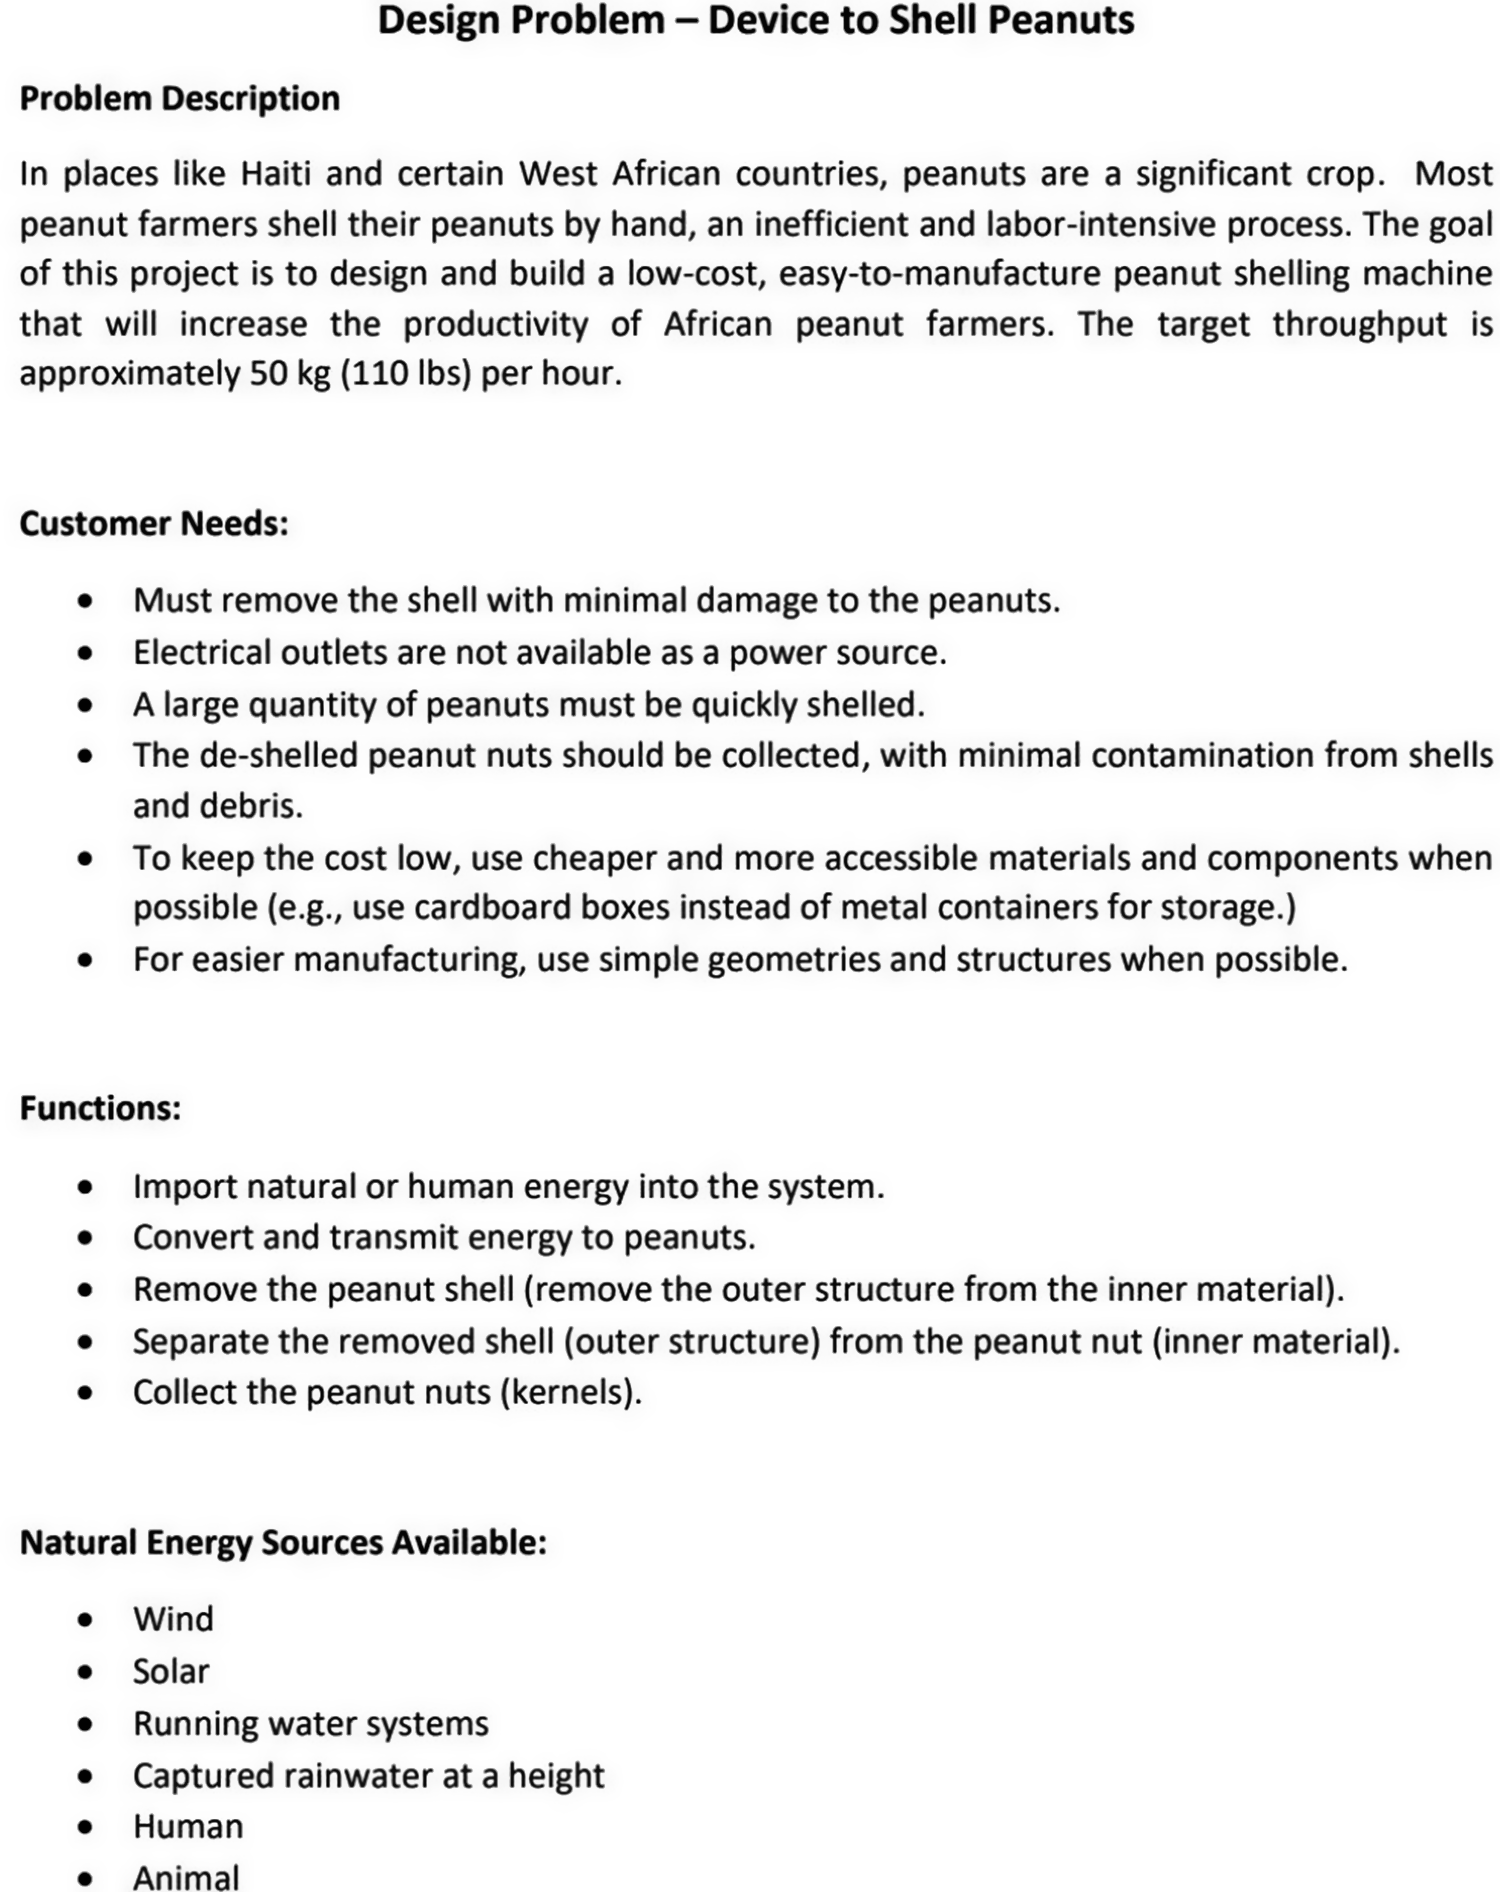
Figure A1.
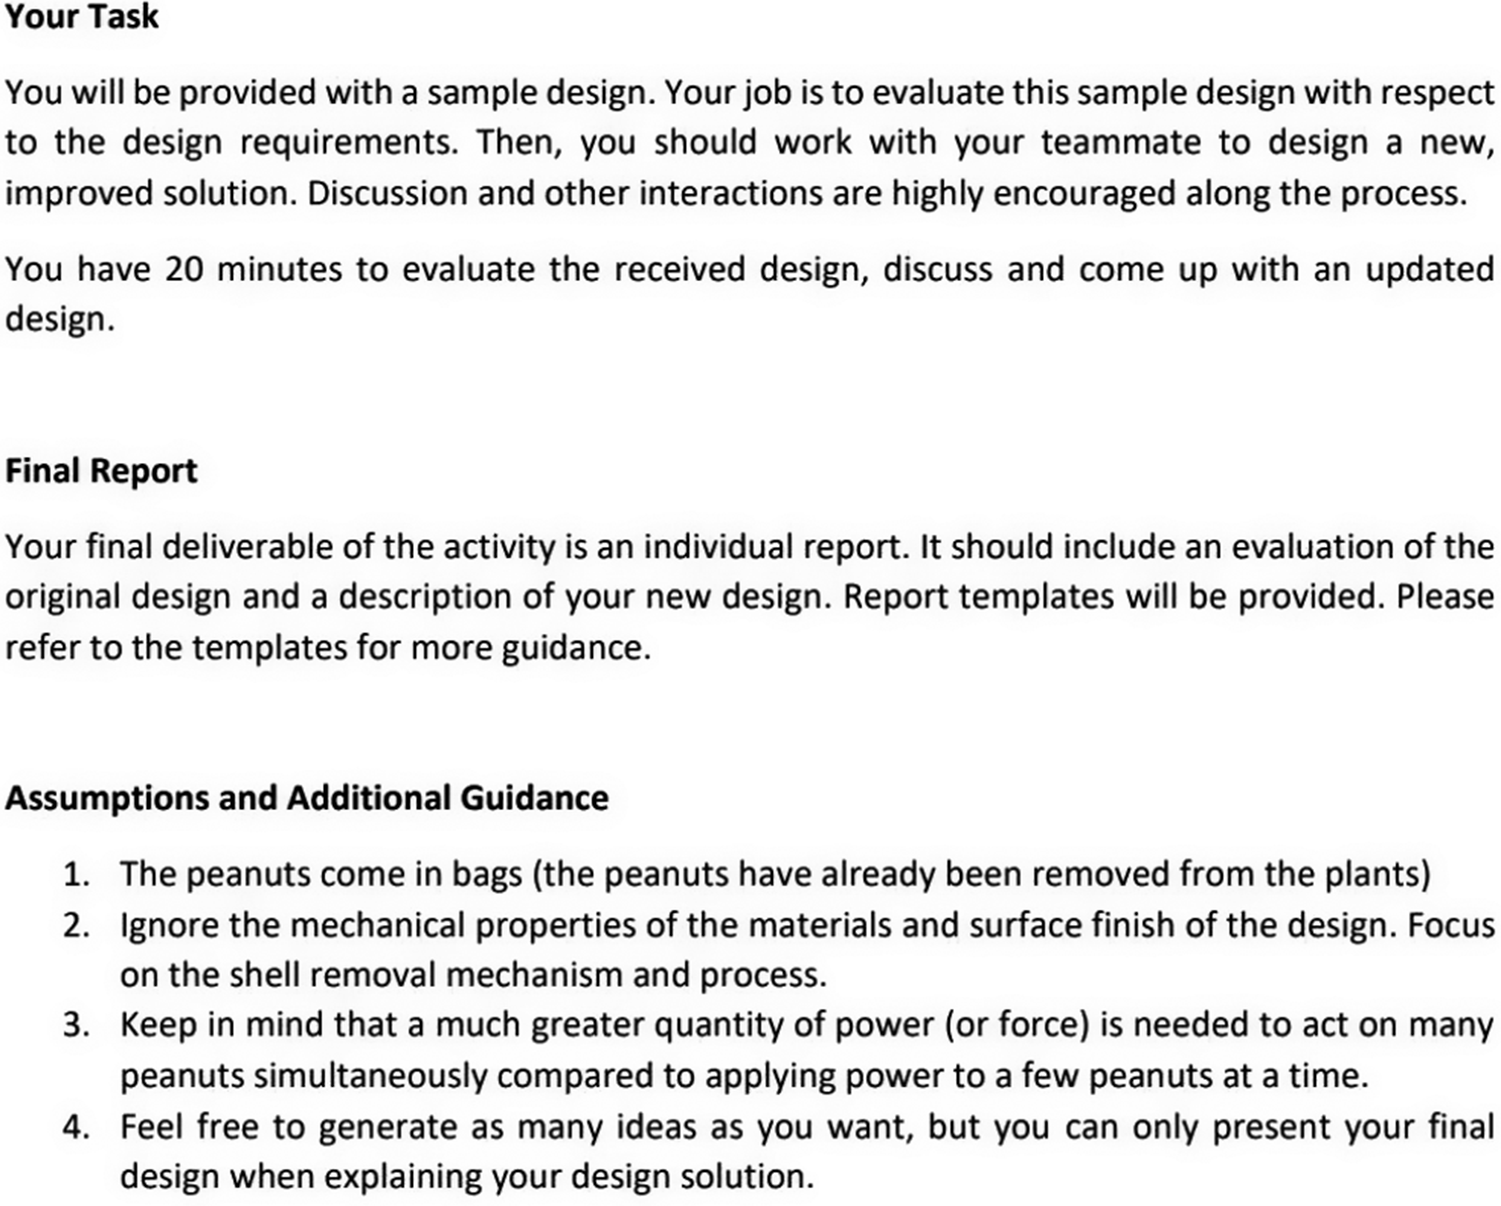
Figure A2.
B. Appendix B: Design Representation for the Sample Design
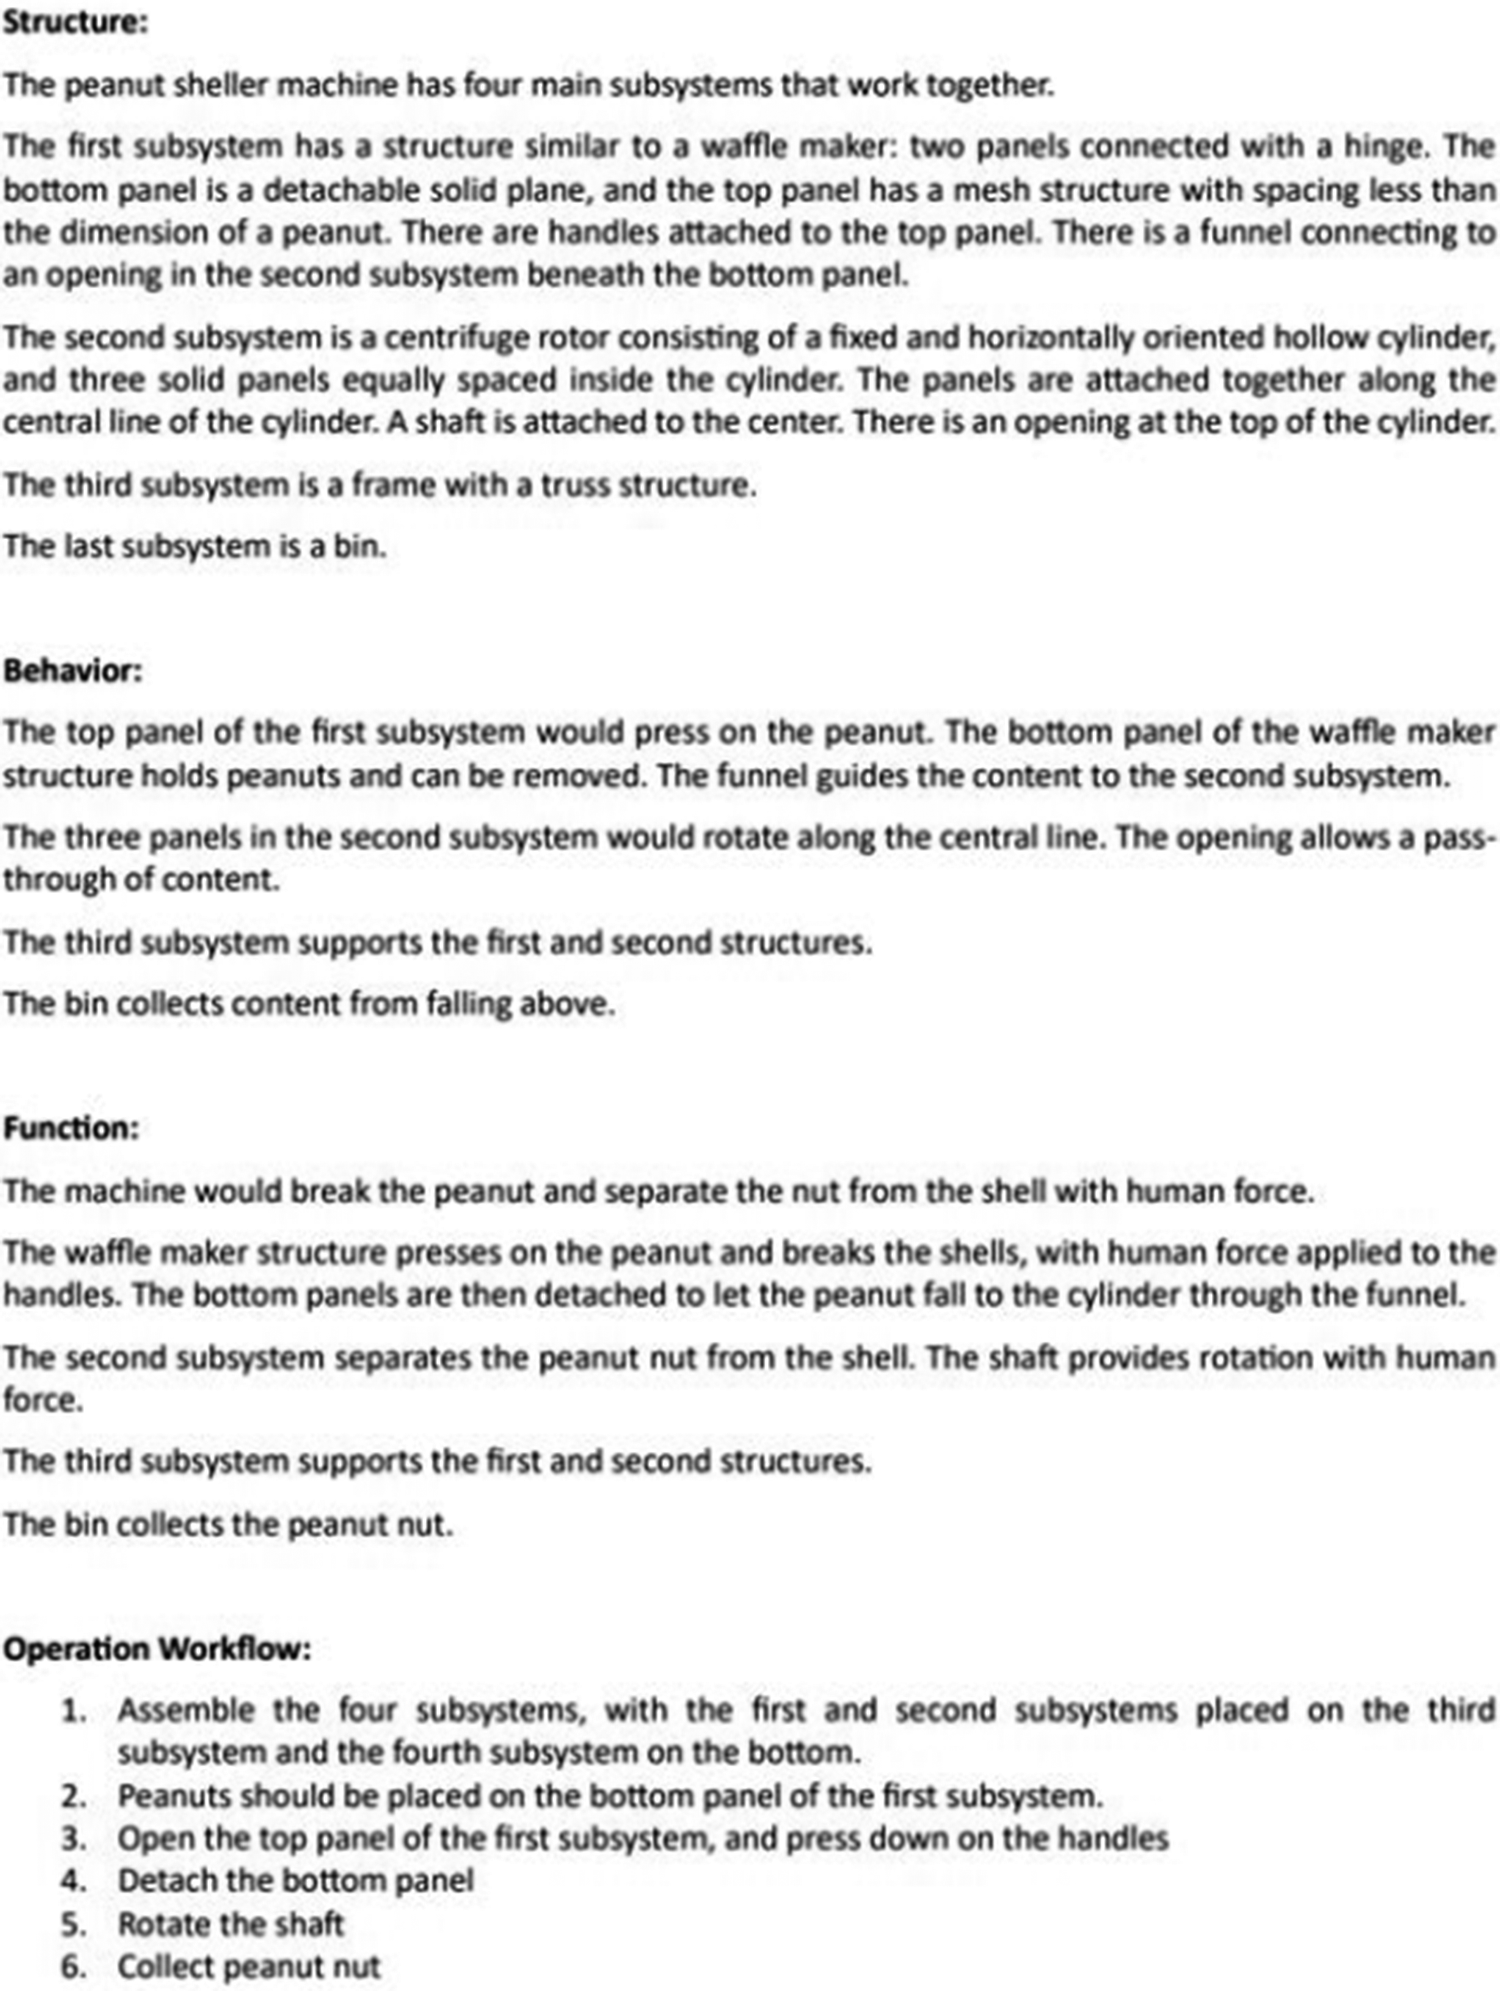
Figure B1. Design representation: text description.
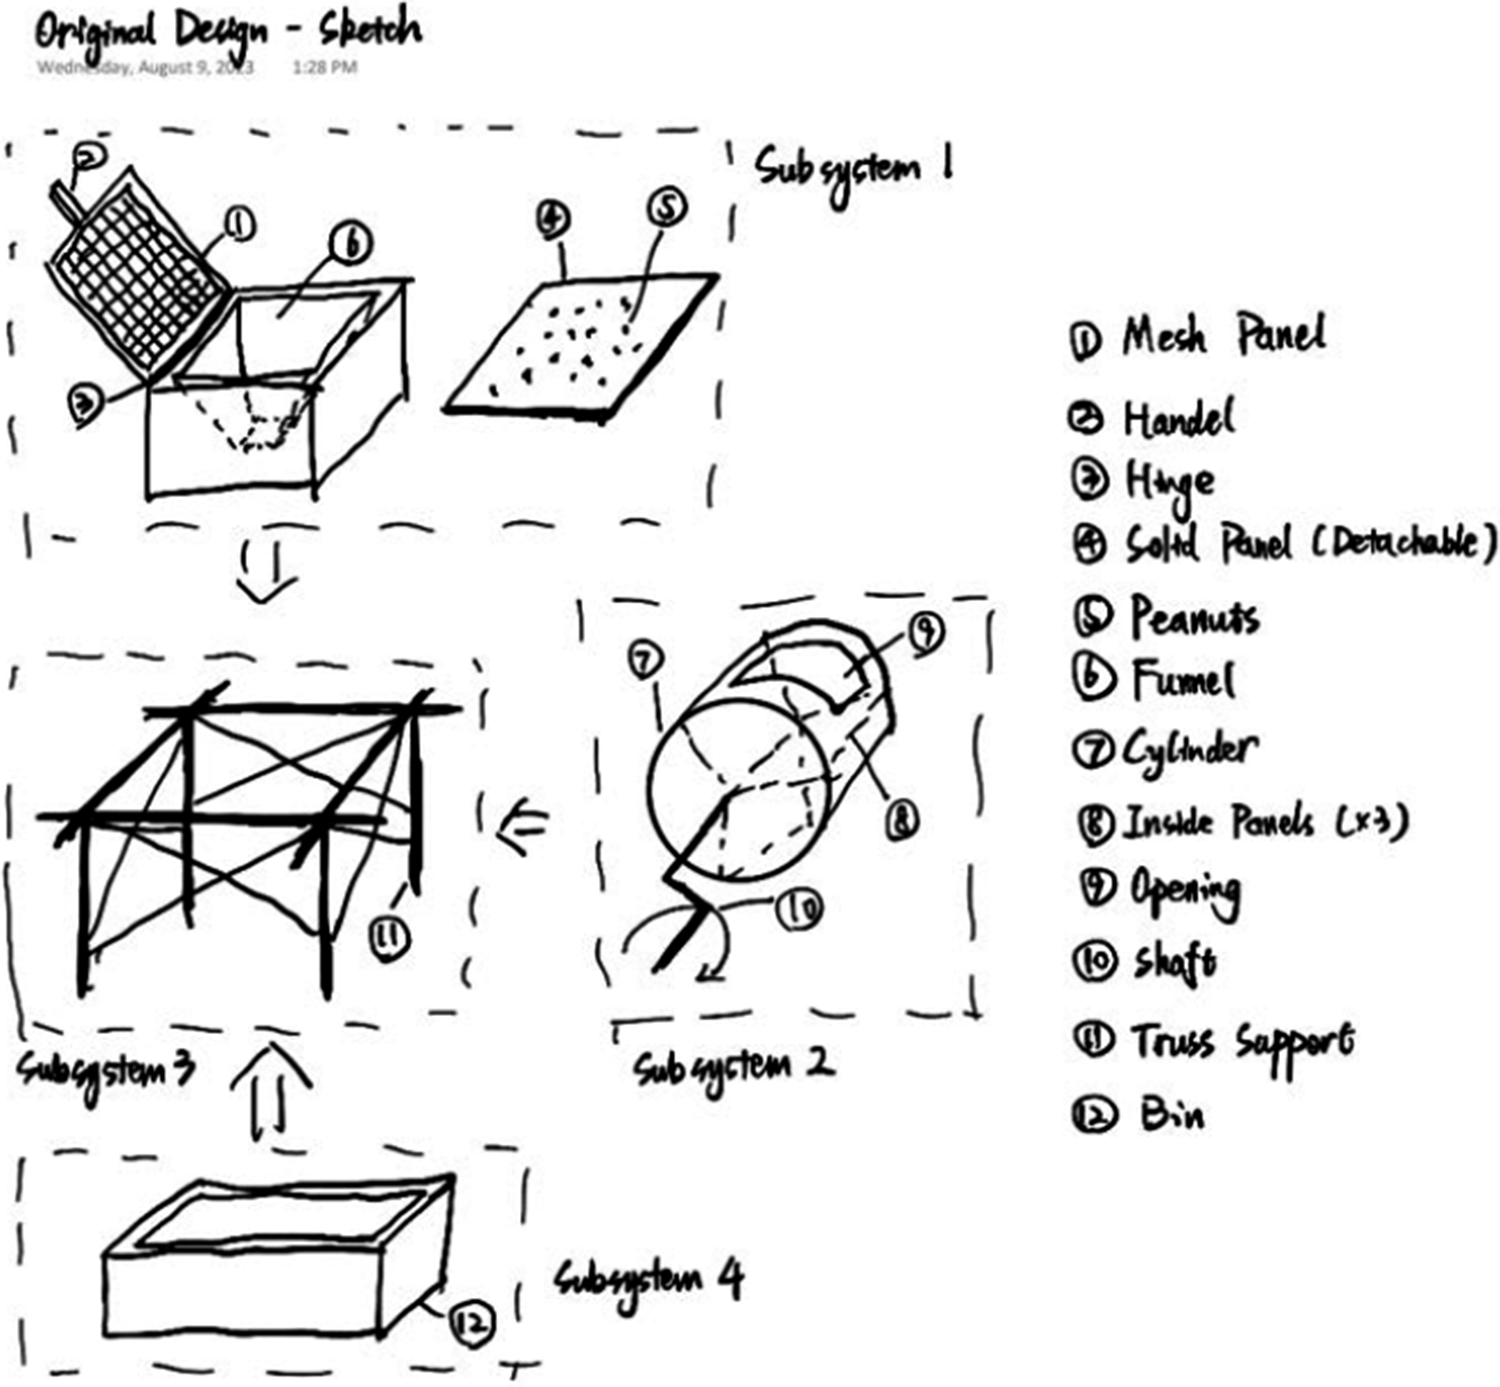
Figure B2. Design representation: sketch.
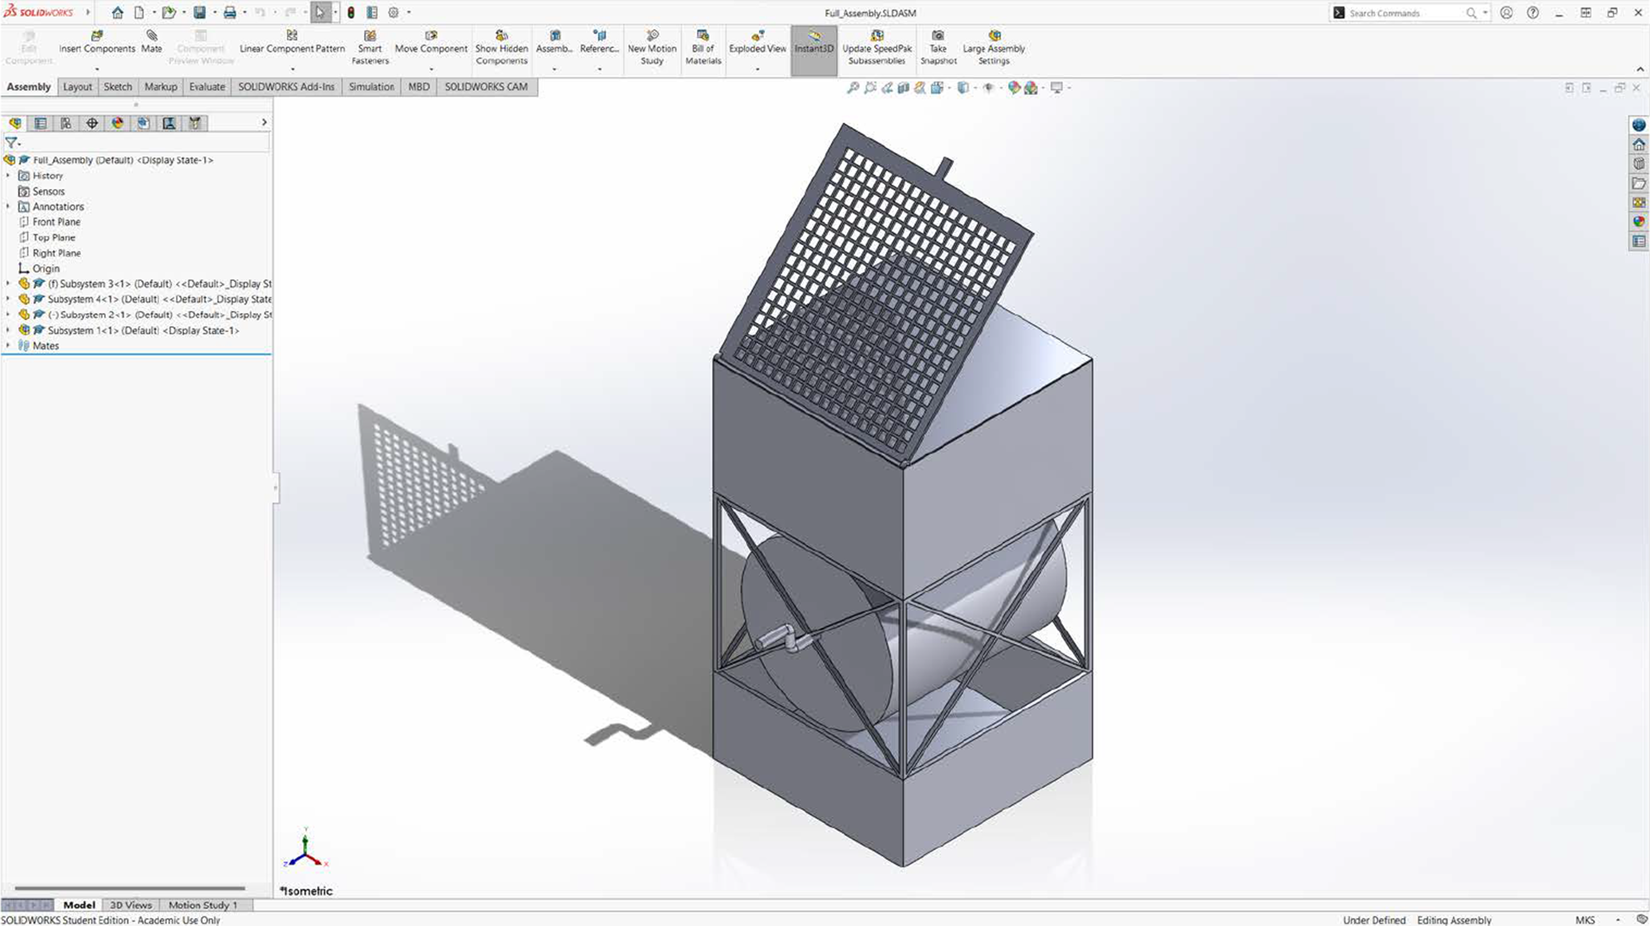
Figure B3. Design representation: CAD model.
C. Appendix C: Survey Questions
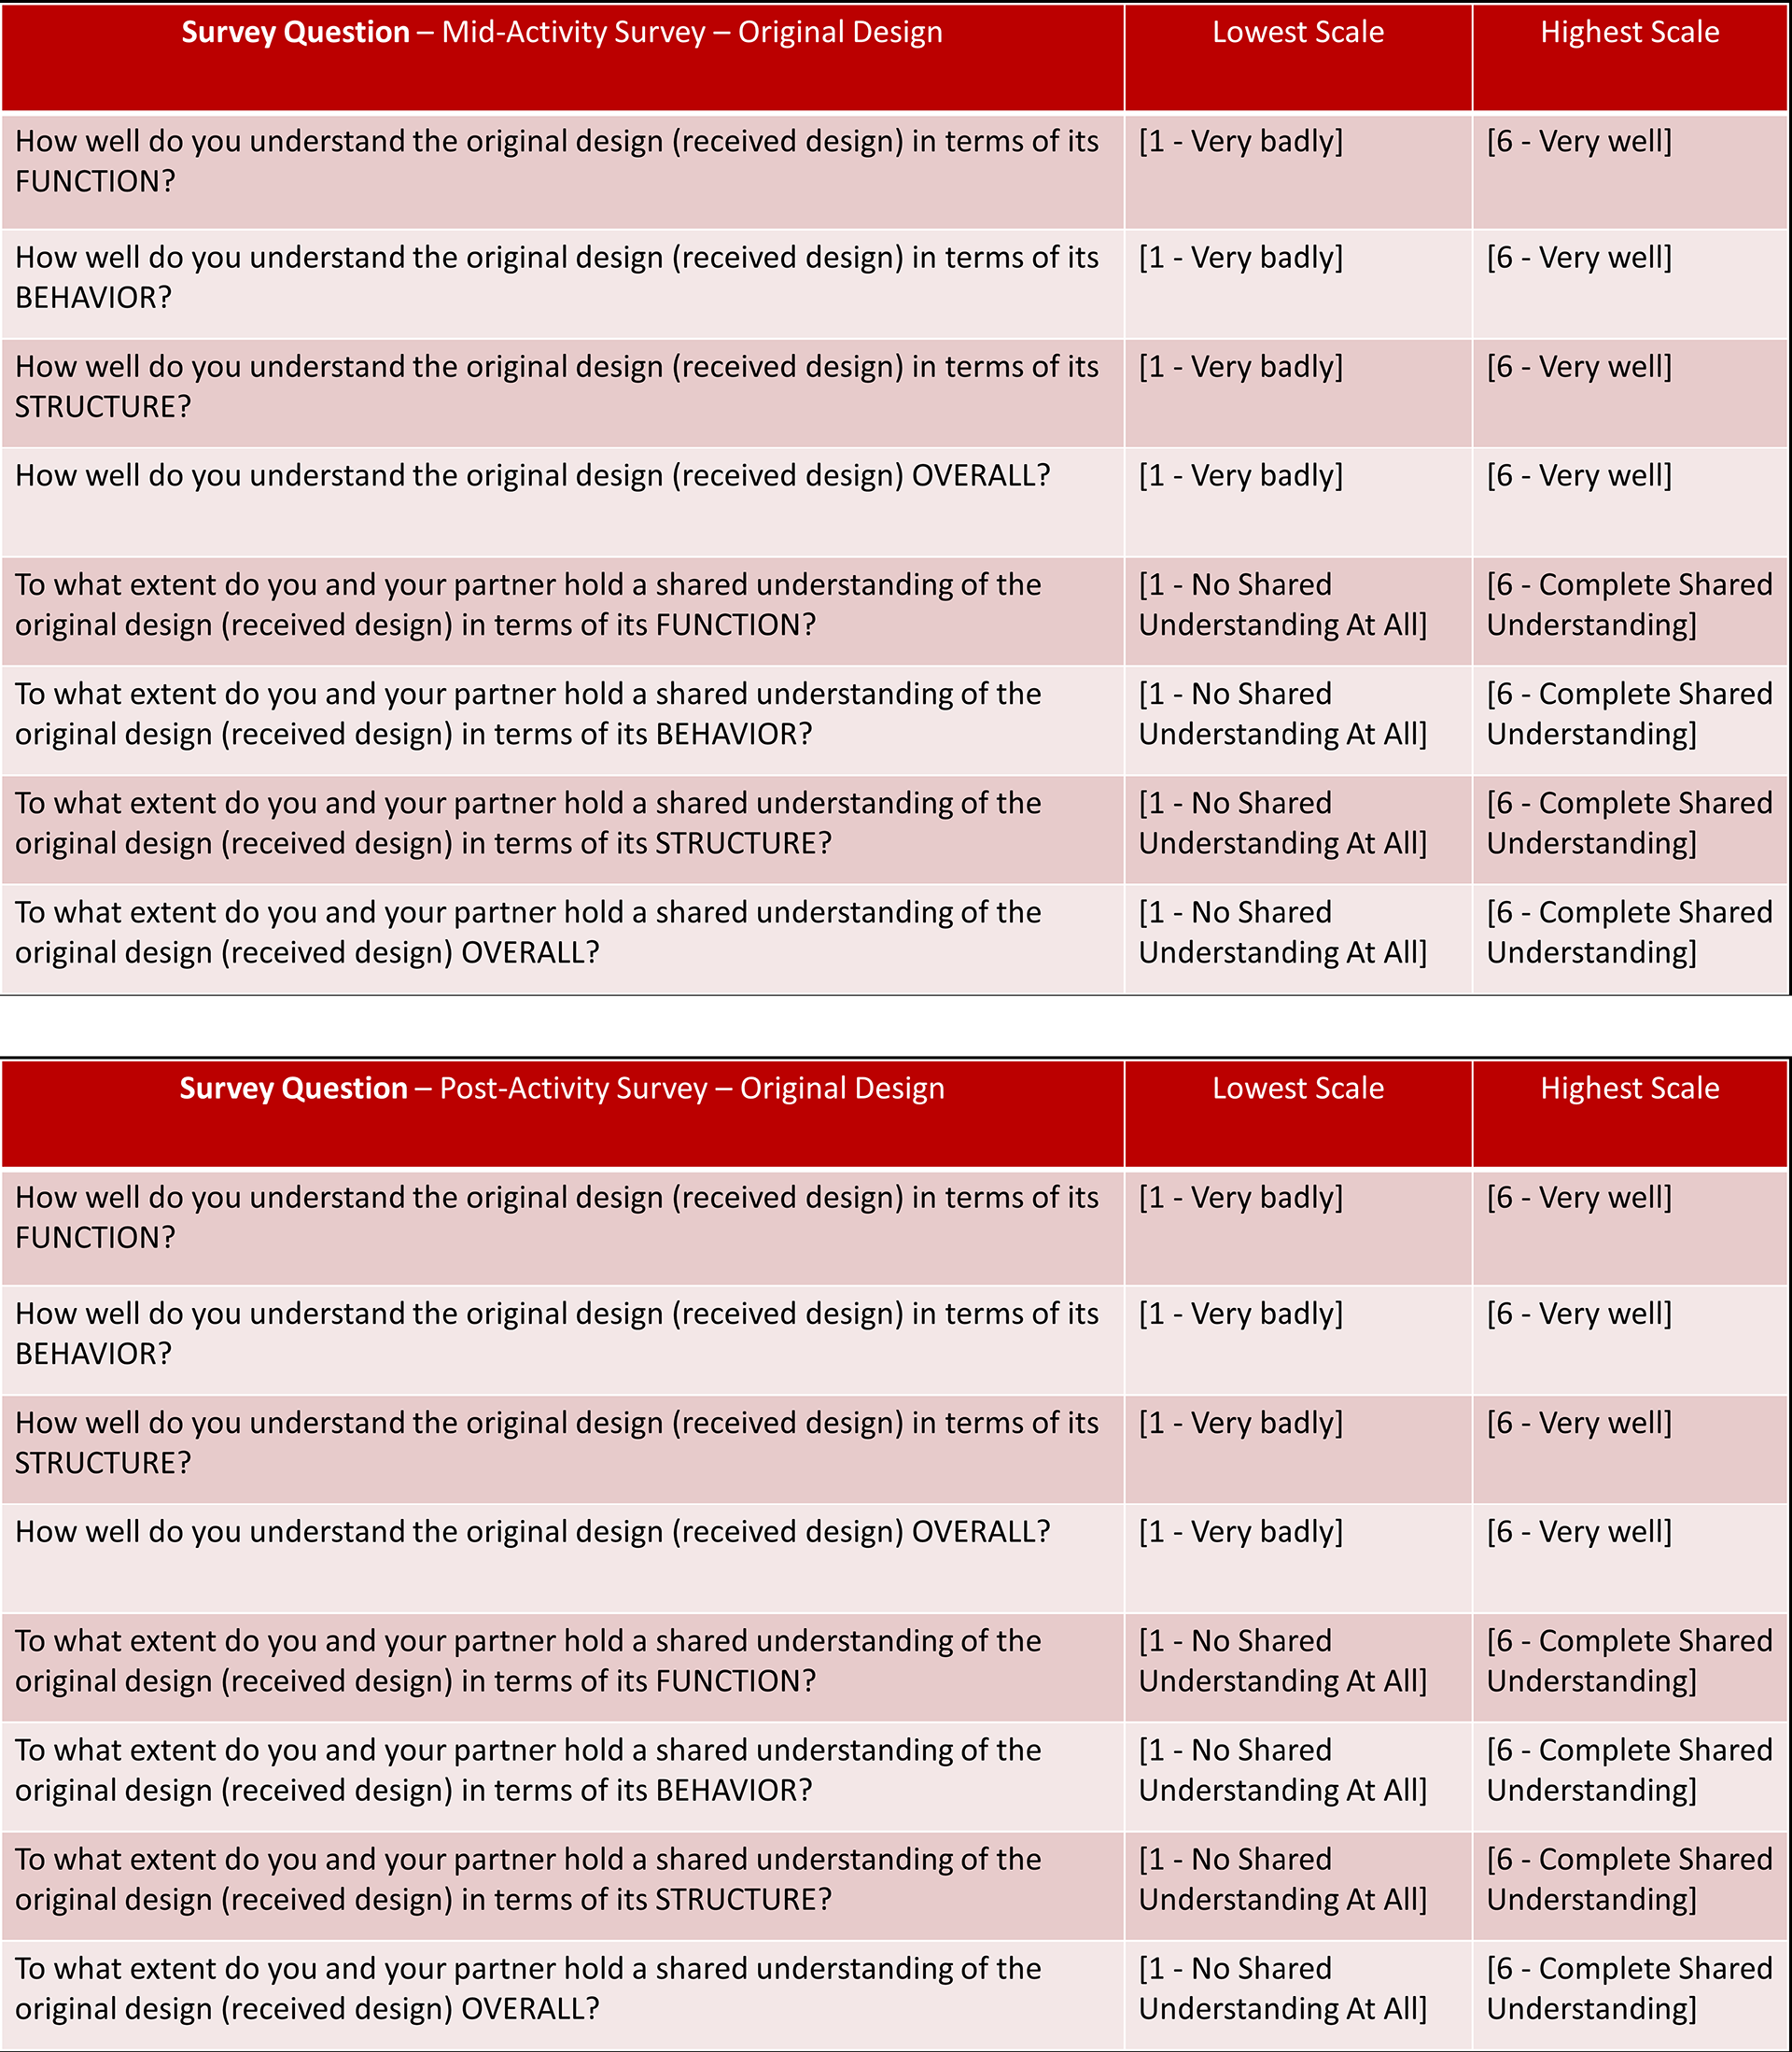
Figure C1.
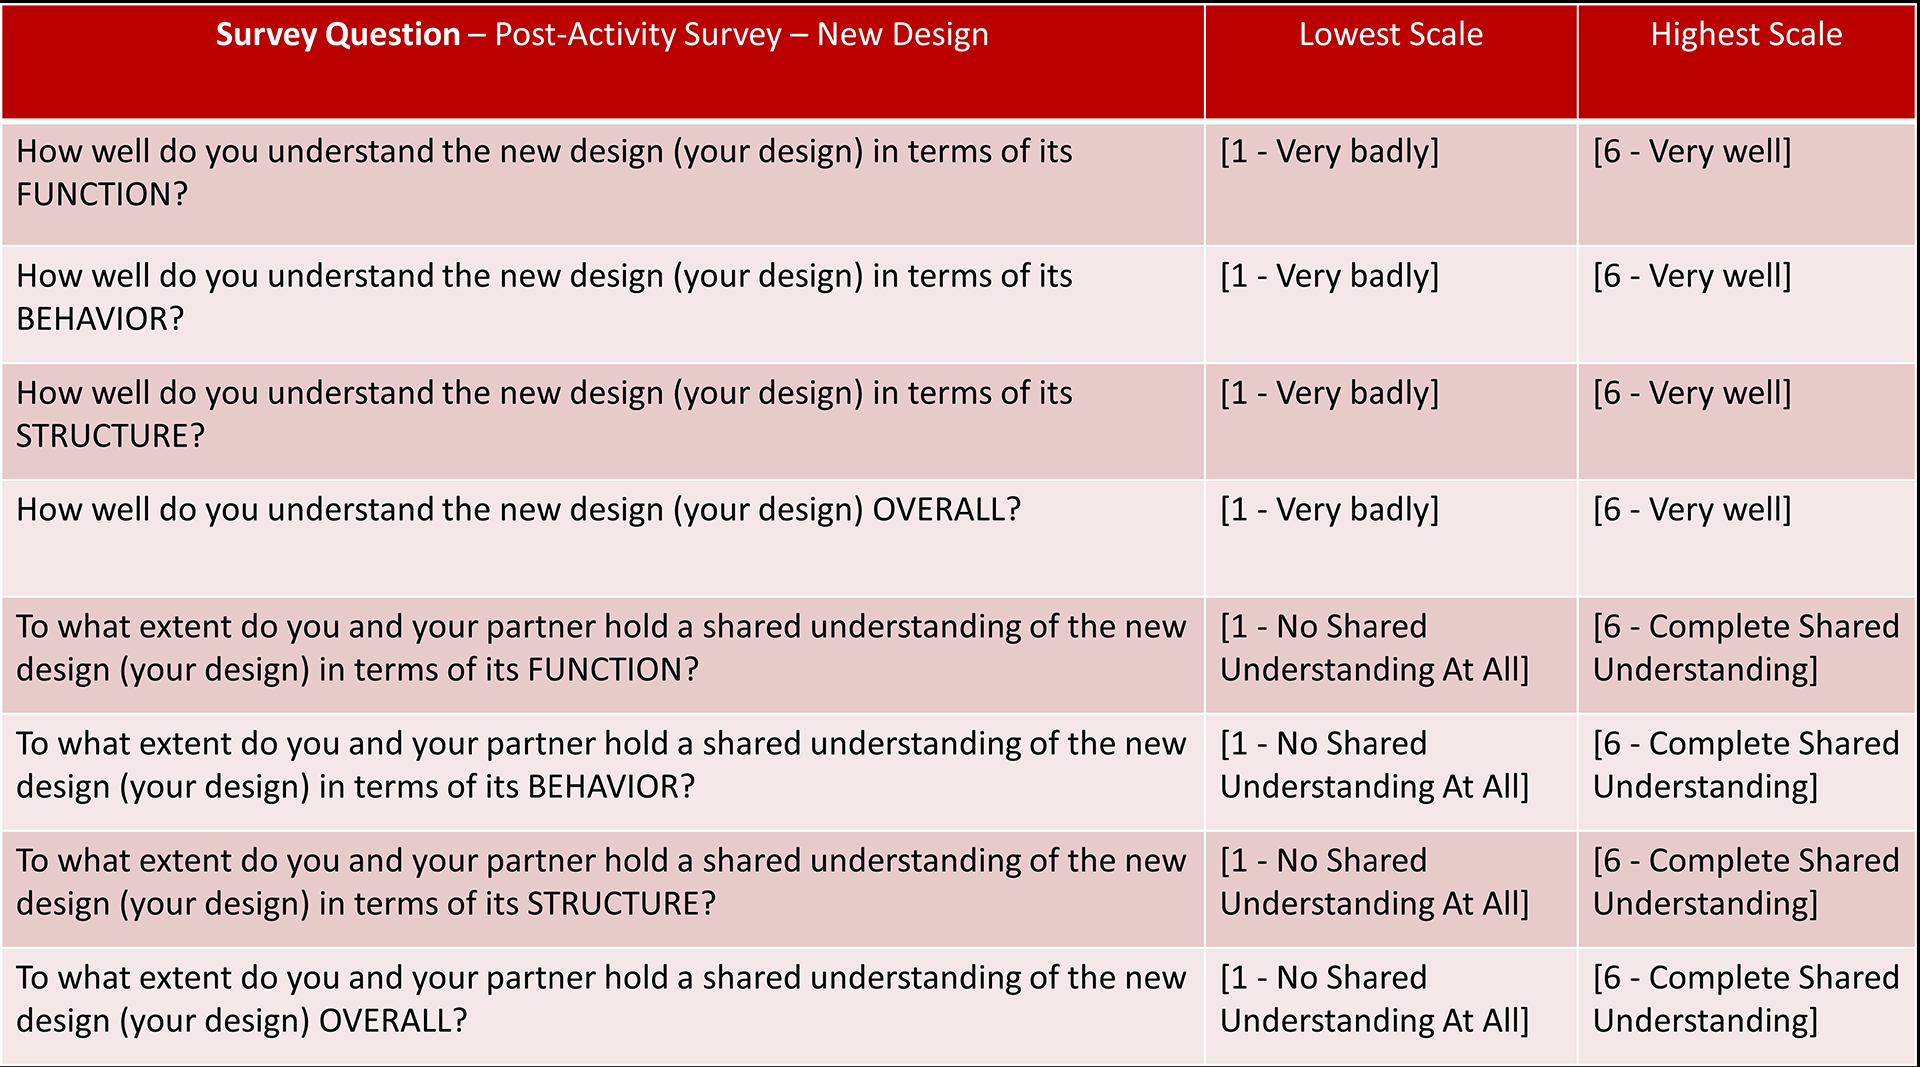
Figure C2.
D. Appendix D: Complete Thematic Coding Scheme
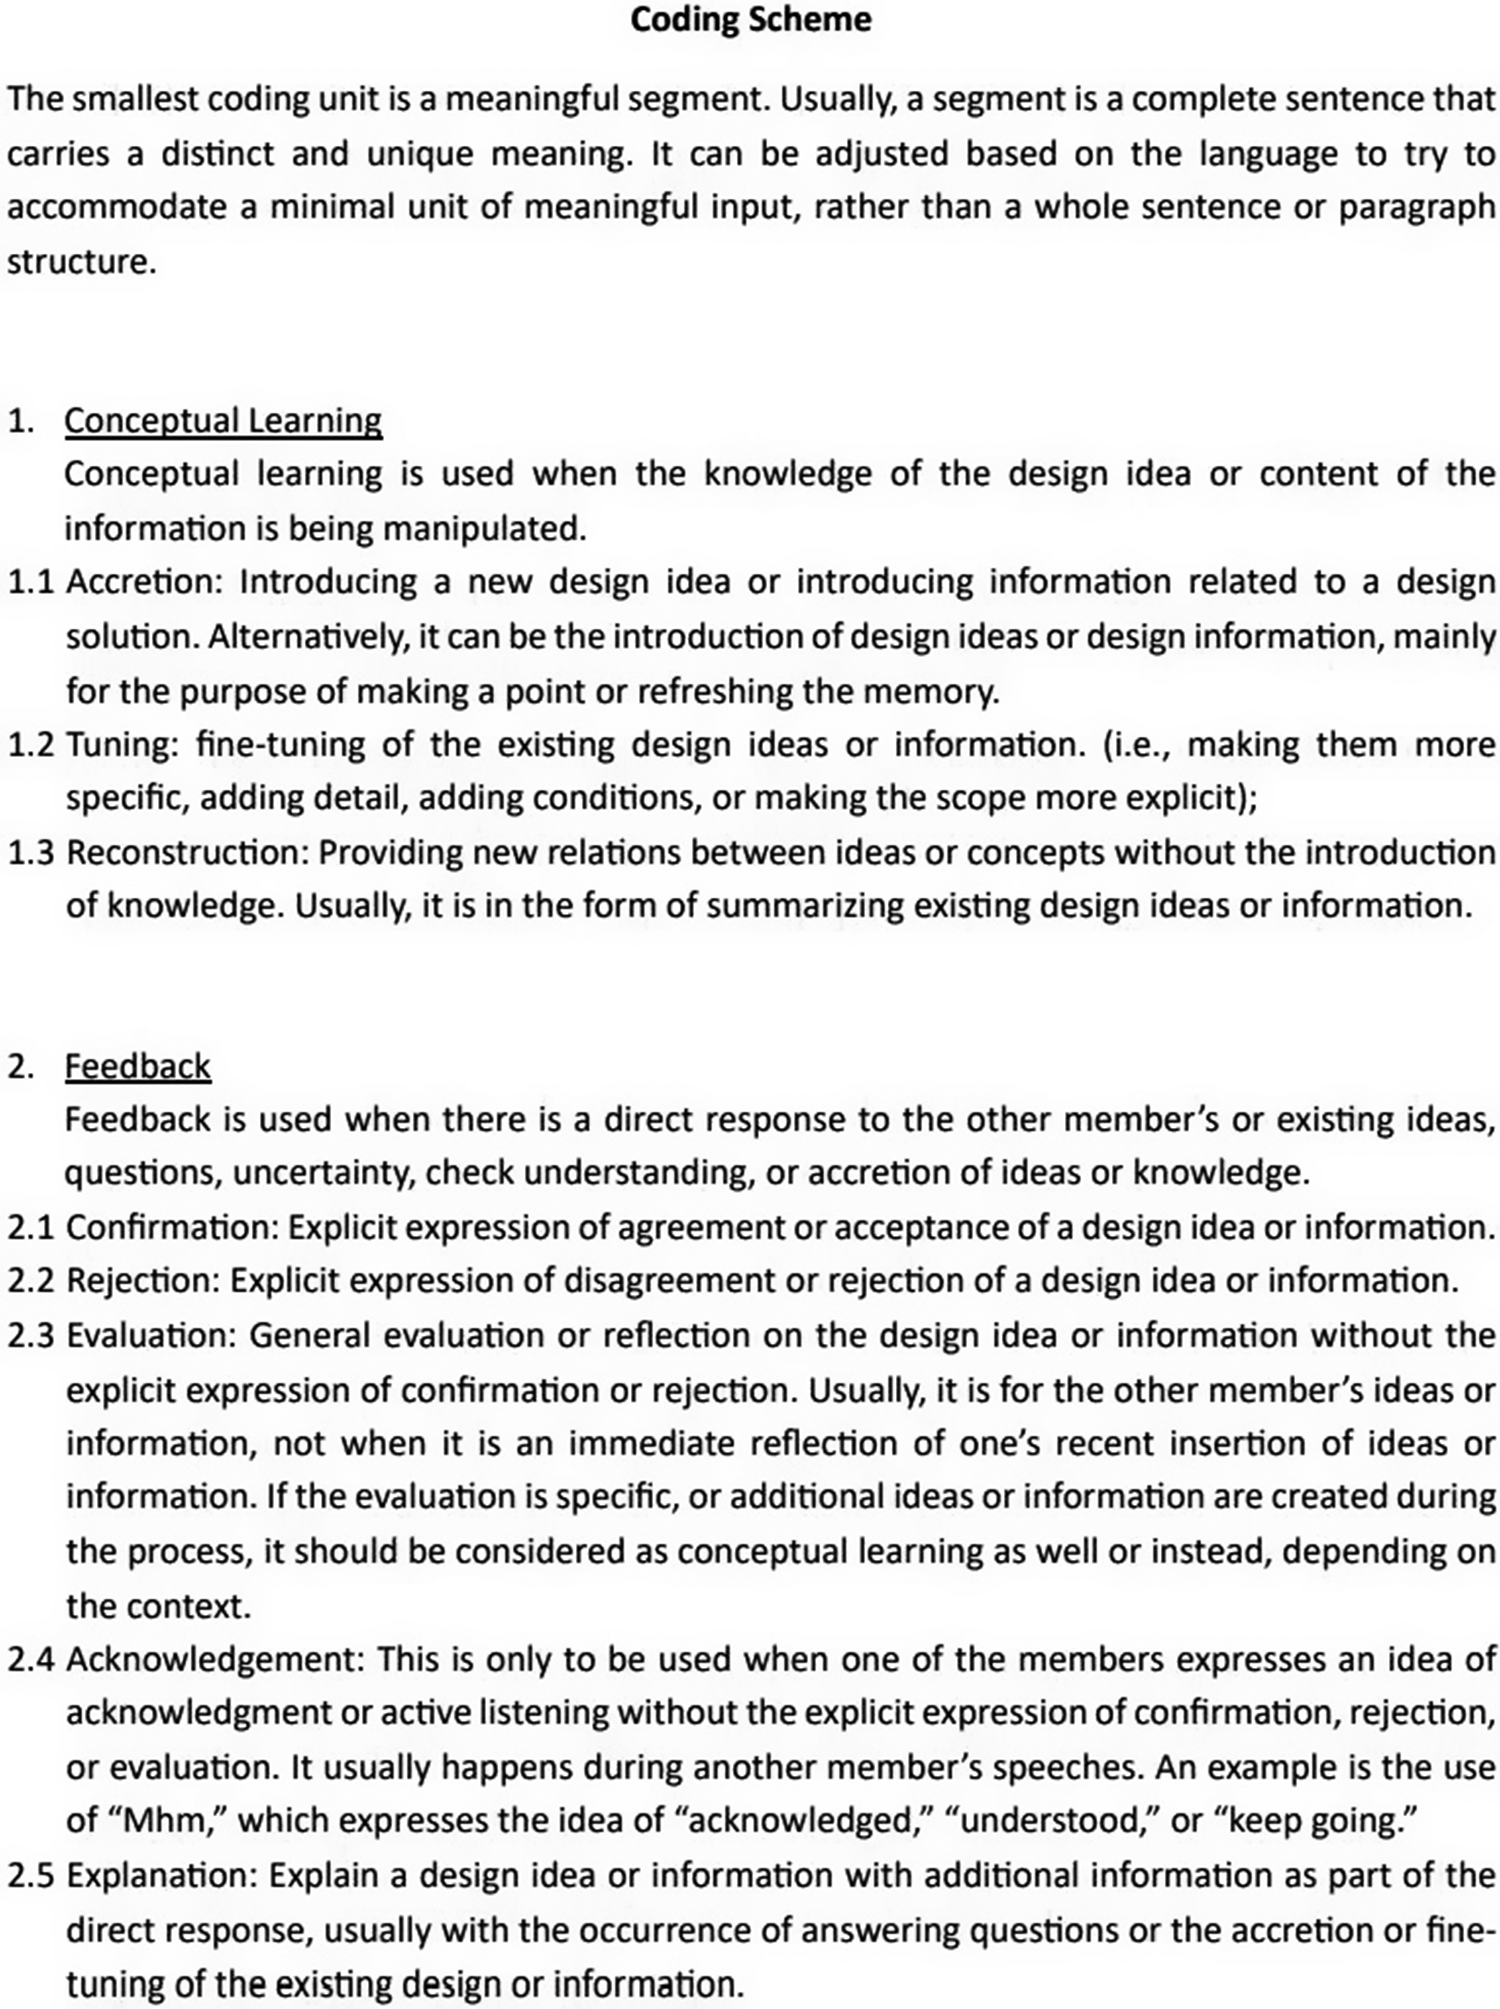
Figure D1.
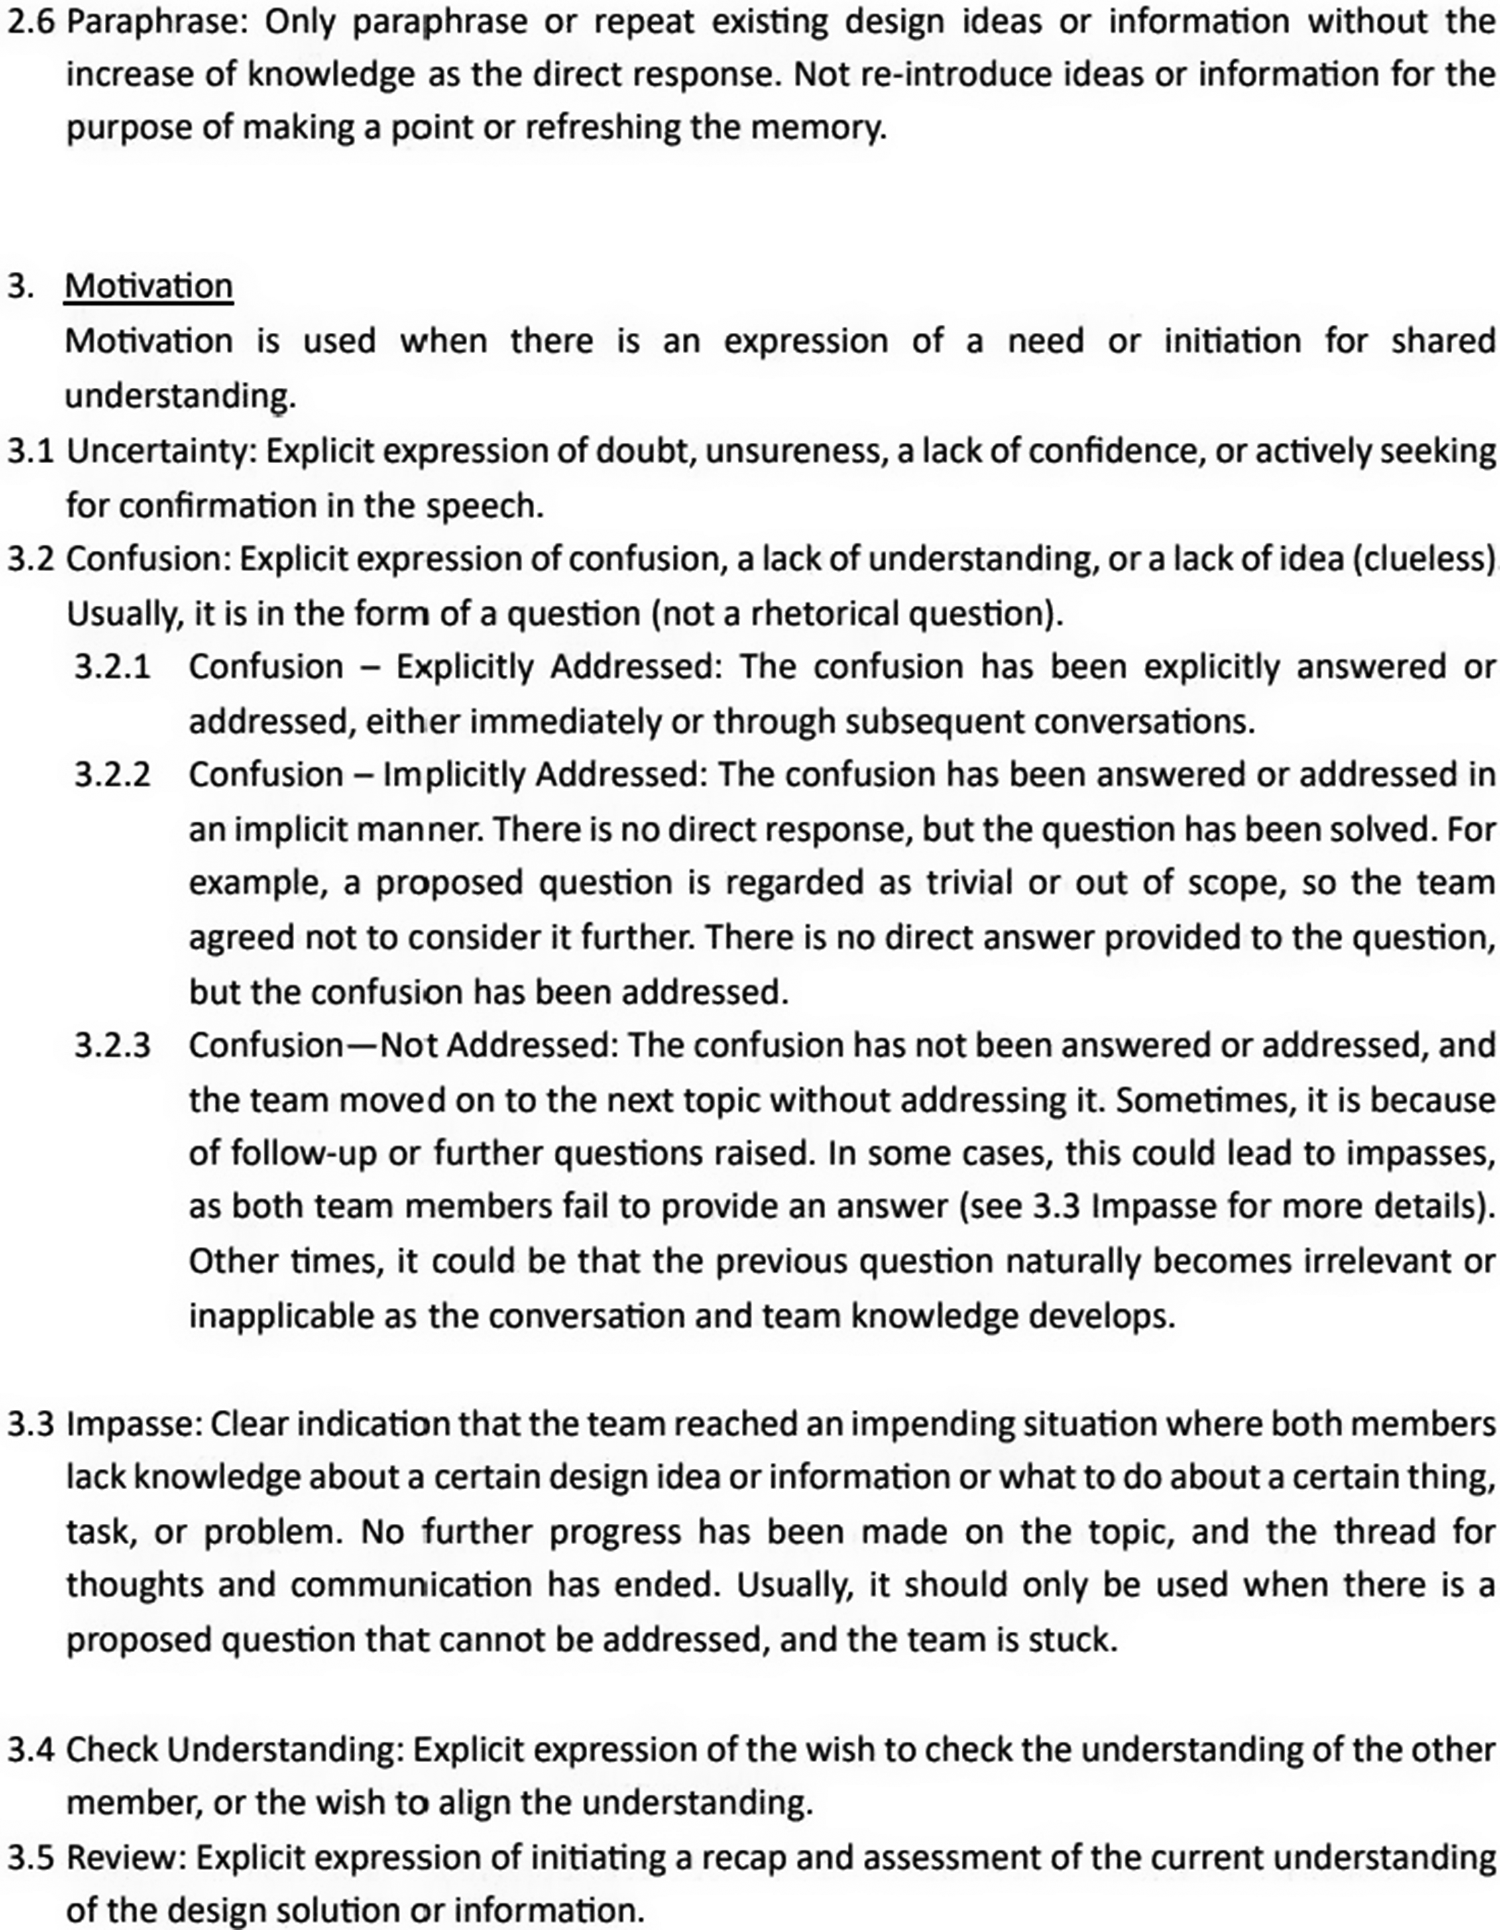
Figure D2.


 Open access