


1. Introduction
In a popular metaphor for the sensitivity of chaotic systems to initial conditions, the flapping of a butterfly's wings is imagined to alter the evolution of a storm system (e.g. Lorenz Reference Lorenz1993). In a dynamically unstable stratified shear layer, small perturbations grow exponentially via various competing instabilities, suggesting an analogous process in a high-dimensional yet relatively simple system. Using ensembles of nearly identical direct numerical simulations (DNS), we examine variations in the route to turbulence, and in the ultimate amount and efficiency of mixing, that may result from a random perturbation to the initial state, as well as the mechanisms that generate those variations. Our goals are to (i) survey the specific processes within a Kelvin–Helmholtz (KH) turbulence event that are amenable to understanding and prediction, (ii) identify the aspects of their interactions that lead to chaos and (iii) quantify the resulting unpredictability and assess the implications for our ongoing attempts to parameterize the process.
The life cycle of turbulence in stratified shear flows (Thorpe Reference Thorpe2012) has been studied extensively via linear stability analysis (e.g. Rayleigh Reference Rayleigh1880; Goldstein Reference Goldstein1931; Taylor Reference Taylor1931; Miles Reference Miles1961; Hazel Reference Hazel1972; Klaassen & Peltier Reference Klaassen and Peltier1985; Mashayek & Peltier Reference Mashayek and Peltier2012a), as well as nonlinear numerical simulations (e.g. Caulfield & Peltier Reference Caulfield and Peltier1994, Reference Caulfield and Peltier2000; Smyth & Moum Reference Smyth and Moum2000a; Mashayek & Peltier Reference Mashayek and Peltier2011; Dong et al. Reference Dong, Tedford, Rahmani and Lawrence2019; Kaminski & Smyth Reference Kaminski and Smyth2019; Lewin & Caulfield Reference Lewin and Caulfield2021; VanDine, Pham & Sarkar Reference VanDine, Pham and Sarkar2021), laboratory experiments (e.g. Thorpe Reference Thorpe1971; Lawrence, Browand & Redekopp Reference Lawrence, Browand and Redekopp1991) and field observations (e.g. Ludlam Reference Ludlam1967; Woods Reference Woods1969; Smyth & Moum Reference Smyth and Moum2012).
Linear, normal-mode stability theory for a stratified, parallel shear layer (e.g. Smyth & Carpenter (Reference Smyth and Carpenter2019), hereafter SC19) assumes that the initial mean flow is steady but unstable, and suffers a small-amplitude perturbation. For the initial states considered here, it predicts that the flow will first become dominated by the fastest-growing primary instability, the KH instability. As the primary instability grows, it develops one or more secondary instabilities (Klaassen & Peltier Reference Klaassen and Peltier1985, Reference Klaassen and Peltier1991; Mashayek & Peltier Reference Mashayek and Peltier2012a,Reference Mashayek and Peltierb) which generate up- and downscale energy cascades and ultimately lead the flow to a three-dimensional, turbulent state.
Kaminski & Smyth (Reference Kaminski and Smyth2019) found that the amplitude of the initial perturbation affects the large-amplitude structures that arise from the KH instability as well as useful statistics of the resulting turbulence such as its mixing efficiency. Dong et al. (Reference Dong, Tedford, Rahmani and Lawrence2019) showed that different phase relationships between the primary and subharmonic Fourier components of the initial state can lead to a significant difference in the potential energy change due to mixing. Guha & Rahmani (Reference Guha and Rahmani2019) extended these results to include multiple levels of pairing in unstratified shear layers. Here, we extend Kaminski & Smyth (Reference Kaminski and Smyth2019) by looking beyond the amplitude of the initial noise field to see how the details of its spatial form influence the flow evolution. Moreover, we extend Guha & Rahmani (Reference Guha and Rahmani2019) by including stable stratification and Dong et al. (Reference Dong, Tedford, Rahmani and Lawrence2019) by increasing the Reynolds numbers to values where different secondary instabilities, specifically the subharmonic pairing mode (e.g. Klaassen & Peltier Reference Klaassen and Peltier1989) and the various three-dimensional secondary modes, compete strongly such that pairing may be suppressed altogether (Mashayek & Peltier Reference Mashayek and Peltier2011, Reference Mashayek and Peltier2013).
Our hypothesis is that, because a multitude of competing, exponentially growing instabilities is inherent in the initial flow, the flow evolution may be altered in important ways by small changes in the form of the initial disturbance that catalyses those instabilities. In other words, it will exhibit a form of ‘sensitive dependence on initial conditions’ (hereafter SDIC), a more explicit descriptor for the aforementioned butterfly effect. A practical implication is that, in numerical and laboratory experiments designed to test the influence of initial state parameters such as the Richardson, Reynolds or Prandtl number on the resulting mixing (e.g. Smyth & Moum Reference Smyth and Moum2000a), uncertainties can be reduced by using ensembles of cases with different initial perturbations and then drawing conclusions based on ensemble averages.
The timing and strength of turbulence in KH-unstable flow results from interactions between four main flow components:
(i) The instantaneous mean (i.e. horizontally averaged) flow:
(ii) The billow train that arises from the primary KH instability;
(iii) The subharmonic pairing instability or upscale energy cascade; and
(iv) The various three-dimensional secondary instabilities (hereafter 3DSIs; e.g. Klaassen & Peltier Reference Klaassen and Peltier1985, Reference Klaassen and Peltier1991; Thorpe Reference Thorpe1985; Mashayek & Peltier Reference Mashayek and Peltier2012a,Reference Mashayek and Peltierb, Reference Mashayek and Peltier2013) that initiate the downscale cascade.
While the pairing mode draws its energy mainly from the mean flow (Smyth & Peltier Reference Smyth and Peltier1993), the 3DSIs also feed on the shears, strains and overturnings found in mature KH billows (Klaassen & Peltier Reference Klaassen and Peltier1991; Mashayek & Peltier Reference Mashayek and Peltier2012a,Reference Mashayek and Peltierb). Therefore, while both the primary KH and the pairing instabilities begin to lock on and grow soon after  $t = 0$, the 3DSIs do not appear until the primary billows attain large amplitude. We will examine all of these processes and the ways that their interactions are determined by the details of the initial flow, together with the resulting effects on the turbulence.
If the subharmonic mode is too slow in growing, the 3DSIs can nudge the KH billows into the turbulent state. The mean shear is then diffused, reducing the energy available for subharmonic growth. The 3DSIs, being small in scale, are relatively vulnerable to dissipation by viscosity and therefore grow slowly at the low Reynolds numbers characteristic of laboratory experiments and early DNS. But at the higher Reynolds numbers accessible in today's DNS, three-dimensional (3-D) modes can compete with pairing, possibly accounting for the fact that pairing is rarely observed in geophysical settings (Mashayek & Peltier Reference Mashayek and Peltier2011, Reference Mashayek and Peltier2013).
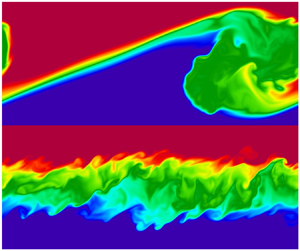
Here, we conduct DNS ensembles at three points in parameter space spanning the boundary region where pairing is first inhibited by 3DSIs. We find that pairing can indeed be accelerated or prevented due to variations in the timing of the KH, subharmonic and 3DSIs caused by small changes in the initial state. The possible outcomes can be summarized as in the parameter diagram in figure 1, which shows the three characteristic behaviours exhibited across our simulations as described in detail in § 4.4. SDIC is already evident in the scatter among the 15-case ensembles, each member of which differs only by a small change in the initial random perturbation. Turbulence statistics such as the amount and efficiency of mixing will be seen to vary profoundly due to these effects; for example, the maximum turbulence kinetic energy in an event may vary by more than a factor of 4.

Figure 1. (a) Energetics at the time of maximum subharmonic kinetic energy for 45 simulated mixing events. Ratio of two- to three-dimensional kinetic energy vs the ratio of subharmonic to primary kinetic energy (details in § 2.4). Labels indicate cases in each ensemble. Snapshots of the buoyancy field representing three characteristic regimes shown in (b) non-pairing:  $Ri_0 = 0.16$, case no. 6, $t=302$; (c) turbulent pairing: $Ri_0 = 0.12$, case no. 6, $t=219$; (d) laminar pairing: $Ri_0 = 0.12$, case no. 11, $t=175$.
The methodology for our numerical simulations and subsequent analysis is described in § 2. In § 3, we give an overview of the stages in a typical KH mixing event. Section 4 describes the main instabilities individually, including their growth from the initial noise field and the possible variations in their evolution. We then examine the range of ways that the instabilities can interact to determine the ultimate flow evolution. In § 5 we focus on the maximum amplitude phase in which mature KH billows pair (in some cases) and break to form turbulence. Section 6 describes how the overall amount of mixing, as well as the flux coefficient and the cumulative mixing efficiency, vary due to the randomness of the initial state. Conclusions and directions for future research are summarized in § 7.
2. Methodology
2.1. The mathematical model
We begin by considering a stably stratified parallel shear layer defined by mean profiles of velocity and buoyancy
 \begin{equation} U^{*}(z^*)=u^{*}_{0}\tanh \left(\frac{z^*}{h^*}\right) \quad \text{and} \quad B^{*}(z^*)=b^{*}_{0}\tanh \left(\frac{z^{*}}{h^{*}}\right), \end{equation}
in which  $2u^{*}_{0}$ and $2b^{*}_{0}$ are velocity and buoyancy differences across the shear layer and $2h^{*}$ is its thickness. Asterisks indicate dimensional quantities. The Cartesian coordinates are $x^*$ (streamwise), $y^*$ (spanwise) and $z^*$ (vertical, increasing upwards). After non-dimensionalizing velocities by $u^{*}_{0}$, buoyancy by $b^{*}_{0}$, lengths by $h^{*}$ and times by the advective time scale $h^{*}/u^{*}_{0}$, the velocity and buoyancy profiles become
 \begin{equation} U(z)=B(z)=\tanh(z). \end{equation}
The flow evolution is governed by the Boussinesq equations. In non-dimensional form, these are
 \begin{gather} \frac{\partial\boldsymbol{u}}{\partial t}+\boldsymbol{u} \boldsymbol{\cdot}\boldsymbol{\nabla}\boldsymbol{u}={-}\boldsymbol{\nabla} p+Ri_{0} b \hat{\boldsymbol{z}}+\frac{1}{Re}\nabla^{2} \boldsymbol{u}, \end{gather}
 \begin{gather}\frac{\partial b}{\partial t}+\boldsymbol{u}\boldsymbol{\cdot} \boldsymbol{\nabla} b=\frac{1}{RePr}\nabla^{2}b, \end{gather}
 \begin{gather}\boldsymbol{\nabla} \boldsymbol{\cdot} \boldsymbol{u} = 0, \end{gather}
where  $\boldsymbol{u}$ represents the total vector velocity field, b the buoyancy and $p=p^*/\rho_0^*U_0^{*2}$ the scaled pressure with characteristic density $\rho_0^*$.
Three non-dimensional parameters are present in (2.3)–(2.5): the initial Reynolds number,
$\rho_0^*$.
Three non-dimensional parameters are present in (2.3)–(2.5): the initial Reynolds number,  $Re_0=u^{*}_{0}h^{*}/\nu ^{*}$, where $\nu ^{*}$ is the kinematic viscosity, the Prandtl number, $Pr=\nu ^{*}/\kappa ^{*}$, where $\kappa ^{*}$ is the diffusivity and the initial minimum Richardson number, $Ri_{0}=b^{*}_{0}h^{*}/U^{*2}_{0}$. In the limit $Re_0\rightarrow \infty$, instability is only possible when $Ri_0<1/4$ (Howard Reference Howard1961; Miles Reference Miles1961). Boundary conditions are periodic in both horizontal directions and free slip and insulating at the top and bottom.
A random perturbation is then added to the initial mean state (2.2). This has two purposes: first, to catalyse the instability; second, to model the turbulence that is invariably present in natural fluid systems. Kaminski & Smyth (Reference Kaminski and Smyth2019) used a Kolmogorov-like distribution of Fourier components with random phases and kinetic energy proportional to the  $-$5/3 power of the wavenumber. Here, we take a simpler approach: we impose a homogeneous distribution of independent, random velocity vectors at each point in the domain. Ensembles of simulations are performed, each using a different seed to generate the random velocities. The maximum amplitude of any one component is 0.025, or 1.25 % of the velocity change across the shear layer. The amplitude is therefore small enough that the initial growth phase is accurately described by linear perturbation theory (as will be shown). While the initial noise field has non-zero divergence, mass conservation is enforced by the pressure field from the first time step onward. The choices of $Ri_0$, grid sizes and repetitions for each ensemble are presented in table 1.
Table 1. Parameter values for three, 15-member DNS ensembles. In all cases  $Re_0=1000, Pr=1$ and the grid size is $512\times 128\times 361$. The maximum initial random velocity component is 0.025.

2.2. Numerical methods
The simulations are conducted using DIABLO (Taylor Reference Taylor2008), which employs a mixed implicit–explicit time-stepping scheme with pressure projection. The viscous and diffusive terms are treated implicitly with a second-order Crank–Nicolson method; all other terms are treated explicitly with a third-order Runge–Kutta-Wray method. The periodic streamwise and spanwise ( $x$,
$x$,  $y$) directions are treated pseudospectrally, while the vertical $z$ direction dependence is approximated using a finite-difference method.
To allow the subharmonic mode to develop, the streamwise periodicity interval  $L_x$ accommodates two wavelengths of the fastest-growing KH mode based on linear stability analysis (Lian, Smyth & Liu Reference Lian, Smyth and Liu2020). The spanwise periodicity interval $L_y=L_x/4$ is sufficient for the development of 3DSIs (e.g. Klaassen & Peltier Reference Klaassen and Peltier1985; Mashayek & Peltier Reference Mashayek and Peltier2013), and the domain height is $L_z=20$, sufficient to avoid boundary effects.
The computational grid is uniform. Grid dimensions are chosen to resolve  $\sim$2.5 times the Kolmogorov length scale, $L_k=(Re^{-3}/\epsilon )^{1/4}$ after the onset of turbulence, where $\epsilon$ is the viscous dissipation rate.
2.3. Parameter choices
Increasing  $Re_0$ toward geophysical values places large demands on computational resources. Here, we must compromise between $Re_0$ and ensemble size. We conduct a total of 45 DNS runs, 15 each at $Ri_0 = 0.12$, 0.14 and 0.16. In all cases we set $Re_0 = 1000$, the smallest value at which the suppression of pairing is clearly evident. A second compromise is the choice of the Prandtl number. We choose $Pr=1$, an appropriate value for air but too small to be realistic in water, again in deference to computational resource limits.
2.4. Diagnostics
A useful descriptor of stratified shear flow is the gradient Richardson number  $Ri=N^2/S^2$. Here, $N^2=\partial \langle b\rangle _{xy}/\partial z$ is the squared buoyancy frequency and $S=\partial \langle u\rangle _{xy}/\partial z$ is the mean shear. The notation $\langle \rangle _{xy}$ denotes an average over the $x$ and $y$ directions. Of particular significance is the fact that the global minimum of $Ri$ over $z$, here called $Ri_{min}$, must be <1/4 for shear instability to operate in a stratified fluid in the inviscid limit (Howard Reference Howard1961; Miles Reference Miles1961).
The transition to turbulence involves expanding the dimensionality of the flow from 1 to 2 to 3. To examine the processes involved in each step, we first decompose the velocity field into a horizontally averaged mean flow and a perturbation
 \begin{equation} \boldsymbol{u}(x,y,z,t)=\bar{U}\hat{\boldsymbol{e}}^{(x)}+ \boldsymbol{u}'(x,y,z,t), \quad \mathrm{where}\ \bar{U}(z,t)=\langle u\rangle_{xy}. \end{equation}
The perturbation velocity is further partitioned into 2-D and 3-D components
 \begin{equation} \boldsymbol{u}'(x,y,z,t)= \boldsymbol{u}_{2d}+\boldsymbol{u}_{3d}, \end{equation}
where
 \begin{equation} \boldsymbol{u}_{2d}(x,z,t)=\langle \boldsymbol{u}\rangle_y - \bar{U}\hat{\boldsymbol{e}}^{(x)} \quad \mathrm{and} \quad \boldsymbol{u}_{3d}(x,y,z,t)=\boldsymbol{u} - \langle \boldsymbol{u}\rangle_y. \end{equation}
The kinetic energy is subdivided into the corresponding constituent parts
 \begin{equation} K=\bar{K}+K'; \quad K'=K_{2d}+K_{3d}, \end{equation}
where
 \begin{equation} \bar{K}=\tfrac{1}{2}\langle \bar{U}^2\rangle_{z},\quad K_{2d}=\tfrac{1}{2}\langle (u_{2d}^2+v_{2d}^2+w_{2d}^2)\rangle_{xz},\quad K_{3d}=\tfrac{1}{2}\langle u_{3d}^2+v_{3d}^2+w_{3d}^2\rangle_{xyz}. \end{equation}
The constituent kinetic energies  $\bar {K}$, $K'$,
$K'$,  $K_{2d}$ and $K_{3d}$ may be identified, respectively, as the kinetic energy associated with the mean flow, the turbulent kinetic energy and the kinetic energy associated with 2-D and 3-D motions, respectively.
We also partition the kinetic energy into components associated with particular wavenumbers via Fourier decomposition. The Fourier transform of the perturbation velocity field at  $z = 0$ is
 \begin{equation} \widehat{\boldsymbol{u}'}(k,y,t)=\frac{1}{L_x}\int^{L_x}_0 \boldsymbol{u}'(x,y,t)\, {\rm e}^{-{\rm i}\, kx} \, {{\rm d} x}, \end{equation}
where  $k=({2{\rm \pi} }/{L_x})n$, $n=1,2,3, \ldots ({N_x}/{2})-1$, and $N_x=512$ for the array sizes used here. In the corresponding kinetic energy spectrum, we denote the subharmonic component $n=1$ as $K_{sub}$, and the primary KH component $n=2$ as $K_{KH}$. The phase spectrum of the perturbation vertical velocity is obtained by Fourier transforming the $x$-dependence of $\langle w'\rangle _y$. At height $z$ and time $t$, the result can then be expressed in the polar form
 \begin{equation} \widehat{w'}(k)=\hat{W}(k)\, {\rm e}^{{\rm i}\,\hat{\phi}(k)}, \end{equation}
where  $\hat {W}(k)$ and $\hat {\phi }(k)$ are, respectively, the amplitude and phase spectra. Finally, we define the subharmonic ( $n=1$) and KH ( $n=2$) phases, respectively, as $\phi _{sub}$ and $\phi _{KH}$.
We will be concerned with the quantification of irreversible mixing and its dependence on the initial random perturbation. To this end, we decompose the total potential energy  $P=-Ri_0\langle bz\rangle _{xyz}$ into available and background components, $P=P_a+P_b$. Here, $P_b$ is the minimum potential energy that can be achieved by adiabatically rearranging the buoyancy field into a statically stable state (Winters et al. Reference Winters, Lombard, Riley and D'Asaro1995; Tseng & Ferziger Reference Tseng and Ferziger2001). The available potential energy $P_a=P-P_b$ is the potential energy available for conversion to kinetic energy by stirring, which arises due to lateral variations in buoyancy or statically unstable regions.
Following Caulfield & Peltier (Reference Caulfield and Peltier2000), we define the irreversible mixing rate due to fluid motions as
 \begin{equation} \mathcal{M}=\frac{{\rm d}P_b}{{\rm d}t}-\mathcal{D}_p, \end{equation}
where  $\mathcal {D}_p\equiv Ri_0(b_{top}-b_{bottom})/(Re_0PrL_z)$ denotes the rate at which the potential energy of a statically stable density distribution would increase in the absence of any fluid motion (i.e. due only to diffusion of the mean buoyancy profile).
We define a cumulative flux coefficient as
 \begin{equation} \varGamma_c = \frac{\displaystyle \int \mathcal{M}\, {\rm d}t}{\displaystyle \int\epsilon'\, {\rm d}t}, \end{equation}
where we use the turbulent dissipation rate  $\epsilon '=({2}/{Re})\langle s_{ij}s_{ij}\rangle _{xyz}$, and $s_{ij}=(\partial u'_i/\partial x_j+\partial u'_j/\partial x_i)/2$. The integral covers the duration of the simulation, which ends at $t=500$. (At this juncture, both $K_{2d}$ and $K_{3d}$ have decreased by 2–3 orders of magnitude from their peak values.) We define $\varGamma _c$ using the dissipation rate $\epsilon ^\prime$. This omits the contribution from the mean shear, since we are interested in dissipation by the turbulence only. We also define the irreversible flux Richardson number
 \begin{equation} Ri_f = \frac{\varGamma_c}{1+\varGamma_c}= \frac{\displaystyle \int \mathcal{M}\, {\rm d}t}{\displaystyle \int \mathcal{M}\, {\rm d}t +\int\epsilon'\, {\rm d}t}, \end{equation}
where  $Ri_f$ relates the fraction of energy that goes into irreversible mixing to the total lost via turbulent motions (cf. Venayagamoorthy & Koseff Reference Venayagamoorthy and Koseff2016). This quantity may also be referred to as a mixing efficiency, although we note that there are a variety of definitions for that quantity in the literature (Gregg et al. Reference Gregg, D'Asaro, Riley and Kunze2018; Smyth Reference Smyth2020).
To define the normal-mode instability spectrum at any chosen time in a simulation, we linearize (2.3)–(2.5) about the horizontally averaged profiles  $\langle u\rangle _{xy}$ and $\langle b\rangle _{xy}$. Perturbations are assumed to take a normal-mode form, resulting in a Taylor–Goldstein model extended to account for viscosity and diffusion. The linear equations are discretized using a Fourier–Galerkin method, resulting in a generalized matrix eigenvalue problem which is solved using standard methods. Details may be found in SC19's § 13.3 or Lian et al. (Reference Lian, Smyth and Liu2020). Resulting growth rates may be compared with a growth rate derived from the nonlinear simulation
 \begin{equation} \sigma=\frac{1}{2}\frac{{\rm d}}{{\rm d} t} \ln K, \end{equation}
where  $K$ may represent any of the constituent kinetic energies described in (2.9) or derived from (2.11).
3. Overview of a KH event
In an unstable shear flow, kinetic energy is extracted from the mean flow (figure 2a) via a sequence of instabilities. It is thereby cascaded downscale and ultimately dissipated by friction. In the process, turbulent mixing leads the flow to a stable state, as indicated by the minimum gradient Richardson number  $Ri_{min}$ increasing from its initial value, which is less than the inviscid critical value 1/4, to values exceeding 1/4 (figure 2b).

Figure 2. (a) Change in mean flow kinetic energy since  $t = 0$, (b) minimum gradient Richardson number, for the 15-cases of the $Ri_0 = 0.14$ ensemble. Dark curves show the mean. Diamonds at the bottom of (a) indicate times shown in figure 3.
In the earliest stage of each simulation (approximately  $0< t<100$ in the case shown in figure 2), perturbation amplitudes are small. The mean flow is gradually diffused by viscosity, leading to a slow decrease of mean kinetic energy (figure 2a) and to a slow increase in $Ri_{min}$ (figure 2b).
In the next phase (approximately  $100< t<160$), the primary KH instability grows to large amplitude and generates a train of billows, two of which are included in our periodic computational domain (figure 3b). This growth coincides with a rapid drop in mean flow kinetic energy (figure 2a) and also with a drop in $Ri_{min}$ (figure 2b) as overturning in the vortex cores leads to locally negative buoyancy gradients.

Figure 3. Cross-sections through the three-dimensional buoyancy field for case no. 12 of the  $Ri_0=0.14$ ensemble at successive times as indicated. (a) Stratified shear layer with $Ri_{min}=0.14$ (unstable) plus random perturbation. (b) Primary instability has generated finite-amplitude KH billows. (c) Three-dimensional secondary instabilities take the form of streamwise convection rolls while subharmonic pairing is in progress. (d) Paired billow breaks, converting available potential energy into turbulence. (e) Turbulent mixing. (f) Stratified shear layer, thickened by turbulent mixing such that minimum $Ri>1/4$ (stable). Times are scaled by the initial maximum shear. For clarity, only part of the vertical range is shown.
A more precipitous drop in  $\bar {K}$ is seen during $190< t<220$. This is due first to the pairing of adjacent KH billows and second to the emergence of 3DSIs (figure 3c,d). These combine to increase $Ri_{min}$ of the mean flow. The 3-D instabilities now lead the shear layer toward a state of gradually decaying, quasi-isotropic turbulence (figure 3e, also see Smyth & Moum Reference Smyth and Moum2000a). The decay of the turbulence leaves a dynamically stable parallel shear flow, with $Ri_{min} > 1/4$ (figure 3f). This dissipative collapse to a stable equilibrium identifies the KH turbulence event as a case of transient chaos (Lai & Tél Reference Lai and Tél2011), as will be discussed further in § 7.
The initial conditions for 15-cases shown in figure 2 are identical save for differences in the small-amplitude noise, yet their evolution is markedly different. As soon as the primary instability reaches finite amplitude, both  $\bar {K}$ and $Ri_{min}$ show considerable case-to-case variation. The total amount of mixing also varies significantly, as quantified by a 60 % variation in the final value of $\bar {K}$ and a 30 % variation in the final $Ri_{min}$. In upcoming sections we describe the mechanisms that cause this SDIC and examine its implications for the study and prediction of KH turbulence.
4. Sensitive dependence via multiple competing instabilities
In this section we describe the three classes of instability mechanisms whose interaction governs the strength of the turbulence. We first discuss the influence of the initial noise field on each instability independently. We then see how the instabilities can interact to govern turbulence and how the initial noise determines those interactions.
4.1. The primary KH instability
Early in each simulation, the half-growth rate of  $K_{KH}$ (figure 4, solid curves), defined by (2.16) with $K=K_{KH}$, begins to rise while the instantaneous theoretical growth rate of the primary instability (symbols) decreases due to the diffusion of the mean shear (cf. Howland, Taylor & Caulfield Reference Howland, Taylor and Caulfield2018). Thereafter, the growth rates decrease together, with values remaining equal to within a few per cent, for several tens of turnover times (horizontal lines at the top of figure 4). The equality of the growth rates during this time confirms that the assumptions underlying linear stability theory, particularly the smallness of the perturbation amplitude and the slowness of the mean flow evolution, are valid. As a result, different modal components of the initial perturbation field evolve independently during this time, an important consideration in what follows.

Figure 4. Instantaneous exponential growth rate shown for two examples from the  $Ri_0 = 0.14$ ensemble. Initial states differ only in the random velocity perturbation. Symbols indicate growth rates computed from linear stability analysis (Lian et al. Reference Lian, Smyth and Liu2020) of horizontally averaged velocity and buoyancy profiles at selected times. Solid curves show corresponding growth rates derived from the kinetic energy of the KH mode using (2.16) with $K=K_{KH}$ (§ 2.4). Horizontal lines near the top of the figure indicate the linear growth regime, in which the growth rates agree to within 3 %.
The form of the random initial velocity field influences the subsequent macroscopic flow evolution partly through the time it requires to ‘lock on’ to the spatial form of the fastest-growing linear eigenfunction, so that linear growth can begin. For example, the two cases shown in figure 4 lock on at  $t\sim 30$ and $t\sim 70$, a difference due entirely to SDIC. We can understand this locking-on process in three complementary ways. First, the initial noise can be thought of as a linear combination of all of the linear eigenmodes of the initial profiles. The component proportional to the primary KH mode grows fastest and therefore dominates the disturbance after a time that depends on its initial amplitude. While the eigenmode description is valuable, it does not yield insight into the underlying physics. The following two sections provide alternative descriptions of the locking-on of the primary KH mode in terms of positive feedbacks.
4.1.1. Locking-on in physical space
The main mechanism of perturbation kinetic energy growth is the shear production  $-\bar {U}_z\overline {u'w'}$, where the overbar denotes the horizontal average and the subscript denotes the partial derivative. The mean shear $\bar {U}_z$ is nearly always positive. Near $t = 0$, the perturbation fields $u'$ and $w'$ are random and uncorrelated, therefore $\overline {u'w'} = 0$. But at any point in space where $u'w' <0$, shear production is locally positive and the amplitudes of $u'$ and $w'$ grow (specifically, $u'$ grows as $w'$ advects $\bar {U}_z$, and $w'$ grows as the pressure field enforces continuity). Over time, this preferential acceleration of $u'$ and $w'$ at points where $u'w' <0$ produces a negative overall correlation, $\overline {u'w'}<0$. This, in turn, increases the shear production rate, creating a positive feedback that drives exponential growth. Shear production is focused around the inflection point $z = 0$, consistent with the shear production theorem of SC19 (§ 3.11.2).
4.1.2. Locking-on in Fourier space
Locking-on may also be viewed as a process wherein internal waves propagate toward a configuration that favours resonant amplification (e.g. Holmboe Reference Holmboe1962; Baines & Mitsudera Reference Baines and Mitsudera1994; Heifetz et al. Reference Heifetz, Bishop, Hoskins and Methven2004; Carpenter, Balmforth & Lawrence Reference Carpenter, Balmforth and Lawrence2010). The initial random velocity fields are viewed as a superposition of vorticity waves with many wavelengths (quantized in DNS by the periodic boundary conditions and limited by the grid resolution) and a random distribution of phase positions and velocities. Pairs of vorticity waves propagating on the upper and lower flanks of the shear layer amplify one another if their phase velocities are equal and their phase relationship is in a particular range. (For details see Carpenter et al. (Reference Carpenter, Tedford, Heifetz and Lawrence2013), or SC19 §§ 3.12 and 3.13.)
In time, a wave pair with the optimal phase relationship for resonance becomes dominant. There are two reasons for this. First, wave pairs in that phase configuration grow fastest. Second, the optimal configuration is a stable attractor since wave pairs tend to nudge each other toward it. The result is a wave pair with the optimal wavelength and fixed in the optimal phase relationship, growing exponentially.
To illustrate this process simply, we neglect viscosity and stratification and use the homogeneous piecewise-linear model (hereafter HPLM) of a shear layer, which approximates (2.2) with
 \begin{equation} U(z)=\left\{ \begin{array}{@{}ll} 1, & z\ge 1\\ z, & -1\le z\le 1\\ -1, & z\le -1 \end{array} \right. ; \quad B(z) = 0. \end{equation}
In the HPLM, the fastest-growing instability has non-dimensional wavenumber  $k = 0.40$ (Rayleigh Reference Rayleigh1880, SC19). Vorticity waves with this wavenumber, focused at $z=\pm 1$, grow optimally if they differ in phase by $0.65{\rm \pi}$ radians. To facilitate comparison with Fourier phase spectra from the DNS, we add those two waves to obtain the total vertical velocity and compute the phase difference $\phi ^u_\ell$ between its values at $z=\pm 1$, resulting in $\phi ^u_\ell = 0.35{\rm \pi}$ (see Appendix A for details).
To compare results for our hyperbolic-tangent velocity profile with the HPLM, we compute the Fourier phase spectrum of  $w'$ at heights $z=\pm \tanh ^{-1}\sqrt {1/3}\approx \pm 0.6585$. Those two heights are the extrema of $\bar {U}_{zz}$, and are analogous to the upper and lower edges of the HPLM shear layer (Carpenter et al. Reference Carpenter, Tedford, Heifetz and Lawrence2013). During the period of linear growth, the phase difference converges to a fixed value similar to the optimal value for resonance in the HPLM (figure 5).

Figure 5. Phase difference between  $\langle w'\rangle _{y}$ at $z=\pm \tanh ^{-1}\sqrt {1/3}$ for example cases from the $Ri_0 = 0.14$ ensemble. The upper and lower horizontal dashed lines show the optimal and suboptimal phase difference, respectively, for the HPLM (4.1a,b).
4.1.3. Synthesis
An initial random velocity field that locks on quickly to the primary mode will be one for which
(i) The correlation $u'w'$ is dominantly negative within the shear layer; and
(ii) Wave motions in the upper and lower regions of the shear layer are phased so as to favour resonance at the wavelength of the fastest-growing mode.

These criteria are actually equivalent; when the upper and lower waves are configured to optimize resonance, the shear production in the layer between those waves is positive (SC19, § 3.11.4). This is the well-known ‘phase tilt’ property that distinguishes a growing shear instability from a neutral wave (e.g. SC19, Moum, Nash & Smyth Reference Moum, Nash and Smyth2011).
Between  $t\sim 100$ and $t\sim 200$, the phase difference $\phi ^u_\ell$ drops to near zero (figure 5). In the HPLM, this is the state in which the phase tilt (and hence the shear production rate) vanishes. Since shear production is the only energy source for the instability, this is also the saturation stage, at which growth ceases and the primary billow attains maximum amplitude. (This is only approximately true in the present case, which differs from the HPLM due to buoyancy stratification and continuous mean profiles.)
We note that the cases shown in figure 5 reach the ideal phase relationship  $\phi ^u_\ell = 0.35{\rm \pi}$, and also the maximum amplitude state, at different times due to slight differences in their initial perturbations. The initial perturbations experience transient, non-modal growth effects before locking on to the unstable KH mode (Kaminski, Caulfield & Taylor Reference Kaminski, Caulfield and Taylor2014). As a result, the timing of lock-on and the maximum amplitude state are not necessarily well correlated with the initial phase separation $\phi ^u_\ell$ at $t = 0$.
4.2. The subharmonic pairing instability
4.2.1. Kinetic energy evolution
The subharmonic mode is one of a spectrum of KH-like modes whose non-dimensional wavenumbers lie in the unstable band  $\frac {1}{2}\pm \sqrt {\frac {1}{4}-Ri_0}$ (in the inviscid limit, e.g. SC19) but are not the fastest growing. It is therefore sensitive to the initial noise in the same way as is the primary KH mode (§ 4.1). To illustrate this, we compare the evolution of the kinetic energies in the primary KH and subharmonic modes with the exponential growth rates obtained via linear stability analysis of the instantaneous, horizontally averaged velocity and buoyancy profiles (figure 6). We focus on two cases from the $Ri_0 = 0.14$ ensemble, one of which (figure 6a) shows clear pairing of adjacent KH billows and one of which (figure 6b) does not.

Figure 6. (a,b) Cross-sections of the buoyancy field for examples no. 2 and no. 12 from the  $Ri_0 = 0.14$ ensemble, both at $t=230$. Initial states differ only in the random velocity perturbation. Only part of the vertical domain is shown. (c) Kinetic energies of the primary (KH) and subharmonic Fourier modes. The vertical line indicates the time shown in (a,b). (d,e) Instantaneous exponential growth rate of the primary $(\sigma _{KH})$ and subharmonic $(\sigma _{sub})$ modes. Symbols indicate growth rates computed from linear stability analysis (abbreviated as LSA in the figure legend, e.g. Lian et al. Reference Lian, Smyth and Liu2020) of horizontally averaged velocity and buoyancy profiles at selected times. Solid curves show equivalent growth rates of the kinetic energy in the DNS.
In both cases, the kinetic energy of the primary KH mode (figure 6(c), dotted curves) locks on to its modal form at  $t\sim 20$, then grows quickly to a maximum at $t\sim 150$. The subharmonic energy $K_{sub}$ (solid curves) evolves similarly but on a slower time scale, reaching its maximum at $t\sim 210$. The main difference is that $K_{sub}$ reaches a larger maximum amplitude in case no. 12 than in case no. 2 (panel c, compare solid curves), and is therefore better configured to effect pairing.
The growth rate histories show marked similarities despite the difference in the outcomes. For the KH mode (figure 6d), the growth rate from the simulation (solid curves), defined by (2.16) with  $K=K_{KH}$, rises to match the theoretical value (circles) at $t\sim 30$, then remains close until $t\sim 80$. At $t\sim 80$, nonlinear effects cause the growth rate to depart from its linear value. The two cases depart differently (compare yellow and blue dotted curves) due to slight differences in the evolution of the mean profiles. In the range $t\sim 140\unicode{x2013}150$, the growth rate drops to zero, i.e. the KH mode reaches its maximum kinetic energy state.
The subharmonic growth rate  $\sigma _{sub}$ [figure 6(e), defined by (2.16) with $K=K_{sub}$] rises initially to match its theoretical value, undergoing the same locking-on process as the primary (§ 4.1). As with the primary, slight differences in the initial conditions affect the time taken for locking-on (cf. figure 5). Here, case no. 12 reaches its normal-mode growth rate (circles) sooner than does case no. 2. This difference accounts for the difference in the maxima of $K_{sub}$ and therefore for the difference in pairing (figure 6a,b).
Around  $t=80$, as the modes become energetic enough to interact nonlinearly (Monkewitz Reference Monkewitz1988), subharmonic growth pauses as the mode propagates to the proper phase position for pairing. This pause is much more pronounced in case no. 2 than in no. 12. The effect is not permanent; however, the sharp decay that begins at $t \sim 80$ in case no. 2 is followed by an even sharper ‘growth spurt’ that cancels the overall effect (figure 6(c), yellow curve). After $t\sim 140$ the linear growth rate for each case is relatively constant (figure 6(e), circles), but the energy growth rates increase sporadically between $t\sim 140$ and 200 to values exceeding the prediction from linear theory. Also evident in the slope of $K_{sub}$ (figure 6c, solid curves), this accelerated growth reflects the nonlinear transfer of energy from the finite-amplitude KH billows to the subharmonic when the latter is positioned for pairing (Smyth & Peltier Reference Smyth and Peltier1993).
Note that the subharmonic mode remains linearly unstable between  $t\sim 130$ and 200, well after the KH mode is stabilized (compare figure 6d,e). This is because the shear layer has thickened and therefore favours growth at the longer wavelength. Near $t=200$, both linear and energy growth rates drop rapidly to near zero as the subharmonic mode saturates. The cessation of subharmonic growth is therefore associated with changes in the instantaneous mean flow that stop the transfer of energy to the subharmonic mode. Note that this coincides with the arrival of the ensemble-averaged $Ri_{min}$ at values $>1/4$ (figure 2b).
The presence of pairing in case no. 12 and not in case no. 2 is due almost entirely to the difference in the time required for the subharmonic to lock on to its modal form and begin growing (figure 6(e),  $t\sim 30$ vs $t\sim 60$). This results in a difference of more than an order of magnitude in the subharmonic kinetic energies (figure 6(c), compare solid curves at $t\sim 50$) which persists throughout the event.
4.2.2. Phase evolution
In the linear regime, the growth of the subharmonic mode is independent of its phase position. But when the modes have attained finite amplitude, as alluded to above, the subharmonic can benefit from an additional energy transfer from the primary mode if it is near the optimal phase position for pairing (Smyth & Peltier Reference Smyth and Peltier1993). To illustrate this, we identify that optimal phase position with the condition
 \begin{equation} \phi^{KH}_{sub}=\phi_{KH}-2\phi_{sub}=\frac{\rm \pi}{2},\end{equation}
derived in Appendix B. In case no. 2 (figure 7), the phase of the KH mode ( $\phi _{KH}$, blue curve) quickly assumes a value that remains constant throughout the growth of the subharmonic (from $t\sim 20$ to $t\sim 80$). In contrast, between $t\sim 80$ and 130, the phase of the subharmonic ( $\phi _{sub}$, red) evolves to a value such that $\phi ^{KH}_{sub}$ satisfies (4.2).

Figure 7. Time series of the phase of the primary (KH) and subharmonic Fourier components of the centreline vertical velocity for case  ${\rm no.}\ 7$ of the $Ri_0 = 0.14$ ensemble, together with the phase difference $\phi ^{KH}_{sub}$ defined in (4.2). The horizontal dashed line indicates ${\rm \pi} /2$, the optimal value of $\phi ^{KH}_{sub}$.
To test the generality of the scenario sketched above, we examine six representative cases from the  $Ri_0 = 0.14$ ensemble, including four cases where the primary billows pair and two where they do not (figure 8). In all cases shown, the condition (4.2) is satisfied as the subharmonic mode approaches its maximum energy state (figure 8). Also evident in all cases is the slight acceleration of subharmonic growth during this period (figure 8a).

Figure 8. Time series of (a) kinetic energy of the subharmonic mode, and (b) the phase difference defined in (4.2) whose optimal value for pairing is  ${\rm \pi} /2$ shown as horizontal dashed line (Appendix B). Six representative cases with $Ri_0 = 0.14$ are shown and are categorized as either non-pairing, turbulent pairing or laminar pairing (to be defined in § 4.4).
The pause in subharmonic growth is clearly evident in the non-pairing cases no. 2 and no. 6 (figure 8(a), yellow and red curves). In case no. 6, the subharmonic energy does not recover but instead remains 1–2 orders of magnitude smaller than in the pairing cases despite the fact that the mode began growing relatively early. In both cases no. 2 and no. 6, during the initial growth phase,  $\phi ^{KH}_{sub}$ is far from ${\rm \pi} /2$, the correct value for pairing, and the mode therefore must undergo a relatively large phase shift to satisfy (4.2). This is especially true in case no. 6 and may account for the more pronounced pause in subharmonic growth (cf. Dong et al. Reference Dong, Tedford, Rahmani and Lawrence2019; Guha & Rahmani Reference Guha and Rahmani2019). In contrast, in the laminar pairing cases no. 9 and no. 12, $\phi ^{KH}_{sub}$ is already close to ${\rm \pi} /2$ during the initial growth phase. Pairing therefore requires only a modest phase shift, and the corresponding pause in growth is slight.
In summary, the subharmonic mode begins as a normal, KH-type instability. Its subsequent growth depends on the time it takes to lock on to its normal-mode form and also on its phase relationship with the primary KH billow train, which accelerates its growth as  $\phi ^{KH}_{sub}$ approaches ${\rm \pi} /2$.
4.3. Three-dimensional secondary instabilities
The 3DSIs play a critical role in catalysing the transition to turbulence and the irreversible mixing of the mean velocity and buoyancy fields. There are many such instabilities. For example, overturning of stably stratified fluid in the cores of the KH billows results in shear-aligned convective instability (Davis & Peltier Reference Davis and Peltier1979; Klaassen & Peltier Reference Klaassen and Peltier1985). Several other mechanisms have been identified, in fact Mashayek & Peltier (Reference Mashayek and Peltier2012a,Reference Mashayek and Peltierb) have referred to the profusion as a ‘zoo’ of secondary instabilities. (A useful summary is given in Appendix A of Mashayek & Peltier Reference Mashayek and Peltier2013.) To distinguish among the inhabitants of this zoo is beyond our scope here; instead, we simply refer to 3-D instabilities in general as 3DSIs.
The 3DSIs derive energy from the shears, strains and overturnings present in the primary KH billow at finite amplitude, and therefore do not appear until the primary billows attain sufficient amplitude. This is evident in figure 9, which shows  $K_{KH}(t)$ and $K_{3d}(t)$ for three cases from the $Ri_0=0.14$ ensemble. In each case, note that the growth of $K_{3d}$ begins just before the initial maximum of $K_{KH}$.

Figure 9. Time series of (a) the KH mode of the turbulent kinetic energy spectra and (b)  $K_{3d}$ from three members of the $Ri_0 = 0.14$ ensemble. Circles indicate the beginning of the growth phase of $K_{3d}$.
More generally, 3DSIs tend to begin growing within the final  $\sim$50 turnover times before the KH billows reach their maximum kinetic energy. To illustrate this, we compare the time of first $K_{3D}$ growth (as in figure 9) with the initial maximum of $K_{KH}$ for all 45-cases (figure 10). The fact that the slope of the data is less than unity indicates that the longer the KH mode takes to reach maximum amplitude (due to differences in either $Ri_0$ or the initial noise), the earlier the 3DSIs begin to grow relative to the saturation of the KH mode.

Figure 10. Time of initial growth of 3-D secondary motions vs time of the initial kinetic energy maximum of the KH billow train (e.g. symbols in figure 9). All 45-cases are included. Solid line indicates  $t^{3D}_{min}=t^{KH}_{max}$; dashed line is a least-squares fit to the data points.
Recall that  $Re_0=1000$ in all cases considered here. At higher $Re_0$, we would expect 3-D motions to emerge earlier relative to the primary KH mode (Mashayek & Peltier Reference Mashayek and Peltier2013). The initial noise also exerts a direct effect on the 3DSIs, as is indicated by the scatter in the data. Even though the noise has decayed considerably by the time the billows become unstable to 3-D perturbations, that noise is the sole source for the three-dimensional motions needed to catalyse the 3DSIs. It therefore exerts an important influence on their timing and form. In summary, the effect of the initial perturbation on the 3DSIs is partly direct and partly inherited via the timing of the primary KH instability.
4.4. Effects of SDIC on mode interactions
Pairing alters the turbulence and mixing that result from KH instability in two important ways. First, pairing creates a reservoir of available potential energy that can be converted into turbulence. Second, the resulting large billows generate intense strain in the braid regions that separate them, encouraging strong and efficient mixing (Smyth Reference Smyth2020). While turbulence varies strongly depending on whether or not pairing occurs, pairing, in turn, depends on turbulence. Here, we discuss the potential interactions between pairing and turbulence and how they can be altered by small changes in the initial flow.
We oversimplify when we imply that pairing either happens or does not. Consider first the 2-D case where, assuming  $Ri_0$ is sufficiently small, the emergence of KH billows is generally followed by pairing, although the relative timing of those two events is sensitive to the initial conditions. In the 3-D flows studied here, turbulence is an added factor. The effect on pairing depends on the strength of that turbulence and the timing of its emergence relative to billow growth and pairing. The resulting interactions may be classified as follows:
(i) Laminar pairing: if turbulence is sufficiently slow to appear, KH billows may remain coherent well into the pairing process (e.g. figure 1d). Pairing may then accelerate the development of turbulence as discussed above.
(ii) No pairing: if, in the opposite extreme, turbulence appears in the early stage of subharmonic growth, it may stabilize the mean flow before the subharmonic can attain significant amplitude (e.g. figure 1b).
(iii) Turbulent pairing: in intermediate cases, turbulence may appear early enough to distort the KH billows before they can pair, but not early enough to prevent the growth and dominance of the subharmonic mode. The result is large-amplitude billows with turbulent cores (e.g. figure 1c).
The three scenarios listed above are represented on a regime diagram based on the energetics of the flow in the state of maximum subharmonic kinetic energy (figure 1). At the right are cases of laminar pairing, while pairing is suppressed entirely in cases toward the left. In the intermediate cases, turbulence is elevated in the primary billows. Representative buoyancy cross-sections (figure 1b–d) illustrate the three regimes listed above.
5. The maximum amplitude state
The magnitude of a turbulent event can be quantified by computing the temporal maximum of the volume-averaged turbulent kinetic energy  $K'(t)$. The maximum $K'$ for each event is influenced by the combination of mode interactions discussed in the previous section. It therefore varies significantly due to small changes in the initial random velocity field. The ranges of variation for the $Ri_0 = 0.12$ and 0.14 ensembles are statistically equal (figure 11a), the variation between the largest and smallest of the 15 values being a factor of 4.6 in each case. For $Ri_0 = 0.16$, the range is smaller: a factor 2.1. Sensitive dependence is also evident in the maximum available potential energy (figure 11b). The ranges are smaller but their $Ri$-dependence is similar: 3.6 for $Ri_0 = 0.12$, 3.8 for $Ri_0 = 0.14$ and 1.9 for $Ri_0 = 0.16$.

Figure 11. Ranges, quartiles and medians of the maximum turbulent kinetic energy (a) and available potential energy (b). Top notations indicate the range (maximum/minimum) in each 15-member ensemble.
We now look more closely at the cases exhibiting the largest difference in maximum  $K'(t)$ due to SDIC, cases no. 6 and no. 11 of the ensemble with $Ri_0 = 0.12$ (figure 12). The primary growth phases are nearly identical, lasting until $t\sim 120$. Beyond that stage, the two $K'(t)$ curves diverge. Maximum $K'(t)$ is attained first by case no. 11, which is in the process of pairing and does not yet show signs of 3DSI, i.e. $K_{3d}\ll K'$ (compare red solid and dashed curves). This is an example of laminar pairing as described in § 4.4 (also figure 1d). In contrast, case no. 6 attains maximum $K'(t)$ later after pairing is complete. In that case the paired billow is fully turbulent, i.e. $K_{3d}\sim K'$ (blue curves), an example of turbulent pairing (figure 1c). The effect is not due entirely to pairing; however, even in the $Ri_0=0.16$ ensemble, where pairing does not occur, SDIC causes maximum $K'(t)$ to vary by a factor of 2.1.

Figure 12. Turbulent kinetic energy (thick, solid curves) vs time for cases no. 6 and no. 11,  $Ri_0 = 0.12$. Asterisks show the 4.6-fold difference in maximum $K'$. Also shown is $K_{3d}$ (dashed curves).
6. Variability of net turbulent mixing
Simulations are terminated at  $t=500$, at which time both $K_{2d}$ and $K_{3d}$ have decreased by 2–3 orders of magnitude from their peak values and the mixing event is taken to be over. At that point, we calculate the cumulative mixing $\int _0^{500} M\,{\rm d}t$ and the cumulative turbulent dissipation $\int _0^{500}\epsilon '\,{\rm d}t$ for the event. The total ranges of variation in mixing (the difference in the extremes of $\int _0^{500} M\,{\rm d}t$ normalized by their average; figure 13a) are similar for the three ensembles, approximately a factor 2. Variations in cumulative dissipation $\int _0^{500}\epsilon '\,{\rm d}t$ (figure 13b) are similar. In all cases the quartile range is greatest for $Ri = 0.14$, i.e. values in that ensemble are evenly distributed, whereas the variation in the cases $Ri_0 = 0.12$ and 0.16 results from a few extreme cases.

Figure 13. Ranges, quartiles and medians of (a) the cumulative mixing  $\int M \, {\rm d}t$ and (b) dissipation $\int \epsilon ' \, {\rm d}t$. Top notations indicate the range (maximum/minimum) in each 15-member ensemble.
Variability of the cumulative flux coefficient  $\varGamma _c$ is relatively independent of $Ri_0$, covering a range of $\sim$20 % (figure 14a). This shows that $\int M\,{\rm d}t$ and $\int \epsilon '\,{\rm d}t$ tend to vary together such that the variation is less evident in their ratio. Because the flux Richardson number $Ri_f$ is restricted to the range 0–1 by definition, we are not surprised to find that it varies less than $\varGamma _c$ for a given $Ri_0$ (figure 14b), but the pattern of variations is similar. The ranges (maximum - minimum) are 12 %–14 %.

Figure 14. Ranges, quartiles and medians of (a) the cumulative flux coefficient  $\varGamma _c=\int M \,{\rm d}t/\int \epsilon ' \,{\rm d}t$ and (b) the corresponding mixing efficiency $Ri_f=\varGamma _c/(1+\varGamma _c)$. Top notations indicate the range (i.e. $[maximum - minimum]/average$) in each 15-member ensemble.
6.1. Implications for simulation studies
Direct simulations like those discussed here, as well as laboratory experiments, are often used to explore the dependence of turbulence statistics (e.g. mixing efficiency) on mean flow parameters (e.g.  $Ri_0$). There is significant overlap among the distributions of $Ri_f$ for the three $Ri_0$ values used here. This raises the possibility of mistaking the overall trend if only a single case is considered at each $Ri_0$. From figure 14(b), one would likely conclude that $Ri_f$ decreases monotonically with increasing $Ri_0$ in the range $0.12\le Ri_0 \le 0.16$. If only a single case were considered for each $Ri_0$, there would be a 68 % chance (2294 out of 15 $^3$ combinations) of identifying this monotonic behaviour correctly. But there would also be a 31.6 % chance of perceiving a local extremum at $Ri_0 = 0.14$ (22.7 % chance of a minimum; 8.9 % chance of a maximum) and a 0.4 % chance that the inferred variation would be monotonic in the wrong direction.
Uncertainty due to SDIC can be reduced by running multiple simulations with slightly different initial conditions and basing conclusions on ensemble-averaged results. However, direct simulations require extensive computer resources, and compromises between accuracy and practicality are inevitable. While we cannot specify the ensemble size needed for a given application, we can estimate the minimum ensemble size that would be needed to reduce the uncertainty in a given variable by a given amount based on our 15-case ensembles for these particular parameter values. For example, consider the mixing efficiency  $Ri_f$ when $Ri_0 = 0.12$ (figure 14a). The average value of $Ri_f$ among our 15 values, 0.369, is taken to be our ‘best’ estimate. A conservative estimate of the uncertainty would be the maximum absolute deviation from that estimate, 0.030. A more realistic estimate is the root-mean-square deviation, 0.015.
Now suppose we take the average of an ensemble of  $n$ cases with different random initial conditions, where $n < 15$. From our 15-cases, we extract the $15 \choose n$ possible $n$-member subsets and compute the mean, the maximum absolute deviation and the root-mean-square deviation in $Ri_f$ for each. Both maximum and root-mean-square deviations are reduced systematically as we increase $n$ (figure 15a). If our goal was to reduce the maximum uncertainty in $Ri_f$ by half (dashed line), we would require an ensemble of six simulations, whereas halving of the root-mean-square error requires only three simulations. Similar results hold at other $Ri_0$ (figure 15b,c). In all three cases, three simulations suffice to reduce the root-mean-square error by half. For $Ri_0=0.14$ and 0.16, seven cases are needed to halve the maximum error. These estimates of the required ensemble size are not definitive, as they are based on only a single variable, $R_f$, and on a ‘universe’ of only 15 samples. Nevertheless we can conclude that an ensemble size considerably less than 15 can effectively reduce the uncertainty due to SDIC.

Figure 15. Error in estimates of the mean of  $Ri_f$ among $n$ simulations with slightly different initial conditions.
7. Summary and discussion
It has long been recognized that turbulent flows are not reproducible in detail (e.g. Wyngaard Reference Wyngaard2010). While statistical quantities can be predicted, timing and strength of the individual eddies are sensitive to small disturbances. In a laboratory flume, these disturbances might originate as vibrations from a passing truck. In the atmosphere, we can imagine how a storm system may be affected by the flapping of a butterfly's wing.
The resulting chaos differs from randomness in that it contains processes which, considered in isolation, are amenable to understanding and prediction (Lorenz Reference Lorenz2000). We have reviewed specific aspects of a KH turbulence event that are predictable: the primary, subharmonic and 3-D secondary instabilities. Each, in itself, generates exponentially diverging values of relevant flow properties. The growth rates are predictable, but the timing and the phase positions are not, as they depend on small differences in the initial state that are, in practice, not knowable.
The ‘sensitive dependence on initial conditions’ examined here differs somewhat from the definition exploited in dynamical systems theory to compute Lyapunov exponents, but is a more natural analogue to the so-called butterfly effect, whereby a minor change in the initial state can lead to a very different outcome. In the present example of transient chaos (Lai & Tél Reference Lai and Tél2011), there is no strange attractor but rather a continuum of stable asymptotic states (e.g. figure 2). Positive exponential growth rates of the multiple competing instabilities are analogous to positive Lyapunov exponents, while the implied criterion for ‘sensitivity’ is that the outcome of a small initial change is manifested macroscopically in the broadest spatial and temporal scales of the turbulence.
Primary and subharmonic modes grow independently at small amplitude, but interact as nonlinear terms become significant. This interaction primarily affects the phase propagation of the subharmonic, shifting it towards the correct phase position for pairing and thus triggering the upscale energy cascade. The 3DSIs become unstable as the primary KH mode approaches its maximum amplitude, largely (though not entirely) due to overturning of isopycnals. These trigger the downscale energy cascade to turbulence. By diffusing the mean shear, turbulence slows or stops the growth of the subharmonic mode, potentially preventing pairing.
All of these interactions are sensitive to the timing and initial phase positions of the individual primary, subharmonic and 3-D modes, which depend in turn on the details of the initial disturbance. Moreover, all of these interactions have important effects on the resulting turbulence. Of particular relevance to SDIC are the relative timings of the subharmonic and primary KH modes, the latter of which in turn affects the timing of the 3DSIs and thus the onset of turbulence. By governing the relative importance of the upscale and downscale energy cascades, these timings determine strength of the resulting turbulence and the amount and efficiency of mixing.
In the examples tested here, the maximum turbulent kinetic energy in events with nearly identical initial states can vary by more than a factor of four, while the cumulative amount of mixing can vary by a factor of two. The cumulative mixing efficiency, being a ratio of quantities that tend to vary together, varies by only a few tens of per cent, but this is enough to have important consequences such as distorting the apparent dependence of mixing efficiency on mean flow parameters.
The most dramatic effects of SDIC involve the pairing process, which is rarely observed in the high Reynolds number cases found in nature (Mashayek & Peltier Reference Mashayek and Peltier2013). But even when pairing is suppressed, in our case by stable stratification, the effects of SDIC are significant. In our  $Ri=0.16$ ensemble, the maximum turbulent kinetic energy varies by more than a factor of two despite the complete absence of pairing.
We therefore suggest that future DNS experiments on KH turbulence make use of ensembles of simulations with varying initial disturbances, much as is done when forecasting climate or weather (e.g. Gneiting & Raftery Reference Gneiting and Raftery2005). A first attempt to estimate the appropriate ensemble size suggests a minimum of three to six simulations.
7.1. Caveats and future directions
The choice of amplitude for the initial noise field can influence flow evolution significantly (Kaminski & Smyth Reference Kaminski and Smyth2019). While that choice is expected to influence sensitivity to the initial noise variations discussed here, we have so far considered only a single choice (random velocity components within 1.25 % of the initial velocity change across the shear layer). Future studies will consider a range of amplitudes, and will also generalize our purely random noise to include noise fields that better mimic ambient disturbances found in naturally occurring stratified shear flows.
For this exploratory project, our attention has been confined to a small sampling of the continuum of initial states, and also to the analysis of a small subset of the flow properties and turbulence parameters whose values are needed for future progress (e.g. Smyth & Moum Reference Smyth and Moum2000b; Mashayek, Caulfield & Peltier Reference Mashayek, Caulfield and Peltier2017). In future work, a broader range of initial  $Re_0$, $Pr$ and $Ri_0$ should be explored using ensembles of initial noise fields. For example, larger $Re_0$ values are of practical interest, and will allow instability to grow at larger $Ri_0$ (also more representative of geophysical cases). Effects of higher $Pr$ are relevant in water. The range of $Ri_0$ considered should also extend to smaller values where multiple vortex mergings are possible. Besides the diagnostics considered here, SDIC could affect the characteristic length scales and their ratios (Smyth & Moum Reference Smyth and Moum2000b; Mashayek et al. Reference Mashayek, Caulfield and Peltier2017) and anisotropy statistics (Smyth & Moum Reference Smyth and Moum2000a), to name only a few possibilities.
Since pairing is a major determinant of SDIC, it would be useful to map out the region in  $Ri_0-Re_0-Pr$ space where the competition between 3DSIs and pairing is close. This study provides one data point: $Re_0=1000, Pr=1, Ri_0 = 0.14$. In geophysical flows, $Re_0$ is generally on the high side of this boundary, i.e. high enough that pairing is prevented (Mashayek & Peltier Reference Mashayek and Peltier2011). We speculate that results are then comparable to the $Ri_0 = 0.16$ case investigated here, in which there is no pairing but significant sensitivity to initial conditions nonetheless. Future studies can test this hypothesis by increasing $Re_0$, although geophysical values will not be attainable in the foreseeable future.
We have focused specifically on the problem of KH instability arising in shear layers with initial mean velocity and buoyancy varying over the same layer. Variations in the background shear and stratification profiles can strongly affect the flow evolution, and even the type of instability that arises. We expect that our results will broadly apply to KH-unstable flows. For example, in their numerical study of KH instability in uniform background stratification, VanDine et al. (Reference VanDine, Pham and Sarkar2021) mention that repeating simulations with slightly different initial noise impacted the resulting transition to turbulence, suggesting some degree of SDIC even at their higher  $Re_0$. However, for cases where the background density gradient is sharp enough to support Holmboe instability (Holmboe Reference Holmboe1962, SC19), it is not clear that SDIC would be observed. In contrast to KH-unstable flows, Holmboe-unstable turbulent shear layers tend to evolve towards a state of self-organized criticality (specifically, they produce internal regions in which $Ri\sim 1/4$; Salehipour, Peltier & Caulfield Reference Salehipour, Peltier and Caulfield2018), suggesting a degree of independence from initial flow parameters. Understanding whether SDIC may arise in flows prone to Holmboe-type instabilities, and more generally the relationship between self-organized criticality and SDIC in turbulent flows, is a compelling problem for future research.
Acknowledgements
Thanks to J. Moum for suggesting this project. We appreciate J. Taylor's generosity in making DIABLO available. We also wish to acknowledge the helpful input of the editor and reviewers.
Funding
This work was funded by the US National Science Foundation under grant OCE-1830071. A.K.K. was supported as the Ho-Shang and M.-L. Lee Faculty Fellow in Mechanical Engineering at UC Berkeley.
Declaration of interests
The authors report no conflict of interest.
Data availability statements
DIABLO is available at https://github.com/johnryantaylor/DIABLO. Output data are available by request to the authors.
Appendix A. Optimal phase shift of $w$ across the piecewise shear layer for primary instability

We extend the analysis in §§ 3.3.1 and 3.13.3 of SC19 to obtain the phase shift of the net vertical velocity field between the upper and lower edges of the HPLM shear layer subject to the fastest-growing shear instability. The vertical velocity eigenfunction can be written in the form
 \begin{equation} \hat{w}(z)=B_u\, {\rm e}^{{-}k|z-h|}+B_\ell \, {\rm e}^{{-}k|z+h|},\end{equation}
where  $k$ is the streamwise wavenumber of the normal-mode solution and $z=\pm h$ are the upper and lower boundaries of the shear layer. Writing $B_u$ and $B_\ell$ in polar form and assuming by symmetry that their amplitudes are equal (taken to be 1 without loss of generality), we define $B_u={\rm e}^{{\rm i}\,\theta _u}$ and $B_\ell ={\rm e}^{{\rm i}\,\theta _\ell }$.
At the upper and lower edges of the shear layer, the total vertical velocity eigenfunction is found by substituting  $z=\pm h$ into (A1)
 \begin{equation} \hat{w}(h)={\rm e}^{{\rm i}\,\theta_u}+{\rm e}^{{\rm i}\,\theta_\ell-2kh};\quad \hat{w}({-}h)={\rm e}^{{\rm i}\,\theta_u-2kh}+{\rm e}^{{\rm i}\,\theta_\ell}.\end{equation}
In polar form, this is
 \begin{equation} \hat{w}(h)=w_0\,{\rm e}^{{\rm i}\,\phi_u};\quad \hat{w}({-}h)=w_0\,{\rm e}^{{\rm i}\,\phi_\ell},\end{equation}
where the amplitudes  $w_0$ are again equal by symmetry. Equating (A3a,b) with (A2a,b) and solving for the phase difference $\phi ^u_\ell = \phi _u -\phi _\ell$ gives
 \begin{equation} \tan{\phi^u_\ell} = \frac{\sinh 2kh \sin{\rm \Delta}\theta}{1+\cosh 2kh\cos{\rm \Delta}\theta}, \end{equation}
where  ${\rm \Delta} \theta = \theta _u-\theta _\ell$. For the fastest-growing shear instability, $kh = 0.40$ and ${\rm \Delta} \theta = 0.65{\rm \pi}$. Substituting these values and solving numerically, we obtain $\phi ^u_\ell = 0.35{\rm \pi}$.
Appendix B. Optimal phase difference for subharmonic pairing instability.
When the subharmonic mode causes two adjacent KH billows to pair, the billows rotate clockwise (the direction of the shear) about a point  $x_0$ midway between their cores (figure 16). Now consider $w_{2d}^0(x)$, the 2-D vertical velocity component on the midplane $z = 0$ at a time just as pairing begins. That velocity has Fourier components with the subharmonic wavenumber $k_0$ and the KH wavenumber $2k_0$, plus higher terms
 \begin{equation} w_{2d}^0(x) =
{\rm Re}\left\lbrace \hat{w}_{sub} \exp\left\lbrace
{\rm i}\left[k_0(x-x_0)+\frac{\rm \pi}{2}\right]\right\rbrace+
\hat{w}_{KH} \exp\left\lbrace
{\rm i}\left[2k_0(x-x_0)-\frac{\rm \pi}{2}\right]\right\rbrace+
\cdots \right\rbrace , \end{equation}
\begin{equation} w_{2d}^0(x) =
{\rm Re}\left\lbrace \hat{w}_{sub} \exp\left\lbrace
{\rm i}\left[k_0(x-x_0)+\frac{\rm \pi}{2}\right]\right\rbrace+
\hat{w}_{KH} \exp\left\lbrace
{\rm i}\left[2k_0(x-x_0)-\frac{\rm \pi}{2}\right]\right\rbrace+
\cdots \right\rbrace , \end{equation}
where  $\hat {w}_{sub}$ and $\hat {w}_{KH}$ are constants whose values are not relevant here. The added phase shifts ${\rm \pi} /2$ and $-{\rm \pi} /2$ ensure that the rotation is in the proper sense, i.e. the subharmonic and KH terms are proportional to $-\sin [ k_0(x-x_0)]$ and $\sin [ 2k_0(x-x_0)]$, respectively, as in figure 16.

Figure 16. Schematic of vorticity and vertical motions associated with the subharmonic and KH modes at the onset of pairing.
Equating the subharmonic and KH terms in (B1) to  $\exp \lbrace {\rm i}[k_0x+\phi _{sub}]\rbrace$ and $\exp \lbrace {\rm i}[ 2k_0x+\phi _{KH}]\rbrace$, respectively, gives
 \begin{equation} \phi_{sub}={-}k_0x_0+\frac{\rm \pi}{2};\quad \phi_{KH}={-}2k_0x_0-\frac{\rm \pi}{2}. \end{equation}
Finally, eliminating  $x_0$ from (B2a,b) results in
 \begin{equation} \phi^{KH}_{sub}\equiv \phi_{KH}-2\phi_{sub}=\frac{\rm \pi}{2}+2n{\rm \pi}, \end{equation}
where  $n$ is an arbitrary integer.


 Open access