


1. Introduction
In the first part of this investigation (Shi, Zhang & Magnaudet Reference Shi, Zhang and Magnaudet2024, hereinafter referred to as Part 1), we analysed the results of a series of simulations revealing the mechanisms governing the lateral migration of freely deformable gas bubbles rising near a vertical wall in a liquid at rest. The physical parameters were selected so that bubbles rose at moderate Reynolds number and underwent low-to-moderate deformation, ensuring that they would rise in a straight line in the absence of the wall. However, millimetre-size gas bubbles rising in weakly or moderately viscous liquids, especially water, are subject to path instability (Duineveld Reference Duineveld1995; de Vries Reference de Vries2001; Zenit & Magnaudet Reference Zenit and Magnaudet2008; Cano-Lozano et al. Reference Cano-Lozano, Martínez-Bazán, Magnaudet and Tchoufag2016; Bonnefis et al. Reference Bonnefis, Fabre and Magnaudet2023, Reference Bonnefis, Sierra-Ausin, Fabre and Magnaudet2024). Consequently, they usually follow either planar zigzagging or (possibly flattened) spiralling paths, both of which exhibit large-amplitude horizontal excursions. Only small enough bubbles, which do not deviate ‘too much’ from the spherical shape, can still rise in a straight line when the Reynolds number exceeds a few hundred. These highly inertial regimes, with or without the presence of path instability, are those on which this second part of our investigation focuses.
As discussed in Part 1, interactions between isolated rising bubbles and a vertical wall in moderately inertial regimes are largely governed by two distinct mechanisms. These are the attractive inviscid Bernoulli mechanism, predicted by potential flow theory and resulting from the acceleration of the flow in the gap (van Wijngaarden Reference van Wijngaarden1976; Miloh Reference Miloh1977; Kok Reference Kok1993), and the repulsive vortical mechanism associated with the small flow correction induced by the interaction of the wake with the wall at large distances downstream of the bubble (Takemura et al. Reference Takemura, Takagi, Magnaudet and Matsumoto2002; Takemura & Magnaudet Reference Takemura and Magnaudet2003; Sugioka & Tsukada Reference Sugioka and Tsukada2015; Shi et al. Reference Shi, Rzehak, Lucas and Magnaudet2020; Shi Reference Shi2024). The type of near-wall bubble motion depends largely on the relative magnitudes of the irrotational and vortical interaction mechanisms, which in turn depend on the rise Reynolds number, $Re$
, and the geometrical aspect ratio,
$Re$
, and the geometrical aspect ratio, $\chi$
, of the bubble. Here,
$\chi$
, of the bubble. Here, $Re$
is based on the bubble’s equivalent diameter and rise speed, and
$Re$
is based on the bubble’s equivalent diameter and rise speed, and $\chi$
is the length ratio of the major to minor axes of the bubble. Provided that
$\chi$
is the length ratio of the major to minor axes of the bubble. Provided that $Re$
is smaller than a critical value,
$Re$
is smaller than a critical value, $Re_1$
, increasing from
$Re_1$
, increasing from $\approx 35$
at
$\approx 35$
at $\chi=1$
to
$\chi=1$
to $\approx 100$
at
$\approx 100$
at $\chi\approx 1.5$
, the repulsive vortical mechanism dominates, causing bubbles to consistently migrate away from the wall. On the other hand, for
$\chi\approx 1.5$
, the repulsive vortical mechanism dominates, causing bubbles to consistently migrate away from the wall. On the other hand, for $Re \gt Re_1$
, both mechanisms remain active, and the bubble is first attracted to the wall down to a certain critical distance at which the total transverse force vanishes, and then undergoes either regular or damped transverse oscillations.
$Re \gt Re_1$
, both mechanisms remain active, and the bubble is first attracted to the wall down to a certain critical distance at which the total transverse force vanishes, and then undergoes either regular or damped transverse oscillations.
In Part 1, the bubble Reynolds number was kept below approximately $200$
, and the aspect ratio was, in most cases, smaller than
$200$
, and the aspect ratio was, in most cases, smaller than $2$
. The aim in this second part is to explore the regime in which bubbles rise with Reynolds numbers of
$2$
. The aim in this second part is to explore the regime in which bubbles rise with Reynolds numbers of $\mathcal{O}(10^2-10^3)$
, while their aspect ratios may vary from
$\mathcal{O}(10^2-10^3)$
, while their aspect ratios may vary from $1$
to nearly
$1$
to nearly $3$
. In such highly inertial regimes, isolated bubbles rising in an unbounded expanse of a weakly viscous liquid are known to undergo a path instability when their aspect ratio exceeds a critical value
$3$
. In such highly inertial regimes, isolated bubbles rising in an unbounded expanse of a weakly viscous liquid are known to undergo a path instability when their aspect ratio exceeds a critical value $\chi_c\approx 2.0$
(Duineveld Reference Duineveld1995; de Vries Reference de Vries2001; Veldhuis Reference Veldhuis2007; Zenit & Magnaudet Reference Zenit and Magnaudet2008; Bonnefis et al. Reference Bonnefis, Sierra-Ausin, Fabre and Magnaudet2024). Depending on the carrying fluid, the corresponding threshold Reynolds number may vary by more than one order of magnitude, being approximately
$\chi_c\approx 2.0$
(Duineveld Reference Duineveld1995; de Vries Reference de Vries2001; Veldhuis Reference Veldhuis2007; Zenit & Magnaudet Reference Zenit and Magnaudet2008; Bonnefis et al. Reference Bonnefis, Sierra-Ausin, Fabre and Magnaudet2024). Depending on the carrying fluid, the corresponding threshold Reynolds number may vary by more than one order of magnitude, being approximately $670$
for water and approximately
$670$
for water and approximately $110$
for a silicone oil five times more viscous than water. Hence, depending on
$110$
for a silicone oil five times more viscous than water. Hence, depending on $\chi$
, two sub-regimes exist for Reynolds numbers of
$\chi$
, two sub-regimes exist for Reynolds numbers of $\mathcal{O}(10^2{-}10^3)$
: a stable one, in which the bubble undergoes a moderate deformation and maintains a vertical path in the absence of the wall, and an unstable one, in which its oblateness is somewhat larger and leads to an unstable path.
$\mathcal{O}(10^2{-}10^3)$
: a stable one, in which the bubble undergoes a moderate deformation and maintains a vertical path in the absence of the wall, and an unstable one, in which its oblateness is somewhat larger and leads to an unstable path.
The only investigation to date in the first sub-regime appears to be the experiments by de Vries (Reference de Vries2001), some of which were described by de Vries, Biesheuvel & van Wijngaarden (Reference de Vries, Biesheuvel and van Wijngaarden2002). There, bubbles rising near a vertical wall in water were observed to undergo a regular bouncing motion when their equivalent radius, $R$
, exceeded approximately
$R$
, exceeded approximately $0.4\,\text{mm}$
(corresponding to a Reynolds number in the absence of the wall,
$0.4\,\text{mm}$
(corresponding to a Reynolds number in the absence of the wall, $Re_\infty$
, of approximately
$Re_\infty$
, of approximately $150$
). As the bubble size increased further, the amplitude of the transverse oscillations grew. Then, provided
$150$
). As the bubble size increased further, the amplitude of the transverse oscillations grew. Then, provided $R$
exceeded a second critical value of approximately
$R$
exceeded a second critical value of approximately $0.6\,\text{mm}$
(corresponding to
$0.6\,\text{mm}$
(corresponding to $Re_\infty \approx 370$
), the bubble, after colliding with the wall, was able to reach a large wall-normal separation and never returned to the wall. Nevertheless, in the initial stages, these ‘escaping’ bubbles behaved essentially as regular bouncing bubbles, and managed to escape from the wall only after (at least) one period of near-wall bouncing. Clearly, the mechanism promoting the final escape cannot be interpreted as the dominance of the repulsive vortical mechanism summarised above as, if this were the case, the bubble would migrate away from the wall from the very beginning of the interaction sequence. This situation leads to the first objective of this work, which is to clarify the mechanism triggering the escape from the wall of moderately deformed bubbles rising at sufficiently high
$Re_\infty \approx 370$
), the bubble, after colliding with the wall, was able to reach a large wall-normal separation and never returned to the wall. Nevertheless, in the initial stages, these ‘escaping’ bubbles behaved essentially as regular bouncing bubbles, and managed to escape from the wall only after (at least) one period of near-wall bouncing. Clearly, the mechanism promoting the final escape cannot be interpreted as the dominance of the repulsive vortical mechanism summarised above as, if this were the case, the bubble would migrate away from the wall from the very beginning of the interaction sequence. This situation leads to the first objective of this work, which is to clarify the mechanism triggering the escape from the wall of moderately deformed bubbles rising at sufficiently high $Re$
.
$Re$
.
On the other hand, bubbles with $\chi \gt \chi_c$
follow an unstable path even in the absence of the wall. For
$\chi \gt \chi_c$
follow an unstable path even in the absence of the wall. For $\chi\lesssim \chi_c$
, results from Part 1 indicate that the vortical mechanism dominates, causing all bubbles with
$\chi\lesssim \chi_c$
, results from Part 1 indicate that the vortical mechanism dominates, causing all bubbles with $Re \approx 100$
to consistently migrate away from the wall. Hence, the repulsive vortical mechanism governs the bubble–wall interaction slightly below the onset of path instability. Moreover, the magnitude of the vorticity generated at the bubble surface (hence the intensity of the wake–wall interaction) increases with increasing
$Re \approx 100$
to consistently migrate away from the wall. Hence, the repulsive vortical mechanism governs the bubble–wall interaction slightly below the onset of path instability. Moreover, the magnitude of the vorticity generated at the bubble surface (hence the intensity of the wake–wall interaction) increases with increasing $\chi$
(Magnaudet & Mougin Reference Magnaudet and Mougin2007). Given these two arguments, one would expect the dominance of the vortical repulsive mechanism to persist as
$\chi$
(Magnaudet & Mougin Reference Magnaudet and Mougin2007). Given these two arguments, one would expect the dominance of the vortical repulsive mechanism to persist as $\chi$
increases beyond
$\chi$
increases beyond $\chi_c$
. If so, all bubbles undergoing path instability would exhibit a net migration away from the wall, on which path oscillations would superimpose. This behaviour has indeed been reported in previous numerical simulations (Zhang et al. Reference Zhang, Dabiri, Chen and You2020; Yan et al. Reference Yan, Zhang, Liao, Zhang, Zhou and Liu2022; Mundhra et al. Reference Mundhra, Lakkaraju, Das, Pakhomov and Lobanov2023) and in the recent experiments by Estepa-Cantero, Martínez-Bazán & Bolaños Jiménez (Reference Estepa-Cantero, Martínez-Bazán and Bolaños Jiménez2024), where bubbles were found to follow either planar zigzagging or flattened spiralling paths while gradually migrating away from the wall. The same behaviour was observed in Part 1 with a bubble with
$\chi_c$
. If so, all bubbles undergoing path instability would exhibit a net migration away from the wall, on which path oscillations would superimpose. This behaviour has indeed been reported in previous numerical simulations (Zhang et al. Reference Zhang, Dabiri, Chen and You2020; Yan et al. Reference Yan, Zhang, Liao, Zhang, Zhou and Liu2022; Mundhra et al. Reference Mundhra, Lakkaraju, Das, Pakhomov and Lobanov2023) and in the recent experiments by Estepa-Cantero, Martínez-Bazán & Bolaños Jiménez (Reference Estepa-Cantero, Martínez-Bazán and Bolaños Jiménez2024), where bubbles were found to follow either planar zigzagging or flattened spiralling paths while gradually migrating away from the wall. The same behaviour was observed in Part 1 with a bubble with $(\chi,Re) \approx (2.1,96)$
. In these investigations, highly viscous fluids were considered, so that the Reynolds number remained between
$(\chi,Re) \approx (2.1,96)$
. In these investigations, highly viscous fluids were considered, so that the Reynolds number remained between $100$
and
$100$
and $200$
. In contrast, several experimental studies performed in water (de Vries Reference de Vries2001; Jeong & Park Reference Jeong and Park2015; Lee & Park Reference Lee and Park2017; Cai et al. Reference Cai, Ju, Chen and Sun2023) considered much larger Reynolds numbers in the range
$200$
. In contrast, several experimental studies performed in water (de Vries Reference de Vries2001; Jeong & Park Reference Jeong and Park2015; Lee & Park Reference Lee and Park2017; Cai et al. Reference Cai, Ju, Chen and Sun2023) considered much larger Reynolds numbers in the range $[700-1100]$
, corresponding to equivalent bubble radii from 0.97 to
$[700-1100]$
, corresponding to equivalent bubble radii from 0.97 to $1.96\,\text{mm}$
. The observed paths differed dramatically from those described above: instead of gradually migrating towards the bulk, these high-
$1.96\,\text{mm}$
. The observed paths differed dramatically from those described above: instead of gradually migrating towards the bulk, these high- $Re$
bubbles were found to be trapped by the wall, undergoing a zigzagging near-wall motion throughout their ascent. This leads to the second question we wish to examine here, namely the underlying mechanism responsible for the high-
$Re$
bubbles were found to be trapped by the wall, undergoing a zigzagging near-wall motion throughout their ascent. This leads to the second question we wish to examine here, namely the underlying mechanism responsible for the high- $Re$
wall-ward trapping of bubbles. Is it linked to the attractive inviscid Bernoulli mechanism, as in the moderately inertial regimes, or is it specifically related to the interaction between the wall and the double-threaded wake that accompanies zigzagging and spiralling bubbles?
$Re$
wall-ward trapping of bubbles. Is it linked to the attractive inviscid Bernoulli mechanism, as in the moderately inertial regimes, or is it specifically related to the interaction between the wall and the double-threaded wake that accompanies zigzagging and spiralling bubbles?
To make progress on the above questions, we carry out a series of high-resolution simulations covering a significant range of hydrodynamic conditions and analyse the different evolution scenarios. In § 2, we formulate the problem, specify the range of parameters we consider and summarise the numerical approach (a series of tests aimed at confirming the adequacy of the grid resolution are detailed in Appendix A). Section 3 provides an overview of the observed scenarios, highlighting the existence of several distinct regimes depending on whether the bubble path is stable or not. The escape scenario observed in the absence of path instability is discussed in § 4, while those found in the unstable path regime, with or without wall-ward trapping, are discussed in § 5. Section 6 summarises the main findings of both parts of this investigation.
2. Statement of the problem and outline of the numerical approach
An initially spherical gas bubble with radius $R$
rises under the effect of buoyancy in a stagnant liquid in the presence of a nearby vertical wall which we assume to be hydrophilic. Figure 1
$R$
rises under the effect of buoyancy in a stagnant liquid in the presence of a nearby vertical wall which we assume to be hydrophilic. Figure 1 $(a)$
specifies the coordinate system, in which the wall lies in the plane
$(a)$
specifies the coordinate system, in which the wall lies in the plane $x=0$
. The initial and current positions of the bubble centroid are
$x=0$
. The initial and current positions of the bubble centroid are ${\textbf {x}}_{b0}=(x_0, 0, 0)$
and
${\textbf {x}}_{b0}=(x_0, 0, 0)$
and ${\textbf {x}}_b(t)=(x_b(t), y_b(t), z_b(t))$
, respectively, and the minimum gap between the wall and the bubble surface is
${\textbf {x}}_b(t)=(x_b(t), y_b(t), z_b(t))$
, respectively, and the minimum gap between the wall and the bubble surface is $\delta (t)$
.
$\delta (t)$
.
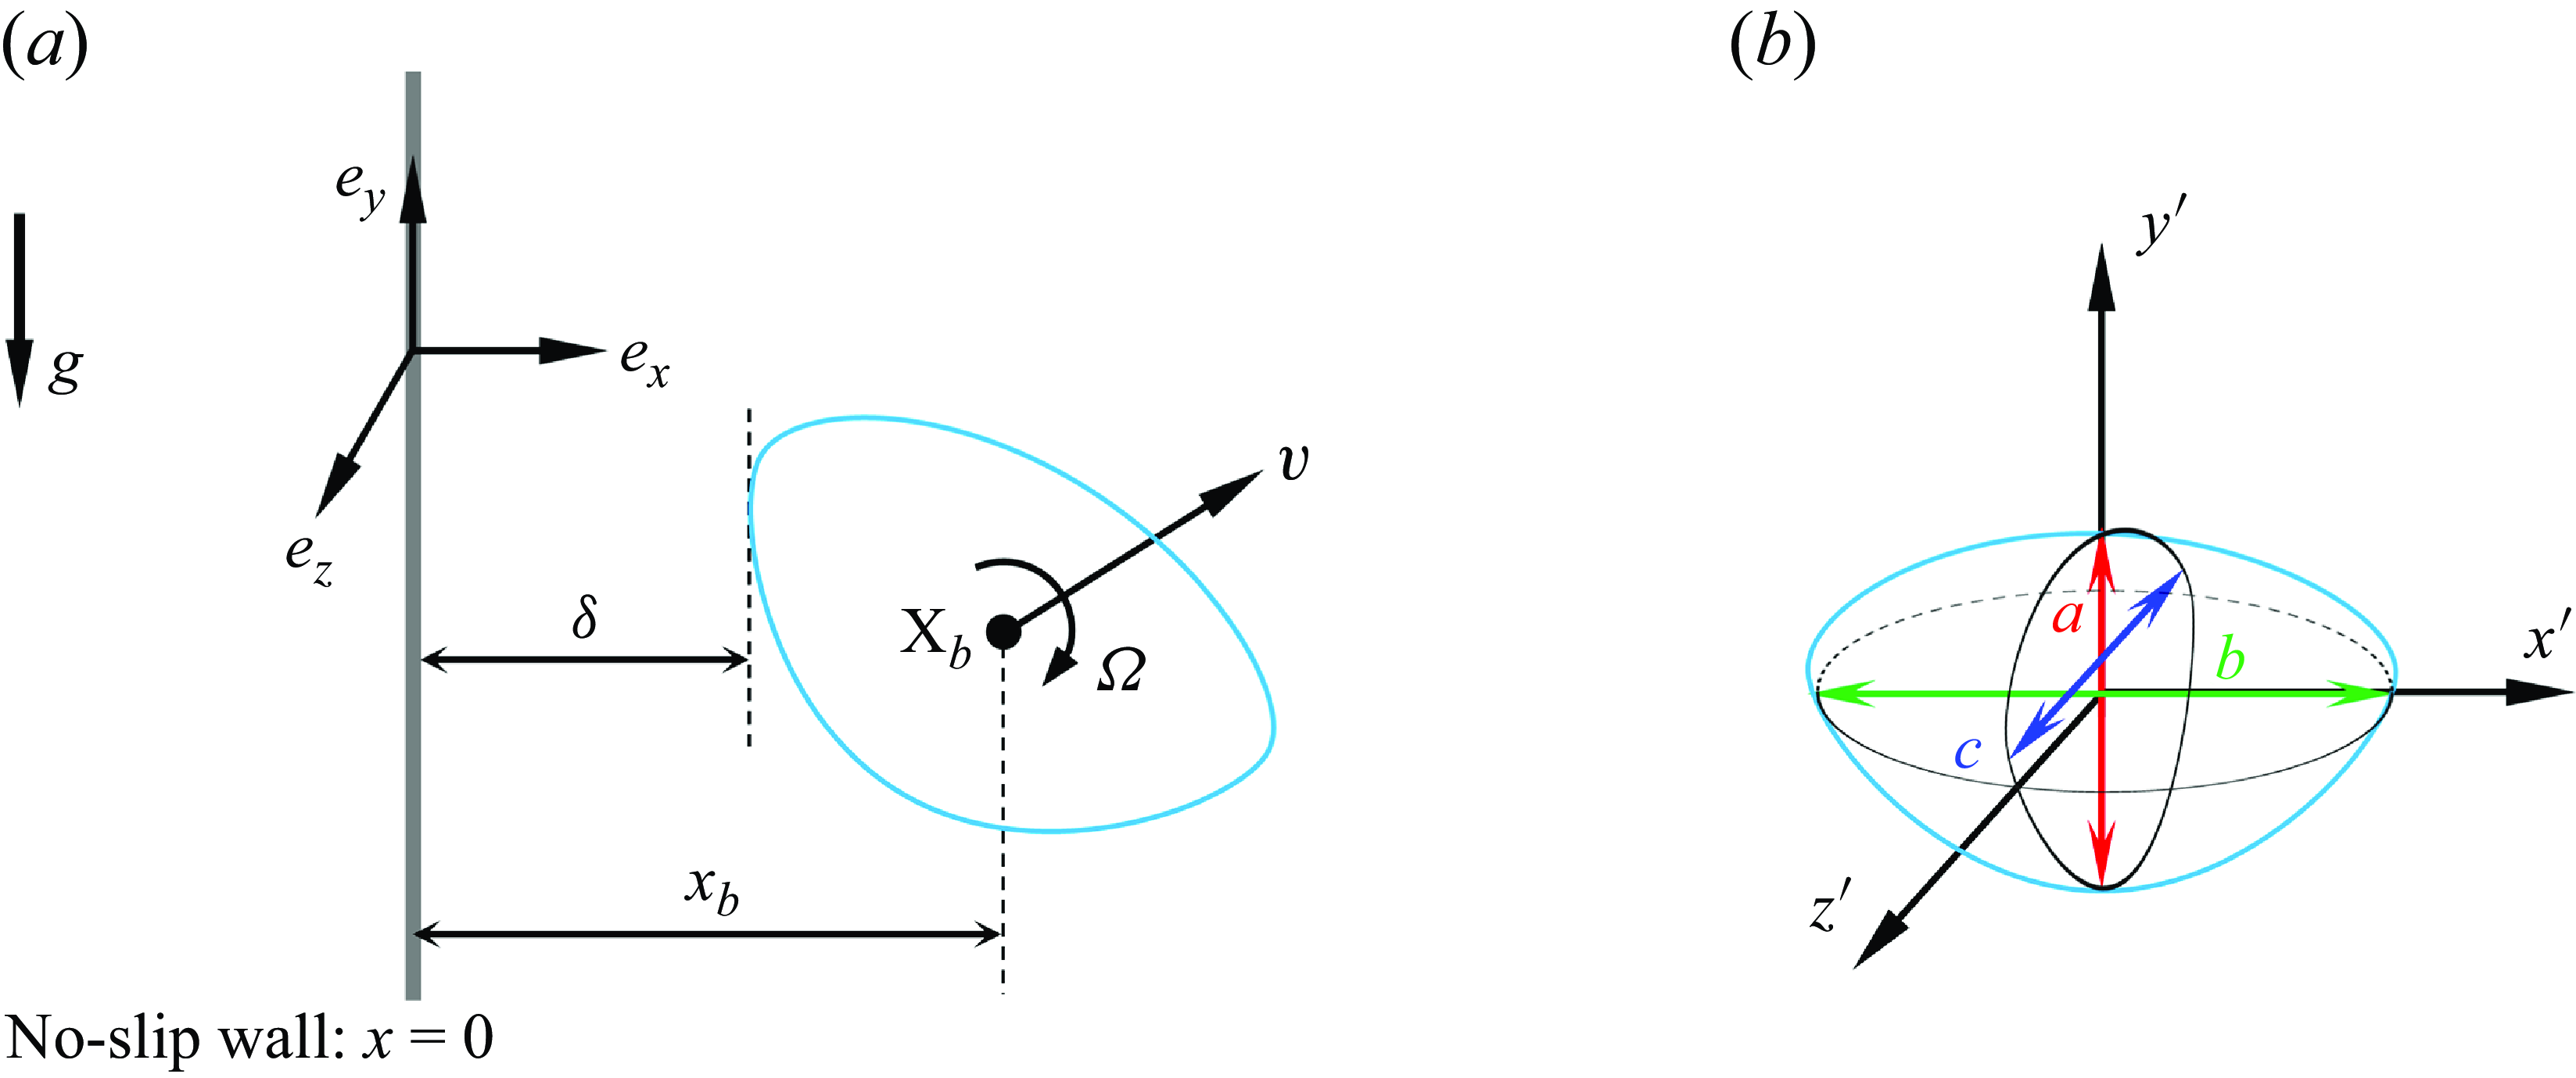
Figure 1. Sketch of the problem. $(a)$
: flow configuration and basic quantities characterising the bubble motion;
$(a)$
: flow configuration and basic quantities characterising the bubble motion; $(b)$
: bubble geometry.
$(b)$
: bubble geometry.
The bubble translational velocity is denoted as $\boldsymbol{v}(t)$
, and its possible oscillation frequency is
$\boldsymbol{v}(t)$
, and its possible oscillation frequency is $f$
. Similarly, the local fluid velocity is
$f$
. Similarly, the local fluid velocity is $\boldsymbol{u}({\textbf {x}},t)$
, the vorticity is
$\boldsymbol{u}({\textbf {x}},t)$
, the vorticity is $\boldsymbol \omega ({\textbf {x}},t)=\nabla \times \boldsymbol{u}$
, and the possible spinning rate (to be defined later) of the interface is
$\boldsymbol \omega ({\textbf {x}},t)=\nabla \times \boldsymbol{u}$
, and the possible spinning rate (to be defined later) of the interface is $\boldsymbol{\Omega }(t)$
. Assuming that the gas-to-liquid density and viscosity ratios keep very small values, and that the initial dimensionless separation
$\boldsymbol{\Omega }(t)$
. Assuming that the gas-to-liquid density and viscosity ratios keep very small values, and that the initial dimensionless separation $X_0=x_0/R$
is kept fixed (hereinafter
$X_0=x_0/R$
is kept fixed (hereinafter $X_0=2$
, except in some runs examined in § 4 and in Appendix B where the influence of
$X_0=2$
, except in some runs examined in § 4 and in Appendix B where the influence of $X_0$
is investigated), the flow and bubble dynamics may entirely be characterised by the Galilei and Bond numbers, respectively defined as
$X_0$
is investigated), the flow and bubble dynamics may entirely be characterised by the Galilei and Bond numbers, respectively defined as
 \begin{equation} Ga=\rho _l g^{1/2} R^{3/2}/{\mu _l}, \quad Bo=\rho _l g R^2/{\gamma }\,, \end{equation}
where $\rho _l$
and
$\rho _l$
and $\mu _l$
are the density and dynamic viscosity of the carrying liquid, and
$\mu _l$
are the density and dynamic viscosity of the carrying liquid, and $\gamma$
and g denote surface tension and gravity, respectively. One of the above two control parameters may be replaced with the Morton number
$\gamma$
and g denote surface tension and gravity, respectively. One of the above two control parameters may be replaced with the Morton number $Mo = g \mu _l^4 / (\rho _l \gamma ^3) = Bo^3 / Ga^4$
, which entirely characterises the carrying liquid in a given gravitational environment. Once
$Mo = g \mu _l^4 / (\rho _l \gamma ^3) = Bo^3 / Ga^4$
, which entirely characterises the carrying liquid in a given gravitational environment. Once ${\boldsymbol{v}}(t)$
and
${\boldsymbol{v}}(t)$
and $f$
are known, the flow dynamics may be characterised by the instantaneous bubble Reynolds number
$f$
are known, the flow dynamics may be characterised by the instantaneous bubble Reynolds number $Re(t)=2\rho _l ||\boldsymbol{v}(t)|| R/{\mu _l}$
and the Strouhal number (or reduced frequency)
$Re(t)=2\rho _l ||\boldsymbol{v}(t)|| R/{\mu _l}$
and the Strouhal number (or reduced frequency) $St=2fR/V_m$
, where
$St=2fR/V_m$
, where $V_m$
denotes the time-averaged rise speed. Increasing
$V_m$
denotes the time-averaged rise speed. Increasing $Bo$
while keeping
$Bo$
while keeping $Ga$
fixed primarily increases the bubble aspect ratio,
$Ga$
fixed primarily increases the bubble aspect ratio, $\chi$
. Similarly, increasing
$\chi$
. Similarly, increasing $Ga$
with
$Ga$
with $Bo$
kept fixed primarily increases
$Bo$
kept fixed primarily increases $Re$
.
$Re$
.
In Part 1, we focused on the parameter range $10 \leqslant Ga \leqslant 30$
and
$10 \leqslant Ga \leqslant 30$
and $0.01 \leqslant Bo \leqslant 1.0$
, which yielded terminal Reynolds numbers
$0.01 \leqslant Bo \leqslant 1.0$
, which yielded terminal Reynolds numbers $25 \lesssim Re \lesssim 200$
and aspect ratios
$25 \lesssim Re \lesssim 200$
and aspect ratios $1.01 \lesssim \chi \lesssim 2.1$
. Here, we consider the more inertial range
$1.01 \lesssim \chi \lesssim 2.1$
. Here, we consider the more inertial range $30 \lt Ga \leqslant 90$
and
$30 \lt Ga \leqslant 90$
and $0.02 \leqslant Bo \leqslant 2$
in which the resulting Reynolds numbers are of
$0.02 \leqslant Bo \leqslant 2$
in which the resulting Reynolds numbers are of $\mathcal{O}(10^2)$
to
$\mathcal{O}(10^2)$
to $\mathcal{O}(10^3)$
, and the maximum aspect ratio is up to approximately
$\mathcal{O}(10^3)$
, and the maximum aspect ratio is up to approximately $2.7$
. In this parameter range, strongly deformed bubbles with
$2.7$
. In this parameter range, strongly deformed bubbles with $\chi \gtrsim 2.0$
rising in an unbounded fluid follow zigzagging or (possibly flattened) spiralling paths (Zenit & Magnaudet Reference Zenit and Magnaudet2008; Cano-Lozano et al. Reference Cano-Lozano, Martínez-Bazán, Magnaudet and Tchoufag2016). The corresponding Morton numbers range from
$\chi \gtrsim 2.0$
rising in an unbounded fluid follow zigzagging or (possibly flattened) spiralling paths (Zenit & Magnaudet Reference Zenit and Magnaudet2008; Cano-Lozano et al. Reference Cano-Lozano, Martínez-Bazán, Magnaudet and Tchoufag2016). The corresponding Morton numbers range from $1.2 \times 10^{-13}$
to
$1.2 \times 10^{-13}$
to $1.0 \times 10^{-5}$
, i.e. from Galinstan (a liquid metal) to silicone oil DMS-T11 whose kinematic viscosity is ten times that of water at
$1.0 \times 10^{-5}$
, i.e. from Galinstan (a liquid metal) to silicone oil DMS-T11 whose kinematic viscosity is ten times that of water at $20\, ^\circ$
C.
$20\, ^\circ$
C.
The results to be discussed below were obtained by solving the three-dimensional time-dependent two-phase Navier–Stokes equations using the open-source flow solver Basilisk (Popinet Reference Popinet2009, Reference Popinet2015). Characteristics of this code and conditions imposed at the various boundaries of the computational domain were discussed in Part 1 and are not duplicated here. Here, we only mention that the flow within the liquid and the bubble is determined by solving the Navier–Stokes equations using the one-fluid formulation, assuming that the interface is free of any contamination. The shape of the interface is governed by the transport equation for the volume fraction of one of the two fluids, an indicator that is also used to compute the local density and viscosity of the two-phase medium according to certain averaging rules detailed in Part 1. Readers are referred to Zhang, Ni & Magnaudet (Reference Zhang, Ni and Magnaudet2021) for details on the governing equations and numerical method, and to Part 1 for specific aspects related to grid refinement, especially in the bubble–wall gap. The computational domain is a cubic box with an edge length $L = 480R$
, twice that used in Part 1. This larger size allows us to track the bubble over a sufficiently long vertical distance to examine its behaviour under fully developed conditions. The minimum cell size,
$L = 480R$
, twice that used in Part 1. This larger size allows us to track the bubble over a sufficiently long vertical distance to examine its behaviour under fully developed conditions. The minimum cell size, $\varDelta _{min }$
, is decreased down to
$\varDelta _{min }$
, is decreased down to $\overline \varDelta _{min }\equiv \varDelta _{min }/R \approx 1/68$
close to the interface, and to
$\overline \varDelta _{min }\equiv \varDelta _{min }/R \approx 1/68$
close to the interface, and to $\overline \varDelta _{min }\equiv 1/34$
in the far wake. Following Part 1, the former minimum is further decreased down to
$\overline \varDelta _{min }\equiv 1/34$
in the far wake. Following Part 1, the former minimum is further decreased down to $\approx 1/136$
when
$\approx 1/136$
when $\overline \delta \equiv \delta /R\leqslant 0.15$
to properly resolve the flow in the gap when the bubble gets very close to the wall. The resolution in the far wake is approximately twice as fine as in Part 1, allowing us to track the details of the wake structure over distances of
$\overline \delta \equiv \delta /R\leqslant 0.15$
to properly resolve the flow in the gap when the bubble gets very close to the wall. The resolution in the far wake is approximately twice as fine as in Part 1, allowing us to track the details of the wake structure over distances of $\mathcal{O}(10R)$
downstream of the bubble. The adequacy of the grid resolution is confirmed through a grid-independence study detailed in Appendix A. Comparisons between present predictions and experimental results concerning bubbles with non-straight paths rising either in the presence (Estepa-Cantero et al. Reference Estepa-Cantero, Martínez-Bazán and Bolaños Jiménez2024) or in the absence (Duineveld Reference Duineveld1995; Tagawa, Takagi & Matsumoto Reference Tagawa, Takagi and Matsumoto2014) of a wall are also discussed in this appendix. The good agreement obtained with these experimental results confirms the reliability and accuracy of the numerical approach. However, it must be stressed that even the maximum refinement
$\mathcal{O}(10R)$
downstream of the bubble. The adequacy of the grid resolution is confirmed through a grid-independence study detailed in Appendix A. Comparisons between present predictions and experimental results concerning bubbles with non-straight paths rising either in the presence (Estepa-Cantero et al. Reference Estepa-Cantero, Martínez-Bazán and Bolaños Jiménez2024) or in the absence (Duineveld Reference Duineveld1995; Tagawa, Takagi & Matsumoto Reference Tagawa, Takagi and Matsumoto2014) of a wall are also discussed in this appendix. The good agreement obtained with these experimental results confirms the reliability and accuracy of the numerical approach. However, it must be stressed that even the maximum refinement $\overline \varDelta _{min }\equiv 1/136$
is not sufficient to properly resolve the flow in the gap when
$\overline \varDelta _{min }\equiv 1/136$
is not sufficient to properly resolve the flow in the gap when $\overline \delta (t)$
becomes extremely small. In such cases, lubrication effects in the gap are not fully captured, leading to what is referred to as a ‘bubble–wall collision’ in the next sections. It was shown in Part 1 that this under-resolution has virtually no effect on the bouncing frequency and only lowers the maximum separation achieved by the bubble after a ‘collision’ event by a few per cent.
$\overline \delta (t)$
becomes extremely small. In such cases, lubrication effects in the gap are not fully captured, leading to what is referred to as a ‘bubble–wall collision’ in the next sections. It was shown in Part 1 that this under-resolution has virtually no effect on the bouncing frequency and only lowers the maximum separation achieved by the bubble after a ‘collision’ event by a few per cent.
To roughly characterise the bubble geometry, we need to define the orientation and length $a$
of the minor axis, and the lengths
$a$
of the minor axis, and the lengths $b$
and
$b$
and $c$
of the major axes in the wall-normal and wall-parallel planes, respectively. To this end, we first consider the wall-normal plane containing the bubble centroid and identify the shortest and longest axes passing through this centroid, following Zhang et al. (Reference Zhang, Ni and Magnaudet2021). With this definition, there is in general no reason for these two axes (denoted as
$c$
of the major axes in the wall-normal and wall-parallel planes, respectively. To this end, we first consider the wall-normal plane containing the bubble centroid and identify the shortest and longest axes passing through this centroid, following Zhang et al. (Reference Zhang, Ni and Magnaudet2021). With this definition, there is in general no reason for these two axes (denoted as $x^{\prime}$
and
$x^{\prime}$
and $y^{\prime}$
in figure 1
$y^{\prime}$
in figure 1 $(b)$
, respectively) to be strictly orthogonal. The third axis, denoted as
$(b)$
, respectively) to be strictly orthogonal. The third axis, denoted as $z^{\prime}$
in the figure, is parallel to the wall and passes also through the bubble centroid. Nevertheless, the maximum horizontal extension of the bubble in planes parallel to the wall may not lie along this axis if the bubble exhibits asymmetries. To better approach this maximum extension, we identify the length
$z^{\prime}$
in the figure, is parallel to the wall and passes also through the bubble centroid. Nevertheless, the maximum horizontal extension of the bubble in planes parallel to the wall may not lie along this axis if the bubble exhibits asymmetries. To better approach this maximum extension, we identify the length $c$
as that of the longest horizontal segment connecting two points of the bubble surface and lying in the wall-parallel plane passing through the centroid. We are then in position to compute the principal aspect ratio
$c$
as that of the longest horizontal segment connecting two points of the bubble surface and lying in the wall-parallel plane passing through the centroid. We are then in position to compute the principal aspect ratio $\chi=b/a$
, and the equatorial axes ratio,
$\chi=b/a$
, and the equatorial axes ratio, ${\chi_{eq}}=b/c$
. In order to obtain a global characterisation of the fluid motion at the interface, we also introduce the interface spinning rate, following a suggestion of Rastello et al. (Reference Rastello, Marié, Grosjean and Lance2009). Based on the velocity of all fluid elements at the interface, we define this spinning rate,
${\chi_{eq}}=b/c$
. In order to obtain a global characterisation of the fluid motion at the interface, we also introduce the interface spinning rate, following a suggestion of Rastello et al. (Reference Rastello, Marié, Grosjean and Lance2009). Based on the velocity of all fluid elements at the interface, we define this spinning rate, $\boldsymbol{\Omega }$
, as
$\boldsymbol{\Omega }$
, as
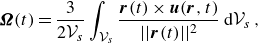 \begin{equation} \boldsymbol{\Omega }(t) = \frac {3}{2\mathcal{V}_s}\int _{\mathcal{V}_s} \frac {\boldsymbol{r}(t) \times \boldsymbol{u}(\boldsymbol{r},t)}{||\boldsymbol{r}(t)||^2}\,\text{d} \mathcal{V}_s\,, \end{equation}
where $\mathcal{V}_s$
is the volume of the thin film made of the computational cells straddling the gas–liquid interface, i.e. those in which the gas and the liquid are both present, and
$\mathcal{V}_s$
is the volume of the thin film made of the computational cells straddling the gas–liquid interface, i.e. those in which the gas and the liquid are both present, and $\boldsymbol{r}(t)=\mathbf{x} - \mathbf{x}_b(t)$
is the position vector with respect to the bubble centroid. Taking advantage of the geometric volume of fluid method employed in Basilisk, the above estimate for the spinning rate may be refined by weighting the integrand in (2.2) by the interfacial area enclosed in each interfacial cell rather than by the cell volume. Tests conducted using this refined definition revealed virtually no difference in the estimated spinning rate in two different regimes, indicating that the definition (2.2) is accurate over the range of parameters considered in this study. The definition (2.2) may be shown to yield the exact spinning rate of a sphere undergoing a rigid-body rotation about one of its diameters. However, bubbles deform over time and the carrying fluid obeys a shear-free condition at their surface, making the angular dynamics of bubbles very different from that of usual rigid bodies surrounded by a fluid obeying a no-slip condition. This is why the term ‘spinning rate’ must not be misunderstood, as a bubble with
$\boldsymbol{r}(t)=\mathbf{x} - \mathbf{x}_b(t)$
is the position vector with respect to the bubble centroid. Taking advantage of the geometric volume of fluid method employed in Basilisk, the above estimate for the spinning rate may be refined by weighting the integrand in (2.2) by the interfacial area enclosed in each interfacial cell rather than by the cell volume. Tests conducted using this refined definition revealed virtually no difference in the estimated spinning rate in two different regimes, indicating that the definition (2.2) is accurate over the range of parameters considered in this study. The definition (2.2) may be shown to yield the exact spinning rate of a sphere undergoing a rigid-body rotation about one of its diameters. However, bubbles deform over time and the carrying fluid obeys a shear-free condition at their surface, making the angular dynamics of bubbles very different from that of usual rigid bodies surrounded by a fluid obeying a no-slip condition. This is why the term ‘spinning rate’ must not be misunderstood, as a bubble with $ \boldsymbol{\Omega }\neq \textbf {0}$
may not rotate as a whole. Therefore, in general,
$ \boldsymbol{\Omega }\neq \textbf {0}$
may not rotate as a whole. Therefore, in general, $\boldsymbol{\Omega }$
must only be regarded as a three-dimensional measure of the average fluid rotation over the bubble surface.
$\boldsymbol{\Omega }$
must only be regarded as a three-dimensional measure of the average fluid rotation over the bubble surface.
In the following sections, we make extensive use of dimensionless quantities to describe the flow field and bubble motion. To this end, all variables are normalised using $R$
and
$R$
and $\sqrt {R/g}$
as characteristic length and time scales, respectively. The dimensionless time and local position are denoted as
$\sqrt {R/g}$
as characteristic length and time scales, respectively. The dimensionless time and local position are denoted as $T$
and
$T$
and ${\textbf {X}}=(X,Y,Z)$
, respectively, while the dimensionless frequency and position of the bubble centroid are
${\textbf {X}}=(X,Y,Z)$
, respectively, while the dimensionless frequency and position of the bubble centroid are $\overline {f}$
and
$\overline {f}$
and ${\textbf {X}}_b=(X_b,Y_b,Z_b)$
, respectively. Similarly, in the
${\textbf {X}}_b=(X_b,Y_b,Z_b)$
, respectively. Similarly, in the $({\textbf {e}}_x,{\textbf {e}}_y, {\textbf {e}}_z)$
-basis, the
$({\textbf {e}}_x,{\textbf {e}}_y, {\textbf {e}}_z)$
-basis, the $i$
th component of the dimensionless bubble velocity, spinning rate, fluid velocity and vorticity are denoted as
$i$
th component of the dimensionless bubble velocity, spinning rate, fluid velocity and vorticity are denoted as $V_i$
,
$V_i$
, $\overline \Omega _i$
,
$\overline \Omega _i$
, $U_i$
and
$U_i$
and $\overline \omega _i$
, respectively.
$\overline \omega _i$
, respectively.
3. Overview of the results
Figure 2( $a$
) summarises in the form of a phase diagram in the
$a$
) summarises in the form of a phase diagram in the $(Bo, Ga)$
plane the various types of near-wall motion observed in the simulations; results for
$(Bo, Ga)$
plane the various types of near-wall motion observed in the simulations; results for $Ga = 30$
were taken from Part 1. The solid line crossing the phase diagram corresponds to the neutral curve (reproduced from Bonnefis et al. Reference Bonnefis, Sierra-Ausin, Fabre and Magnaudet2024), beyond which the bubble path becomes unstable when the fluid domain is unbounded. Figure 3 is the equivalent of figure 2(
$Ga = 30$
were taken from Part 1. The solid line crossing the phase diagram corresponds to the neutral curve (reproduced from Bonnefis et al. Reference Bonnefis, Sierra-Ausin, Fabre and Magnaudet2024), beyond which the bubble path becomes unstable when the fluid domain is unbounded. Figure 3 is the equivalent of figure 2( $a$
) in the
$a$
) in the $(\chi, Re)$
-plane.
$(\chi, Re)$
-plane.

Figure 2. Styles of paths observed in the simulations. ( $a$
) Phase diagram in the (
$a$
) Phase diagram in the ( $Bo, Ga$
)-plane; (
$Bo, Ga$
)-plane; ( $b{-}d$
) typical trajectories illustrating the bouncing–tumbling–escaping (BTE) scenario at
$b{-}d$
) typical trajectories illustrating the bouncing–tumbling–escaping (BTE) scenario at $(Bo, Ga)=(0.05, 70)$
, the near-wall zigzagging (NWZ) motion with (solid line,
$(Bo, Ga)=(0.05, 70)$
, the near-wall zigzagging (NWZ) motion with (solid line, $(Bo, Ga)=(0.25, 90)$
) and without (dashed line,
$(Bo, Ga)=(0.25, 90)$
) and without (dashed line, $(Bo, Ga)=(1, 70)$
) bubble–wall collisions and the wavy migration away (WMA) scenario with a planar zigzagging path (
$(Bo, Ga)=(1, 70)$
) bubble–wall collisions and the wavy migration away (WMA) scenario with a planar zigzagging path ( $(Bo, Ga)=(0.2, 70)$
, solid line;
$(Bo, Ga)=(0.2, 70)$
, solid line; $(Bo, Ga)=(1.5, 50)$
, dashed line), respectively. Solid line in (
$(Bo, Ga)=(1.5, 50)$
, dashed line), respectively. Solid line in ( $a$
) is neutral curve corresponding to the onset of path instability in an unbounded fluid (Bonnefis et al. Reference Bonnefis, Sierra-Ausin, Fabre and Magnaudet2024); dashed lines: iso-
$a$
) is neutral curve corresponding to the onset of path instability in an unbounded fluid (Bonnefis et al. Reference Bonnefis, Sierra-Ausin, Fabre and Magnaudet2024); dashed lines: iso- $Mo$
lines for different liquids (see table 1 in Part 1 for their physical characteristics). Open symbols, identified with codes
$Mo$
lines for different liquids (see table 1 in Part 1 for their physical characteristics). Open symbols, identified with codes $(1)$
–
$(1)$
– $(5)$
, denote cases in which bubbles do not undergo a path instability, with
$(5)$
, denote cases in which bubbles do not undergo a path instability, with $(1)$
and
$(1)$
and $(2)$
periodic near-wall bouncing with and without bubble–wall collisions, respectively;
$(2)$
periodic near-wall bouncing with and without bubble–wall collisions, respectively; $(3)$
damped bouncing;
$(3)$
damped bouncing; $(4)$
migration away from the wall;
$(4)$
migration away from the wall; $(5)$
BTE. Solid symbols, identified with codes
$(5)$
BTE. Solid symbols, identified with codes $(6)$
–
$(6)$
– $(9)$
, denote scenarios observed in the presence of path instability, with
$(9)$
, denote scenarios observed in the presence of path instability, with $(6)$
and
$(6)$
and $(7)$
NWZ with and without bubble-wall collisions, respectively;
$(7)$
NWZ with and without bubble-wall collisions, respectively; $(8)$
and
$(8)$
and $(9)$
WMA with a planar zigzagging and a (possibly flattened) spiralling path, respectively. Data at
$(9)$
WMA with a planar zigzagging and a (possibly flattened) spiralling path, respectively. Data at $Ga\approx 76$
,
$Ga\approx 76$
, $Ga\approx 87$
and
$Ga\approx 87$
and $Ga\geqslant 94$
in water are taken from experiments by de Vries (Reference de Vries2001), while those identified with symbols
$Ga\geqslant 94$
in water are taken from experiments by de Vries (Reference de Vries2001), while those identified with symbols $(10)$
(silicone oil DMS-T05 at
$(10)$
(silicone oil DMS-T05 at $Ga=35$
), and
$Ga=35$
), and $(11)$
(water–glycerol mixture at
$(11)$
(water–glycerol mixture at $Ga\approx 38$
) are taken from those of Estepa-Cantero et al. (Reference Estepa-Cantero, Martínez-Bazán and Bolaños Jiménez2024).
$Ga\approx 38$
) are taken from those of Estepa-Cantero et al. (Reference Estepa-Cantero, Martínez-Bazán and Bolaños Jiménez2024).
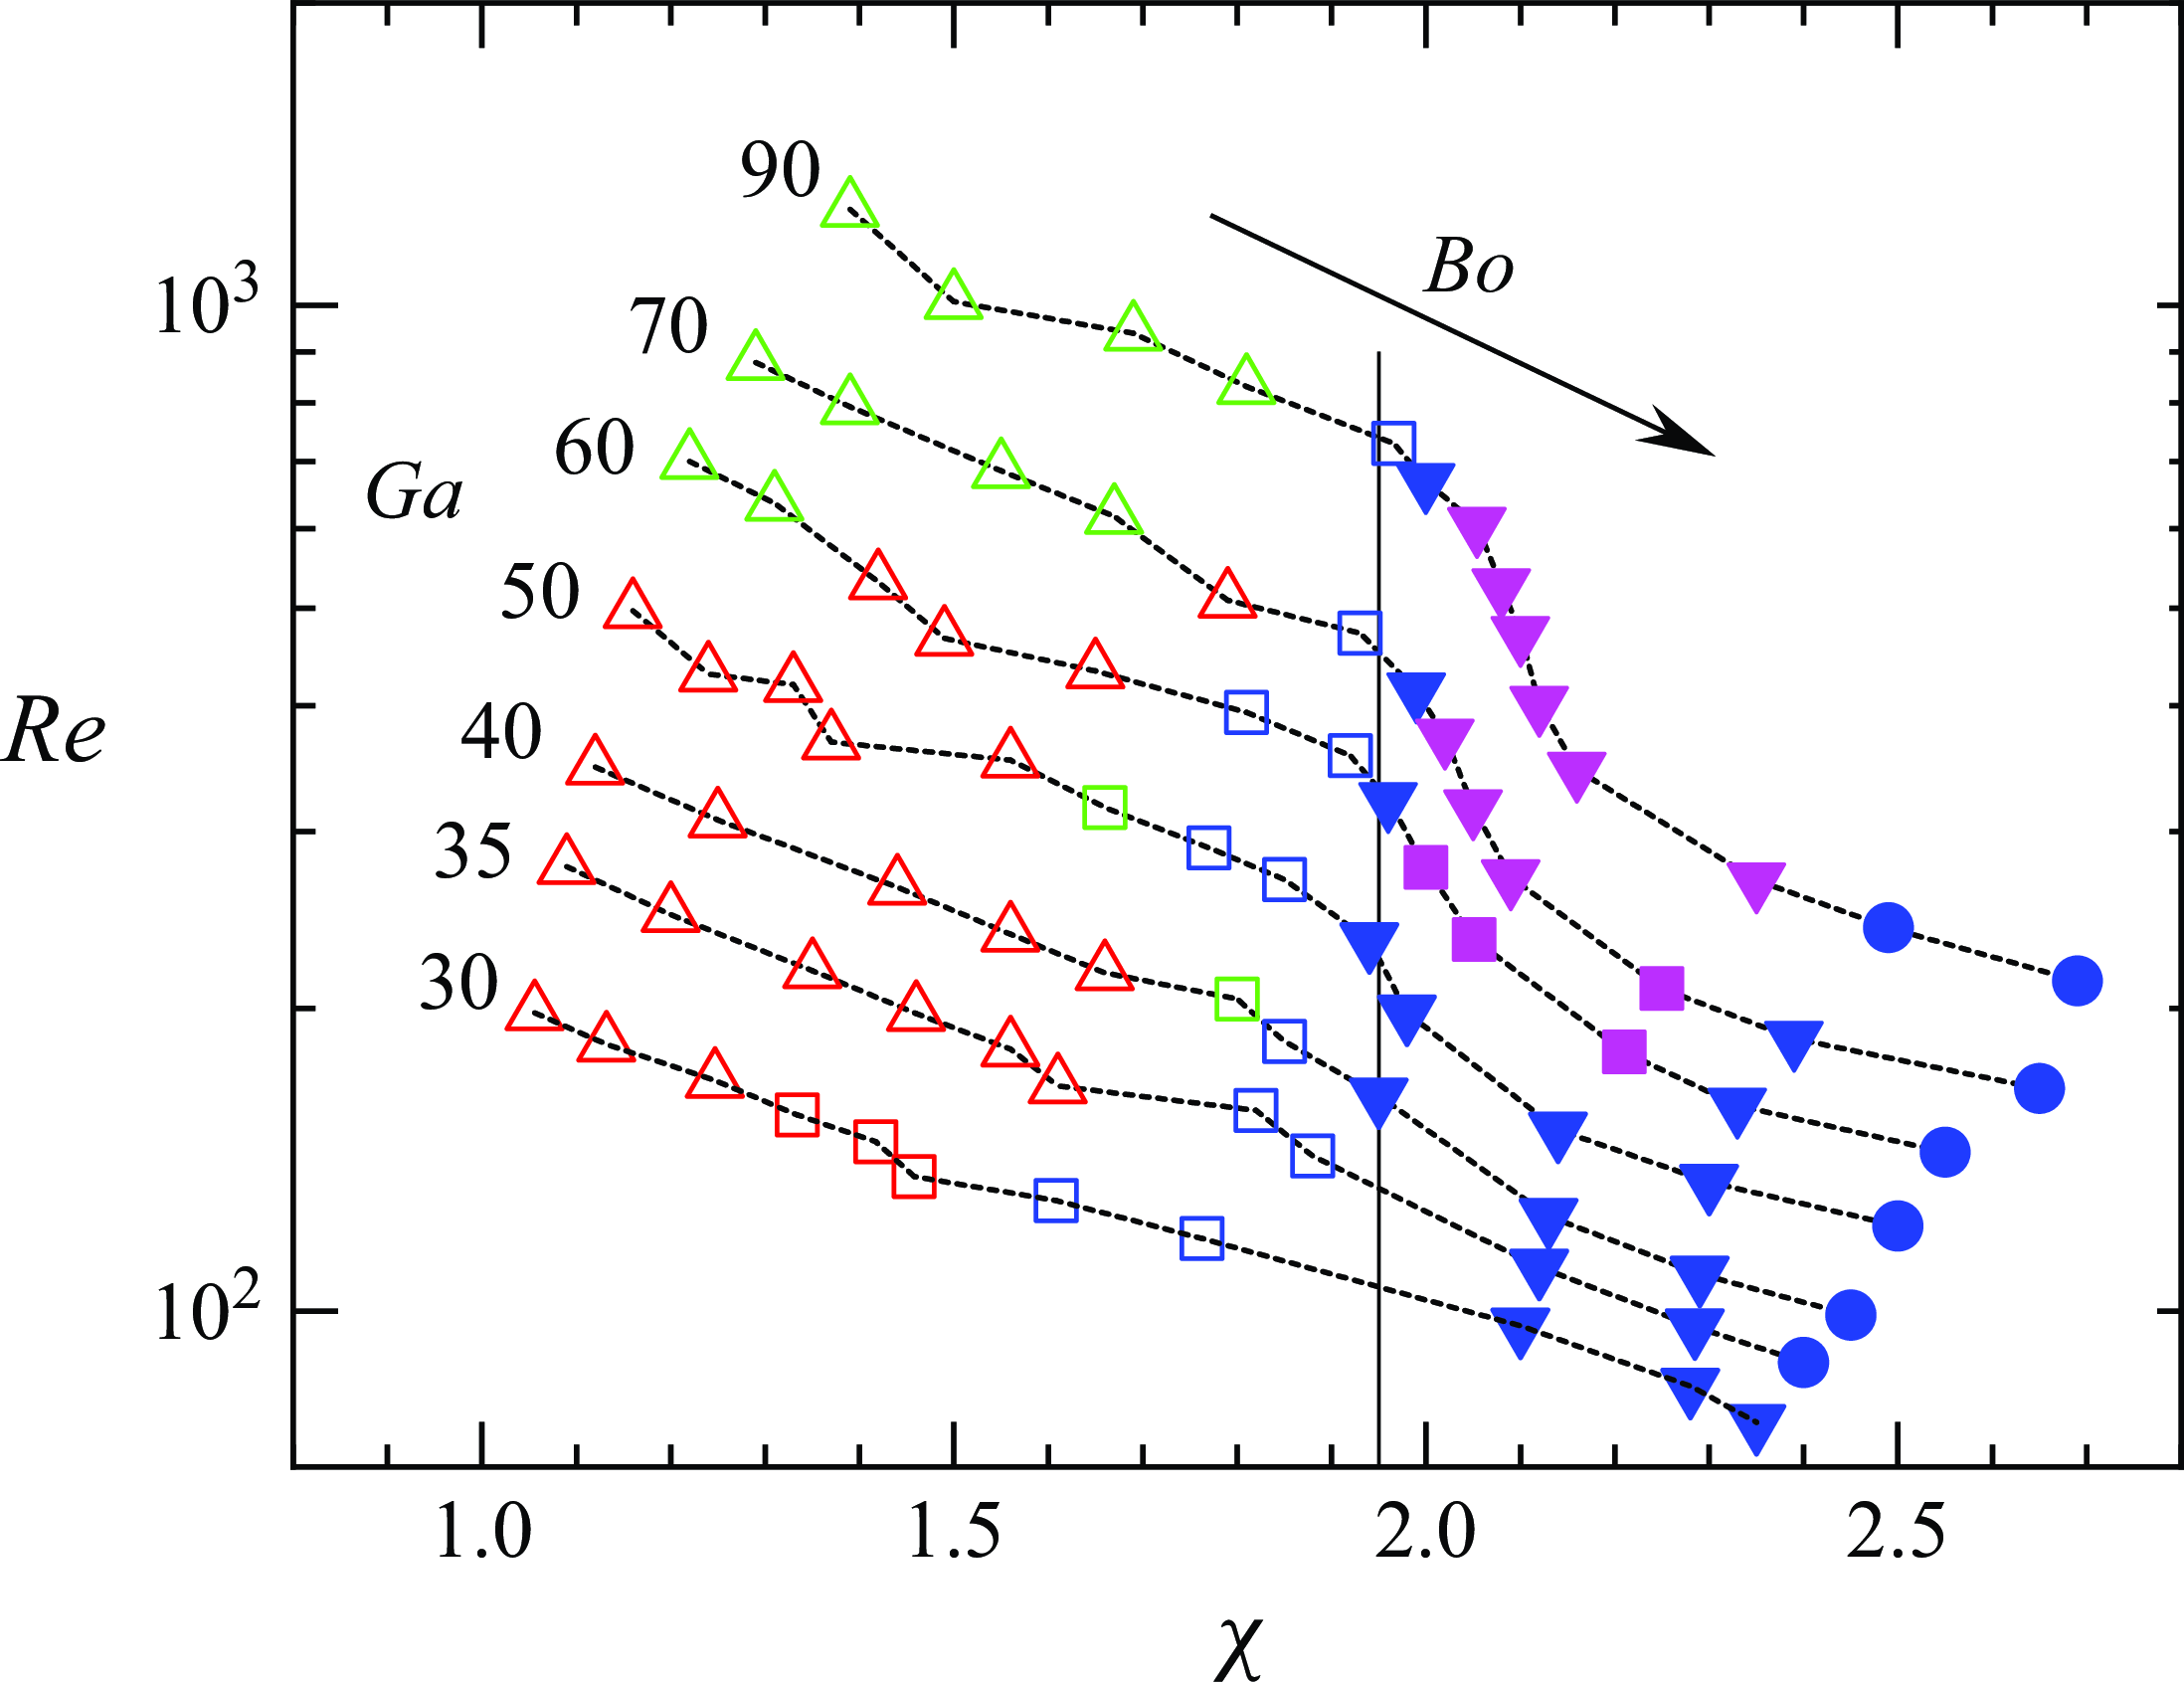
Figure 3. Styles of paths in the ( $\chi, Re$
)-plane. For caption, see figure 2. Vertical line:
$\chi, Re$
)-plane. For caption, see figure 2. Vertical line: $\chi=1.95$
; thin dashed lines: iso-
$\chi=1.95$
; thin dashed lines: iso- $Ga$
curves, with
$Ga$
curves, with $Ga$
increasing from
$Ga$
increasing from $30$
to
$30$
to $90$
from bottom to top and
$90$
from bottom to top and $Bo$
increasing from
$Bo$
increasing from $0.02$
to
$0.02$
to $2$
from left to right on each iso-
$2$
from left to right on each iso- $Ga$
curve. For cases below the neutral curve, values of
$Ga$
curve. For cases below the neutral curve, values of $Re$
and
$Re$
and $\chi$
are based on final conditions, except in cases with near-wall oscillations, for which average values taken over a single period are used. For cases beyond the neutral curve, values of
$\chi$
are based on final conditions, except in cases with near-wall oscillations, for which average values taken over a single period are used. For cases beyond the neutral curve, values of $Re$
and
$Re$
and $\chi$
correspond to averages taken over one period of the zigzagging or spiralling path in an unbounded fluid.
$\chi$
correspond to averages taken over one period of the zigzagging or spiralling path in an unbounded fluid.
3.1. Below the neutral curve
We first review the behaviours observed under conditions where the bubble would rise in a straight line in an unbounded fluid, which correspond to cases located below the neutral curve in figure 2( $a$
). Up to
$a$
). Up to $Ga = 50$
, the three types of motion already analysed in Part 1 are observed. Specifically, periodic near-wall bouncing takes place at low
$Ga = 50$
, the three types of motion already analysed in Part 1 are observed. Specifically, periodic near-wall bouncing takes place at low $Bo$
, while a regular migration away from the wall is observed at large
$Bo$
, while a regular migration away from the wall is observed at large $Bo$
, with, occasionally, damped bouncing motions in between. As discussed in Part 1, the mechanisms governing the transition between these three styles of path result from the competition between the irrotational and vortical interaction mechanisms. A new type of motion occurs for
$Bo$
, with, occasionally, damped bouncing motions in between. As discussed in Part 1, the mechanisms governing the transition between these three styles of path result from the competition between the irrotational and vortical interaction mechanisms. A new type of motion occurs for $Ga \geqslant 60$
, in which the bubble manages to escape the near-wall region after one or two bounces. Figure 2(
$Ga \geqslant 60$
, in which the bubble manages to escape the near-wall region after one or two bounces. Figure 2( $b$
) shows a typical path corresponding to this scenario. After two bounces, the bubble briefly migrates towards the wall (as highlighted in the inset of panel
$b$
) shows a typical path corresponding to this scenario. After two bounces, the bubble briefly migrates towards the wall (as highlighted in the inset of panel $b$
), then quickly departs from it, eventually reaching a wall-normal position
$b$
), then quickly departs from it, eventually reaching a wall-normal position $X_b \approx 6.7$
at a vertical position
$X_b \approx 6.7$
at a vertical position $Y_b \approx 200$
. Afterwards, the bubble almost rests at this wall-normal position, its wall-normal velocity exhibiting only minute values. This is because the disturbance induced by a bubble moving at
$Y_b \approx 200$
. Afterwards, the bubble almost rests at this wall-normal position, its wall-normal velocity exhibiting only minute values. This is because the disturbance induced by a bubble moving at $Re = \mathcal{O}(100)$
decays essentially as the inverse of the cube of the distance to its centroid, following the prediction of potential flow theory. Hence, the presence of the wall is only weakly ‘felt’ by the bubble in the late stages of its ascent, so that it rises almost vertically as in an unbounded fluid. This path evolution differs from that observed in the damped bouncing regime, where the bubble remains close to the wall throughout its ascent and finally rests at a wall-normal position where the total transverse force vanishes.
$Re = \mathcal{O}(100)$
decays essentially as the inverse of the cube of the distance to its centroid, following the prediction of potential flow theory. Hence, the presence of the wall is only weakly ‘felt’ by the bubble in the late stages of its ascent, so that it rises almost vertically as in an unbounded fluid. This path evolution differs from that observed in the damped bouncing regime, where the bubble remains close to the wall throughout its ascent and finally rests at a wall-normal position where the total transverse force vanishes.
This escape scenario specific to highly inertial regimes, particularly the brief wall-ward migration preceding the escape, was observed experimentally in water by de Vries et al. (Reference de Vries, Biesheuvel and van Wijngaarden2002) (see figure 5 therein) with an air bubble corresponding to $(Bo, Ga) \approx (0.095, 75.5)$
. According to figure 2
$(Bo, Ga) \approx (0.095, 75.5)$
. According to figure 2 $(a)$
, this scenario only occurs for nearly spherical bubbles at
$(a)$
, this scenario only occurs for nearly spherical bubbles at $Ga = 60$
, but quickly dominates the entire region
$Ga = 60$
, but quickly dominates the entire region $Bo \lt 0.1$
when
$Bo \lt 0.1$
when $Ga$
is increased beyond. Figure 3 makes it clear that this scenario is encountered for
$Ga$
is increased beyond. Figure 3 makes it clear that this scenario is encountered for $Re \gtrsim 600$
and
$Re \gtrsim 600$
and $\chi \lesssim 1.85$
. The underlying mechanisms will be discussed in § 4. Here, we just point out that, prior to the escape, a strong vortical layer forms in the vicinity of the bubble surface upon its collision with the wall, causing the
$\chi \lesssim 1.85$
. The underlying mechanisms will be discussed in § 4. Here, we just point out that, prior to the escape, a strong vortical layer forms in the vicinity of the bubble surface upon its collision with the wall, causing the $z$
-component of the spinning rate,
$z$
-component of the spinning rate, $\overline \Omega _z$
, to take large values. This spinning motion yields a sizeable Magnus-like force pointing away from the wall, which promotes the bubble escape. In what follows, we refer to this type of path evolution as the bouncing–tumbling–escaping (BTE) scenario.
$\overline \Omega _z$
, to take large values. This spinning motion yields a sizeable Magnus-like force pointing away from the wall, which promotes the bubble escape. In what follows, we refer to this type of path evolution as the bouncing–tumbling–escaping (BTE) scenario.
To illustrate the influence of the Reynolds number on the style of path, we select a series of results obtained at two specific values of the bubble aspect ratio, $\chi=1.4$
and
$\chi=1.4$
and $\chi=1.8$
. Figure 4 shows the variations of the wall-normal velocity,
$\chi=1.8$
. Figure 4 shows the variations of the wall-normal velocity, $V_x(T)$
, with the lateral position,
$V_x(T)$
, with the lateral position, $X_b(T)$
, as
$X_b(T)$
, as $Re$
increases by one order of magnitude, from values of
$Re$
increases by one order of magnitude, from values of $\mathcal{O}(10^2)$
to
$\mathcal{O}(10^2)$
to $\mathcal{O}(10^3)$
. For
$\mathcal{O}(10^3)$
. For $\chi \approx 1.8$
, the bubble migrates away from the wall at
$\chi \approx 1.8$
, the bubble migrates away from the wall at $Re = 158$
, experiences damped near-wall oscillations at
$Re = 158$
, experiences damped near-wall oscillations at $Re = 204$
and bounces periodically on the wall at
$Re = 204$
and bounces periodically on the wall at $Re = 509$
. In these two bouncing cases, the maximum lateral separation between the bubble and wall increases from
$Re = 509$
. In these two bouncing cases, the maximum lateral separation between the bubble and wall increases from $3$
to
$3$
to $4$
as
$4$
as $Re$
increases. At
$Re$
increases. At $Re = 792$
, the bubble manages to reach a lateral position
$Re = 792$
, the bubble manages to reach a lateral position $X_c = 6.3$
, where it rests. The brief wall-ward migration taking place before the escape corresponds to the short period of time when
$X_c = 6.3$
, where it rests. The brief wall-ward migration taking place before the escape corresponds to the short period of time when $V_x(T) \lt 0$
in the loop formed by the corresponding curve. For
$V_x(T) \lt 0$
in the loop formed by the corresponding curve. For $\chi = 1.4$
, the bubble already experiences periodic near-wall bounces at
$\chi = 1.4$
, the bubble already experiences periodic near-wall bounces at $Ga = 35$
, corresponding to
$Ga = 35$
, corresponding to $Re = 218$
. At
$Re = 218$
. At $Re = 531$
, while it still undergoes regular bouncing, its lateral motion weakly reverses during the departing stage. The maximum lateral position is
$Re = 531$
, while it still undergoes regular bouncing, its lateral motion weakly reverses during the departing stage. The maximum lateral position is $X_b=5.3$
, and this large separation results in a very slow bouncing frequency,
$X_b=5.3$
, and this large separation results in a very slow bouncing frequency, $St = 0.0055$
. As
$St = 0.0055$
. As $Re$
increases further, the bubble escapes from the wall, resting eventually at a lateral position
$Re$
increases further, the bubble escapes from the wall, resting eventually at a lateral position $X_c = 7.3$
at
$X_c = 7.3$
at $Re = 793$
and
$Re = 793$
and $X_c=8.8$
at
$X_c=8.8$
at $Re = 1247$
.
$Re = 1247$
.
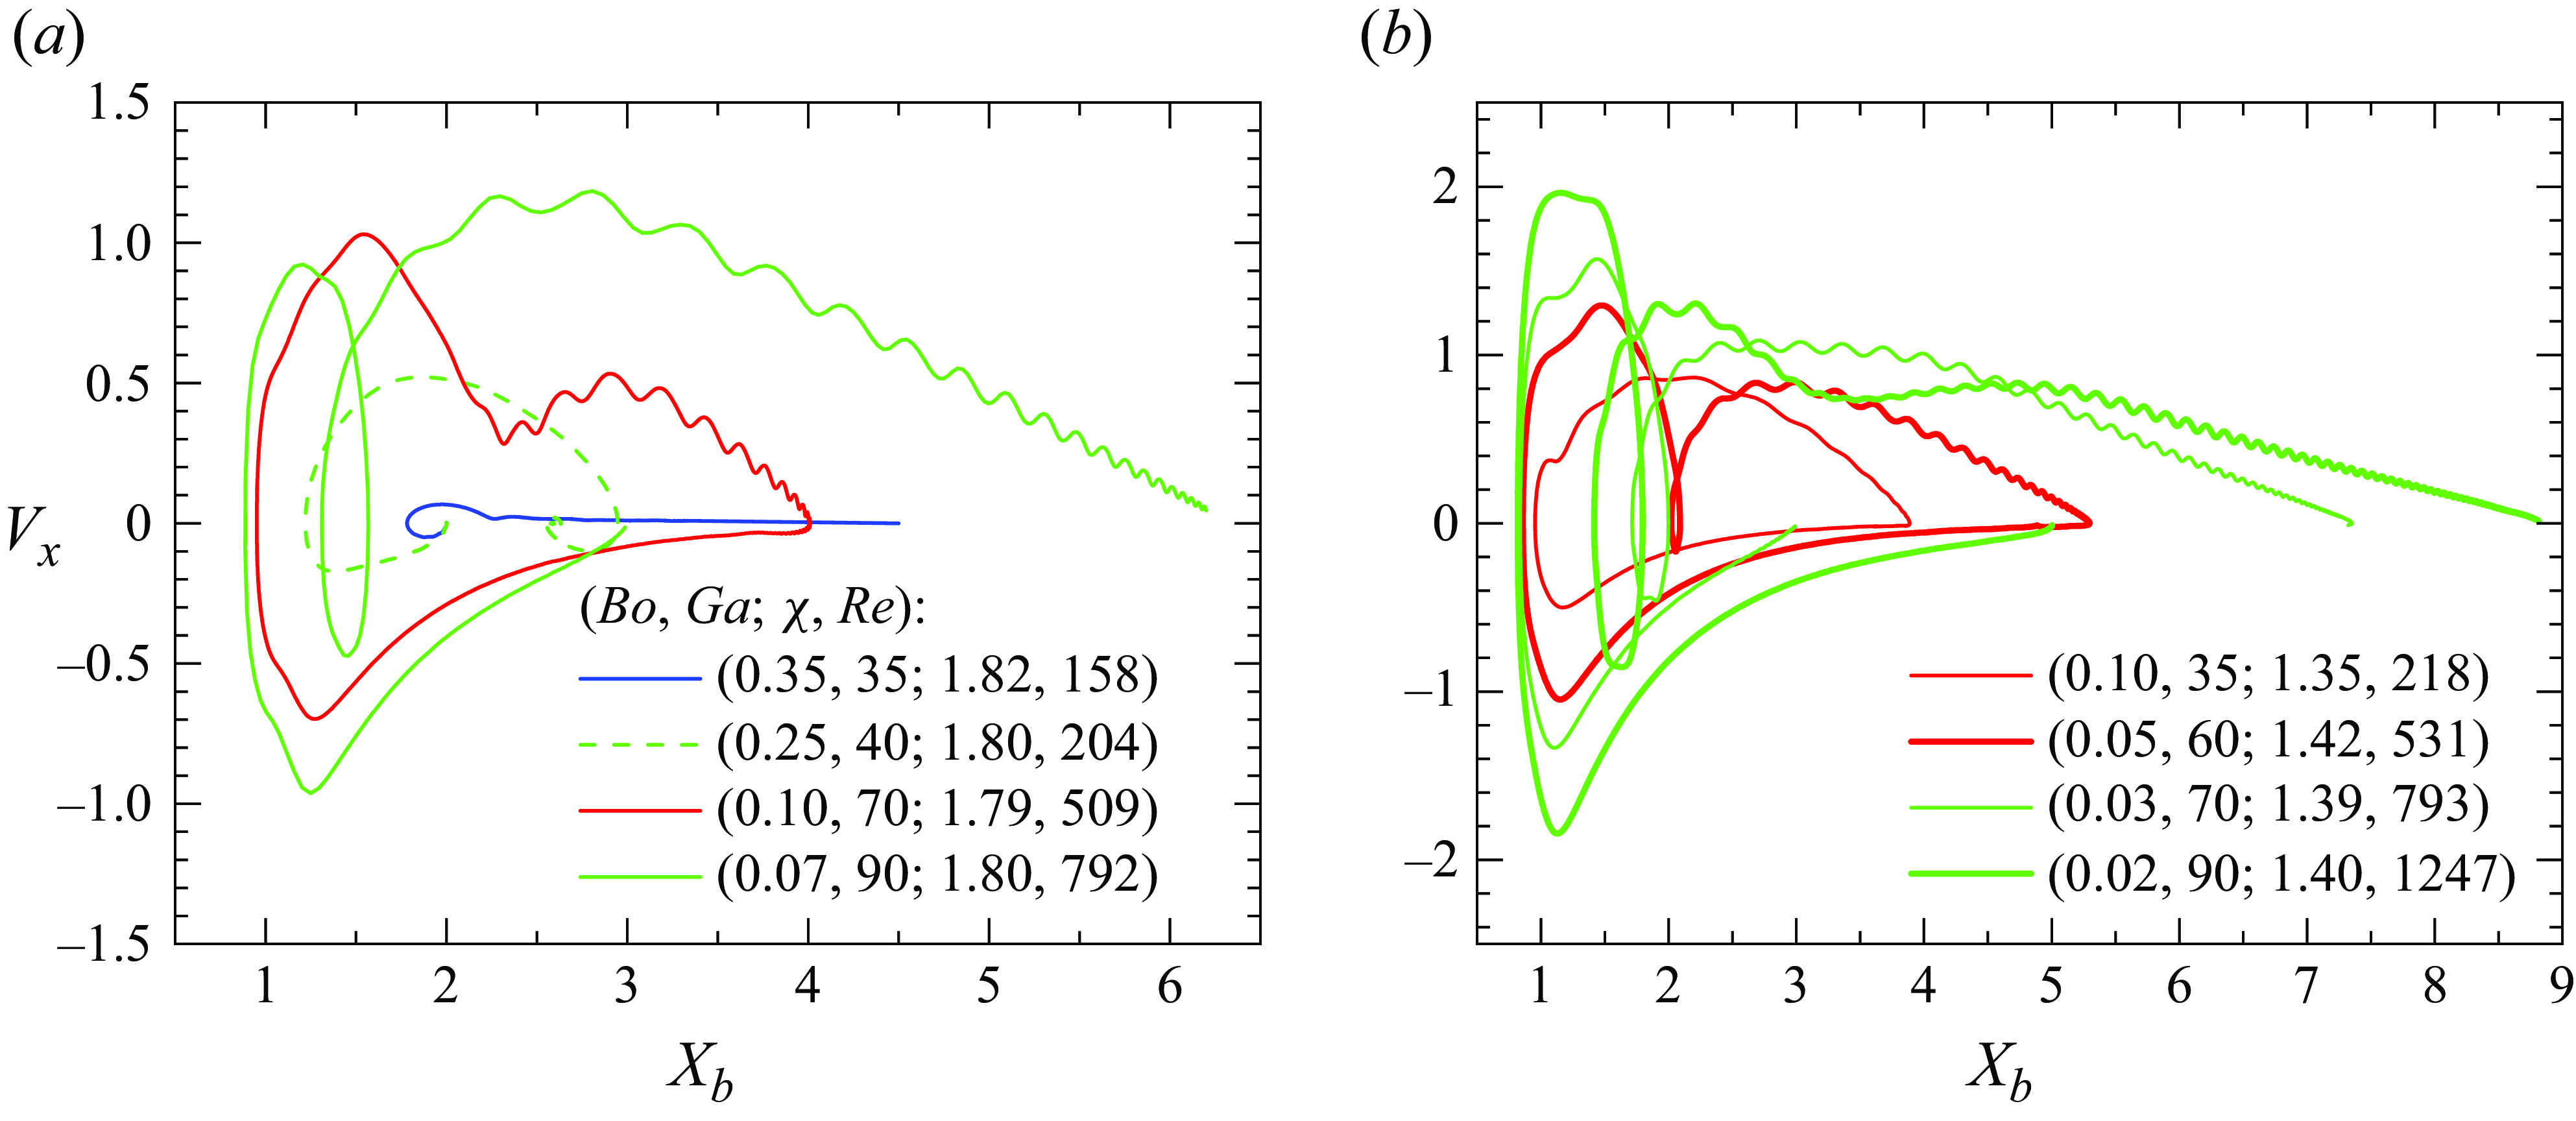
Figure 4. Variations of the bubble wall-normal velocity, $V_x$
, as a function of the bubble–wall distance,
$V_x$
, as a function of the bubble–wall distance, $X_b$
, for selected cases at (
$X_b$
, for selected cases at ( $a$
)
$a$
) $\chi \approx 1.8$
, and (
$\chi \approx 1.8$
, and ( $b$
)
$b$
) $\chi \approx 1.4$
. The corresponding values of
$\chi \approx 1.4$
. The corresponding values of $Bo$
,
$Bo$
, $Ga$
and the resulting
$Ga$
and the resulting $Re$
are indicated in each panel. The initial position is set as
$Re$
are indicated in each panel. The initial position is set as $(X_0, V_x) = (2, 0)$
. In periodic bouncing cases (red lines), only the variation during the fully developed stage is shown. In BTE cases (solid green lines), only variations during the last cycle of motion, starting at a time when the bubble begins to migrate towards the wall, are shown.
$(X_0, V_x) = (2, 0)$
. In periodic bouncing cases (red lines), only the variation during the fully developed stage is shown. In BTE cases (solid green lines), only variations during the last cycle of motion, starting at a time when the bubble begins to migrate towards the wall, are shown.
Figure 4 also allows the effects of the aspect ratio to be appreciated. First, it is seen that, in the two cases with $Re$
close to
$Re$
close to $200$
, the less deformed bubble experiences periodic bounces, while that with
$200$
, the less deformed bubble experiences periodic bounces, while that with $\chi=1.80$
follows a damped bouncing evolution. In the two cases with
$\chi=1.80$
follows a damped bouncing evolution. In the two cases with $Re$
close to 500, both bubbles undergo regular bouncing but their maximum lateral position reduces from 5.3 at
$Re$
close to 500, both bubbles undergo regular bouncing but their maximum lateral position reduces from 5.3 at $\chi = 1.42$
to
$\chi = 1.42$
to $4.0$
at
$4.0$
at $\chi = 1.79$
. Accordingly, the reduced frequency increases from
$\chi = 1.79$
. Accordingly, the reduced frequency increases from $0.0055$
at
$0.0055$
at $\chi = 1.42$
to
$\chi = 1.42$
to $0.013$
at
$0.013$
at $\chi = 1.79$
. Last, when
$\chi = 1.79$
. Last, when $Re \approx 790$
, both bubbles manage to escape from the near-wall region and their final wall-normal position also decreases as
$Re \approx 790$
, both bubbles manage to escape from the near-wall region and their final wall-normal position also decreases as $\chi$
increases.
$\chi$
increases.
3.2. Beyond the neutral curve
In figure 3, bubbles with an aspect ratio larger than $\approx 1.95$
are found to follow zigzagging or spiralling paths, consistent with the experimental observations of Zenit & Magnaudet (Reference Zenit and Magnaudet2008). Similarly, in figure 2
$\approx 1.95$
are found to follow zigzagging or spiralling paths, consistent with the experimental observations of Zenit & Magnaudet (Reference Zenit and Magnaudet2008). Similarly, in figure 2 $(a)$
, path instability is seen to take place for all
$(a)$
, path instability is seen to take place for all $(Bo, Ga)$
sets located beyond the neutral curve determined for bubbles rising in an unbounded fluid. This observation suggests that the presence of the wall plays no role in the occurrence of path instability. However, in its early stage, it selects the orientation of the plane in which the bubble oscillates, making path instability arise through an imperfect bifurcation. Up to
$(Bo, Ga)$
sets located beyond the neutral curve determined for bubbles rising in an unbounded fluid. This observation suggests that the presence of the wall plays no role in the occurrence of path instability. However, in its early stage, it selects the orientation of the plane in which the bubble oscillates, making path instability arise through an imperfect bifurcation. Up to $Ga=50$
, all bubbles experiencing path instability migrate away from the wall. We refer to this type of motion as the wavy migration away (WMA) scenario. In this regime, bubbles maintain a zigzagging path in the wall-normal plane up to
$Ga=50$
, all bubbles experiencing path instability migrate away from the wall. We refer to this type of motion as the wavy migration away (WMA) scenario. In this regime, bubbles maintain a zigzagging path in the wall-normal plane up to $Bo \approx 1.5$
(see the examples in figure 2
$Bo \approx 1.5$
(see the examples in figure 2 $d$
). Then, this path transitions to a spiralling motion at larger Bond numbers. Bubbles following the WMA scenario were observed experimentally by Estepa-Cantero et al. (Reference Estepa-Cantero, Martínez-Bazán and Bolaños Jiménez2024). The corresponding data, shown in figure 2
$d$
). Then, this path transitions to a spiralling motion at larger Bond numbers. Bubbles following the WMA scenario were observed experimentally by Estepa-Cantero et al. (Reference Estepa-Cantero, Martínez-Bazán and Bolaños Jiménez2024). The corresponding data, shown in figure 2 $(a)$
, corroborate the present findings. For
$(a)$
, corroborate the present findings. For $Ga\gt 50$
, the same scenario is encountered both for
$Ga\gt 50$
, the same scenario is encountered both for $Bo \gt 1$
and within a narrow band of significantly lower Bond numbers lying just above the neutral curve, e.g.
$Bo \gt 1$
and within a narrow band of significantly lower Bond numbers lying just above the neutral curve, e.g. $Bo\approx 0.2$
for
$Bo\approx 0.2$
for $Ga=70$
and
$Ga=70$
and $Bo\approx 0.12$
for
$Bo\approx 0.12$
for $Ga=90$
.
$Ga=90$
.
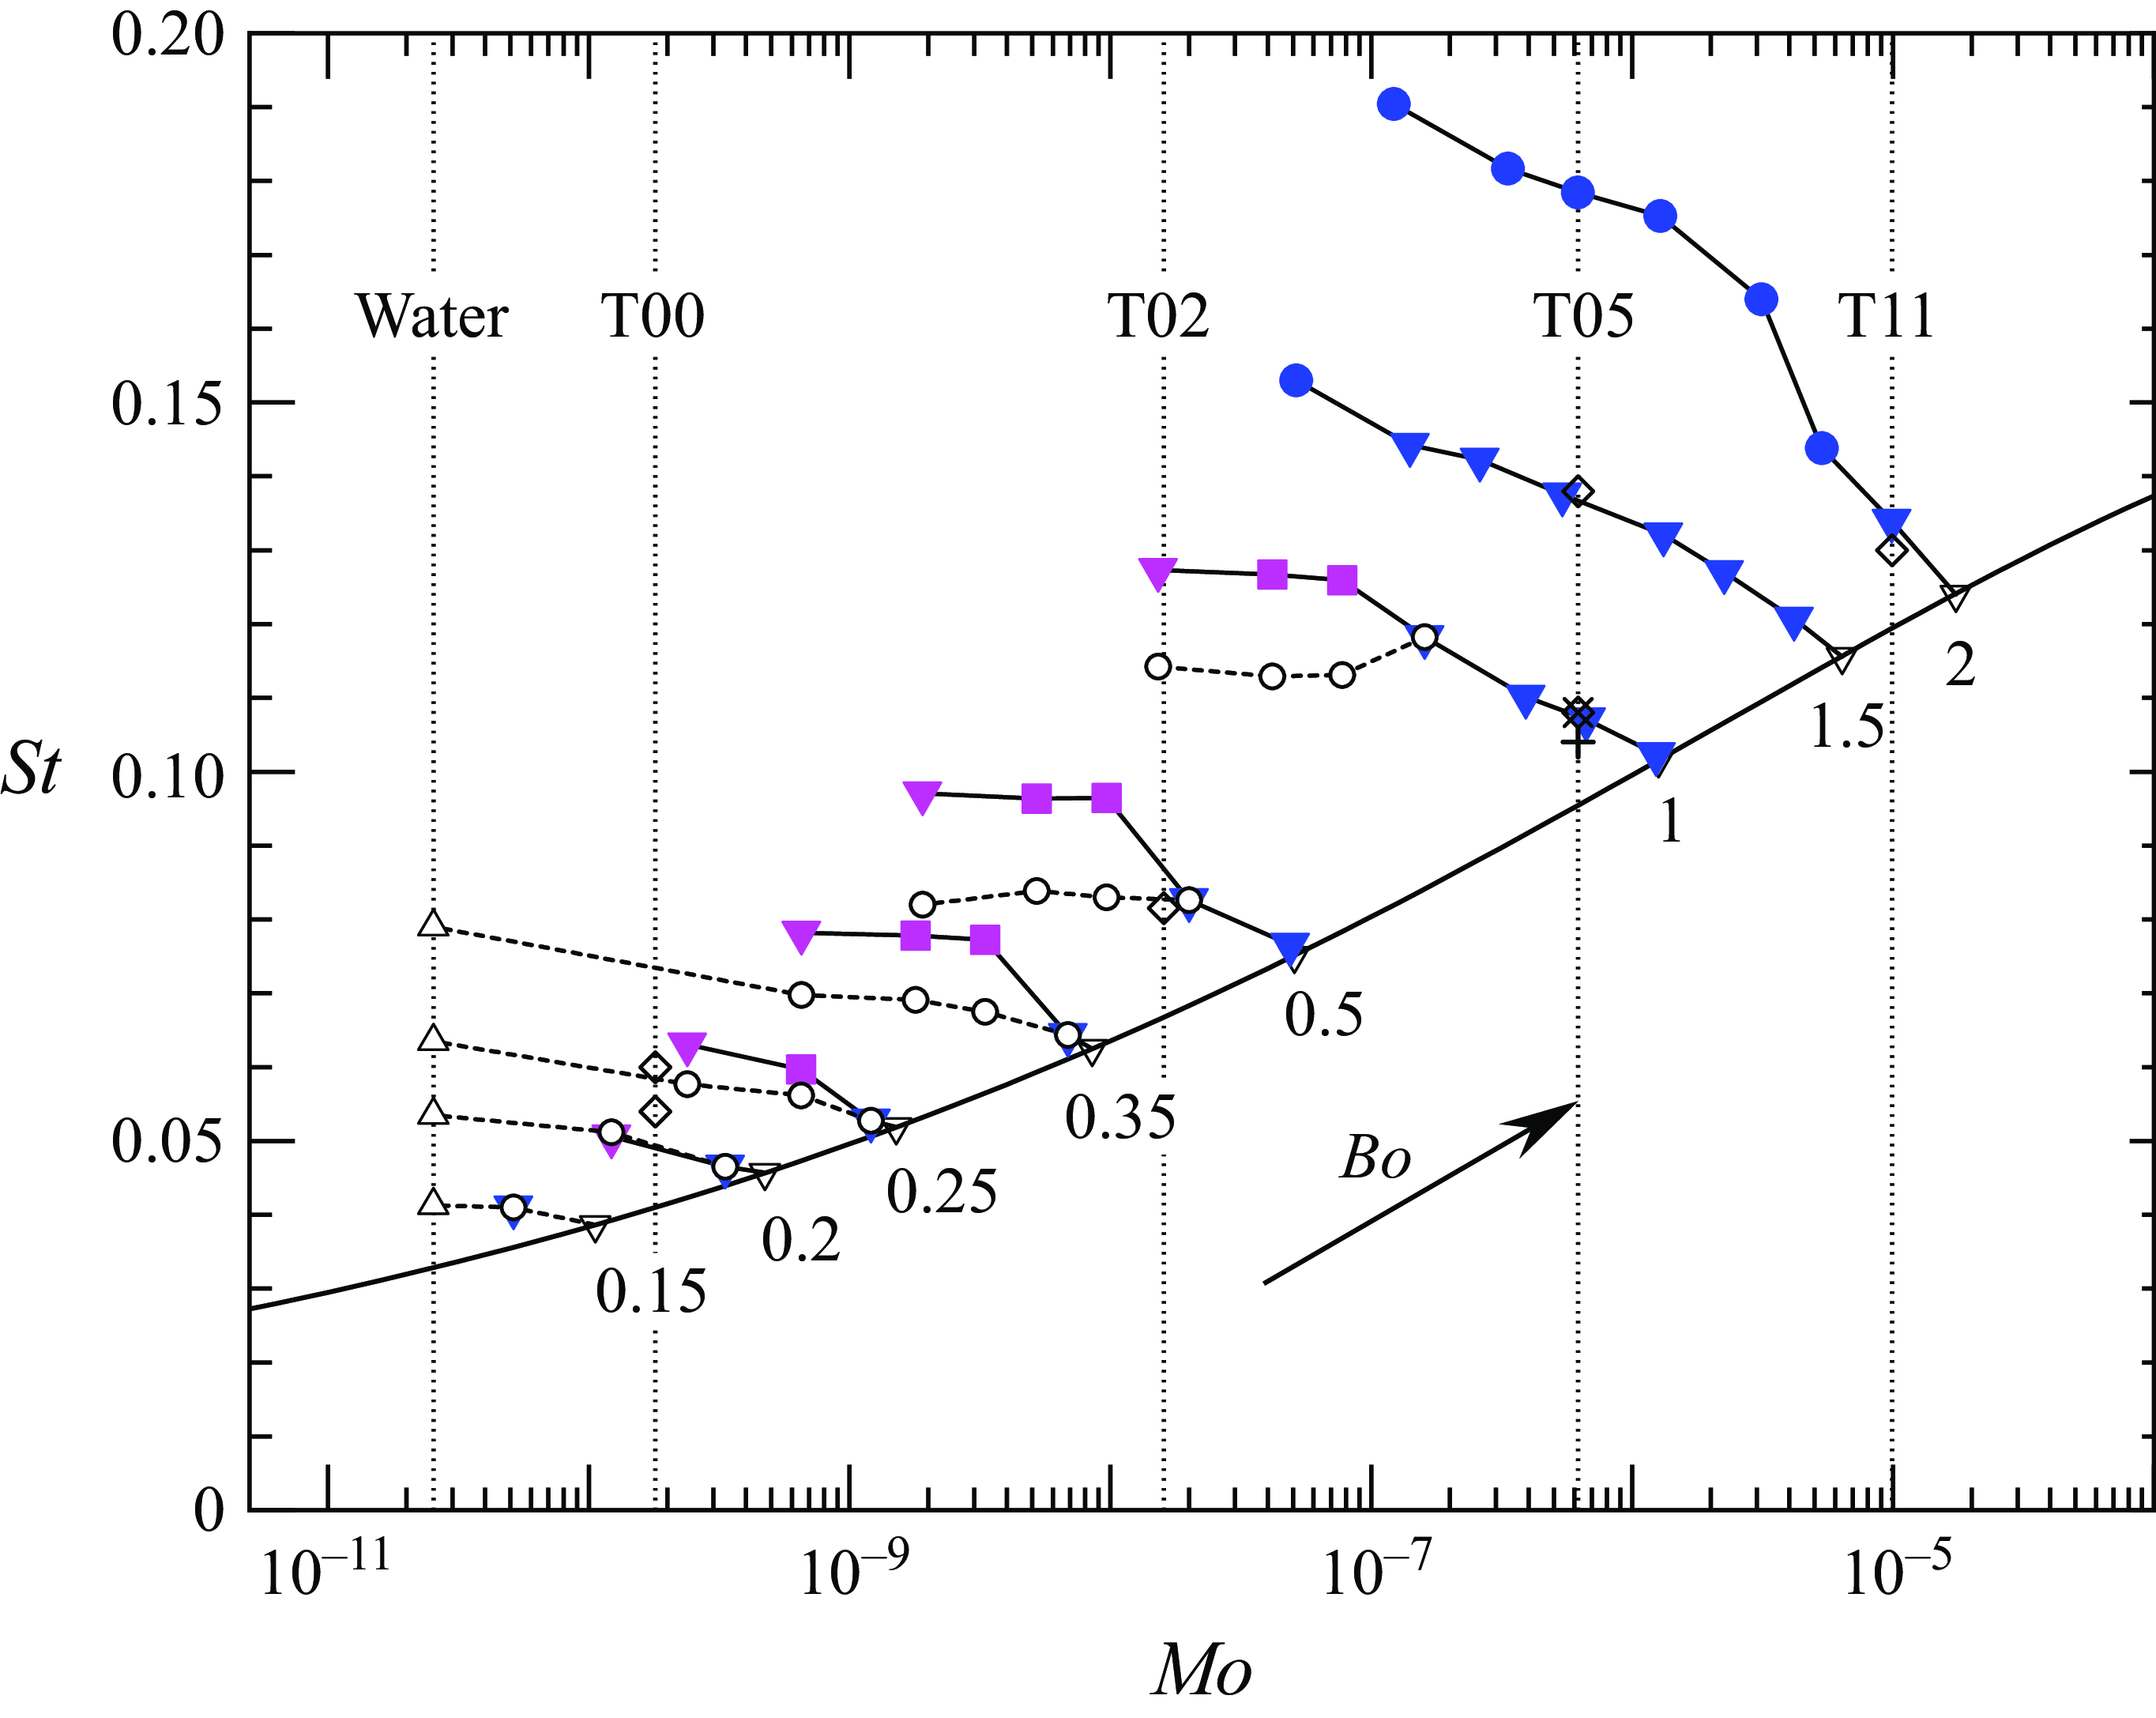
Figure 5. Variation of the Strouhal number, $St$
, of path oscillations as a function of the Morton number. Solid symbols: present results in the wall-bounded configuration (for caption, see figure 2); open circles: present results in an unbounded fluid. Thin solid and dashed lines connect
$St$
, of path oscillations as a function of the Morton number. Solid symbols: present results in the wall-bounded configuration (for caption, see figure 2); open circles: present results in an unbounded fluid. Thin solid and dashed lines connect $St$
values corresponding to a fixed
$St$
values corresponding to a fixed $Bo$
and different
$Bo$
and different $Ga$
(hence,
$Ga$
(hence, $Mo$
) in the wall-bounded and unbounded configurations, respectively. Thick solid line: neutral curve of path instability in an unbounded fluid (Bonnefis et al. Reference Bonnefis, Sierra-Ausin, Fabre and Magnaudet2024);
$Mo$
) in the wall-bounded and unbounded configurations, respectively. Thick solid line: neutral curve of path instability in an unbounded fluid (Bonnefis et al. Reference Bonnefis, Sierra-Ausin, Fabre and Magnaudet2024); $\triangledown$
: selected values of the critical Strouhal number,
$\triangledown$
: selected values of the critical Strouhal number, $St_c$
, from the same reference;
$St_c$
, from the same reference; $\triangle$
: experimental data in water (Duineveld Reference Duineveld1994, Reference Duineveld1995; Veldhuis Reference Veldhuis2007; Veldhuis, Biesheuvel & van Wijngaarden Reference Veldhuis, Biesheuvel and van Wijngaarden2008; Jeong & Park Reference Jeong and Park2015) (values were interpolated from neighbouring
$\triangle$
: experimental data in water (Duineveld Reference Duineveld1994, Reference Duineveld1995; Veldhuis Reference Veldhuis2007; Veldhuis, Biesheuvel & van Wijngaarden Reference Veldhuis, Biesheuvel and van Wijngaarden2008; Jeong & Park Reference Jeong and Park2015) (values were interpolated from neighbouring $Bo$
). Symbols
$Bo$
). Symbols $+$
and
$+$
and $\times$
indicate data at
$\times$
indicate data at $Bo \approx 1$
from experiments in silicone oil DMS-T05 by Zenit & Magnaudet (Reference Zenit and Magnaudet2009) and Estepa-Cantero et al. (Reference Estepa-Cantero, Martínez-Bazán and Bolaños Jiménez2024), respectively;
$Bo \approx 1$
from experiments in silicone oil DMS-T05 by Zenit & Magnaudet (Reference Zenit and Magnaudet2009) and Estepa-Cantero et al. (Reference Estepa-Cantero, Martínez-Bazán and Bolaños Jiménez2024), respectively; $\diamond$
indicates numerical data for various liquids in an unbounded fluid (Cano-Lozano et al. Reference Cano-Lozano, Martínez-Bazán, Magnaudet and Tchoufag2016).
$\diamond$
indicates numerical data for various liquids in an unbounded fluid (Cano-Lozano et al. Reference Cano-Lozano, Martínez-Bazán, Magnaudet and Tchoufag2016).
When $Ga$
is larger than
$Ga$
is larger than $50$
and
$50$
and $Bo$
is above the aforementioned band but below unity, a new type of motion emerges. In this intermediate range, the bubble is trapped near the wall, ultimately undergoing a near-wall zigzagging-like (NWZ) motion. Bubble–wall collisions due to an incomplete resolution of lubrication effects in the immediate vicinity of the wall (see § 2) occur for
$Bo$
is above the aforementioned band but below unity, a new type of motion emerges. In this intermediate range, the bubble is trapped near the wall, ultimately undergoing a near-wall zigzagging-like (NWZ) motion. Bubble–wall collisions due to an incomplete resolution of lubrication effects in the immediate vicinity of the wall (see § 2) occur for $Ga \gtrsim 70$
. Two bubble paths typical of this regime, with and without bubble–wall collisions, are shown in figure 2
$Ga \gtrsim 70$
. Two bubble paths typical of this regime, with and without bubble–wall collisions, are shown in figure 2 $(c)$
. Although the upper limit of present simulations is
$(c)$
. Although the upper limit of present simulations is $Ga=90$
, available data indicate that this scenario still holds at larger
$Ga=90$
, available data indicate that this scenario still holds at larger $Ga$
. In particular, it was identified in experiments performed in pure water (de Vries Reference de Vries2001; Jeong & Park Reference Jeong and Park2015; Lee & Park Reference Lee and Park2017; Cai et al. Reference Cai, Ju, Chen and Sun2023) with millimetre-sized air bubbles corresponding to
$Ga$
. In particular, it was identified in experiments performed in pure water (de Vries Reference de Vries2001; Jeong & Park Reference Jeong and Park2015; Lee & Park Reference Lee and Park2017; Cai et al. Reference Cai, Ju, Chen and Sun2023) with millimetre-sized air bubbles corresponding to $95\lesssim Ga\lesssim 270$
and
$95\lesssim Ga\lesssim 270$
and $0.125\lesssim Bo\lesssim 0.5$
. It is important to stress that the NWZ regime and the near-wall bouncing regime observed for low enough
$0.125\lesssim Bo\lesssim 0.5$
. It is important to stress that the NWZ regime and the near-wall bouncing regime observed for low enough $Bo$
and
$Bo$
and $Ga$
below the neutral curve (open red symbols in figure 2
$Ga$
below the neutral curve (open red symbols in figure 2 $a$
) are totally distinct. Indeed, although bubbles follow periodic near-wall paths in both cases, the mechanisms governing these two regimes are fundamentally different. In the moderate-
$a$
) are totally distinct. Indeed, although bubbles follow periodic near-wall paths in both cases, the mechanisms governing these two regimes are fundamentally different. In the moderate- $Ga$
near-wall bouncing regime, periodic bouncing is linked to the shedding of a pair of streamwise vortices in the bubble wake, with vortex formation governed by the near-wall shear resulting from the no-slip condition at the wall (see § 4 of Part 1 for details). In contrast, in the high-
$Ga$
near-wall bouncing regime, periodic bouncing is linked to the shedding of a pair of streamwise vortices in the bubble wake, with vortex formation governed by the near-wall shear resulting from the no-slip condition at the wall (see § 4 of Part 1 for details). In contrast, in the high- $Ga$
NWZ regime, lateral oscillations arise due to path instability that would occur even in an unbounded fluid. Furthermore, the mechanism preventing NWZ bubbles from escaping the wall is linked to intense wake–wall interactions, as will become clear in §§ 5.2–5.3, whereas in the moderate-
$Ga$
NWZ regime, lateral oscillations arise due to path instability that would occur even in an unbounded fluid. Furthermore, the mechanism preventing NWZ bubbles from escaping the wall is linked to intense wake–wall interactions, as will become clear in §§ 5.2–5.3, whereas in the moderate- $Ga$
near-wall bouncing regime, bubble entrapment results from the attractive inviscid Bernoulli effect.
$Ga$
near-wall bouncing regime, bubble entrapment results from the attractive inviscid Bernoulli effect.
Figure 5 shows how the Strouhal number (or reduced frequency), $St$
, of the transverse oscillations vary from one fluid to the other. In the simulations, variations of
$St$
, of the transverse oscillations vary from one fluid to the other. In the simulations, variations of $Mo$
are achieved by varying
$Mo$
are achieved by varying $Ga$
while keeping
$Ga$
while keeping $Bo$
constant. For each iso-
$Bo$
constant. For each iso- $Bo$
series (thin solid and dashed lines),
$Bo$
series (thin solid and dashed lines), $St$
is seen to decrease with increasing
$St$
is seen to decrease with increasing $Mo$
(hence, decreasing
$Mo$
(hence, decreasing $Ga$
). The reduced frequency approaches the threshold value,
$Ga$
). The reduced frequency approaches the threshold value, $St_c$
, predicted by linear stability analysis (Bonnefis et al. Reference Bonnefis, Sierra-Ausin, Fabre and Magnaudet2024) at the maximum
$St_c$
, predicted by linear stability analysis (Bonnefis et al. Reference Bonnefis, Sierra-Ausin, Fabre and Magnaudet2024) at the maximum $Mo$
at which path instability takes place at the considered
$Mo$
at which path instability takes place at the considered $Bo$
. This finding indicates that the presence of the wall does not affect the oscillation frequency of bubbles close to the threshold of path instability. To check whether or not this is still the case further away from the threshold, we ran additional runs without the presence of the wall for
$Bo$
. This finding indicates that the presence of the wall does not affect the oscillation frequency of bubbles close to the threshold of path instability. To check whether or not this is still the case further away from the threshold, we ran additional runs without the presence of the wall for $(Bo,Ga)$
sets for which the NWZ evolution is observed when the wall is present. Comparing both sets of results reveals that interactions with the wall increase the reduced frequency for
$(Bo,Ga)$
sets for which the NWZ evolution is observed when the wall is present. Comparing both sets of results reveals that interactions with the wall increase the reduced frequency for $Bo\geqslant 0.25$
. For instance, with
$Bo\geqslant 0.25$
. For instance, with $Bo=0.5$
and
$Bo=0.5$
and $Mo = 1.9 \times 10^{-9}$
,
$Mo = 1.9 \times 10^{-9}$
, $St$
increases by nearly
$St$
increases by nearly $20\,\%$
from the unbounded to the wall-bounded configuration. Some available experimental and numerical data, all of which were obtained in an unbounded fluid except those of Estepa-Cantero et al. (Reference Estepa-Cantero, Martínez-Bazán and Bolaños Jiménez2024), are also included in the figure. These data are found to agree well with present predictions, confirming the accuracy of our simulations in the unbounded configuration (the low-
$20\,\%$
from the unbounded to the wall-bounded configuration. Some available experimental and numerical data, all of which were obtained in an unbounded fluid except those of Estepa-Cantero et al. (Reference Estepa-Cantero, Martínez-Bazán and Bolaños Jiménez2024), are also included in the figure. These data are found to agree well with present predictions, confirming the accuracy of our simulations in the unbounded configuration (the low- $Mo$
simulations of Cano-Lozano et al. (Reference Cano-Lozano, Martínez-Bazán, Magnaudet and Tchoufag2016) suffer from under-resolution, which is why the data reported for
$Mo$
simulations of Cano-Lozano et al. (Reference Cano-Lozano, Martínez-Bazán, Magnaudet and Tchoufag2016) suffer from under-resolution, which is why the data reported for $Mo=\mathcal{O}(10^{-10})$
slightly deviate from present predictions).
$Mo=\mathcal{O}(10^{-10})$
slightly deviate from present predictions).
In the following sections, we examine in more detail the results corresponding to the three regimes that were not observed in Part 1, namely the BTE scenario which takes place at large enough $Ga$
in the stable path regime, and the WMA and NWZ scenarios, which are both observed beyond the threshold of path instability.
$Ga$
in the stable path regime, and the WMA and NWZ scenarios, which are both observed beyond the threshold of path instability.
4. The BTE regime
Figure 6 illustrates the evolution of several indicators for a bubble with $(Bo, Ga) = (0.05, 70)$
following a BTE evolution. According to panel (
$(Bo, Ga) = (0.05, 70)$
following a BTE evolution. According to panel ( $a$
), the bubble bounces twice before escaping from the near-wall region. Before each bounce, it first collides with the wall, as indicated by values of
$a$
), the bubble bounces twice before escaping from the near-wall region. Before each bounce, it first collides with the wall, as indicated by values of $X_b$
(the distance from the bubble centroid to the wall) smaller than one. Upon collision, the aspect ratio quickly decreases to a minimum close to
$X_b$
(the distance from the bubble centroid to the wall) smaller than one. Upon collision, the aspect ratio quickly decreases to a minimum close to $1.0$
and the bubble keeps this virtually spherical shape for approximately
$1.0$
and the bubble keeps this virtually spherical shape for approximately $3{-}4$
time units (see the detailed evolution in panel
$3{-}4$
time units (see the detailed evolution in panel $b$
). Panels (
$b$
). Panels ( $c,d$
) show that, upon the second collision, the bubble rise velocity,
$c,d$
) show that, upon the second collision, the bubble rise velocity, $V_y$
, falls dramatically by a factor of six, reducing from
$V_y$
, falls dramatically by a factor of six, reducing from $4.8$
at
$4.8$
at $T=33$
to
$T=33$
to $0.75$
at
$0.75$
at $T=36.5$
. Meanwhile, the direction of the wall-normal velocity,
$T=36.5$
. Meanwhile, the direction of the wall-normal velocity, $V_x$
, reverses three times. Between the last two reversals,
$V_x$
, reverses three times. Between the last two reversals, $V_x$
is negative, so that the bubble undergoes a short wall-ward migration prior to escaping definitively away from the wall region (mentioned as the ‘Reversal’ period in panel
$V_x$
is negative, so that the bubble undergoes a short wall-ward migration prior to escaping definitively away from the wall region (mentioned as the ‘Reversal’ period in panel $b$
).
$b$
).

Figure 6. Evolution of several characteristics of the bubble motion during a BTE scenario for $(Bo, Ga) = (0.05, 70)$
. The right panels provide a zoom of the evolution shown in the left panels in the time interval
$(Bo, Ga) = (0.05, 70)$
. The right panels provide a zoom of the evolution shown in the left panels in the time interval $35 \leqslant T \leqslant 40$
. (
$35 \leqslant T \leqslant 40$
. ( $a,$
$a,$ $b$
) show wall-normal bubble position (red line and left axis) and bubble aspect ratio (green line and right axis). (
$b$
) show wall-normal bubble position (red line and left axis) and bubble aspect ratio (green line and right axis). ( $c,\!d$
) show wall-normal (red line and left axis) and vertical (green line and right axis) velocities of the bubble centroid. (
$c,\!d$
) show wall-normal (red line and left axis) and vertical (green line and right axis) velocities of the bubble centroid. ( $e,\!f$
) show spinning rate of the bubble surface. The inset in panel (
$e,\!f$
) show spinning rate of the bubble surface. The inset in panel ( $e$
) displays the iso-contours of the spanwise vorticity
$e$
) displays the iso-contours of the spanwise vorticity $\overline {\omega }_z$
at
$\overline {\omega }_z$
at $T=36$
in the symmetry plane
$T=36$
in the symmetry plane $Z=Z_b$
; red and blue colours refer to positive and negative values, respectively, with a maximum magnitude of
$Z=Z_b$
; red and blue colours refer to positive and negative values, respectively, with a maximum magnitude of $5$
.
$5$
.
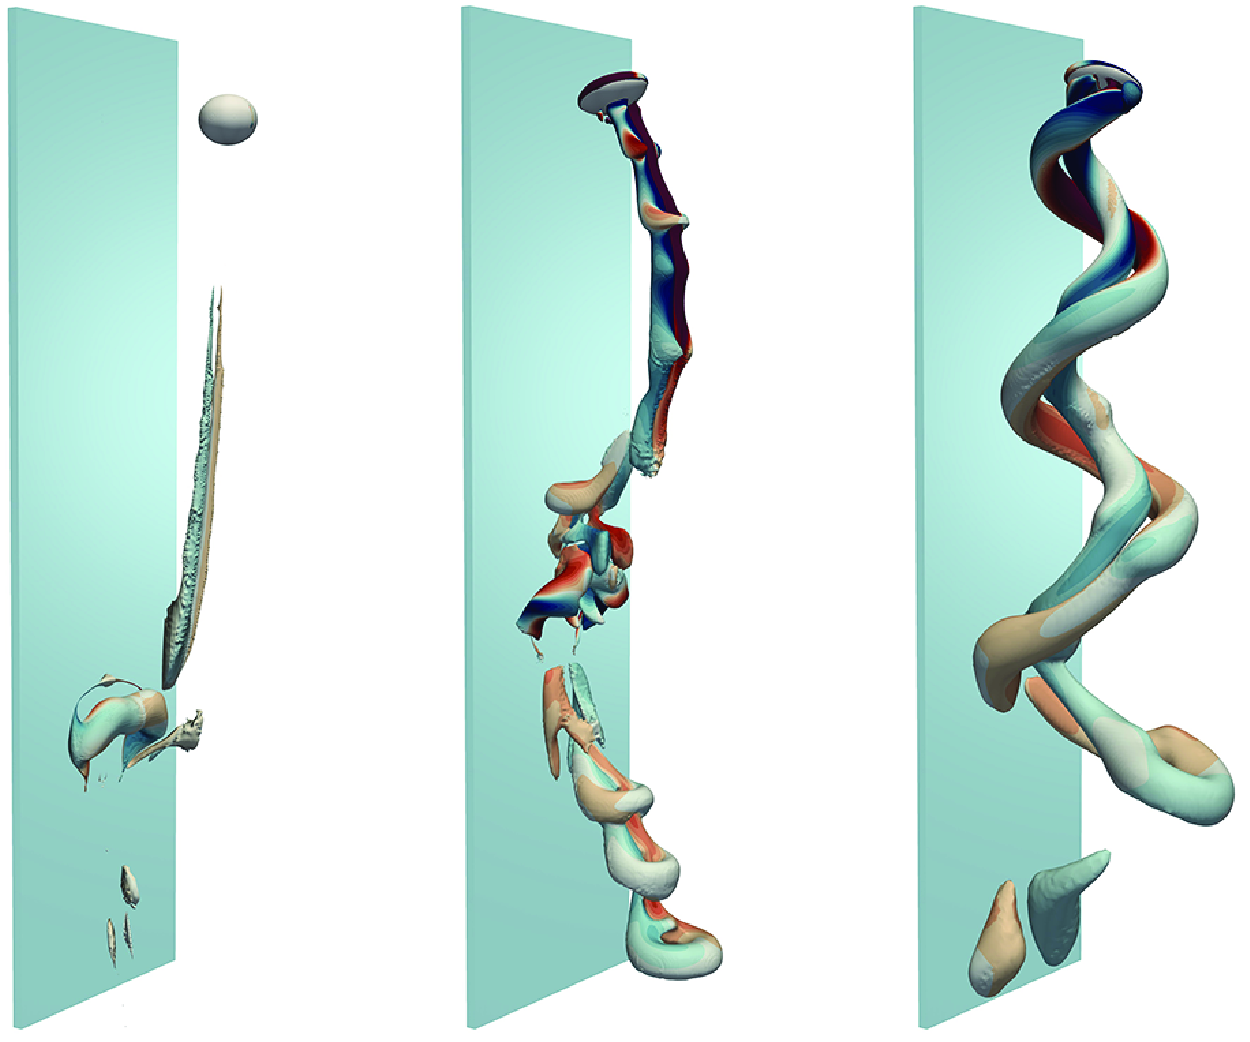
Examination of the flow field in the vicinity of the bubble helps elucidate key aspects of the mechanisms involved. The inset in figure 6( $e$
) shows the iso-contours of the spanwise vorticity component,
$e$
) shows the iso-contours of the spanwise vorticity component, $\overline {\omega }_z$
, in the wall-normal symmetry plane
$\overline {\omega }_z$
, in the wall-normal symmetry plane $Z=Z_b$
just after the collision (
$Z=Z_b$
just after the collision ( $T=36$
). This component is seen to be uniformly negative in the bubble vicinity, indicating that fluid particles experience a clockwise rotation about the
$T=36$
). This component is seen to be uniformly negative in the bubble vicinity, indicating that fluid particles experience a clockwise rotation about the $Z$
-axis. The global rotation of fluid particles at the bubble surface may be quantified using the spinning rate
$Z$
-axis. The global rotation of fluid particles at the bubble surface may be quantified using the spinning rate $\overline {\boldsymbol{\Omega }}$
defined by (2.2). The evolution of its spanwise component,
$\overline {\boldsymbol{\Omega }}$
defined by (2.2). The evolution of its spanwise component, $\overline {\Omega }_z$
, is illustrated in figures 6(
$\overline {\Omega }_z$
, is illustrated in figures 6( $e,\!f$
). Upon the first collision,
$e,\!f$
). Upon the first collision, $|\overline {{\Omega }}_z|$
quickly increases from zero to
$|\overline {{\Omega }}_z|$
quickly increases from zero to $\approx 1.4$
. Combined with the simultaneous sharp decrease of
$\approx 1.4$
. Combined with the simultaneous sharp decrease of $V_y$
, this suggests that part of the fluid kinetic energy associated with the bubble translation is converted into ‘rotational’ kinetic energy. The fluid surrounding the bubble being spinning, the bubble experiences a lift force
$V_y$
, this suggests that part of the fluid kinetic energy associated with the bubble translation is converted into ‘rotational’ kinetic energy. The fluid surrounding the bubble being spinning, the bubble experiences a lift force $\boldsymbol{F}_L^{\text{M}}\propto \boldsymbol{\overline {\Omega }}\times \boldsymbol{V}$
, which may be interpreted as a Magnus-like force. As
$\boldsymbol{F}_L^{\text{M}}\propto \boldsymbol{\overline {\Omega }}\times \boldsymbol{V}$
, which may be interpreted as a Magnus-like force. As $\overline {{\Omega }}_z$
,
$\overline {{\Omega }}_z$
, $V_x$
and
$V_x$
and $V_y$
are all of order unity during this transient stage, this force is expected to be comparable in magnitude to the buoyancy force. Since
$V_y$
are all of order unity during this transient stage, this force is expected to be comparable in magnitude to the buoyancy force. Since $V_y$
is always positive, the wall-normal component of this force is positive, helping the bubble move away from the wall. This is the key mechanism that makes the BTE scenario possible. An essential characteristics of the Magnus-like force is that it keeps significant values over a long post-collision period of time, while the bubble has already moved a substantial distance away from the wall. For instance, figure 6(
$V_y$
is always positive, the wall-normal component of this force is positive, helping the bubble move away from the wall. This is the key mechanism that makes the BTE scenario possible. An essential characteristics of the Magnus-like force is that it keeps significant values over a long post-collision period of time, while the bubble has already moved a substantial distance away from the wall. For instance, figure 6( $b$
) indicates that the gap is already one bubble radius wide
$b$
) indicates that the gap is already one bubble radius wide $(X_b=2)$
at
$(X_b=2)$
at $T=38.3$
, a moment at which, according to panels
$T=38.3$
, a moment at which, according to panels $(d)$
and
$(d)$
and $(f)$
, the wall-normal component of
$(f)$
, the wall-normal component of $\boldsymbol{\overline {\Omega }}\times \boldsymbol{V}$
is still close to unity.
$\boldsymbol{\overline {\Omega }}\times \boldsymbol{V}$
is still close to unity.
When $V_x$
is positive, the vertical component
$V_x$
is positive, the vertical component $\boldsymbol{F}_L^{\text{M}}\cdot {\textbf {e}}_y$
is negative, thus counteracting buoyancy. This leads to a sharp decrease in
$\boldsymbol{F}_L^{\text{M}}\cdot {\textbf {e}}_y$
is negative, thus counteracting buoyancy. This leads to a sharp decrease in $V_y$
during the time interval
$V_y$
during the time interval $35.5 \leqslant T \leqslant 36.7$
, and to a lesser extent from
$35.5 \leqslant T \leqslant 36.7$
, and to a lesser extent from $T=37.5$
to
$T=37.5$
to $T =39$
. Conversely, during the short wall-ward stage noticed for
$T =39$
. Conversely, during the short wall-ward stage noticed for $36.7\leqslant T\leqslant 37.5$
, this component cooperates with the buoyancy force, resulting in an increase of the rise speed. Of course, viscous effects and liquid inertia play a central role beyond the transient stage during the Magnus-like force controls the bubble dynamics. Since near-wall dissipation increases as the gap shrinks, viscous processes are responsible for the sharp decrease of the rise speed prior to the collision
$36.7\leqslant T\leqslant 37.5$
, this component cooperates with the buoyancy force, resulting in an increase of the rise speed. Of course, viscous effects and liquid inertia play a central role beyond the transient stage during the Magnus-like force controls the bubble dynamics. Since near-wall dissipation increases as the gap shrinks, viscous processes are responsible for the sharp decrease of the rise speed prior to the collision $(33.5\leqslant T\leqslant 35.5$
). Conversely, inertial effects associated with the amount of liquid displaced by the bubble result in an added-mass force that limits the time variations of
$(33.5\leqslant T\leqslant 35.5$
). Conversely, inertial effects associated with the amount of liquid displaced by the bubble result in an added-mass force that limits the time variations of $V_y$
. This is why the rise speed is still only half its pre-collision value at
$V_y$
. This is why the rise speed is still only half its pre-collision value at $T=40$
, while
$T=40$
, while $\overline {{\Omega }}_z$
has already almost returned to zero.
$\overline {{\Omega }}_z$
has already almost returned to zero.
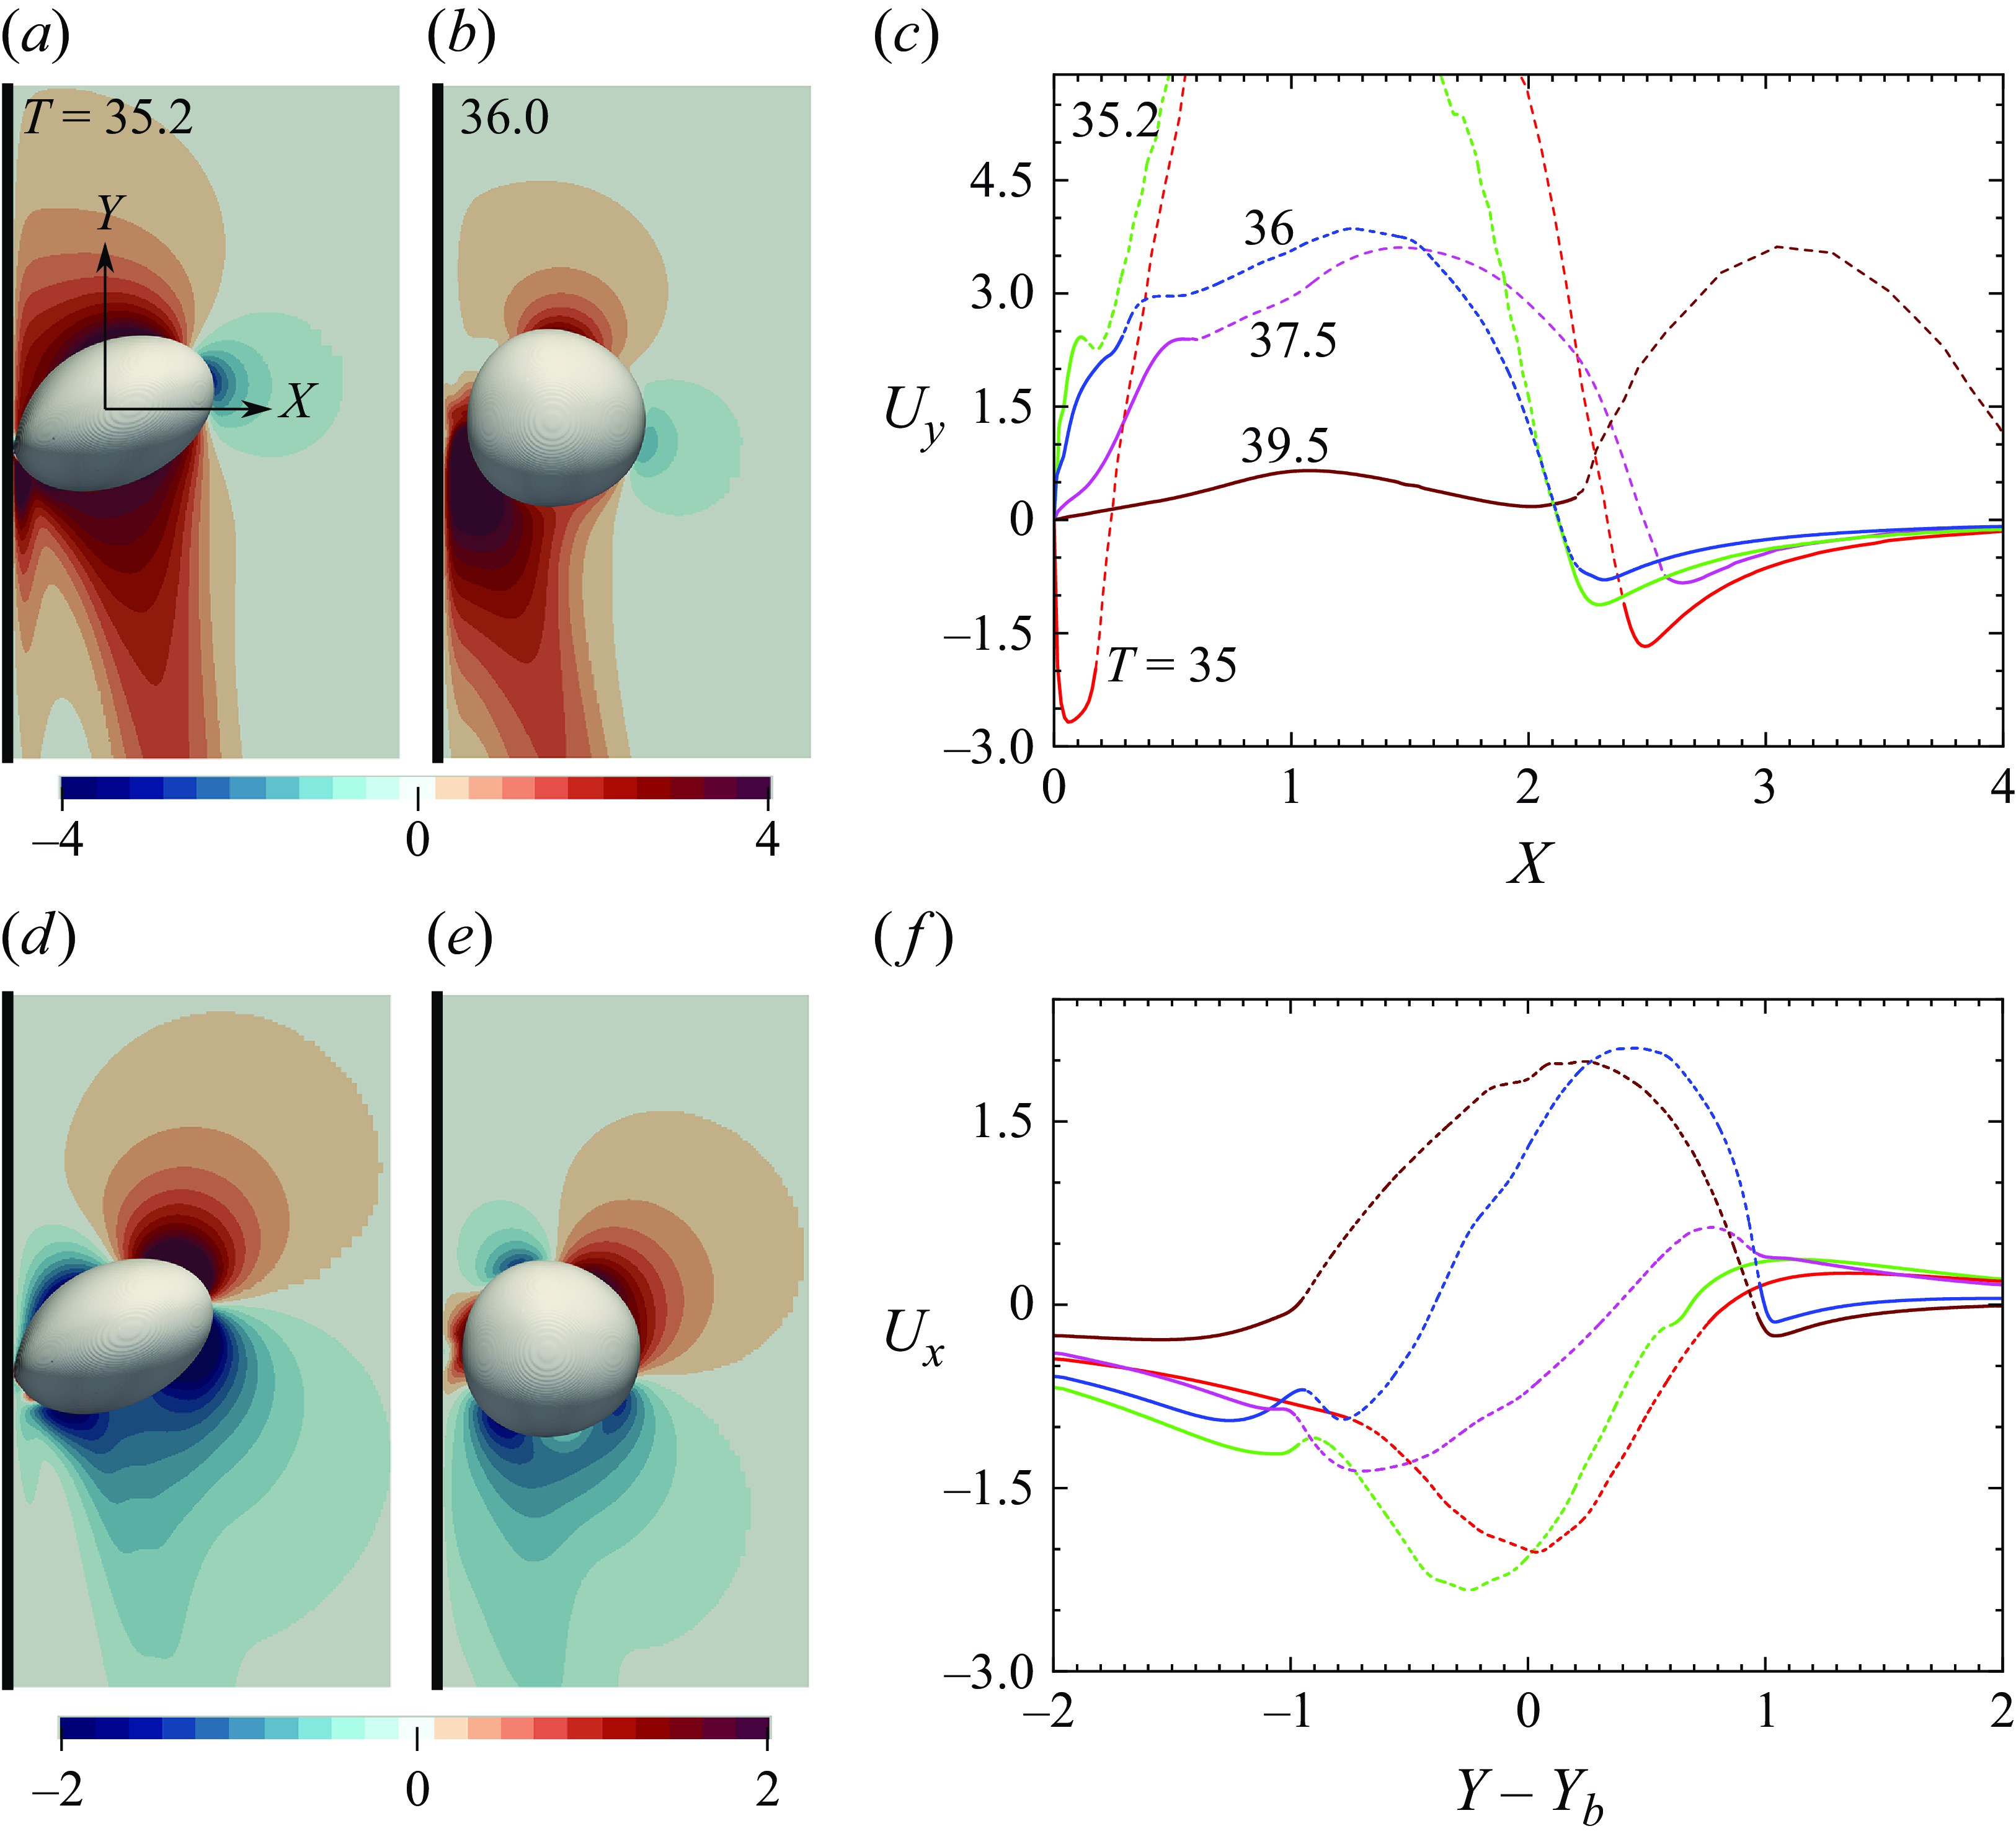
Figure 7. Evolution of the vertical (top row) and wall-normal (bottom row) fluid velocity in the vicinity of a bubble with $(Bo, Ga) = (0.05, 70)$
. Panels (
$(Bo, Ga) = (0.05, 70)$
. Panels ( $a{-}b$
) and (
$a{-}b$
) and ( $d{-}e$
) show the distribution in the wall-normal symmetry plane
$d{-}e$
) show the distribution in the wall-normal symmetry plane $Z = Z_b$
at
$Z = Z_b$
at $T = 35.2$
and
$T = 35.2$
and $36$
, respectively. The bubble is rising upwards, and the wall is shown with a thick black line on the left. (
$36$
, respectively. The bubble is rising upwards, and the wall is shown with a thick black line on the left. ( $c$
) Distribution of
$c$
) Distribution of $U_y$
along the horizontal line
$U_y$
along the horizontal line $Y = Y_b, Z = Z_b$
, with solid and dashed lines showing the velocity outside and inside the bubble, respectively.
$Y = Y_b, Z = Z_b$
, with solid and dashed lines showing the velocity outside and inside the bubble, respectively. $(d)$
Same for
$(d)$
Same for $U_x$
along the vertical line
$U_x$
along the vertical line $X = X_b, Z = Z_b$
.
$X = X_b, Z = Z_b$
.
The discussion above also helps explain the rapid variations noticed in the bubble shape upon the second collision, particularly the swift recovery of the spherical shape (see also figures 7 $a{-}b$
and 7
$a{-}b$
and 7 $d{-}e$
). This recovery is primarily driven by two factors. First, the significant decrease in the bubble rise speed immediately after the collision revealed by figure 6
$d{-}e$
). This recovery is primarily driven by two factors. First, the significant decrease in the bubble rise speed immediately after the collision revealed by figure 6 $(d)$
reduces the pressure difference between the front stagnation point and the bubble’s equator. As the bubble moves away from the wall, this quickly reduces its aspect ratio. Second, the strong collision-induced spinning flow around the bubble attenuates the local pressure differences in the fluid, maintaining its shape spherical for some time.
$(d)$
reduces the pressure difference between the front stagnation point and the bubble’s equator. As the bubble moves away from the wall, this quickly reduces its aspect ratio. Second, the strong collision-induced spinning flow around the bubble attenuates the local pressure differences in the fluid, maintaining its shape spherical for some time.
Figure 7 shows the bubble shape and position and the velocity distribution of the surrounding liquid in the symmetry plane $Z = Z_b$
just before and after the second collision. Panel
$Z = Z_b$
just before and after the second collision. Panel $(c)$
reveals that the extremum of
$(c)$
reveals that the extremum of $U_y$
in the gap experiences an abrupt change from
$U_y$
in the gap experiences an abrupt change from $-2.6$
at
$-2.6$
at $T=35$
to
$T=35$
to $\approx 2.5$
at
$\approx 2.5$
at $T=35.2$
. The maximum
$T=35.2$
. The maximum $U_y$
goes on increasing after the collision, reaching a value of
$U_y$
goes on increasing after the collision, reaching a value of $4.2$
at
$4.2$
at $T=36.5$
(not shown), before relaxing slowly to zero as the bubble moves away from the wall. The massive flow reversal in the gap at the beginning of the sequence results from the rapid decrease of the bubble rise speed, which forces fluid elements initially located in the wake to catch up with those located on both sides of the bubble and eventually replace them. The consequences of this catch-up process are milder along the fluid-facing side of the bubble, where the negative vertical velocity is significantly reduced but does not change sign over an
$T=36.5$
(not shown), before relaxing slowly to zero as the bubble moves away from the wall. The massive flow reversal in the gap at the beginning of the sequence results from the rapid decrease of the bubble rise speed, which forces fluid elements initially located in the wake to catch up with those located on both sides of the bubble and eventually replace them. The consequences of this catch-up process are milder along the fluid-facing side of the bubble, where the negative vertical velocity is significantly reduced but does not change sign over an $\mathcal{O}(1)$
-thick fluid layer. The positive
$\mathcal{O}(1)$
-thick fluid layer. The positive $U_y$
in the gap and their negative counterpart on the fluid-facing side both provide negative contributions to the
$U_y$
in the gap and their negative counterpart on the fluid-facing side both provide negative contributions to the $z$
-component of the cross product
$z$
-component of the cross product $({\textbf {X}}-{\textbf {X}}_b)\times {\textbf {U}}$
at the bubble surface, hence to
$({\textbf {X}}-{\textbf {X}}_b)\times {\textbf {U}}$
at the bubble surface, hence to $\overline \Omega _z$
. However, the contribution coming from the gap is
$\overline \Omega _z$
. However, the contribution coming from the gap is $3-4$
times larger, and the difference is even larger before the collision, owing to the weak negative values of
$3-4$
times larger, and the difference is even larger before the collision, owing to the weak negative values of $U_y$
on the fluid-facing side (
$U_y$
on the fluid-facing side ( $U_y\approx 0$
at the position where the solid green line corresponding to
$U_y\approx 0$
at the position where the solid green line corresponding to $T=35.2$
turns dashed). Owing to the predominant suction of the wake towards the gap region, the wall-normal velocity is negative at the back of the bubble, as panels
$T=35.2$
turns dashed). Owing to the predominant suction of the wake towards the gap region, the wall-normal velocity is negative at the back of the bubble, as panels $(d{-}e)$
confirm. These negative
$(d{-}e)$
confirm. These negative $U_x$
values are significantly larger than their positive counterpart ahead of the bubble (see panel
$U_x$
values are significantly larger than their positive counterpart ahead of the bubble (see panel $f$
), providing another sizeable negative contribution to
$f$
), providing another sizeable negative contribution to $\overline \Omega _z$
.
$\overline \Omega _z$
.
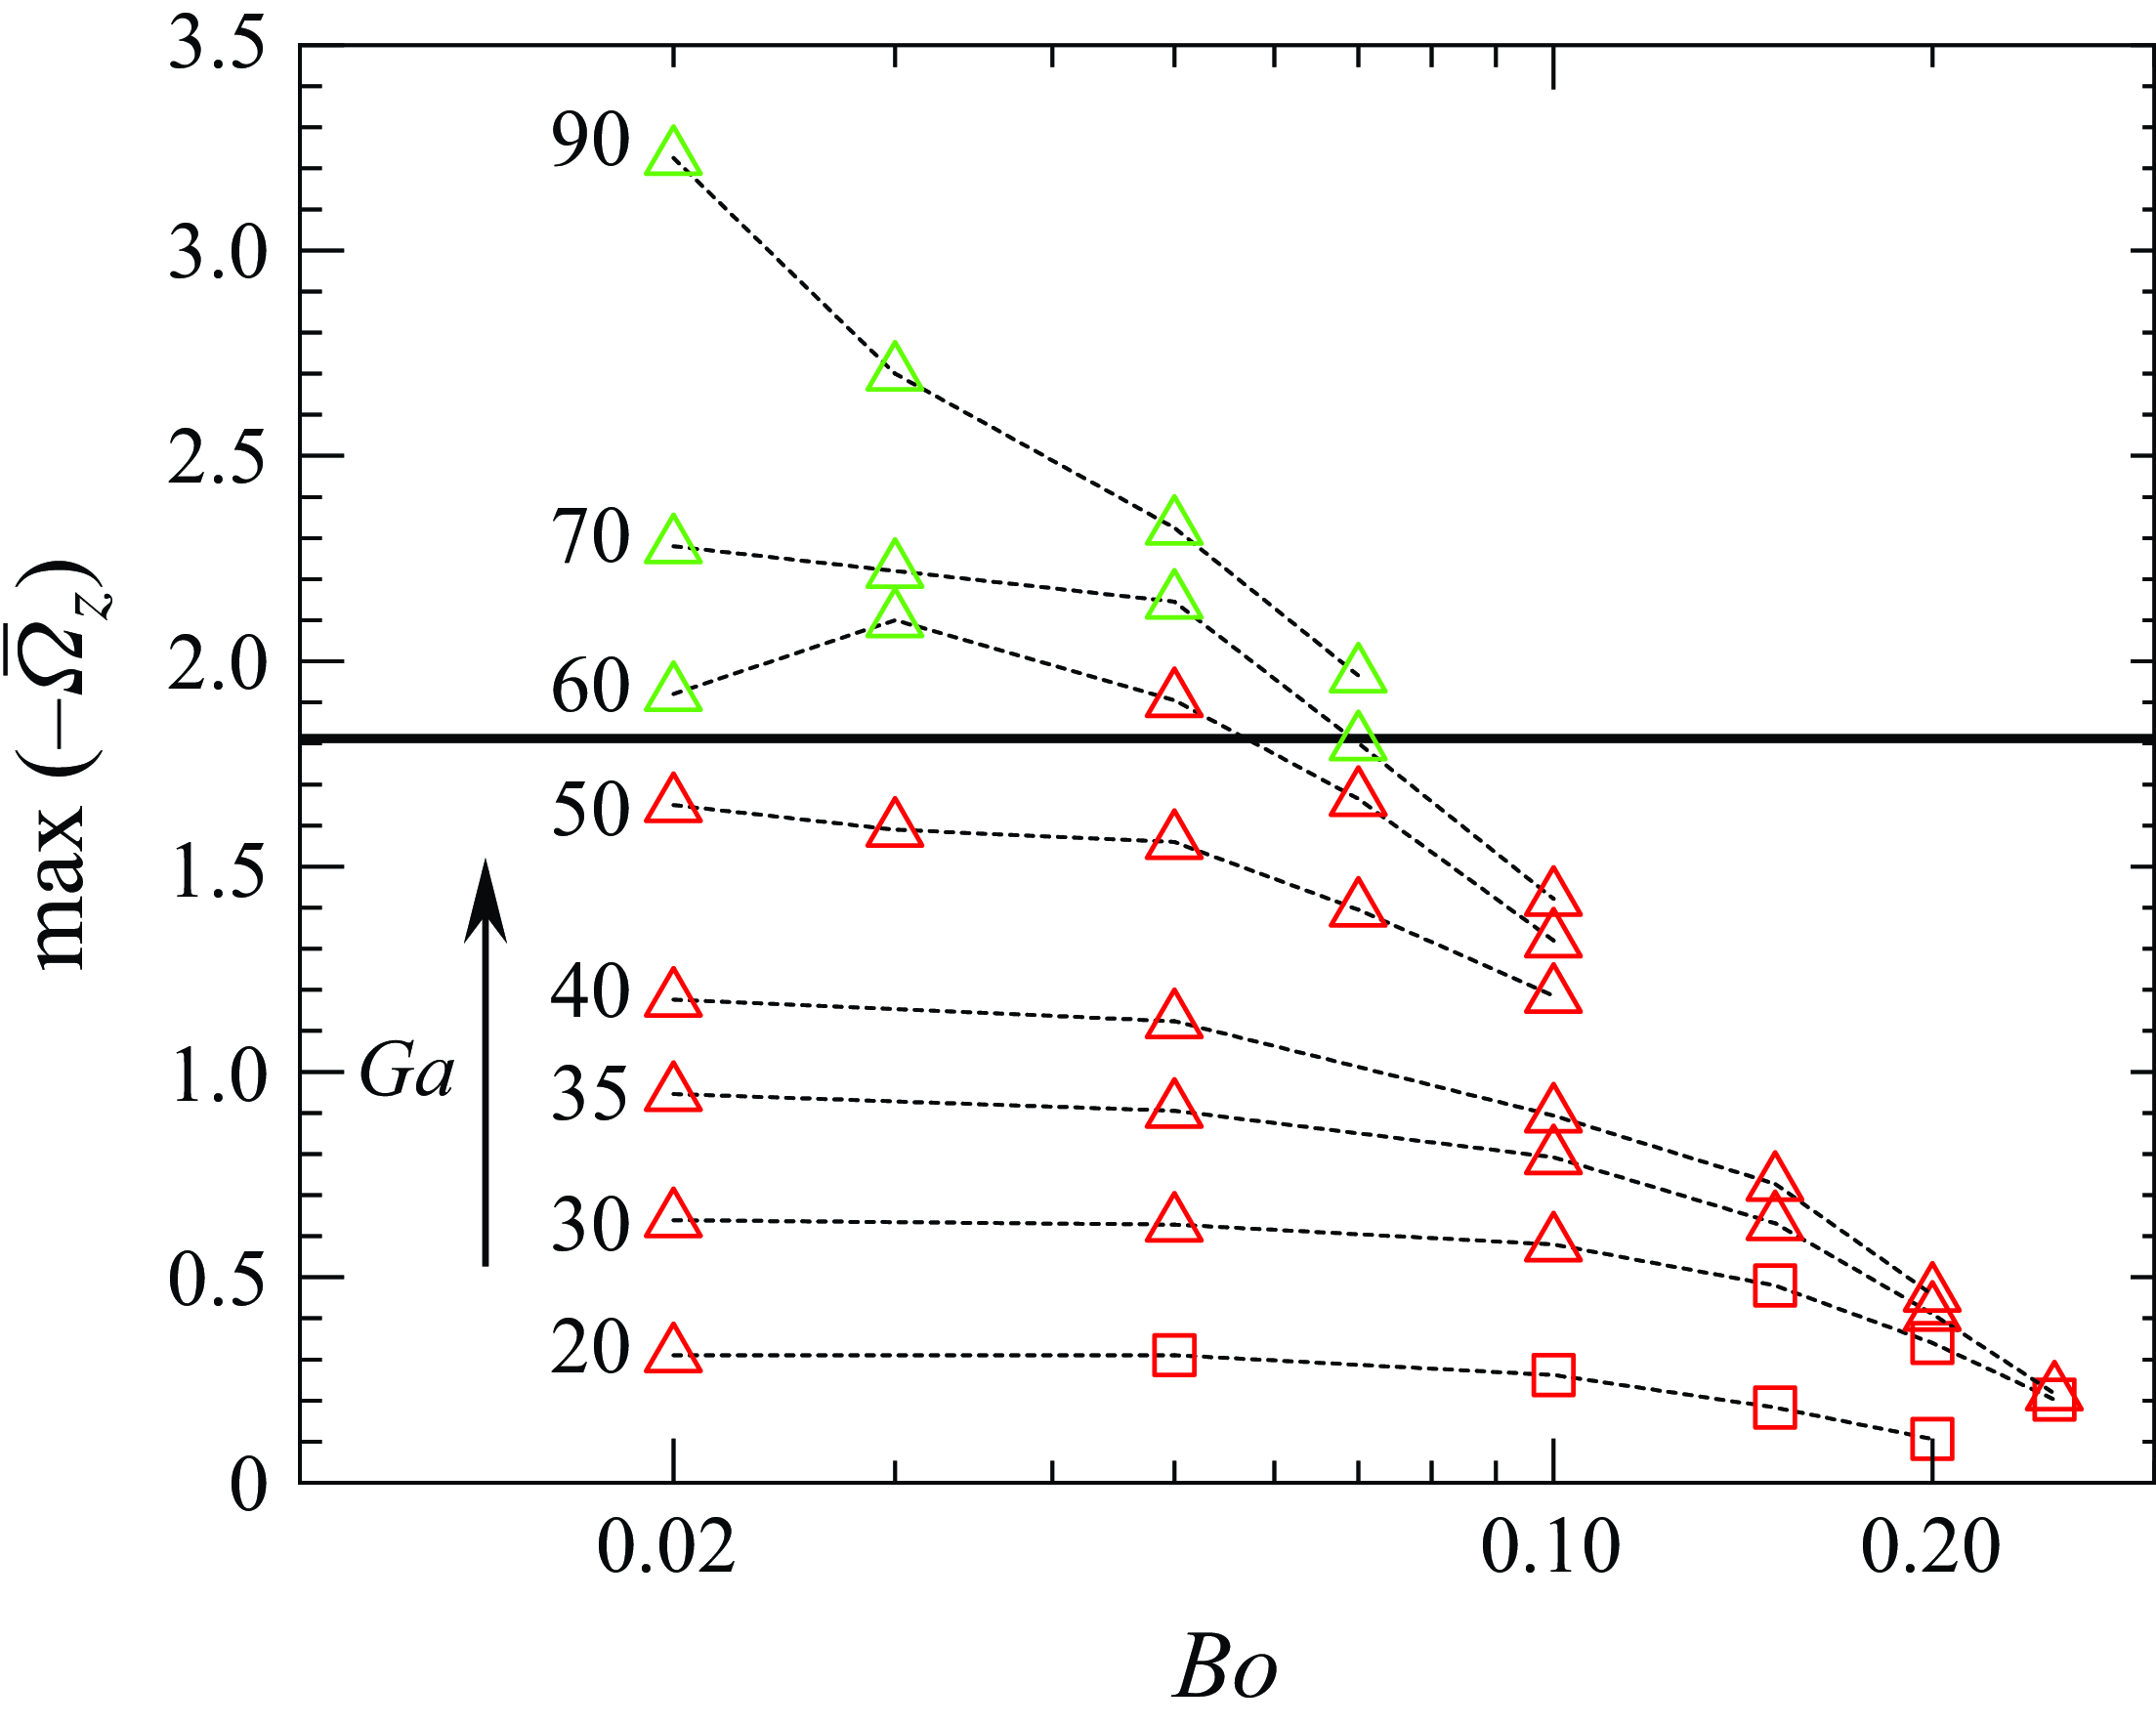
Figure 8. Variation of the maximum spinning rate with the Bond and Galilei numbers. Symbols are identical to those in figure 2. The thick horizontal line corresponds to $\textit{max} {(|\overline {{\Omega }}_z|}) = 1.8$
.
$\textit{max} {(|\overline {{\Omega }}_z|}) = 1.8$
.
The BTE regime may set in only if the spinning rate resulting from the mechanism described above is strong enough. Figure 8 displays the maximum spinning rate computed along the bubble path for all cases corresponding to a periodic bouncing or a BTE regime; some cases with $Ga\leqslant 30$
considered in Part 1 are also included. Simulations corresponding to
$Ga\leqslant 30$
considered in Part 1 are also included. Simulations corresponding to $40 \leqslant Ga \leqslant 70$
where run with an initial separation
$40 \leqslant Ga \leqslant 70$
where run with an initial separation $X_0 = 3.5$
, to ensure that the possible escape event takes place after the first collision (see Appendix B for a discussion of the influence of
$X_0 = 3.5$
, to ensure that the possible escape event takes place after the first collision (see Appendix B for a discussion of the influence of $X_0$
on the escape process). These results suggest that the bubble path transitions from the periodic bouncing regime to the BTE regime when the maximum spinning rate exceeds a critical value close to
$X_0$
on the escape process). These results suggest that the bubble path transitions from the periodic bouncing regime to the BTE regime when the maximum spinning rate exceeds a critical value close to $1.8$
.
$1.8$
.
To get some more insight into the magnitude of the Magnus-like force, an estimate of the other transverse forces acting on the bubble during its escape from the wall region is required. Some of the kinematic data provided in panels $(b)$
,
$(b)$
, $(d)$
and
$(d)$
and $(f)$
of figure 6 may be used for this purpose, noting that the bubble remains nearly spherical in the time interval
$(f)$
of figure 6 may be used for this purpose, noting that the bubble remains nearly spherical in the time interval $36\lesssim T\lesssim 40$
, as panel
$36\lesssim T\lesssim 40$
, as panel $(b)$
indicates. Consider for instance the situation at
$(b)$
indicates. Consider for instance the situation at $T=37.5$
, a moment at which the transverse velocity,
$T=37.5$
, a moment at which the transverse velocity, $V_x$
, hence the transverse quasi-steady viscous drag force, is zero. At this moment,
$V_x$
, hence the transverse quasi-steady viscous drag force, is zero. At this moment, $X_b\approx 1.6$
,
$X_b\approx 1.6$
, $V_y\approx 2.0$
,
$V_y\approx 2.0$
, $\overline \Omega _z\approx -0.95$
. Once normalised by
$\overline \Omega _z\approx -0.95$
. Once normalised by $\rho _l gR^3$
, the Magnus-like force may be written in the form
$\rho _l gR^3$
, the Magnus-like force may be written in the form $\boldsymbol{F}_L^{\text{M}}=({4}/{3})\pi C_L^\Omega \boldsymbol{\overline {\Omega }}\times \boldsymbol{V}$
, with
$\boldsymbol{F}_L^{\text{M}}=({4}/{3})\pi C_L^\Omega \boldsymbol{\overline {\Omega }}\times \boldsymbol{V}$
, with $C_L^\Omega$
being the (unknown) Magnus lift coefficient. Hence, the wall-normal component of this force at this position is approximately
$C_L^\Omega$
being the (unknown) Magnus lift coefficient. Hence, the wall-normal component of this force at this position is approximately $7.95C_L^\Omega$
. At the same transverse position, the attractive force
$7.95C_L^\Omega$
. At the same transverse position, the attractive force $\boldsymbol{F}_P=-({\pi }/{2})C_PV_y^2{\textbf {e}}_x$
resulting from the Bernoulli effect is close to
$\boldsymbol{F}_P=-({\pi }/{2})C_PV_y^2{\textbf {e}}_x$
resulting from the Bernoulli effect is close to $-0.38$
, based on the estimate of the interaction coefficient
$-0.38$
, based on the estimate of the interaction coefficient $C_P(X_b=1.6)\approx 0.06$
resulting from equation 7 of Takemura & Magnaudet (Reference Takemura and Magnaudet2003). As discussed in Part 1, there is a large uncertainty in the magnitude of the transverse component of the inertia-induced force, owing to the unknown contribution of the trailing vortices entrained laterally by the bubble. With all due caution, an order-of-magnitude estimate of this force may be obtained by neglecting this contribution. With this assumption, the transverse inertia-induced force,
$C_P(X_b=1.6)\approx 0.06$
resulting from equation 7 of Takemura & Magnaudet (Reference Takemura and Magnaudet2003). As discussed in Part 1, there is a large uncertainty in the magnitude of the transverse component of the inertia-induced force, owing to the unknown contribution of the trailing vortices entrained laterally by the bubble. With all due caution, an order-of-magnitude estimate of this force may be obtained by neglecting this contribution. With this assumption, the transverse inertia-induced force, $\boldsymbol{F}_I\cdot {{e}}_x=-({4}/{3})\pi C_I\text{d}V_x/\text{d}T$
may be estimated by simply considering that the inertia-induced coefficient,
$\boldsymbol{F}_I\cdot {{e}}_x=-({4}/{3})\pi C_I\text{d}V_x/\text{d}T$
may be estimated by simply considering that the inertia-induced coefficient, $C_I$
, is close to the familiar added-mass coefficient of a sphere accelerating in an unbounded fluid, i.e.
$C_I$
, is close to the familiar added-mass coefficient of a sphere accelerating in an unbounded fluid, i.e. $C_I\approx {1}/{2}$
. With
$C_I\approx {1}/{2}$
. With $\textrm{d}V_x/\textrm{d}T\approx 1.45$
at
$\textrm{d}V_x/\textrm{d}T\approx 1.45$
at $T=37.5$
, this estimate yields
$T=37.5$
, this estimate yields $\boldsymbol{F}_I\cdot {\textbf {e}}_x\approx -3.04$
, suggesting that this contribution dominates the overall force that resists the bubble escape. Summing the two resistive contributions and assuming that the repulsive Magnus-like force is almost in balance with the overall attractive force implies
$\boldsymbol{F}_I\cdot {\textbf {e}}_x\approx -3.04$
, suggesting that this contribution dominates the overall force that resists the bubble escape. Summing the two resistive contributions and assuming that the repulsive Magnus-like force is almost in balance with the overall attractive force implies $C_L^\Omega \approx 0.43$
. A similar estimate may be performed at
$C_L^\Omega \approx 0.43$
. A similar estimate may be performed at $T=38.3$
, a moment when the gap thickness equals the bubble radius (
$T=38.3$
, a moment when the gap thickness equals the bubble radius ( $X_b=2.0$
), so that
$X_b=2.0$
), so that $C_P\approx 0.024$
. At this moment,
$C_P\approx 0.024$
. At this moment, $V_x\approx 1.0$
,
$V_x\approx 1.0$
, $V_y\approx 1.6$
,
$V_y\approx 1.6$
, $\overline \Omega _z\approx -0.6$
and
$\overline \Omega _z\approx -0.6$
and $\textrm{d}V_x/\textrm{d}T\approx 0.8$
, which yields
$\textrm{d}V_x/\textrm{d}T\approx 0.8$
, which yields $\boldsymbol{F}_P\cdot {\textbf {e}}_x\approx -0.1$
and
$\boldsymbol{F}_P\cdot {\textbf {e}}_x\approx -0.1$
and $\boldsymbol{F}_I\cdot {\textbf {e}}_x\approx -1.68$
. At this position, the Reynolds number
$\boldsymbol{F}_I\cdot {\textbf {e}}_x\approx -1.68$
. At this position, the Reynolds number $Re=2Ga(V_x^2+V_y^2)^{1/2}$
is close to
$Re=2Ga(V_x^2+V_y^2)^{1/2}$
is close to $265$
, making it possible to estimate the quasi-steady transverse drag force using Moore’s high-Reynolds-number prediction (Moore Reference Moore1963). In the present notations, this yields
$265$
, making it possible to estimate the quasi-steady transverse drag force using Moore’s high-Reynolds-number prediction (Moore Reference Moore1963). In the present notations, this yields $\boldsymbol{F}_D\cdot {\textbf {e}}_x\approx -12\pi (1-2.2Re^{-1/2})Ga^{-1}V_x\approx -0.47$
. Adding all three attractive contributions together and balancing with the Magnus-like force now implies
$\boldsymbol{F}_D\cdot {\textbf {e}}_x\approx -12\pi (1-2.2Re^{-1/2})Ga^{-1}V_x\approx -0.47$
. Adding all three attractive contributions together and balancing with the Magnus-like force now implies $C_L^\Omega \approx 0.56$
. The above two predictions for the Magnus lift coefficient, corroborated by similar estimates for other
$C_L^\Omega \approx 0.56$
. The above two predictions for the Magnus lift coefficient, corroborated by similar estimates for other $(Bo,Ga)$
sets, suggest that
$(Bo,Ga)$
sets, suggest that $C_L^\Omega \approx 0.5\pm 0.07$
. Although this result is reminiscent of the well-known inviscid prediction for the lift coefficient
$C_L^\Omega \approx 0.5\pm 0.07$
. Although this result is reminiscent of the well-known inviscid prediction for the lift coefficient $C_L^s$
of a sphere immersed in a weak linear shear flow,
$C_L^s$
of a sphere immersed in a weak linear shear flow, $C_L^s={1}/{2}$
, this is presumably largely coincidental given the very different nature of the present conditions, in which unsteadiness, flow inhomogeneity and wall vicinity play a central role.
$C_L^s={1}/{2}$
, this is presumably largely coincidental given the very different nature of the present conditions, in which unsteadiness, flow inhomogeneity and wall vicinity play a central role.
5. Regimes encountered beyond the path instability threshold
5.1. The WMA regime
The first phenomenology encountered beyond the neutral curve, at least up to $Ga=90$
, corresponds to the WMA regime. To illustrate this regime, we select a bubble with
$Ga=90$
, corresponds to the WMA regime. To illustrate this regime, we select a bubble with $(Bo, Ga) = (1.5, 50)$
, i.e. a Morton number
$(Bo, Ga) = (1.5, 50)$
, i.e. a Morton number $Mo=5.4 \times 10^{-7}$
, close to that of silicone oil DMS-T05. According to figure 2
$Mo=5.4 \times 10^{-7}$
, close to that of silicone oil DMS-T05. According to figure 2 $(a)$
, the associated conditions are by far supercritical, since the critical Bond number for this specific liquid is close to
$(a)$
, the associated conditions are by far supercritical, since the critical Bond number for this specific liquid is close to $0.85$
.
$0.85$
.
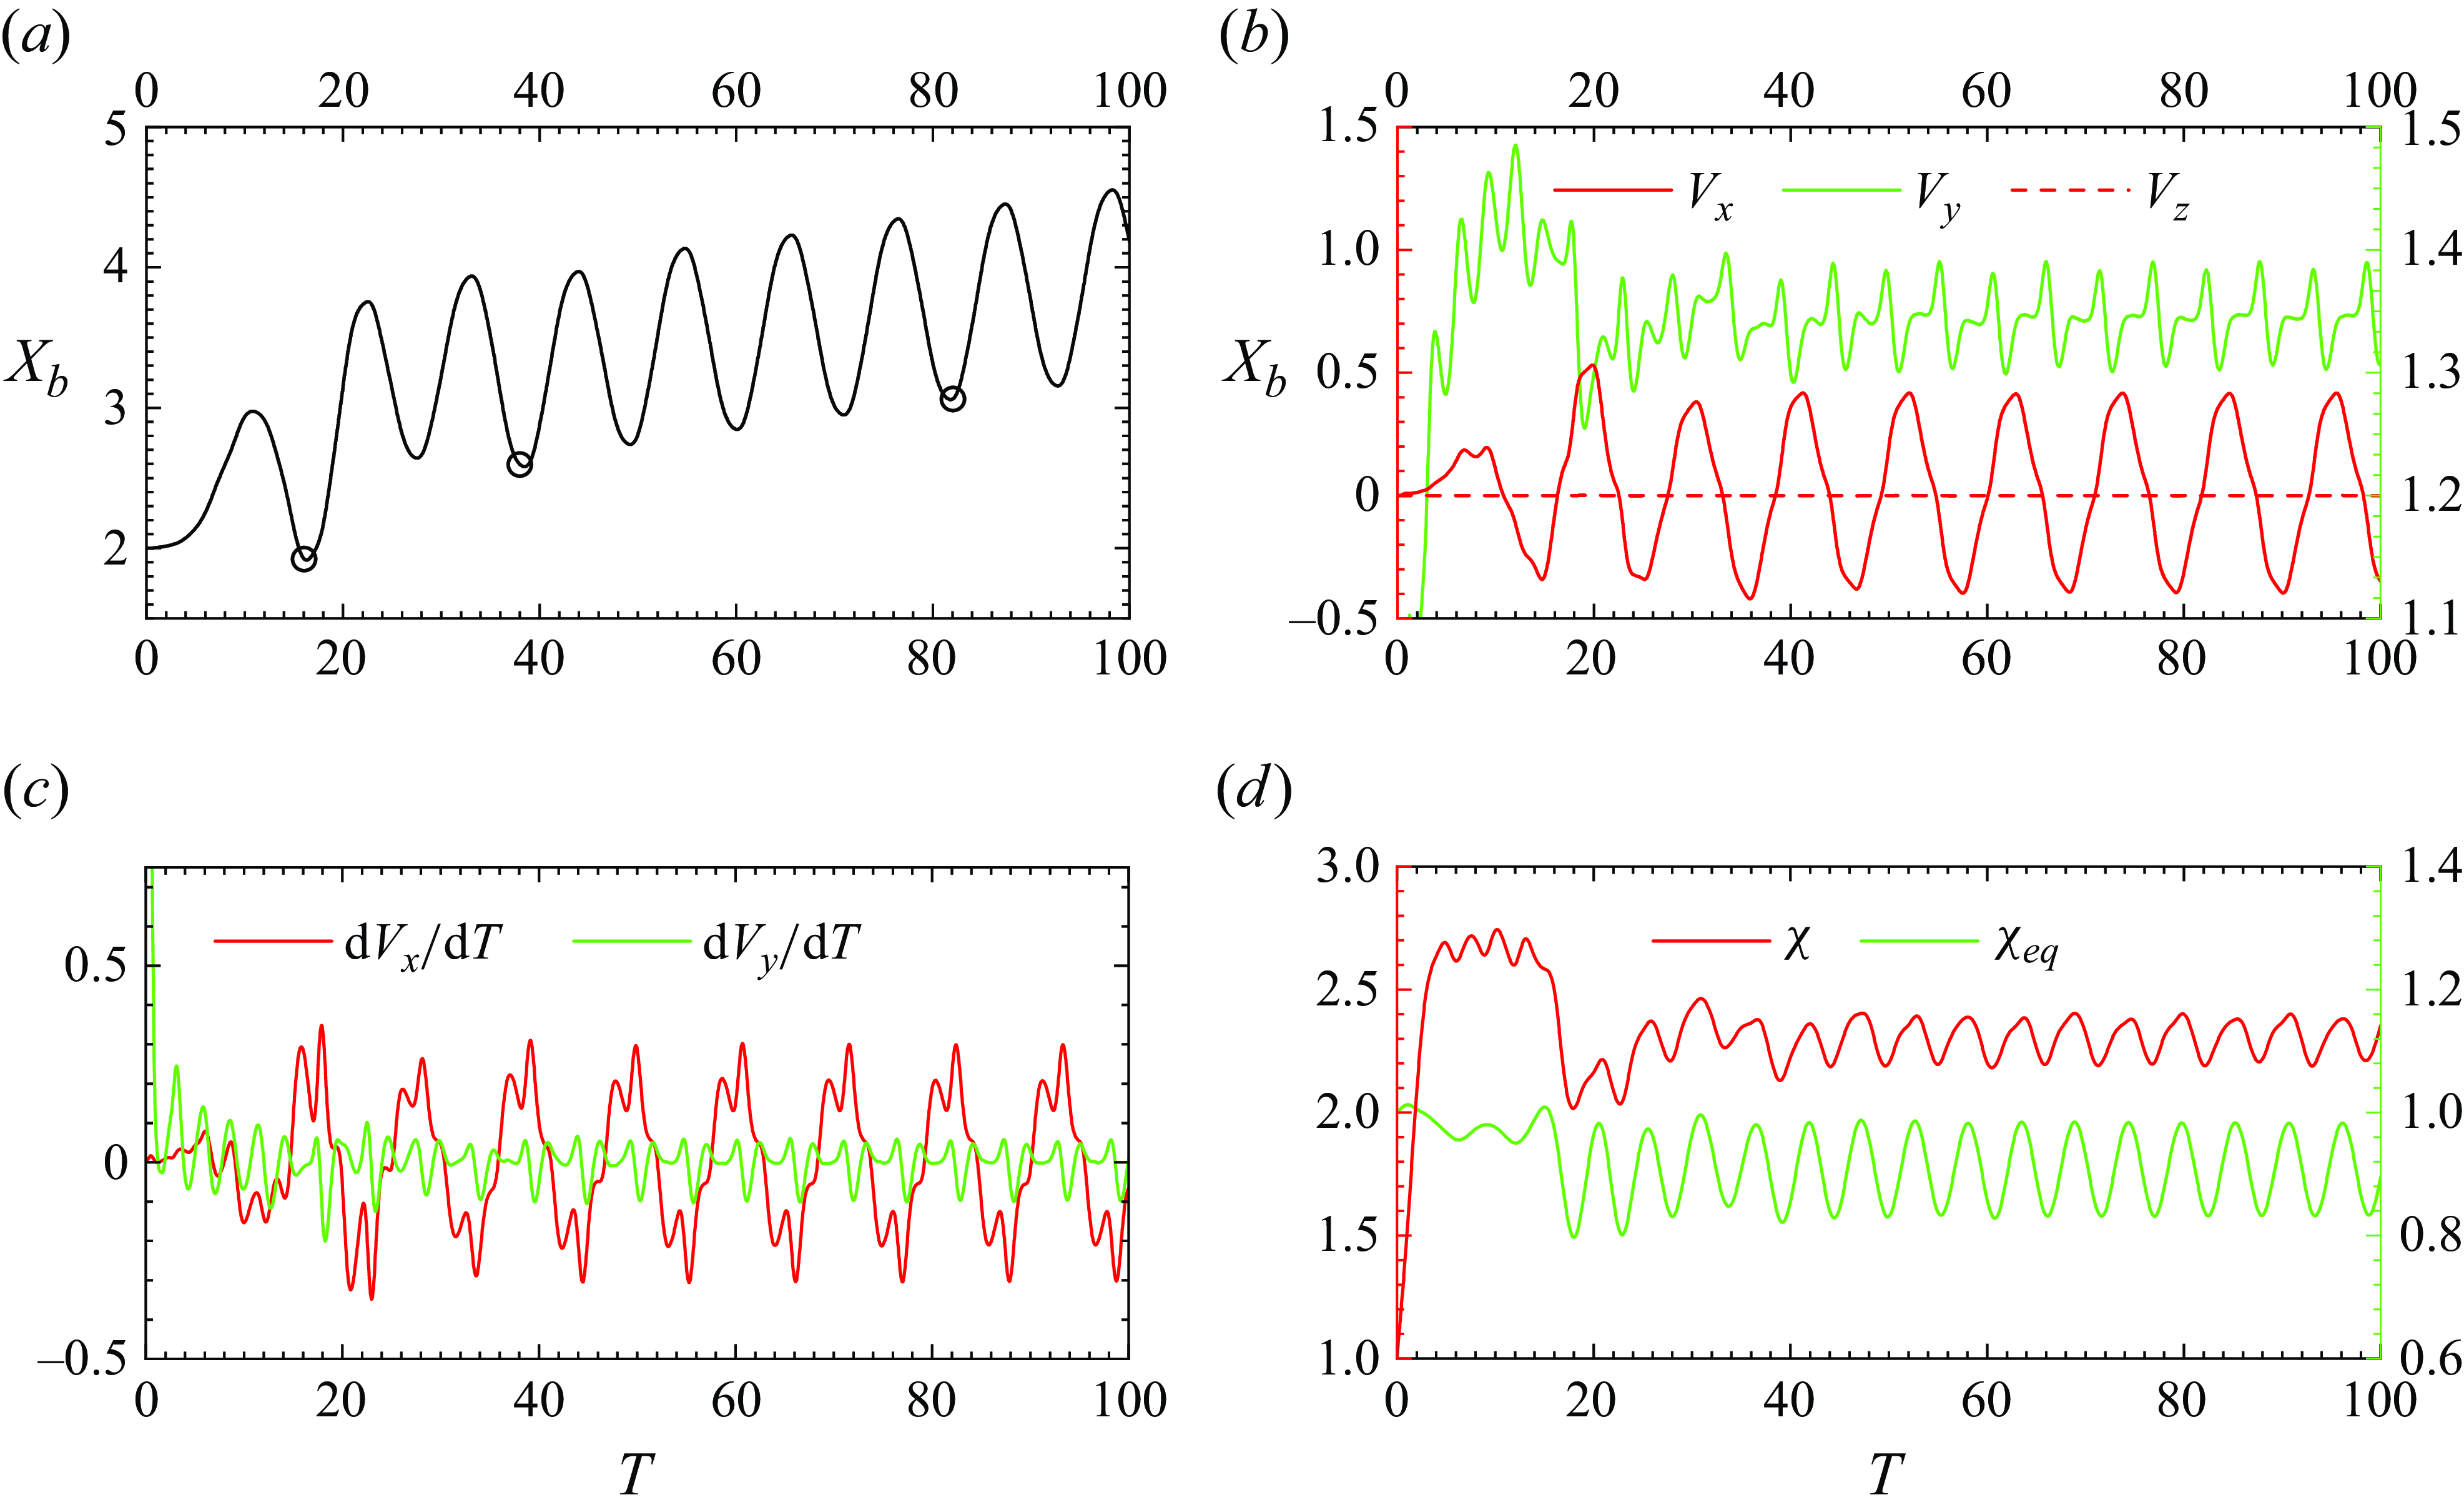
Figure 9. Evolution of various characteristics of the bubble path and geometry during the lateral migration of a bubble with $(Bo, Ga) = (1.5, 50)$
. (
$(Bo, Ga) = (1.5, 50)$
. ( $a$
) Wall-normal position of the centroid; (
$a$
) Wall-normal position of the centroid; ( $b$
) wall-normal (solid red, left axis), horizontal wall-parallel (dashed red, left axis) and vertical (solid green, right axis) components of the bubble centroid velocity; (
$b$
) wall-normal (solid red, left axis), horizontal wall-parallel (dashed red, left axis) and vertical (solid green, right axis) components of the bubble centroid velocity; ( $c$
) wall-normal (red) and vertical (green) acceleration of the centroid; (
$c$
) wall-normal (red) and vertical (green) acceleration of the centroid; ( $d$
) principal bubble aspect ratio (red, left axis) and equatorial axes ratio (green, right axis). The three circles in
$d$
) principal bubble aspect ratio (red, left axis) and equatorial axes ratio (green, right axis). The three circles in $(a)$
identify the first three moments at which the wake structure is shown in figure 10.
$(a)$
identify the first three moments at which the wake structure is shown in figure 10.
Figure 9 shows how the characteristics of the path and geometry of this bubble evolve as it rises. Panels $(a-b)$
indicate that path instability quickly sets in and saturates after a few cycles of oscillations. Path oscillations take place in the wall-normal plane and give rise to a planar zigzagging motion, since the horizontal wall-parallel velocity component,
$(a-b)$
indicate that path instability quickly sets in and saturates after a few cycles of oscillations. Path oscillations take place in the wall-normal plane and give rise to a planar zigzagging motion, since the horizontal wall-parallel velocity component, $V_z$
, remains vanishingly small throughout the bubble ascent. At the same time, the bubble gradually migrates away from the wall with, according to panel
$V_z$
, remains vanishingly small throughout the bubble ascent. At the same time, the bubble gradually migrates away from the wall with, according to panel $(a)$
, an average drift velocity close to
$(a)$
, an average drift velocity close to $0.01$
, much smaller than the maximum of
$0.01$
, much smaller than the maximum of $V_x$
, which is close to
$V_x$
, which is close to $0.4$
. The evolution of this velocity component is far from being perfectly sinusoidal, indicating that the dynamics of the zigzagging motion is nonlinear. This nonlinearity is further highlighted in panel
$0.4$
. The evolution of this velocity component is far from being perfectly sinusoidal, indicating that the dynamics of the zigzagging motion is nonlinear. This nonlinearity is further highlighted in panel $(c)$
, which shows the evolution of the transverse and vertical accelerations. In particular, the time record of
$(c)$
, which shows the evolution of the transverse and vertical accelerations. In particular, the time record of $\textrm{d}V_x/\textrm{d}T$
exhibits small oscillations with a frequency five times larger than that of the primary oscillations. The vertical velocity also exhibits strongly non-sinusoidal oscillations which make the bubble rise speed vary upon time by
$\textrm{d}V_x/\textrm{d}T$
exhibits small oscillations with a frequency five times larger than that of the primary oscillations. The vertical velocity also exhibits strongly non-sinusoidal oscillations which make the bubble rise speed vary upon time by $7.5\,\%$
. According to panel
$7.5\,\%$
. According to panel $(b)$
, the primary oscillations of
$(b)$
, the primary oscillations of $V_x$
have a frequency
$V_x$
have a frequency $\overline {f} = 0.092$
, in perfect agreement with the predictions of the linear stability analysis performed by Bonnefis et al. (Reference Bonnefis, Sierra-Ausin, Fabre and Magnaudet2024) with a deformable bubble rising in an unbounded fluid (see their figure 10
$\overline {f} = 0.092$
, in perfect agreement with the predictions of the linear stability analysis performed by Bonnefis et al. (Reference Bonnefis, Sierra-Ausin, Fabre and Magnaudet2024) with a deformable bubble rising in an unbounded fluid (see their figure 10 $b$
). The same study revealed that a secondary mode becomes unstable when
$b$
). The same study revealed that a secondary mode becomes unstable when $Bo$
exceeds the critical value
$Bo$
exceeds the critical value $1.38$
(their figure 10
$1.38$
(their figure 10 $a$
). This mode corresponds to axisymmetric shape oscillations about the bubble minor axis (so-called
$a$
). This mode corresponds to axisymmetric shape oscillations about the bubble minor axis (so-called $(2, 0)$
oscillatory mode for oblate spheroids). The predictions of Bonnefis et al. (Reference Bonnefis, Sierra-Ausin, Fabre and Magnaudet2024) indicate that, for
$(2, 0)$
oscillatory mode for oblate spheroids). The predictions of Bonnefis et al. (Reference Bonnefis, Sierra-Ausin, Fabre and Magnaudet2024) indicate that, for $(Bo, Ga) = (1.5, 50)$
, the frequency of these shape oscillations is
$(Bo, Ga) = (1.5, 50)$
, the frequency of these shape oscillations is $5.5$
larger than that of path oscillations, close to the ratio of five noticed in panel
$5.5$
larger than that of path oscillations, close to the ratio of five noticed in panel $(c)$
. This proximity strongly suggests that the high-frequency oscillations present in the evolutions of the velocity and acceleration components in figure 9 are the footprint of this mode of shape oscillations.
$(c)$
. This proximity strongly suggests that the high-frequency oscillations present in the evolutions of the velocity and acceleration components in figure 9 are the footprint of this mode of shape oscillations.
Besides these small-amplitude high-frequency oscillations, figure 9 $(d)$
makes it clear that the bubble undergoes significant periodic shape variations along its path. Both the principal aspect ratio,
$(d)$
makes it clear that the bubble undergoes significant periodic shape variations along its path. Both the principal aspect ratio, $\chi$
, and the equatorial axes ratio,
$\chi$
, and the equatorial axes ratio, $\chi_{eq}$
, reach their minimum at the extremities of each zigzag, where
$\chi_{eq}$
, reach their minimum at the extremities of each zigzag, where $V_x$
vanishes and
$V_x$
vanishes and $\textrm{d}V_x/\textrm{d}T$
reaches its extrema. These simultaneous variations indicate that the bubble experiences a periodic compression/dilatation along the equatorial axis lying in the wall-normal plane (the
$\textrm{d}V_x/\textrm{d}T$
reaches its extrema. These simultaneous variations indicate that the bubble experiences a periodic compression/dilatation along the equatorial axis lying in the wall-normal plane (the $x^{\prime}$
-axis with length
$x^{\prime}$
-axis with length $b$
in figure 1
$b$
in figure 1 $b$
). Examination of bubble contours in the appropriate planes (not shown) reveals that these variations are accompanied by simultaneous phase-opposed oscillations along the
$b$
). Examination of bubble contours in the appropriate planes (not shown) reveals that these variations are accompanied by simultaneous phase-opposed oscillations along the $z^{\prime}$
-equatorial axis, while the bubble keeps an almost constant length along the
$z^{\prime}$
-equatorial axis, while the bubble keeps an almost constant length along the $y^{\prime}$
-minor axis. Therefore, the observed changes in
$y^{\prime}$
-minor axis. Therefore, the observed changes in $\chi$
and
$\chi$
and $\chi_{eq}$
appear to be driven by pressure variations whose wavelength is half the perimeter of the bubble contour lying in the equatorial
$\chi_{eq}$
appear to be driven by pressure variations whose wavelength is half the perimeter of the bubble contour lying in the equatorial $(x^{\prime},z^{\prime})$
-plane. These oscillations are induced by (and enslaved to) the transverse motion of the bubble. So, their dynamics is distinct from that of natural shape oscillations of bubbles rising in a straight line, as underlined by their much smaller frequency. Note that the wall plays no role in this dynamics, since the figure makes it clear that the minima reached by
$(x^{\prime},z^{\prime})$
-plane. These oscillations are induced by (and enslaved to) the transverse motion of the bubble. So, their dynamics is distinct from that of natural shape oscillations of bubbles rising in a straight line, as underlined by their much smaller frequency. Note that the wall plays no role in this dynamics, since the figure makes it clear that the minima reached by $\chi$
and
$\chi$
and $\chi_{eq}$
are identical at both ends of a given zigzag, i.e. they do not depend on the instantaneous wall-normal position of the bubble. In addition to these zigzag-driven oscillations, the bubble shape exhibits a marked asymmetry along the
$\chi_{eq}$
are identical at both ends of a given zigzag, i.e. they do not depend on the instantaneous wall-normal position of the bubble. In addition to these zigzag-driven oscillations, the bubble shape exhibits a marked asymmetry along the $x^{\prime}$
-axis, with its vertical cross section taking an egg-like shape pointing towards the exterior of the zigzag (see figure 10).This asymmetry is not related to the presence of the wall. Rather, as analysed by Cano-Lozano et al. (Reference Cano-Lozano, Martínez-Bazán, Magnaudet and Tchoufag2016), it results from the periodic rotation of the bubble about the
$x^{\prime}$
-axis, with its vertical cross section taking an egg-like shape pointing towards the exterior of the zigzag (see figure 10).This asymmetry is not related to the presence of the wall. Rather, as analysed by Cano-Lozano et al. (Reference Cano-Lozano, Martínez-Bazán, Magnaudet and Tchoufag2016), it results from the periodic rotation of the bubble about the $z^{\prime}$
-axis, which lowers (increases) the pressure on the part of the surface located the farthest from (the closest to) the zigzag centreline.
$z^{\prime}$
-axis, which lowers (increases) the pressure on the part of the surface located the farthest from (the closest to) the zigzag centreline.
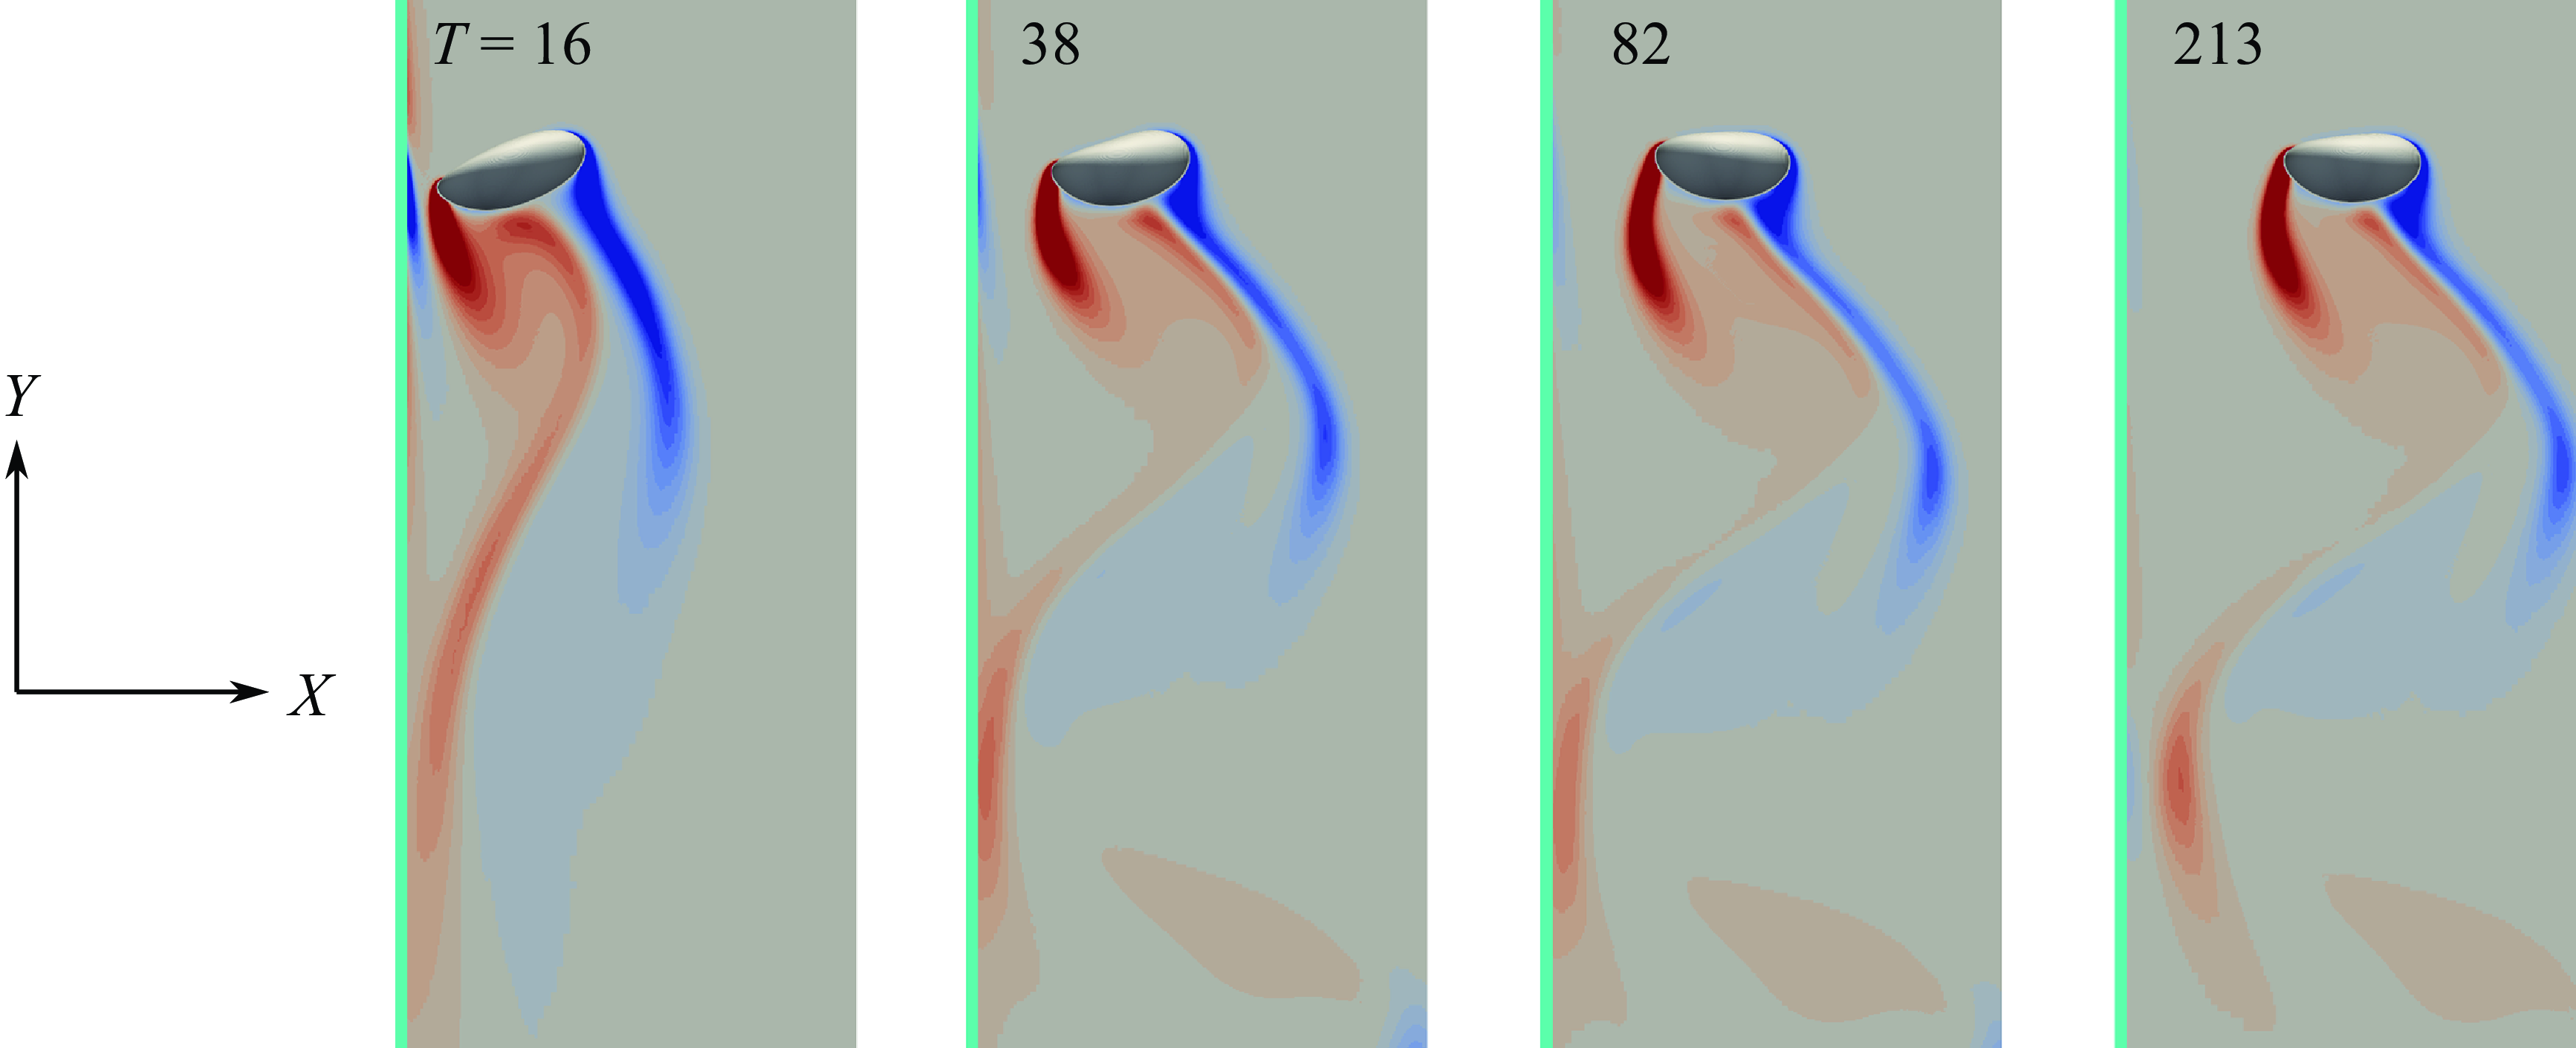
Figure 10. Distribution of the spanwise vorticity, $\overline {\omega }_z$
, in the symmetry plane
$\overline {\omega }_z$
, in the symmetry plane $Z = Z_b$
past a bubble with
$Z = Z_b$
past a bubble with $(Bo, Ga) = (1.5, 50)$
at several moments when it reaches the wall-facing extremity of a zigzag (circles in figure 9
$(Bo, Ga) = (1.5, 50)$
at several moments when it reaches the wall-facing extremity of a zigzag (circles in figure 9 $a$
). Red and blue iso-contours refer to positive and negative values of
$a$
). Red and blue iso-contours refer to positive and negative values of $\overline {\omega }_z$
, respectively, with a maximum magnitude of
$\overline {\omega }_z$
, respectively, with a maximum magnitude of $2.0$
.
$2.0$
.
Figure 10 shows how the distribution of the spanwise vorticity evolves as the bubble moves progressively away from the wall. The four snapshots are taken at moments when the bubble reaches the wall-facing extremity of a zigzag. A wall layer with significant $\overline {\omega }_z$
-values is present, even ahead of the bubble, at
$\overline {\omega }_z$
-values is present, even ahead of the bubble, at $T=16$
, with in particular a stripe of intense negative vorticity (corresponding to a downstream flow) in the bubble–wall gap. This structure still subsists at
$T=16$
, with in particular a stripe of intense negative vorticity (corresponding to a downstream flow) in the bubble–wall gap. This structure still subsists at $T=38$
, albeit with a much weaker intensity, and disappears in later times. Only in the downstream region located several radii downstream of the bubble do significant non-zero values of
$T=38$
, albeit with a much weaker intensity, and disappears in later times. Only in the downstream region located several radii downstream of the bubble do significant non-zero values of $\overline {\omega }_z$
subsist close to the wall. This is where the wake still weakly interacts with the wall, generating a small repulsive force responsible for the average migration through the familiar vortical mechanism summarised in § 1 and already active in finite-to-moderately inertial regimes. To summarise, apart from the early stages of the rise, present observations only detect weak interactions of the wake with the wall, and reveal a close agreement with the global stability predictions of Bonnefis et al. (Reference Bonnefis, Sierra-Ausin, Fabre and Magnaudet2024) in an unbounded fluid regarding the characteristics of the zigzagging motion. Combining both aspects leads us to the conclusion that the WMA regime consists essentially of the superposition of the oscillating path resulting from the path instability mechanism in an unbounded flow (with the wall only dictating the orientation of the symmetry plane of the path), and the gradual wake-induced migration away from the wall already active at lower
$\overline {\omega }_z$
subsist close to the wall. This is where the wake still weakly interacts with the wall, generating a small repulsive force responsible for the average migration through the familiar vortical mechanism summarised in § 1 and already active in finite-to-moderately inertial regimes. To summarise, apart from the early stages of the rise, present observations only detect weak interactions of the wake with the wall, and reveal a close agreement with the global stability predictions of Bonnefis et al. (Reference Bonnefis, Sierra-Ausin, Fabre and Magnaudet2024) in an unbounded fluid regarding the characteristics of the zigzagging motion. Combining both aspects leads us to the conclusion that the WMA regime consists essentially of the superposition of the oscillating path resulting from the path instability mechanism in an unbounded flow (with the wall only dictating the orientation of the symmetry plane of the path), and the gradual wake-induced migration away from the wall already active at lower $Ga$
, especially with moderately deformed bubbles (see figure 16). The same conclusion holds in the WMA scenario observed with spiralling bubbles. In particular, we examined the path and dynamics of a bubble with
$Ga$
, especially with moderately deformed bubbles (see figure 16). The same conclusion holds in the WMA scenario observed with spiralling bubbles. In particular, we examined the path and dynamics of a bubble with $(Bo, Ga) = (2, 60)$
rising in silicone oil DMS-T05 and found that once its wake, made of a pair of vortex threads wrapped around one another, is fully developed, it only weakly interacts with the wall in a manner similar to that displayed in figure 10.
$(Bo, Ga) = (2, 60)$
rising in silicone oil DMS-T05 and found that once its wake, made of a pair of vortex threads wrapped around one another, is fully developed, it only weakly interacts with the wall in a manner similar to that displayed in figure 10.

Figure 11. Influence of the Bond and Galilei numbers on the evolution of the wall-normal position of the bubble centroid in the WMA regime. $(a)$
Increasing
$(a)$
Increasing $Ga$
at fixed
$Ga$
at fixed $Bo$
;
$Bo$
; $(b)$
increasing
$(b)$
increasing $Bo$
at fixed
$Bo$
at fixed $Ga$
.
$Ga$
.
Figure 11 gathers some records of the bubble path for various $Ga$
at
$Ga$
at $Bo=1.5$
(panel
$Bo=1.5$
(panel $a$
), and for various
$a$
), and for various $Bo$
at
$Bo$
at $Ga=50$
(panel
$Ga=50$
(panel $b$
). Clearly, the average velocity with which the bubble migrates away from the wall varies non-monotonically with the control parameters in both cases. For instance, the fastest migration in panel
$b$
). Clearly, the average velocity with which the bubble migrates away from the wall varies non-monotonically with the control parameters in both cases. For instance, the fastest migration in panel $(a)$
is seen to be reached for
$(a)$
is seen to be reached for $Ga=50$
(blue curve), while the slowest one is obtained for
$Ga=50$
(blue curve), while the slowest one is obtained for $Ga=60$
(purple), with the two evolutions corresponding to
$Ga=60$
(purple), with the two evolutions corresponding to $Ga=40$
(green) and
$Ga=40$
(green) and $70$
(orange) exhibiting intermediate migration velocities. Noting that in the saturated stage the amplitude of the zigzagging motions experiences little variation with
$70$
(orange) exhibiting intermediate migration velocities. Noting that in the saturated stage the amplitude of the zigzagging motions experiences little variation with $Ga$
, it appears that the early stages of the path are responsible for the most part of the non-monotonic variations of the average migration velocity. For a fixed
$Ga$
, it appears that the early stages of the path are responsible for the most part of the non-monotonic variations of the average migration velocity. For a fixed $Bo$
, the higher
$Bo$
, the higher $Ga$
the larger the growth rate of the zigzagging motion, since increasing
$Ga$
the larger the growth rate of the zigzagging motion, since increasing $Ga$
increases the distance to the path instability threshold. For this reason, the transverse oscillations of paths corresponding to
$Ga$
increases the distance to the path instability threshold. For this reason, the transverse oscillations of paths corresponding to $Ga=60$
and
$Ga=60$
and $70$
quickly reach a large amplitude, which, at the end of the first cycle of oscillations, brings the bubbles closer to the wall than at the time of their injection (e.g.
$70$
quickly reach a large amplitude, which, at the end of the first cycle of oscillations, brings the bubbles closer to the wall than at the time of their injection (e.g. $X_b\approx 1.6$
at
$X_b\approx 1.6$
at $T=16$
for
$T=16$
for $Ga=60$
). Taking the bubble with
$Ga=60$
). Taking the bubble with $Ga=35$
as reference, this induces a delay in the average migration of bubbles with a higher
$Ga=35$
as reference, this induces a delay in the average migration of bubbles with a higher $Ga$
that is never caught up in later stages. Similarly, when
$Ga$
that is never caught up in later stages. Similarly, when $Ga$
is kept fixed and
$Ga$
is kept fixed and $Bo$
is increased, the bubble closest to the path instability threshold (
$Bo$
is increased, the bubble closest to the path instability threshold ( $Bo=0.35$
, red line in panel
$Bo=0.35$
, red line in panel $b$
) quickly reaches average distances from the wall larger than bubbles with
$b$
) quickly reaches average distances from the wall larger than bubbles with $Bo=0.5$
(green) and
$Bo=0.5$
(green) and $Bo=1$
(blue), whose zigzags amplitude grows faster. However, at saturation, these amplitudes greatly vary with the Bond number, i.e. with the bubble shape, passing through a maximum for
$Bo=1$
(blue), whose zigzags amplitude grows faster. However, at saturation, these amplitudes greatly vary with the Bond number, i.e. with the bubble shape, passing through a maximum for $Bo=0.5$
(see § 5.3 for more discussion on this aspect). As a result of this marked variation, the amplitude of the zigzags performed by the bubble with
$Bo=0.5$
(see § 5.3 for more discussion on this aspect). As a result of this marked variation, the amplitude of the zigzags performed by the bubble with $Bo=0.5$
is twice as large as that of the bubble with
$Bo=0.5$
is twice as large as that of the bubble with $Bo=1.5$
. This is why the latter migrates faster than those with
$Bo=1.5$
. This is why the latter migrates faster than those with $Bo=1$
and
$Bo=1$
and $0.5$
which spend more time close to the wall throughout their ascent.
$0.5$
which spend more time close to the wall throughout their ascent.
5.2. The NWZ regime
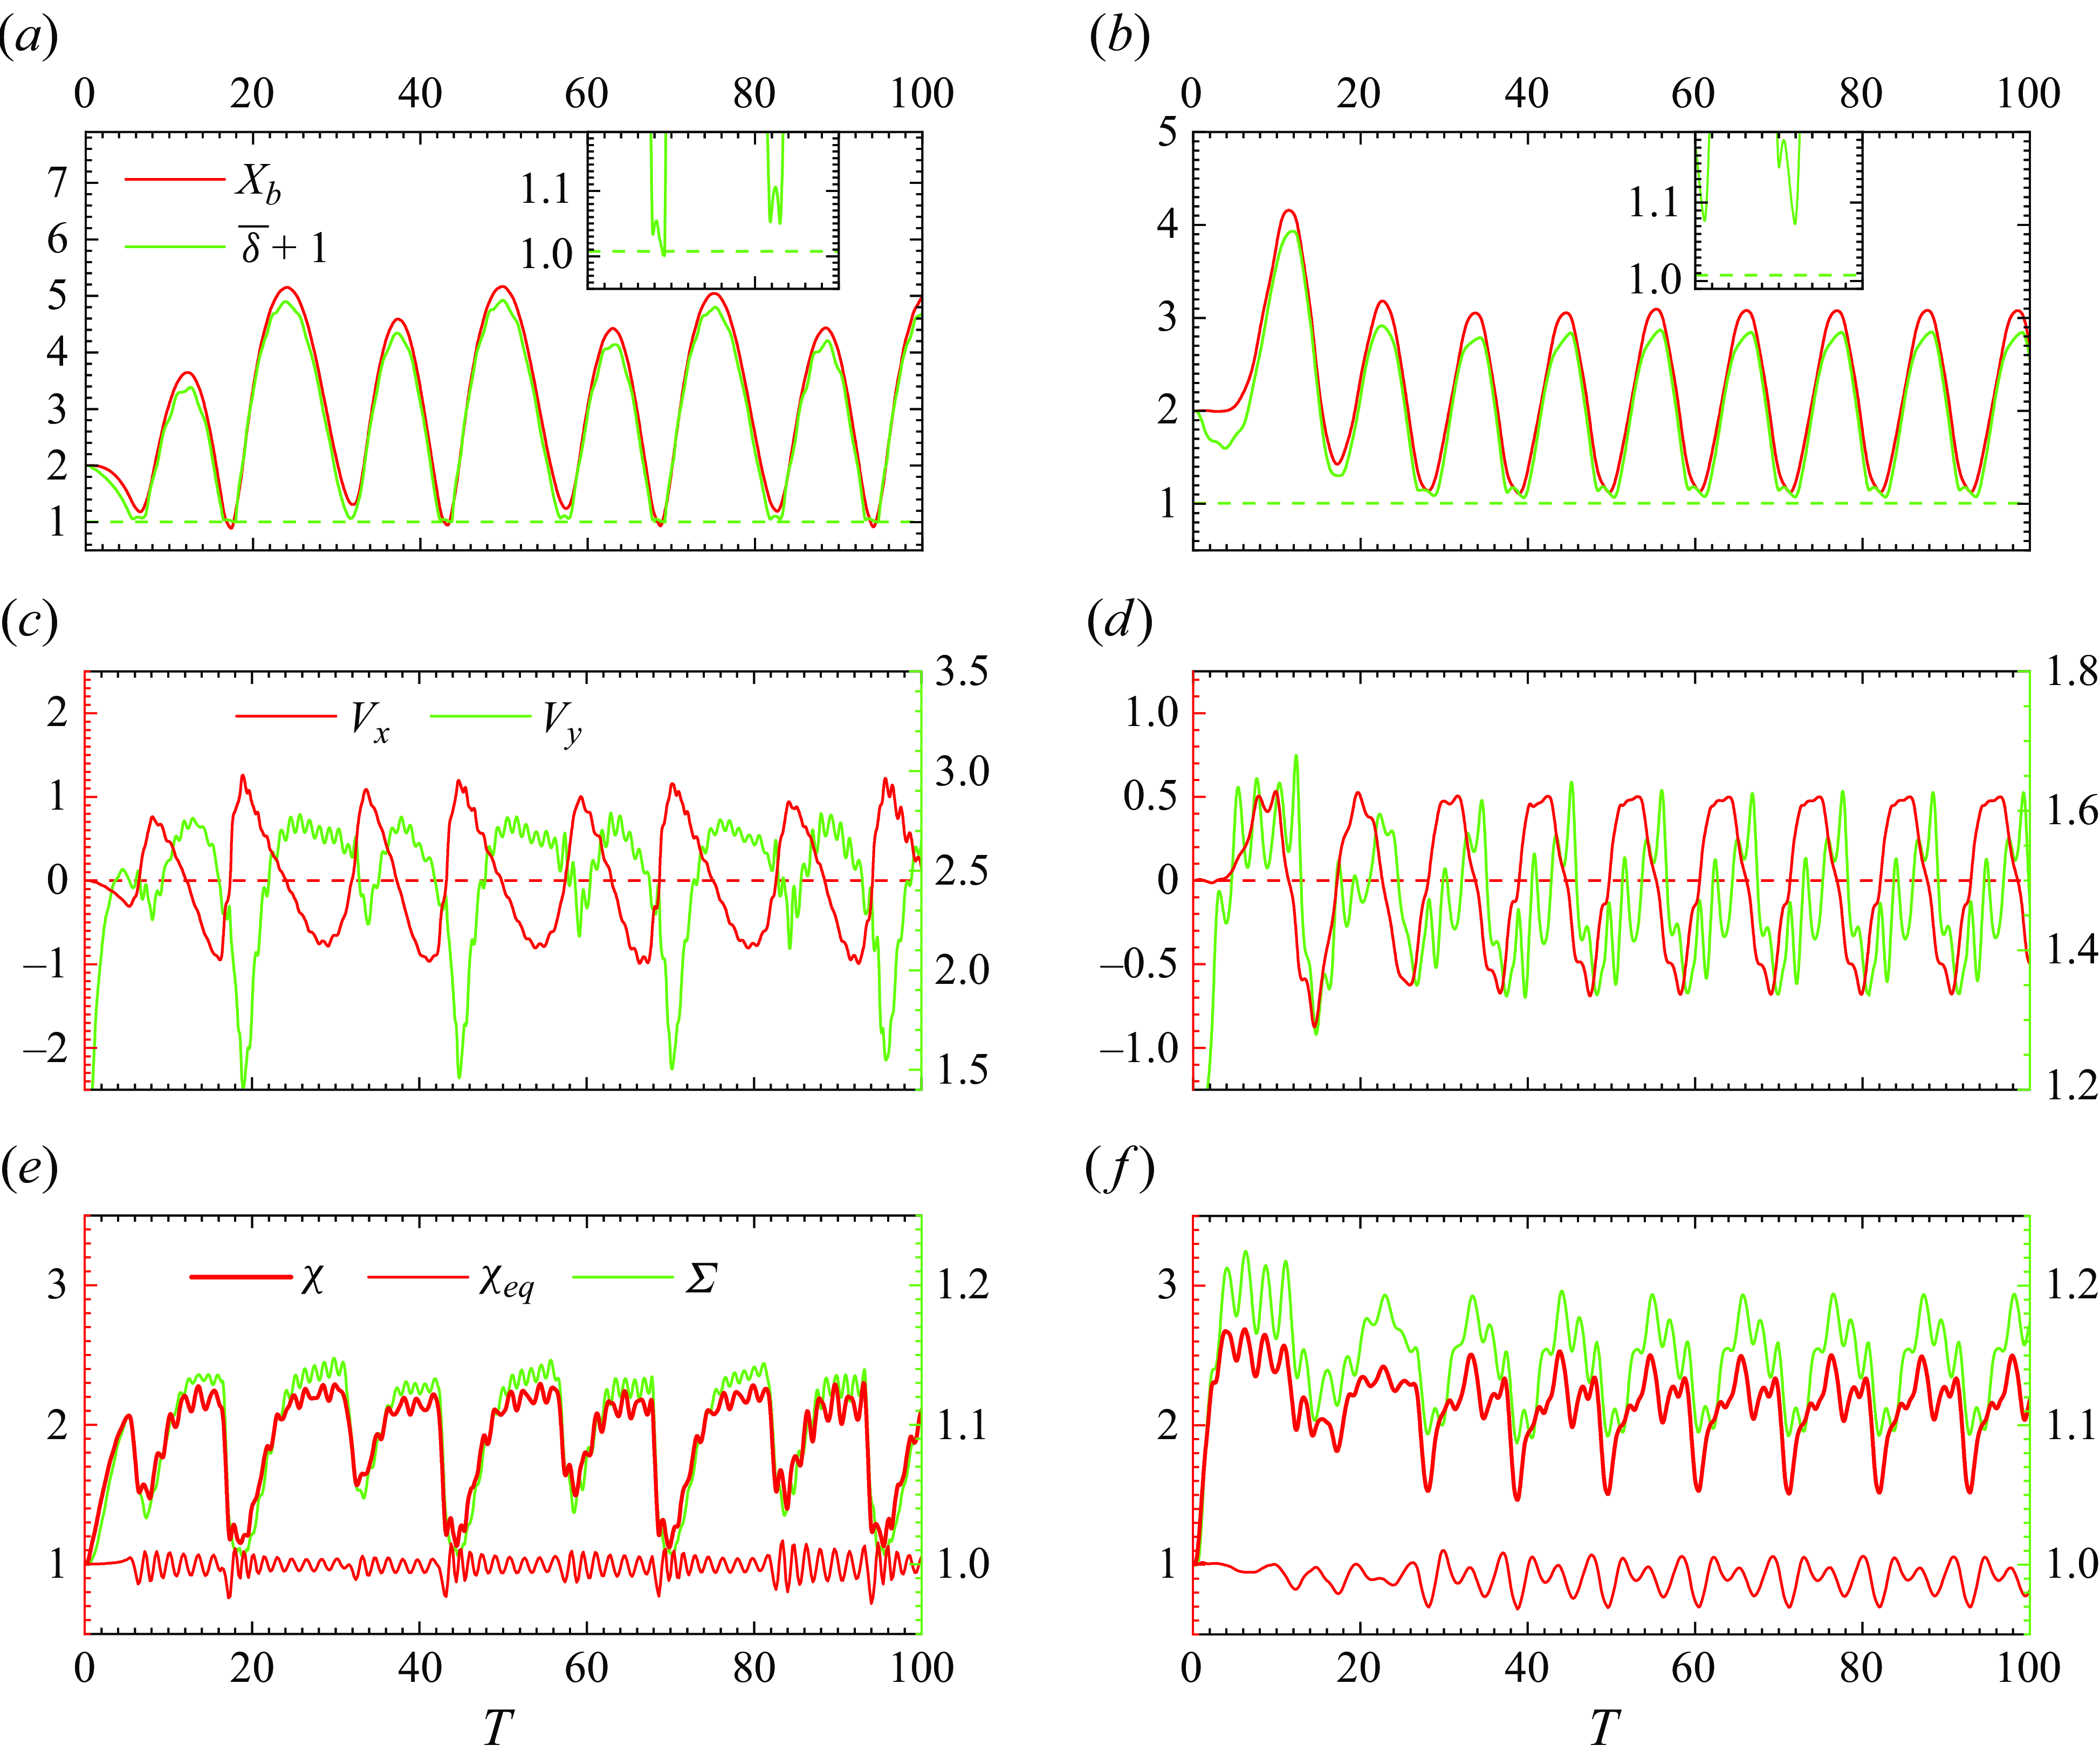
Figure 12. Evolution of some characteristics of the bubble dynamics for $(Bo, Ga) = (0.25, 90)$
(left column) and
$(Bo, Ga) = (0.25, 90)$
(left column) and $(1, 70)$
(right column).
$(1, 70)$
(right column). $(a,\!b)$
Wall-normal position of the bubble centroid (red line) and gap thickness (green line);
$(a,\!b)$
Wall-normal position of the bubble centroid (red line) and gap thickness (green line); $(c,\!d)$
wall-normal (red) and vertical (green) components of the velocity of the bubble centroid;
$(c,\!d)$
wall-normal (red) and vertical (green) components of the velocity of the bubble centroid; $(e,\!f)$
principal aspect ratio (thick red line), equatorial axes ratio (thin red line) and surface area (green line). In
$(e,\!f)$
principal aspect ratio (thick red line), equatorial axes ratio (thin red line) and surface area (green line). In $(c{-}f)$
, the right axis refers to the quantity shown with the green line. In
$(c{-}f)$
, the right axis refers to the quantity shown with the green line. In $(a{-}b)$
, the insets are located at the actual position on the horizontal (time) axis and only their vertical axis is stretched; the green dashed line identifies the transverse position
$(a{-}b)$
, the insets are located at the actual position on the horizontal (time) axis and only their vertical axis is stretched; the green dashed line identifies the transverse position $1+\overline \varDelta _{{min}}$
.
$1+\overline \varDelta _{{min}}$
.
Figure 2 $(a)$
indicates that, beyond the neutral curve but some distance away from it, bubbles with
$(a)$
indicates that, beyond the neutral curve but some distance away from it, bubbles with $Ga\gtrsim 60$
and
$Ga\gtrsim 60$
and $Bo\lesssim 1$
follow a NWZ scenario. Figure 12 illustrates the evolution of some characteristics of the dynamics of two such bubbles. The main difference between the two evolutions is the occurrence of direct bubble–wall collisions in the former case. Collision events can be identified from the temporal evolution of the dimensionless gap,
$Bo\lesssim 1$
follow a NWZ scenario. Figure 12 illustrates the evolution of some characteristics of the dynamics of two such bubbles. The main difference between the two evolutions is the occurrence of direct bubble–wall collisions in the former case. Collision events can be identified from the temporal evolution of the dimensionless gap, $\overline \delta$
. In line with the definition recalled in § 2, we consider that a direct collision takes place when
$\overline \delta$
. In line with the definition recalled in § 2, we consider that a direct collision takes place when $\overline \delta$
becomes less than the minimum cell size,
$\overline \delta$
becomes less than the minimum cell size, $\overline \varDelta _{{min}}$
, such as during the first event displayed in the inset of figure 12
$\overline \varDelta _{{min}}$
, such as during the first event displayed in the inset of figure 12 $(a)$
. As this figure shows,
$(a)$
. As this figure shows, $\overline \delta$
decreases to
$\overline \delta$
decreases to $\overline \varDelta _{{min}}$
at regular time intervals, first at
$\overline \varDelta _{{min}}$
at regular time intervals, first at $T \approx 18$
. In all NWZ evolutions involving collisions, these events occur every other round of transverse oscillations. Upon collision,
$T \approx 18$
. In all NWZ evolutions involving collisions, these events occur every other round of transverse oscillations. Upon collision, $V_x$
reverses and peaks at an absolute value larger than that achieved prior to the collision (see panel
$V_x$
reverses and peaks at an absolute value larger than that achieved prior to the collision (see panel $c$
), which may be interpreted as a rebound with a restitution coefficient larger than one. Consequently, the maximum separation reached by the bubble in the upcoming zigzag is significantly larger than that achieved just before the collision. In contrast, when collisions do not take place, the maximum separation remains constant once the oscillations have saturated (see panel
$c$
), which may be interpreted as a rebound with a restitution coefficient larger than one. Consequently, the maximum separation reached by the bubble in the upcoming zigzag is significantly larger than that achieved just before the collision. In contrast, when collisions do not take place, the maximum separation remains constant once the oscillations have saturated (see panel $b$
), and the restitution coefficient is smaller than one throughout the bubble ascent. Collisions also deeply affect the evolution of the bubble rise speed. As panel
$b$
), and the restitution coefficient is smaller than one throughout the bubble ascent. Collisions also deeply affect the evolution of the bubble rise speed. As panel $(c)$
shows, this component reduces by nearly
$(c)$
shows, this component reduces by nearly $50\,\%$
shortly after the collision (
$50\,\%$
shortly after the collision ( $V_y\approx 1.5$
). In contrast, this reduction reaches only
$V_y\approx 1.5$
). In contrast, this reduction reaches only $20\,\%$
in the next zigzagging cycle during which no collision takes place, and the same observation holds for the second bubble that never collides with the wall (panel
$20\,\%$
in the next zigzagging cycle during which no collision takes place, and the same observation holds for the second bubble that never collides with the wall (panel $d$
). In addition to these dominant variations enslaved to the zigzag dynamics,
$d$
). In addition to these dominant variations enslaved to the zigzag dynamics, $V_y$
also exhibit fast small-amplitude oscillations, especially in the case of the bubble with the smallest
$V_y$
also exhibit fast small-amplitude oscillations, especially in the case of the bubble with the smallest $Bo$
. Qualitatively similar evolutions are noticed in panels
$Bo$
. Qualitatively similar evolutions are noticed in panels $(e{-}f)$
for the principal aspect ratio
$(e{-}f)$
for the principal aspect ratio $\chi$
, and the surface area
$\chi$
, and the surface area $\Sigma$
(defined as the area of the gas–liquid interface normalised by
$\Sigma$
(defined as the area of the gas–liquid interface normalised by $4\pi R^2$
). These results reveal the existence of two distinct modes of shape oscillations: a primary low-frequency mode, by which
$4\pi R^2$
). These results reveal the existence of two distinct modes of shape oscillations: a primary low-frequency mode, by which $\chi$
and
$\chi$
and $\Sigma$
reach their maximum (respectively, minimum) when the bubble–wall separation achieves its maximum (respectively, minimum), and a secondary high-frequency mode with a significantly smaller amplitude. This second mode is seen to dominate the time variations of the equatorial axes ratio
$\Sigma$
reach their maximum (respectively, minimum) when the bubble–wall separation achieves its maximum (respectively, minimum), and a secondary high-frequency mode with a significantly smaller amplitude. This second mode is seen to dominate the time variations of the equatorial axes ratio $\chi_{eq}$
, whose relative magnitude is up to
$\chi_{eq}$
, whose relative magnitude is up to $20\,\%$
in the stages when the bubble is ‘far’ from the wall.
$20\,\%$
in the stages when the bubble is ‘far’ from the wall.
We compared the frequency of this second mode with that of small-amplitude capillary oscillations in the inviscid limit. For a nearly spherical bubble, the fundamental mode of such oscillations has a frequency $\overline {f}_2 = \sqrt {12}Bo^{-1/2}$
(Lamb Reference Lamb1932). Increasing the bubble oblateness leads to a decrease in this frequency, as the nonlinear computations of Meiron (Reference Meiron1989) showed. The two deformable bubbles considered in figure 12 have a principal aspect ratio
$\overline {f}_2 = \sqrt {12}Bo^{-1/2}$
(Lamb Reference Lamb1932). Increasing the bubble oblateness leads to a decrease in this frequency, as the nonlinear computations of Meiron (Reference Meiron1989) showed. The two deformable bubbles considered in figure 12 have a principal aspect ratio $\chi \approx 2.1$
. For this oblateness, Meiron’s predictions indicate that the frequency of the lowest-order axisymmetric oscillations (corresponding to the
$\chi \approx 2.1$
. For this oblateness, Meiron’s predictions indicate that the frequency of the lowest-order axisymmetric oscillations (corresponding to the $(2,0)$
mode) is
$(2,0)$
mode) is $\approx 0.84\overline {f}_2$
. However, variations observed in panels
$\approx 0.84\overline {f}_2$
. However, variations observed in panels $(e{-}f)$
on the equatorial axes ratio
$(e{-}f)$
on the equatorial axes ratio $\chi_{eq}$
prove that the observed high-frequency oscillations are three-dimensional. The lowest two three-dimensional capillary modes are the
$\chi_{eq}$
prove that the observed high-frequency oscillations are three-dimensional. The lowest two three-dimensional capillary modes are the $(2,1)$
and
$(2,1)$
and $(2,2)$
ones, the wavelength of which in the equatorial plane is the corresponding perimeter and half of it, respectively. Meiron’s results predict that, for an oblate spheroid with
$(2,2)$
ones, the wavelength of which in the equatorial plane is the corresponding perimeter and half of it, respectively. Meiron’s results predict that, for an oblate spheroid with $\chi=2.1$
, their frequencies are approximately
$\chi=2.1$
, their frequencies are approximately $0.81\overline {f}_2$
and
$0.81\overline {f}_2$
and $0.56\overline {f}_2$
, respectively. Inspection of the records of
$0.56\overline {f}_2$
, respectively. Inspection of the records of $\chi_{eq}$
in panels
$\chi_{eq}$
in panels $(e{-}f)$
indicates that the frequency of the observed high-frequency oscillations is close to
$(e{-}f)$
indicates that the frequency of the observed high-frequency oscillations is close to $0.59\overline {f}_2$
at
$0.59\overline {f}_2$
at $Bo=0.25$
and
$Bo=0.25$
and $0.50\overline {f}_2$
at
$0.50\overline {f}_2$
at $Bo=1$
. Given that the rise Reynolds number in the second case is less than half that in the first one, viscous corrections are expected to be more significant in the former. With this in mind, this comparison strongly suggests that the observed oscillations correspond to the non-axisymmetric
$Bo=1$
. Given that the rise Reynolds number in the second case is less than half that in the first one, viscous corrections are expected to be more significant in the former. With this in mind, this comparison strongly suggests that the observed oscillations correspond to the non-axisymmetric $(2,2)$
mode for both bubbles.
$(2,2)$
mode for both bubbles.

Figure 13. Variation of several characteristics of the bubble dynamics over a single zigzag period in the presence or absence of a wall for two bubbles with $(Bo, Ga) = (0.25, 90)$
(left column) and
$(Bo, Ga) = (0.25, 90)$
(left column) and $(Bo, Ga) = (1, 70)$
(right column).
$(Bo, Ga) = (1, 70)$
(right column). $(a,\!b)$
Horizontal velocity component,
$(a,\!b)$
Horizontal velocity component, $V_x$
, lying in the plane of the zigzagging motion (i.e. wall-normal component when the wall is present);
$V_x$
, lying in the plane of the zigzagging motion (i.e. wall-normal component when the wall is present); $(c,\!d)$
vertical velocity,
$(c,\!d)$
vertical velocity, $V_y$
;
$V_y$
; $(e,\!f)$
surface area,
$(e,\!f)$
surface area, $\Sigma$
. Red and black lines denote results in the presence and the absence of the wall, respectively. Solid and dashed lines refer to the half-period of the zigzag with negative and positive
$\Sigma$
. Red and black lines denote results in the presence and the absence of the wall, respectively. Solid and dashed lines refer to the half-period of the zigzag with negative and positive $V_x$
, respectively; thick and thin red lines correspond to the sub-period of the zigzag with and without a collision, respectively.
$V_x$
, respectively; thick and thin red lines correspond to the sub-period of the zigzag with and without a collision, respectively.
To better quantify wall effects, we carried out additional runs considering the same two bubbles in an unbounded domain. After exhibiting flattened spiralling paths, they both eventually describe planar zigzags with reduced frequencies $St=0.057$
and
$St=0.057$
and $St=0.113$
for
$St=0.113$
for $(Bo, Ga) = (0.25, 90)$
and
$(Bo, Ga) = (0.25, 90)$
and $(1, 70)$
, respectively. These frequencies are slightly smaller than their wall-bounded counterparts (
$(1, 70)$
, respectively. These frequencies are slightly smaller than their wall-bounded counterparts ( $St=0.063$
and
$St=0.063$
and $0.126$
, respectively). However, the most prominent difference is that shape oscillations keep a much smaller amplitude in the absence of the wall. This difference is highlighted in figure 13, which shows the variation over a single zigzag period of the velocity components of the bubble centroid and its surface area as a function of the lateral displacement,
$0.126$
, respectively). However, the most prominent difference is that shape oscillations keep a much smaller amplitude in the absence of the wall. This difference is highlighted in figure 13, which shows the variation over a single zigzag period of the velocity components of the bubble centroid and its surface area as a function of the lateral displacement, $X_b - X_c$
, with
$X_b - X_c$
, with $X_c$
being the time-averaged wall-normal position of the centroid, i.e. the horizontal position of the zigzag centreline. In the unbounded configuration, the two halves of the zigzag period exhibit symmetric evolutions with respect to the mean position
$X_c$
being the time-averaged wall-normal position of the centroid, i.e. the horizontal position of the zigzag centreline. In the unbounded configuration, the two halves of the zigzag period exhibit symmetric evolutions with respect to the mean position $X = X_c$
. For both bubbles, the relative change in
$X = X_c$
. For both bubbles, the relative change in $\Sigma$
remains less than 3 % throughout the zigzag period, indicating weak shape oscillations. In the presence of the wall, the mean amplitude of the lateral oscillations is reduced by
$\Sigma$
remains less than 3 % throughout the zigzag period, indicating weak shape oscillations. In the presence of the wall, the mean amplitude of the lateral oscillations is reduced by $20$
%–
$20$
%– $25\,\%$
and no symmetry with respect to
$25\,\%$
and no symmetry with respect to $X=X_c$
subsists. The bubble surface area experiences marked variations, with relative changes from
$X=X_c$
subsists. The bubble surface area experiences marked variations, with relative changes from $10$
% to
$10$
% to $15\,\%$
. For both bubbles,
$15\,\%$
. For both bubbles, $\Sigma$
attains its minimum shortly after the bounce, making the bubble less deformed during most of the departing stage than when it recedes to the wall.
$\Sigma$
attains its minimum shortly after the bounce, making the bubble less deformed during most of the departing stage than when it recedes to the wall.
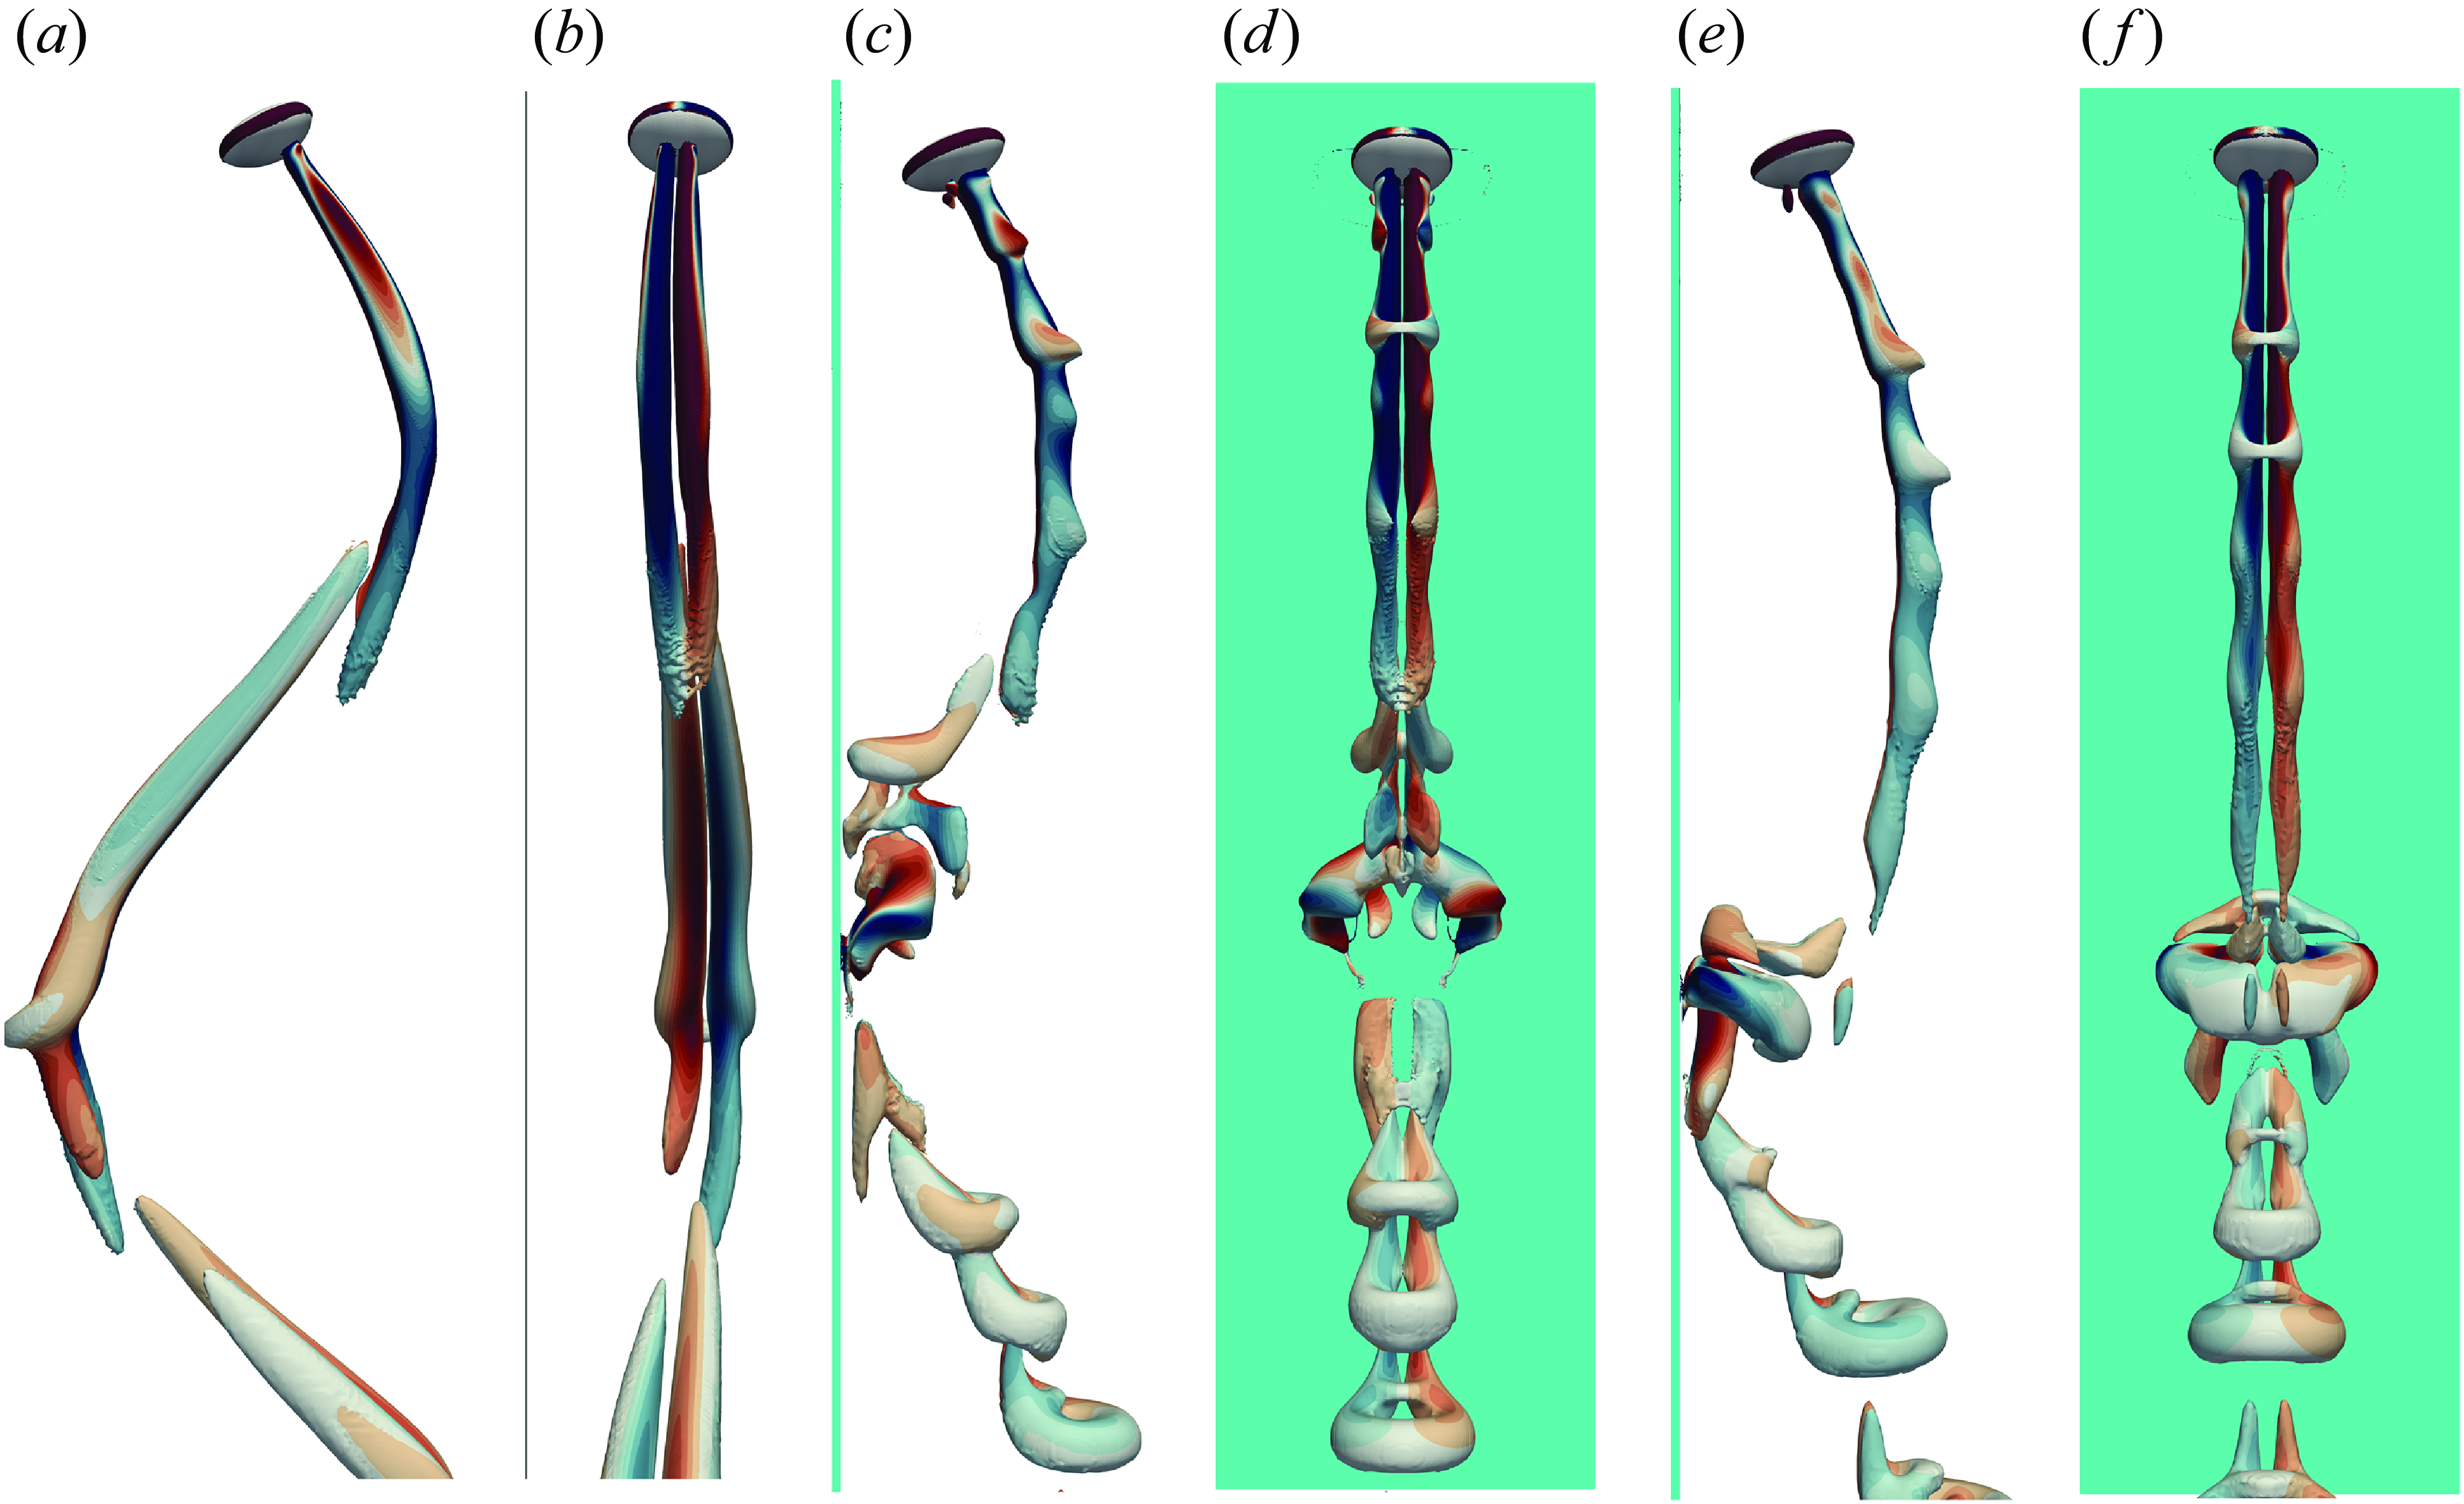
Figure 14. Two perpendicular views of the wake structure past a zigzagging bubble with $(Bo, Ga) = (0.25, 90)$
at the moment when the bubble crosses the centreline of the zigzag.
$(Bo, Ga) = (0.25, 90)$
at the moment when the bubble crosses the centreline of the zigzag. $(a{-}b)$
Unbounded configuration;
$(a{-}b)$
Unbounded configuration; $(c{-}f)$
wall-bounded configuration. Snapshots in panels
$(c{-}f)$
wall-bounded configuration. Snapshots in panels $(c{-}d)$
and
$(c{-}d)$
and $(e{-}f)$
are taken at the instants of time marked with open and closed circles in figure 13
$(e{-}f)$
are taken at the instants of time marked with open and closed circles in figure 13 $(a)$
, respectively. The wake structure is visualised using the
$(a)$
, respectively. The wake structure is visualised using the $\lambda _2$
criterion, with iso-
$\lambda _2$
criterion, with iso- $\lambda _2$
surfaces coloured by the local value of
$\lambda _2$
surfaces coloured by the local value of $\overline {\omega }_y$
; red and blue contours refer to positive and negative values, respectively, with a maximum magnitude of
$\overline {\omega }_y$
; red and blue contours refer to positive and negative values, respectively, with a maximum magnitude of $1.0$
. The wall is indicated by a dark green line in
$1.0$
. The wall is indicated by a dark green line in $(c,\!e)$
and a dark green rectangular surface in
$(c,\!e)$
and a dark green rectangular surface in $(d,\!f)$
.
$(d,\!f)$
.
Figure 14 visualises the wake structure downstream of the bubble with $(Bo, Ga) = (0.25, 90)$
using the
$(Bo, Ga) = (0.25, 90)$
using the $\lambda _2$
criterion (Jeong & Hussain Reference Jeong and Hussain1995). In the unbounded case (panels
$\lambda _2$
criterion (Jeong & Hussain Reference Jeong and Hussain1995). In the unbounded case (panels $a,b$
), this structure corresponds to the ‘4R’ vortex shedding mode, following the terminology of Horowitz & Williamson (Reference Horowitz and Williamson2010). This mode refers to two pairs of counter-rotating vortices with opposite signs of
$a,b$
), this structure corresponds to the ‘4R’ vortex shedding mode, following the terminology of Horowitz & Williamson (Reference Horowitz and Williamson2010). This mode refers to two pairs of counter-rotating vortices with opposite signs of $\overline {\omega }_y$
successively shed in the wake during a zigzag half-period, with one pair being much stronger than the other, thus allowing the path to remain almost sinusoidal. The ‘4R’ mode is known to be linked to oscillations in the relative velocity between the body and fluid (here the bubble rise speed). It emerges when the relative magnitude of these oscillations (with reduced frequency
$\overline {\omega }_y$
successively shed in the wake during a zigzag half-period, with one pair being much stronger than the other, thus allowing the path to remain almost sinusoidal. The ‘4R’ mode is known to be linked to oscillations in the relative velocity between the body and fluid (here the bubble rise speed). It emerges when the relative magnitude of these oscillations (with reduced frequency $2St$
) exceeds approximately
$2St$
) exceeds approximately $10\,\%$
(Horowitz & Williamson Reference Horowitz and Williamson2010; Cano-Lozano et al. Reference Cano-Lozano, Martínez-Bazán, Magnaudet and Tchoufag2016; Auguste & Magnaudet Reference Auguste and Magnaudet2018), a condition widely fulfilled in the present case according to figure 12
$10\,\%$
(Horowitz & Williamson Reference Horowitz and Williamson2010; Cano-Lozano et al. Reference Cano-Lozano, Martínez-Bazán, Magnaudet and Tchoufag2016; Auguste & Magnaudet Reference Auguste and Magnaudet2018), a condition widely fulfilled in the present case according to figure 12 $(c)$
. In the wall-bounded configuration (panels
$(c)$
. In the wall-bounded configuration (panels $c{-}f$
in figure 14), the vortex pair shed towards the wall degenerates into a short series of vortex patches, creating a strong suction effect on the bubble in the early departure stage. This is the cause of the sharp decrease in the bubble rise speed and surface area during this stage. The wall effect is less severe in cases where collisions do not happen, such as the bubble with
$c{-}f$
in figure 14), the vortex pair shed towards the wall degenerates into a short series of vortex patches, creating a strong suction effect on the bubble in the early departure stage. This is the cause of the sharp decrease in the bubble rise speed and surface area during this stage. The wall effect is less severe in cases where collisions do not happen, such as the bubble with $(Bo,Ga)=(1,70)$
(not shown). In such cases, the wall compels the same vortex pair to bend and align vertically but the corresponding primary vortices do not break into distinct patches.
$(Bo,Ga)=(1,70)$
(not shown). In such cases, the wall compels the same vortex pair to bend and align vertically but the corresponding primary vortices do not break into distinct patches.
The structure of the vortex pair shed towards the fluid interior differs significantly from that in the unbounded configuration. Specifically, several single-sided, short-wavelength loops superimpose onto the primary vortex pair (panels $c,e$
in figure 14). These loops grow in time and progressively invade the far-wake structure. Close inspection indicates that their number matches that of the high-frequency oscillations of the bubble aspect ratio, suggesting that these short-wavelength loops are a by-product of shape oscillations. Indeed, every transient change in the bubble shape (especially in the vicinity of the bubble’s equator) results in a change in the local curvature of the bubble surface, hence in a variation of the magnitude of the tangential surface vorticity (Veldhuis et al. Reference Veldhuis, Biesheuvel and van Wijngaarden2008; Cano-Lozano et al. Reference Cano-Lozano, Martínez-Bazán, Magnaudet and Tchoufag2016). The lifetime of these short-wavelength loops depends on the oscillatory Reynolds number,
$c,e$
in figure 14). These loops grow in time and progressively invade the far-wake structure. Close inspection indicates that their number matches that of the high-frequency oscillations of the bubble aspect ratio, suggesting that these short-wavelength loops are a by-product of shape oscillations. Indeed, every transient change in the bubble shape (especially in the vicinity of the bubble’s equator) results in a change in the local curvature of the bubble surface, hence in a variation of the magnitude of the tangential surface vorticity (Veldhuis et al. Reference Veldhuis, Biesheuvel and van Wijngaarden2008; Cano-Lozano et al. Reference Cano-Lozano, Martínez-Bazán, Magnaudet and Tchoufag2016). The lifetime of these short-wavelength loops depends on the oscillatory Reynolds number, $Re_{osc}=(\rho _l\gamma R)^{1/2}/\mu _l=Ga\,Bo^{-1/2}$
, that compares the characteristic time of shape oscillations with that of their viscous damping. Hence, when the Bond number is low enough, these oscillations decay slowly and are able to alter significantly the far-wake structure.
$Re_{osc}=(\rho _l\gamma R)^{1/2}/\mu _l=Ga\,Bo^{-1/2}$
, that compares the characteristic time of shape oscillations with that of their viscous damping. Hence, when the Bond number is low enough, these oscillations decay slowly and are able to alter significantly the far-wake structure.
5.3. How a zigzagging bubble gets trapped near the wall
That the NWZ regime is encountered in an intermediate range of Bond numbers for $Ga\geqslant 60$
is somewhat surprising at first glance. Indeed, at a given
$Ga\geqslant 60$
is somewhat surprising at first glance. Indeed, at a given $Ga$
, bubbles with a slightly subcritical
$Ga$
, bubbles with a slightly subcritical $Bo$
migrate away from the wall and those whose Bond number exceeds
$Bo$
migrate away from the wall and those whose Bond number exceeds $1.5$
do the same through the WMA scenario (figure 2
$1.5$
do the same through the WMA scenario (figure 2 $a$
). The reduced deformation of the bubble in the departing stage of the zigzagging motion revealed by figures 13
$a$
). The reduced deformation of the bubble in the departing stage of the zigzagging motion revealed by figures 13 $(e,\!f)$
, which itself results from the reduction in the rise speed induced by the intense interaction of the wake vortices with the wall (figures 14
$(e,\!f)$
, which itself results from the reduction in the rise speed induced by the intense interaction of the wake vortices with the wall (figures 14 $c{-}f$
), is responsible for the observed trapping phenomenon. Indeed, since the minor and major axes of an oblate spheroid vary as
$c{-}f$
), is responsible for the observed trapping phenomenon. Indeed, since the minor and major axes of an oblate spheroid vary as $\chi^{-2/3}$
and
$\chi^{-2/3}$
and $\chi^{1/3}$
, respectively, the frontal area of the bubble involved in the transverse motion, say
$\chi^{1/3}$
, respectively, the frontal area of the bubble involved in the transverse motion, say $S_\perp$
, varies as
$S_\perp$
, varies as $\chi^{-1/3}$
. Thus, it is larger when the bubble moves away from the wall with
$\chi^{-1/3}$
. Thus, it is larger when the bubble moves away from the wall with $\chi\approx 1$
than when it goes back to it with
$\chi\approx 1$
than when it goes back to it with $\chi\gt 2$
. Throughout the departing stage, this results in an increase in the transverse viscous drag (for a given wall-normal velocity), as well as in the amount of liquid displaced transversely by the bubble, hence the transverse added-mass force (for a given wall-normal acceleration). Both effects tend to oppose the departing motion of the bubble. Therefore, the larger the frontal area
$\chi\gt 2$
. Throughout the departing stage, this results in an increase in the transverse viscous drag (for a given wall-normal velocity), as well as in the amount of liquid displaced transversely by the bubble, hence the transverse added-mass force (for a given wall-normal acceleration). Both effects tend to oppose the departing motion of the bubble. Therefore, the larger the frontal area $S_\perp$
, the weaker the positive transverse velocity
$S_\perp$
, the weaker the positive transverse velocity $V_x$
the bubble can achieve at a given wall-normal position
$V_x$
the bubble can achieve at a given wall-normal position $X_b$
. This is why, as figure 13 highlights, the amplitude of the zigzags, i.e. the horizontal distance between two successive
$X_b$
. This is why, as figure 13 highlights, the amplitude of the zigzags, i.e. the horizontal distance between two successive $V_x$
-reversals, is reduced compared with that achieved by the same bubble in an unbounded fluid. Moreover, in the highly inertial regime under consideration, the repulsive interaction force is known to vary approximately as
$V_x$
-reversals, is reduced compared with that achieved by the same bubble in an unbounded fluid. Moreover, in the highly inertial regime under consideration, the repulsive interaction force is known to vary approximately as $X_b^{-4}V_y^2$
for a nearly spherical bubble (Takemura & Magnaudet Reference Takemura and Magnaudet2003). Although bubbles concerned by the NWZ regime are far from spherical, this scaling provides a strong indication that the dramatic reduction in the rise speed during the first half of the departing stage leads to a drastic drop in the repulsive force. Both aspects cooperate to hamper the drift of the wall-normal position of the zigzag centreline,
$X_b^{-4}V_y^2$
for a nearly spherical bubble (Takemura & Magnaudet Reference Takemura and Magnaudet2003). Although bubbles concerned by the NWZ regime are far from spherical, this scaling provides a strong indication that the dramatic reduction in the rise speed during the first half of the departing stage leads to a drastic drop in the repulsive force. Both aspects cooperate to hamper the drift of the wall-normal position of the zigzag centreline, $X_c$
, yielding a near-wall trapping of the bubble from which the observed periodic path ensues.
$X_c$
, yielding a near-wall trapping of the bubble from which the observed periodic path ensues.
Figure 15 $(a)$
illustrates the variations of the bubble area,
$(a)$
illustrates the variations of the bubble area, $\Sigma$
, with the wall distance over one zigzag pseudo-period for bubbles with
$\Sigma$
, with the wall distance over one zigzag pseudo-period for bubbles with $Bo = 0.5$
at different
$Bo = 0.5$
at different $Ga$
. With no surprise,
$Ga$
. With no surprise, $\Sigma$
experiences negligible changes at
$\Sigma$
experiences negligible changes at $Ga = 40$
, the critical
$Ga = 40$
, the critical $Ga$
at which path instability sets in at this specific Bond number. These variations become discernible at
$Ga$
at which path instability sets in at this specific Bond number. These variations become discernible at $Ga = 50$
but the bubble still manages to escape from the wall region. The surface area is seen to experience much larger changes (of the order of
$Ga = 50$
but the bubble still manages to escape from the wall region. The surface area is seen to experience much larger changes (of the order of $7\,\%-8\,\%$
) for
$7\,\%-8\,\%$
) for $Ga\geqslant 60$
. Figure 2
$Ga\geqslant 60$
. Figure 2 $(a)$
indicates that this corresponds to the
$(a)$
indicates that this corresponds to the $Ga$
-range in which the NWZ regime is observed for
$Ga$
-range in which the NWZ regime is observed for $Bo = 0.5$
, which is in line with the physical arguments presented above. Figure 15
$Bo = 0.5$
, which is in line with the physical arguments presented above. Figure 15 $(b)$
shows how the contour of the bubble in the diametrical plane perpendicular to the transverse motion varies along the departing and approaching stages at a given
$(b)$
shows how the contour of the bubble in the diametrical plane perpendicular to the transverse motion varies along the departing and approaching stages at a given $Ga$
. These plots confirm that this cross section is significantly less oblate in the departing stage for
$Ga$
. These plots confirm that this cross section is significantly less oblate in the departing stage for $Ga\gt 50$
. The relative difference in the corresponding frontal area between the two stages becomes more pronounced as
$Ga\gt 50$
. The relative difference in the corresponding frontal area between the two stages becomes more pronounced as $Ga$
increases further. This difference increases with
$Ga$
increases further. This difference increases with $Ga$
, i.e. with the distance to the threshold of path instability, and is approximately
$Ga$
, i.e. with the distance to the threshold of path instability, and is approximately $8\,\%$
at
$8\,\%$
at $Ga = 90$
. Figures 15
$Ga = 90$
. Figures 15 $(c,\!d)$
show results similar to those in the previous two panels for bubbles with
$(c,\!d)$
show results similar to those in the previous two panels for bubbles with $Ga = 70$
over a wide range of Bond number. Almost no change in either
$Ga = 70$
over a wide range of Bond number. Almost no change in either $\Sigma$
or
$\Sigma$
or $S_\perp$
is noticed at
$S_\perp$
is noticed at $Bo = 0.2$
, the critical
$Bo = 0.2$
, the critical $Bo$
at which path instability sets in at this specific Galilei number. The situation changes drastically when the Bond number increases up to
$Bo$
at which path instability sets in at this specific Galilei number. The situation changes drastically when the Bond number increases up to $0.25$
, with now a relative difference of around
$0.25$
, with now a relative difference of around $15\,\%$
in
$15\,\%$
in $S_\perp$
between the approaching and departing stages. Then, this difference reduces gradually as
$S_\perp$
between the approaching and departing stages. Then, this difference reduces gradually as $Bo$
goes on increasing. The NWZ regime subsists up to
$Bo$
goes on increasing. The NWZ regime subsists up to $Bo=1$
and is succeeded by the WMA regime at
$Bo=1$
and is succeeded by the WMA regime at $Bo=1.5$
, where
$Bo=1.5$
, where $\Sigma$
and
$\Sigma$
and $S_\perp$
both experience negligible variations.
$S_\perp$
both experience negligible variations.
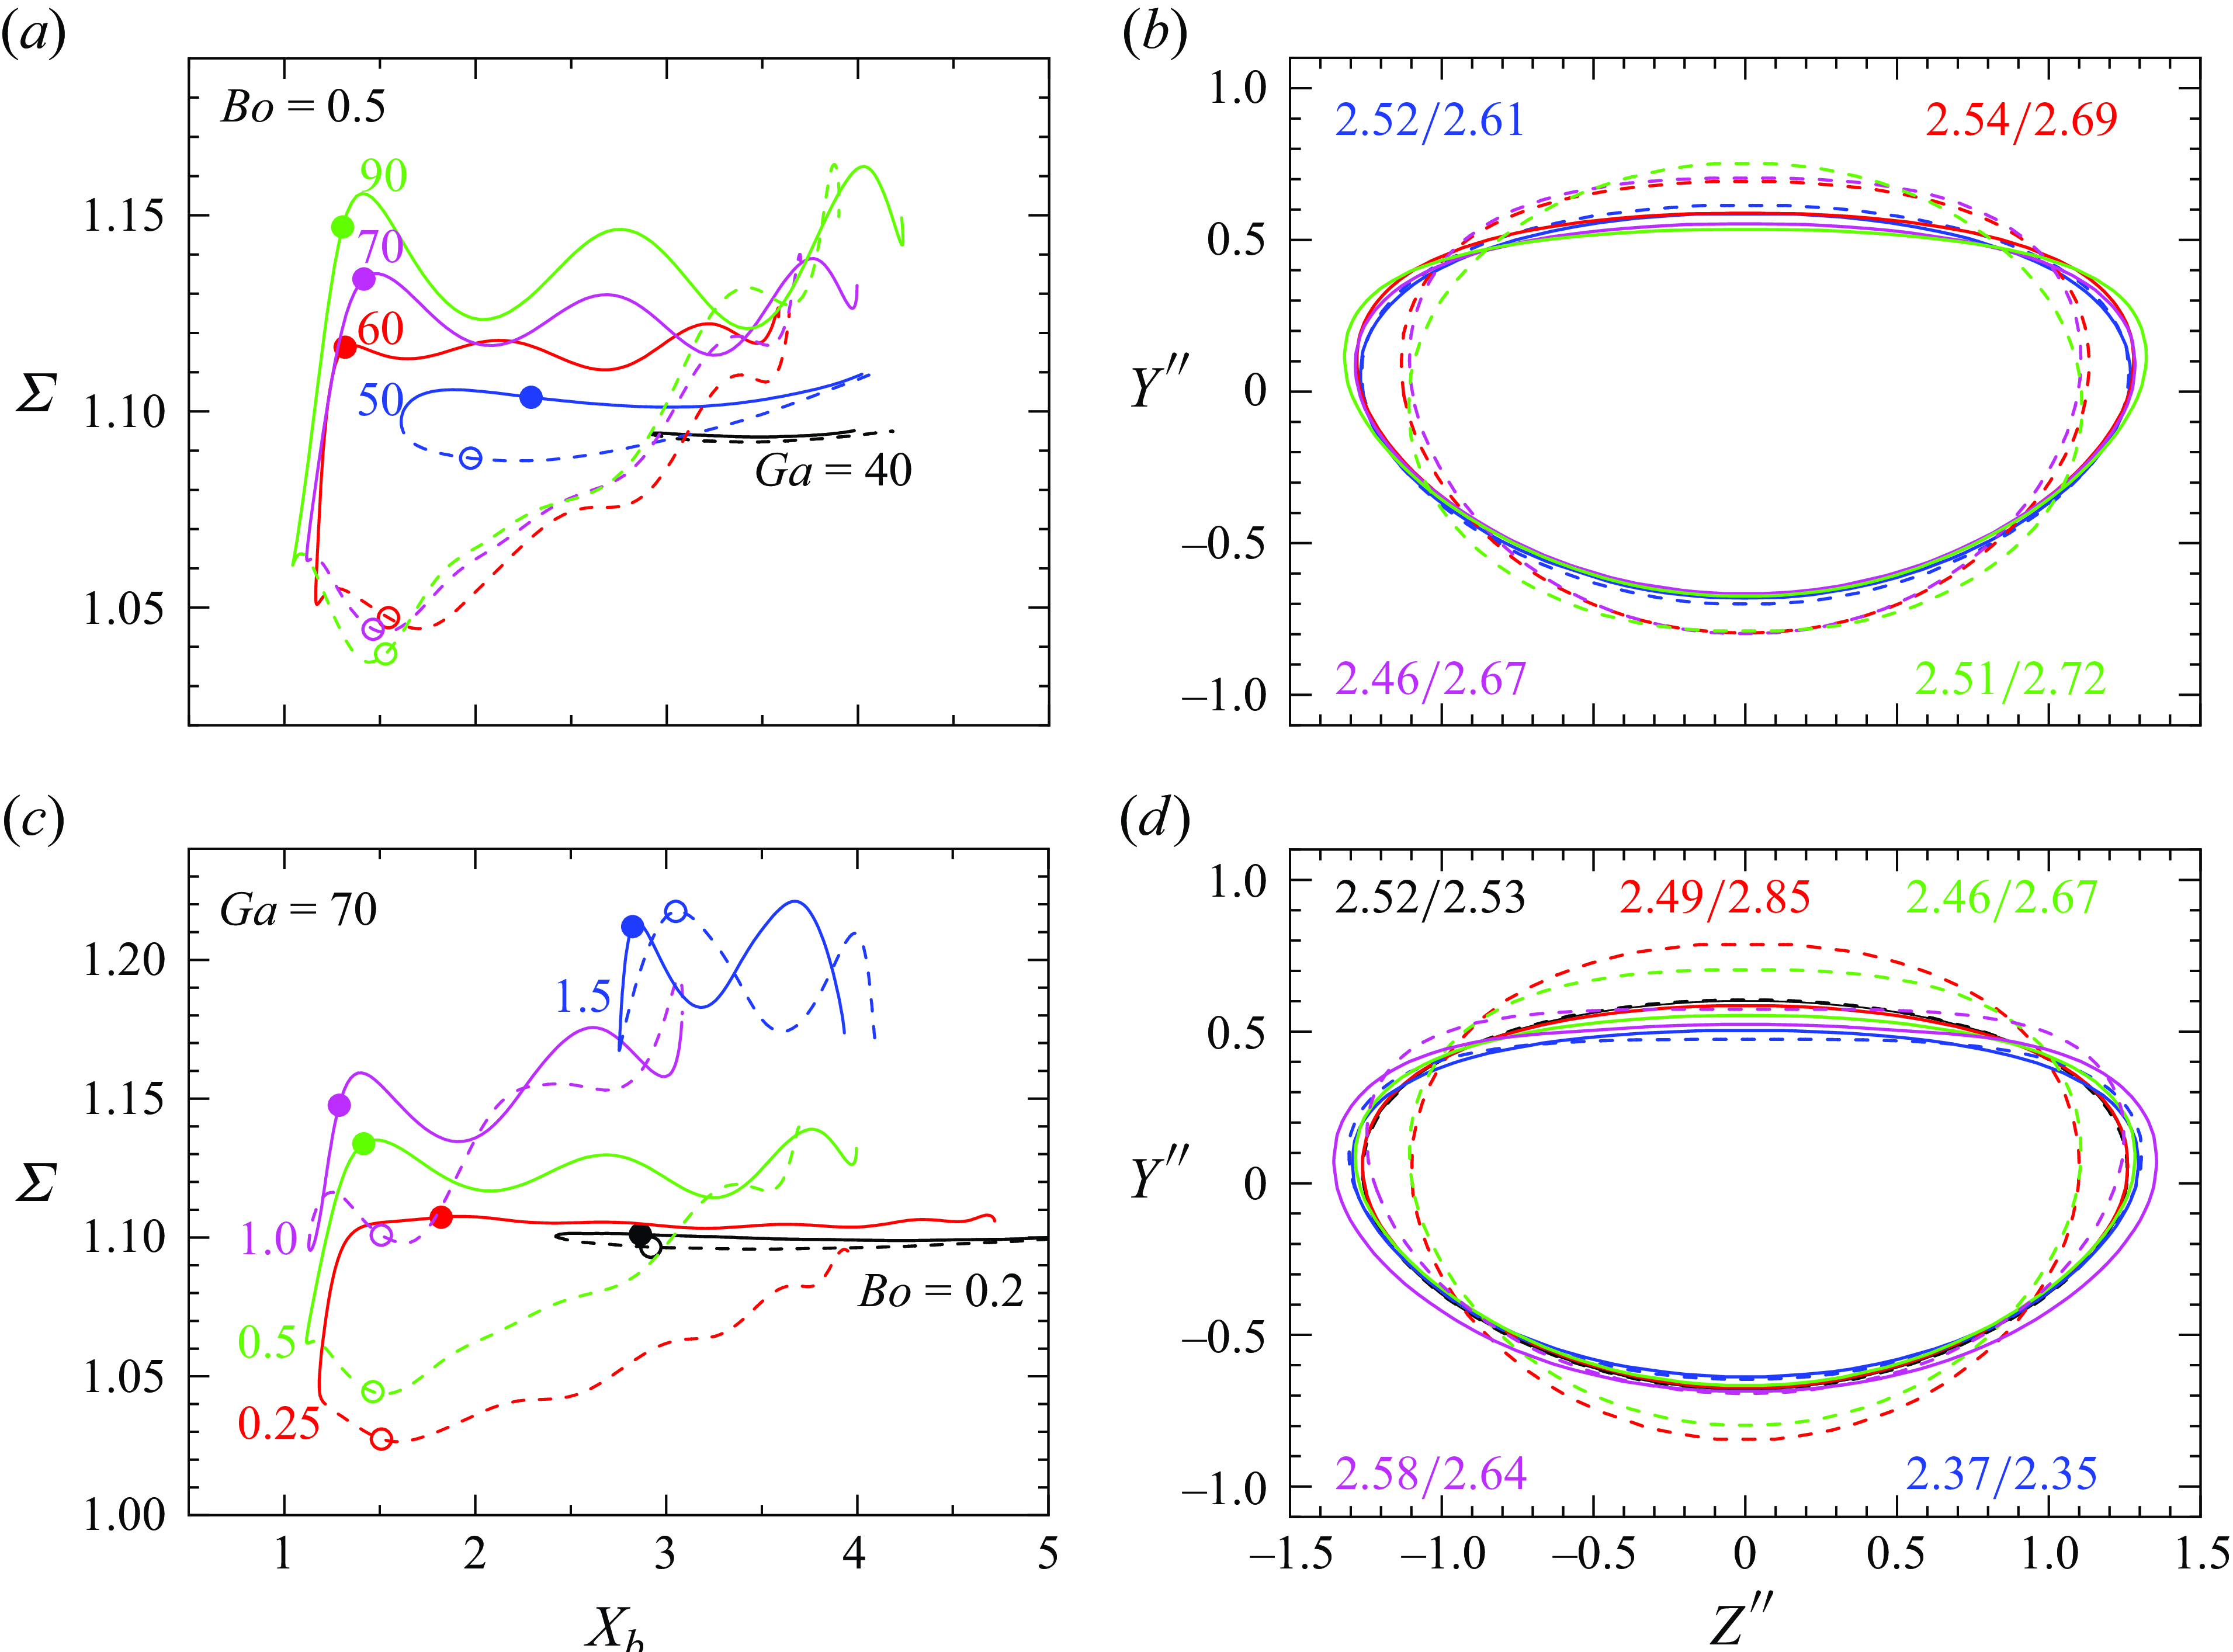
Figure 15. Time-dependent deformation of bubbles obeying a NWZ or a WMA scenario. $(a)$
Surface area,
$(a)$
Surface area, $\Sigma$
, vs the wall distance,
$\Sigma$
, vs the wall distance, $X_b$
, over one pseudo-period of the zigzag for
$X_b$
, over one pseudo-period of the zigzag for $Bo=0.5$
and various
$Bo=0.5$
and various $Ga$
;
$Ga$
; $(b)$
bubble cross section in the diametrical plane
$(b)$
bubble cross section in the diametrical plane $(Y^{\prime\prime},Z^{\prime\prime})$
perpendicular to the transverse motion at
$(Y^{\prime\prime},Z^{\prime\prime})$
perpendicular to the transverse motion at $X_b$
positions midway between the centreline of the zigzag and its extremity closest to the wall (these positions are marked with circular symbols in panel
$X_b$
positions midway between the centreline of the zigzag and its extremity closest to the wall (these positions are marked with circular symbols in panel $a$
); the
$a$
); the $Y^{\prime\prime}$
axis is parallel to the bubble minor axis and the
$Y^{\prime\prime}$
axis is parallel to the bubble minor axis and the $Z^{\prime\prime}$
axis is horizontal and parallel to the wall.
$Z^{\prime\prime}$
axis is horizontal and parallel to the wall. $(c,\!d)$
Same as
$(c,\!d)$
Same as $(a,\!b)$
for
$(a,\!b)$
for $Ga=70$
and various
$Ga=70$
and various $Bo$
. In all panels, the black and blue evolutions belong to the WMA regime. Solid (respectively, dashed) lines refer to the approaching (respectively, departing) stage. Values shown in
$Bo$
. In all panels, the black and blue evolutions belong to the WMA regime. Solid (respectively, dashed) lines refer to the approaching (respectively, departing) stage. Values shown in $(b,\!d)$
correspond to the frontal area,
$(b,\!d)$
correspond to the frontal area, $S_\perp$
, enclosed in the contour of the same colour, with the first and second numbers in each pair referring to the approaching and departing stages, respectively.
$S_\perp$
, enclosed in the contour of the same colour, with the first and second numbers in each pair referring to the approaching and departing stages, respectively.
As pointed out above, the NWZ regime is a consequence of the intense interaction of the wall with the double-threaded wake accompanying zigzagging bubbles. Therefore, for this regime to exist, it is necessary that the lateral excursions performed by the zigzagging bubble have a sufficient amplitude. Given the supercritical nature of path instability (Mougin & Magnaudet Reference Mougin and Magnaudet2002), the required amplitude may only be reached if $Bo$
is somewhat larger than
$Bo$
is somewhat larger than $Bo_c(Ga)$
, the critical Bond number corresponding to the onset of the zigzagging motion at the considered
$Bo_c(Ga)$
, the critical Bond number corresponding to the onset of the zigzagging motion at the considered $Ga$
. This is why bubbles with
$Ga$
. This is why bubbles with $Bo$
only slightly above
$Bo$
only slightly above $Bo_c$
are still able to migrate away from the wall. The reason for the existence of a maximum
$Bo_c$
are still able to migrate away from the wall. The reason for the existence of a maximum $Bo$
for the NWZ regime is somewhat more subtle. As is well known, zigzagging bubbles rise in such a way that their minor axis remains almost aligned with their path at all times (Ellingsen & Risso Reference Ellingsen and Risso2001; Mougin & Magnaudet Reference Mougin and Magnaudet2006). For this, they perform oscillatory rigid-body rotations with an angular velocity that vanishes at the inflection points of the zigzags and reaches its maxima at their extremities. The more oblate the bubble is, hence the larger
$Bo$
for the NWZ regime is somewhat more subtle. As is well known, zigzagging bubbles rise in such a way that their minor axis remains almost aligned with their path at all times (Ellingsen & Risso Reference Ellingsen and Risso2001; Mougin & Magnaudet Reference Mougin and Magnaudet2006). For this, they perform oscillatory rigid-body rotations with an angular velocity that vanishes at the inflection points of the zigzags and reaches its maxima at their extremities. The more oblate the bubble is, hence the larger $Bo$
, the larger its resistance to such rotational motions is. This is due on the one hand to the rapid increase of the viscous torque with
$Bo$
, the larger its resistance to such rotational motions is. This is due on the one hand to the rapid increase of the viscous torque with $\chi$
(for a given rotation rate), and on the other hand to that of the moment of inertia of the liquid entrained by the rotational motion (so-called rotational added-mass coefficient), which governs the rate of change of the angular velocity. For instance, both quantities almost double from
$\chi$
(for a given rotation rate), and on the other hand to that of the moment of inertia of the liquid entrained by the rotational motion (so-called rotational added-mass coefficient), which governs the rate of change of the angular velocity. For instance, both quantities almost double from $\chi=2$
to
$\chi=2$
to $\chi=2.5$
when
$\chi=2.5$
when $Re\gg 1$
(Magnaudet Reference Magnaudet2011). This sharp increase limits severely the amplitude of the oscillatory rotations a bubble with a given volume may perform, which translates directly into a reduction in the amplitude of the zigzags. For instance, with
$Re\gg 1$
(Magnaudet Reference Magnaudet2011). This sharp increase limits severely the amplitude of the oscillatory rotations a bubble with a given volume may perform, which translates directly into a reduction in the amplitude of the zigzags. For instance, with $Ga=70$
, present simulations indicate that this amplitude decreases by a factor of two from
$Ga=70$
, present simulations indicate that this amplitude decreases by a factor of two from $Bo=0.25$
to
$Bo=0.25$
to $Bo=1.5$
in the unbounded configuration, and a similar decrease may be observed in figure 15
$Bo=1.5$
in the unbounded configuration, and a similar decrease may be observed in figure 15 $(c)$
in the presence of the wall. The above arguments concur to the conclusion that the NWZ regime can only exist within a finite range of
$(c)$
in the presence of the wall. The above arguments concur to the conclusion that the NWZ regime can only exist within a finite range of $\chi$
, hence of
$\chi$
, hence of $Bo$
.
$Bo$
.
6. Summary
We carried out three-dimensional numerical simulations of the buoyancy-driven motion of freely deformable bubbles rising near a vertical wall in the parameter range $0.02 \leqslant Bo \leqslant 2, 35 \leqslant Ga \leqslant 90$
. Within this range, provided the Bond number exceeds a
$0.02 \leqslant Bo \leqslant 2, 35 \leqslant Ga \leqslant 90$
. Within this range, provided the Bond number exceeds a $Ga$
-dependent threshold,
$Ga$
-dependent threshold, $Bo_c(Ga)$
, an isolated bubble immersed in an unbounded fluid follows a zigzagging or spiralling path, whereas it rises in a straight line if
$Bo_c(Ga)$
, an isolated bubble immersed in an unbounded fluid follows a zigzagging or spiralling path, whereas it rises in a straight line if $Bo\lt Bo_c(Ga)$
. In the latter case, the three distinct regimes of near-wall rising motions discussed at smaller
$Bo\lt Bo_c(Ga)$
. In the latter case, the three distinct regimes of near-wall rising motions discussed at smaller $Ga$
in Part 1, namely periodic near-wall bouncing, damped bouncing and migration away from the wall, are observed up to
$Ga$
in Part 1, namely periodic near-wall bouncing, damped bouncing and migration away from the wall, are observed up to $Ga \approx 50$
.
$Ga \approx 50$
.
For larger $Ga$
and small Bond numbers (typically
$Ga$
and small Bond numbers (typically $Bo\lt 0.05$
at
$Bo\lt 0.05$
at $Ga = 60$
and
$Ga = 60$
and $Bo\lesssim 0.1$
for
$Bo\lesssim 0.1$
for $Ga \geqslant 70$
), a new regime is found. In that BTE scenario, the bubble manages to escape from the wall region after one to two near-wall bounces. The escape mechanism is rooted in the abrupt flow reversal that takes place in the gap just before the bubble collides with the wall. This reversal is a consequence of the drop in the bubble rise speed which brings part of the fluid previously contained in the wake into the gap region. As a result, a strong rotational flow forms around the bubble surface, leading to a repulsive Magnus-like lift force that keeps a magnitude of the same order as the buoyancy force over a significant period of time after the collision. Bubbles are found to eventually escape from the wall region every time the spinning rate characterising the rotational flow at the bubble surface exceeds a critical value. A crude force balance allows the coefficient involved in the expression of the Magnus-like force to be estimated at around
$Ga \geqslant 70$
), a new regime is found. In that BTE scenario, the bubble manages to escape from the wall region after one to two near-wall bounces. The escape mechanism is rooted in the abrupt flow reversal that takes place in the gap just before the bubble collides with the wall. This reversal is a consequence of the drop in the bubble rise speed which brings part of the fluid previously contained in the wake into the gap region. As a result, a strong rotational flow forms around the bubble surface, leading to a repulsive Magnus-like lift force that keeps a magnitude of the same order as the buoyancy force over a significant period of time after the collision. Bubbles are found to eventually escape from the wall region every time the spinning rate characterising the rotational flow at the bubble surface exceeds a critical value. A crude force balance allows the coefficient involved in the expression of the Magnus-like force to be estimated at around $0.5$
. In an unbounded domain, path instability takes place when
$0.5$
. In an unbounded domain, path instability takes place when $Bo \geqslant Bo_c(Ga)$
. Paths of bubbles rising near a vertical wall are also found to experience transverse oscillations as soon as
$Bo \geqslant Bo_c(Ga)$
. Paths of bubbles rising near a vertical wall are also found to experience transverse oscillations as soon as $Bo \gt Bo_c(Ga)$
. This suggests that the wall plays little role in the occurrence of path instability. Its most significant effect appears to be the selection of the plane where the zigzagging motion takes place, which is always perpendicular to the wall. Simulations reveal that zigzagging or spiralling bubbles rising near a wall experience one of the following two scenarios.
$Bo \gt Bo_c(Ga)$
. This suggests that the wall plays little role in the occurrence of path instability. Its most significant effect appears to be the selection of the plane where the zigzagging motion takes place, which is always perpendicular to the wall. Simulations reveal that zigzagging or spiralling bubbles rising near a wall experience one of the following two scenarios.
For $Bo \gt Bo_c(Ga)$
and
$Bo \gt Bo_c(Ga)$
and $Ga$
up to
$Ga$
up to $50$
, or
$50$
, or $Bo \gt 1$
and larger
$Bo \gt 1$
and larger $Ga$
, bubbles ultimately migrate away from the wall, following a zigzagging motion for
$Ga$
, bubbles ultimately migrate away from the wall, following a zigzagging motion for $Bo \lesssim 1.5$
and a spiralling motion at larger
$Bo \lesssim 1.5$
and a spiralling motion at larger $Bo$
, on which a small lateral drift superimposes. The same phenomenology is observed whatever
$Bo$
, on which a small lateral drift superimposes. The same phenomenology is observed whatever $Ga$
just above the critical curve, i.e. for
$Ga$
just above the critical curve, i.e. for $Bo\gtrsim Bo_c(Ga)$
. In this WMA regime, the characteristics of the transverse path oscillations are very close to those determined in an unbounded domain. This is especially true regarding frequencies, be they those of the path oscillations themselves or those of the shape oscillations that develop under sufficiently supercritical conditions. In this regime, bubble wakes only interact weakly with the wall as soon as the gap thickness exceeds half of the bubble radius. Therefore, the repulsive interaction mechanism is essentially similar to that observed below the path instability threshold at lower
$Bo\gtrsim Bo_c(Ga)$
. In this WMA regime, the characteristics of the transverse path oscillations are very close to those determined in an unbounded domain. This is especially true regarding frequencies, be they those of the path oscillations themselves or those of the shape oscillations that develop under sufficiently supercritical conditions. In this regime, bubble wakes only interact weakly with the wall as soon as the gap thickness exceeds half of the bubble radius. Therefore, the repulsive interaction mechanism is essentially similar to that observed below the path instability threshold at lower $Ga$
. The net migration away from the wall does not vary monotonically with the control parameters
$Ga$
. The net migration away from the wall does not vary monotonically with the control parameters $Ga$
and
$Ga$
and $Bo$
. This is mostly due to the initial stages of the rise, during which the amount of time a given bubble spends close to the wall depends dramatically on the growth rate and saturated amplitude of the zigzags. For this reason, bubbles following paths with a slowly growing zigzagging component or performing lateral excursions with a moderate amplitude migrate faster.
$Bo$
. This is mostly due to the initial stages of the rise, during which the amount of time a given bubble spends close to the wall depends dramatically on the growth rate and saturated amplitude of the zigzags. For this reason, bubbles following paths with a slowly growing zigzagging component or performing lateral excursions with a moderate amplitude migrate faster.
For $Ga \geqslant 60$
and intermediate Bond numbers slightly larger than
$Ga \geqslant 60$
and intermediate Bond numbers slightly larger than $Bo_c(Ga)$
but smaller than an upper value between
$Bo_c(Ga)$
but smaller than an upper value between $1$
and
$1$
and $1.5$
, bubbles maintain a NWZ motion without migrating towards the bulk. The trapping phenomenon characterising this regime is a consequence of the intense interaction of the double-threaded wake with the wall during the stages when the gap comes to its minimum. The energy dissipation resulting from this wake–wall interaction translates into a severe drop in the rise speed, which in turn results in a drastic transient reduction of the bubble oblateness. Because of this, the frontal area opposing the transverse motion is larger when the bubble departs from the wall than when it returns to it. This makes it possible for resistive transverse forces, such as viscous drag and added mass, to counteract the repulsive interaction force, maintaining the centreline of the zigzagging motion a constant distance from the wall. The mechanism at play requires the zigzag amplitude to be large enough for bubbles to be trapped. This is why this regime only exists up to a maximum Bond number, the lateral excursions of highly oblate bubbles being severely limited by viscous and inertial effects resisting the periodic rotation needed to keep such bubbles broadside on along their path.
$1.5$
, bubbles maintain a NWZ motion without migrating towards the bulk. The trapping phenomenon characterising this regime is a consequence of the intense interaction of the double-threaded wake with the wall during the stages when the gap comes to its minimum. The energy dissipation resulting from this wake–wall interaction translates into a severe drop in the rise speed, which in turn results in a drastic transient reduction of the bubble oblateness. Because of this, the frontal area opposing the transverse motion is larger when the bubble departs from the wall than when it returns to it. This makes it possible for resistive transverse forces, such as viscous drag and added mass, to counteract the repulsive interaction force, maintaining the centreline of the zigzagging motion a constant distance from the wall. The mechanism at play requires the zigzag amplitude to be large enough for bubbles to be trapped. This is why this regime only exists up to a maximum Bond number, the lateral excursions of highly oblate bubbles being severely limited by viscous and inertial effects resisting the periodic rotation needed to keep such bubbles broadside on along their path.

Figure 16. Complete state diagram of near-wall rising regimes observed in the simulations up to $Ga=90$
and
$Ga=90$
and $Bo=2$
. Panels show
$Bo=2$
. Panels show $(a)$
the
$(a)$
the $(Bo,Ga)$
-plane;
$(Bo,Ga)$
-plane; $(b)$
the
$(b)$
the $(\chi,Re)$
-plane, with
$(\chi,Re)$
-plane, with $\chi$
and
$\chi$
and $Re$
determined as explained in the caption of figure 3. Solid line: neutral curve corresponding to the onset of path instability in an unbounded fluid (Bonnefis et al. Reference Bonnefis, Sierra-Ausin, Fabre and Magnaudet2024). The blue zone straddling the neutral curve represents the whole set of conditions under which bubbles migrate away from the wall, either in the presence or in the absence of path instability. In
$Re$
determined as explained in the caption of figure 3. Solid line: neutral curve corresponding to the onset of path instability in an unbounded fluid (Bonnefis et al. Reference Bonnefis, Sierra-Ausin, Fabre and Magnaudet2024). The blue zone straddling the neutral curve represents the whole set of conditions under which bubbles migrate away from the wall, either in the presence or in the absence of path instability. In $(b)$
, the two bullets at
$(b)$
, the two bullets at $(\chi, Re) = (2.1, 710)$
and
$(\chi, Re) = (2.1, 710)$
and $(\chi, Re) = (2.5, 1100)$
correspond to experimental data from de Vries (Reference de Vries2001) and Jeong & Park (Reference Jeong and Park2015), respectively. Both were obtained in water and show the persistence of the NWZ regime beyond the maximum
$(\chi, Re) = (2.5, 1100)$
correspond to experimental data from de Vries (Reference de Vries2001) and Jeong & Park (Reference Jeong and Park2015), respectively. Both were obtained in water and show the persistence of the NWZ regime beyond the maximum $Ga$
reached in the simulations.
$Ga$
reached in the simulations.
Figure 16 gathers present results and those obtained at lower $Ga$
in Part 1. It provides an overview of all the near-wall rising regimes we could identify for
$Ga$
in Part 1. It provides an overview of all the near-wall rising regimes we could identify for $Ga$
up to
$Ga$
up to $90$
and
$90$
and $Bo$
up to
$Bo$
up to $2$
. This map allows a global assessment of the influence of fluid inertia and bubble deformation on the transitions between the various styles of path. For weakly deformed bubbles, say
$2$
. This map allows a global assessment of the influence of fluid inertia and bubble deformation on the transitions between the various styles of path. For weakly deformed bubbles, say $Bo \lesssim 0.1$
, the response of the system is largely controlled by the two antagonistic forces that both originate in fluid inertia, namely the repulsive force induced by the vortical wake–wall interaction mechanism summarised in § 1 and the attractive force resulting from the acceleration of the fluid in the gap, as predicted when the flow is assumed irrotational. The vortical effect dominates up to
$Bo \lesssim 0.1$
, the response of the system is largely controlled by the two antagonistic forces that both originate in fluid inertia, namely the repulsive force induced by the vortical wake–wall interaction mechanism summarised in § 1 and the attractive force resulting from the acceleration of the fluid in the gap, as predicted when the flow is assumed irrotational. The vortical effect dominates up to $Ga\approx 10$
, making bubbles migrate away from the wall whatever
$Ga\approx 10$
, making bubbles migrate away from the wall whatever $Bo$
. The influence of the attractive irrotational effect increases gradually with increasing
$Bo$
. The influence of the attractive irrotational effect increases gradually with increasing $Ga$
(hence
$Ga$
(hence $Re$
), driving bubbles towards the wall when
$Re$
), driving bubbles towards the wall when $Ga\gtrsim 10$
(corresponding to
$Ga\gtrsim 10$
(corresponding to $Re \gtrsim 35$
). This attractive process gives rise to a damped near-wall bouncing regime up to
$Re \gtrsim 35$
). This attractive process gives rise to a damped near-wall bouncing regime up to $Ga\approx 17$
, i.e.
$Ga\approx 17$
, i.e. $Re\approx 65$
, then to a periodic near-wall bouncing regime at higher
$Re\approx 65$
, then to a periodic near-wall bouncing regime at higher $Ga$
. The latter persists up to
$Ga$
. The latter persists up to $Ga \approx 50$
at
$Ga \approx 50$
at $Bo = 0.01$
and
$Bo = 0.01$
and $Ga \approx 70$
at
$Ga \approx 70$
at $Bo = 0.1$
, which in both limits corresponds to
$Bo = 0.1$
, which in both limits corresponds to $Re\approx 500$
. For larger
$Re\approx 500$
. For larger $Ga$
, low-
$Ga$
, low- $Bo$
bubbles escape from the wall region following the BTE scenario. In this regime, the mechanism responsible for the bubble escape may be viewed as a side effect of the above irrotational mechanism. Indeed, the intensity of the tumbling flow that forms around the bubble surface during the collision with the wall depends crucially on the wall-ward velocity of the bubble and, thus, on the attractive force acting on it.
$Bo$
bubbles escape from the wall region following the BTE scenario. In this regime, the mechanism responsible for the bubble escape may be viewed as a side effect of the above irrotational mechanism. Indeed, the intensity of the tumbling flow that forms around the bubble surface during the collision with the wall depends crucially on the wall-ward velocity of the bubble and, thus, on the attractive force acting on it.
As $Bo$
increases beyond
$Bo$
increases beyond $0.1$
, bubbles become more oblate in inertia-dominated regimes. The above two antagonistic effects are still at work, but their magnitude is strongly influenced by the bubble shape. In particular, deformation significantly enhances the repulsive vortical effect, owing to the increase of the tangential vorticity at the bubble surface with the local curvature of this surface. This promotes the migration away from the wall, as the
$0.1$
, bubbles become more oblate in inertia-dominated regimes. The above two antagonistic effects are still at work, but their magnitude is strongly influenced by the bubble shape. In particular, deformation significantly enhances the repulsive vortical effect, owing to the increase of the tangential vorticity at the bubble surface with the local curvature of this surface. This promotes the migration away from the wall, as the $(\chi,Re)$
representation in figure 16
$(\chi,Re)$
representation in figure 16 $(b)$
highlights. Below the path instability threshold, all bubbles with
$(b)$
highlights. Below the path instability threshold, all bubbles with $Ga \leqslant 30$
(respectively,
$Ga \leqslant 30$
(respectively, $Ga\gt 30$
) migrate away from the wall as long as their aspect ratio exceeds
$Ga\gt 30$
) migrate away from the wall as long as their aspect ratio exceeds $\approx 1.5$
(respectively
$\approx 1.5$
(respectively $\approx 1.8$
). In the presence of path instability, i.e. for
$\approx 1.8$
). In the presence of path instability, i.e. for $\chi \gtrsim 1.95$
, bubbles still exhibit an average migration away from the wall, provided that the transient reduction in
$\chi \gtrsim 1.95$
, bubbles still exhibit an average migration away from the wall, provided that the transient reduction in $\chi$
they experience when they get very close to the wall remains weak enough. This reduction becomes significant (say
$\chi$
they experience when they get very close to the wall remains weak enough. This reduction becomes significant (say $\geqslant 5\,\%$
) when
$\geqslant 5\,\%$
) when $Ga \geqslant 60$
for intermediate Bond numbers such that
$Ga \geqslant 60$
for intermediate Bond numbers such that $Bo_c(Ga)\lesssim Bo\lesssim 1$
. In this high-
$Bo_c(Ga)\lesssim Bo\lesssim 1$
. In this high- $Ga$
intermediate-
$Ga$
intermediate- $Bo$
range, bubbles are trapped near the wall, undergoing a zigzagging-like motion without being able to escape to the bulk.
$Bo$
range, bubbles are trapped near the wall, undergoing a zigzagging-like motion without being able to escape to the bulk.
The two parts of this study provide comprehensive insights into the complex dynamics of buoyancy-driven isolated bubbles rising near a vertical hydrophilic wall. This second part highlights the complex interplay between wake–wall interactions, wall-induced fluid displacements, time-dependent bubble deformation and, in the relevant parameter range, lateral bubble excursions resulting from path instability.
The findings obtained in this study form a solid basis for developing low-order predictive semi-empirical models of near-wall bubble motion under a broad range of flow conditions. However, to get closer to practical applications, one has to consider configurations more representative of wall-bounded bubbly suspensions. In this context, one key aspect is the influence of inhomogeneity in the ambient flow ‘seen’ by a test bubble. Inhomogeneity may arise due to the presence of a neighbouring bubble or because the carrying flow is non-uniform. In the first case, Huang et al. (Reference Huang, Shi, Elkina, Schulz and Zhang2025) recently carried out simulations in which two identical bubbles initially arranged in line rise close to a vertical wall under moderately inertial conditions. They found that, due to the interaction with the leading bubble, the trailing bubble may escape from the wall, whereas the same bubble would bounce periodically close to the wall if it were rising alone. This change in the nature of the bubble dynamics highlights the need to consider interactions with neighbouring bubbles, especially if one is to predict the microstructure of the near-wall region in a bubbly suspension. A relevant and affordable follow-up to the above work would be its extension to the highly inertial regimes investigated in the present paper. Inhomogeneity also frequently arises through the non-uniformity of the carrying flow, especially when this flow is driven by a pressure gradient acting along the wall, such as in upward or downward pipe flows. In the upward configuration, it is well known that the shear-induced lift force tends to make nearly spherical or moderately deformed bubbles accumulate close to the wall, which is expected to strengthen wall–bubble interactions. Up to now, this problem has essentially been considered in weakly to moderately inertial regimes and quasi-steady conditions (Magnaudet, Takagi & Legendre Reference Magnaudet, Takagi and Legendre2003; Takemura, Magnaudet & Dimitrakopoulos Reference Takemura, Magnaudet and Dimitrakopoulos2009; Shi et al. Reference Shi, Rzehak, Lucas and Magnaudet2020). Only recently has the exploration of wall-bounded shear flow configurations under highly inertial conditions, where bubbles undergo zigzagging motions, started (Su et al. Reference Su, Sun, Zhang, Cai, Sun, Chen and Yu2024), with a focus on the time-averaged lateral force. How the non-uniformity in the ambient flow affects the nature of wall–bubble interactions, hence the bubble paths and eventually the time spent near the wall by bubbles experiencing such highly inertial conditions, is currently an open question. A numerical approach similar to that employed in the present study is appropriate to address it. Another important issue to be considered in future research concerns surfactant-induced Marangoni effects. Indeed, in most systems, bubbles are contaminated by surfactants present in the fluid, especially with water. The associated surface tension gradients are expected to strengthen wake effects, hence repulsive forces. Moreover, interactions with the wall tend to make the surfactant distribution asymmetric, which in turn induces an additional transverse force. How the combination of these effects affects the near-wall bubble dynamics over the various flow regimes has to be considered in future studies to improve engineering models for wall-bounded bubbly flows.
Funding
P.S. acknowledges the funding of the Deutsche Forschungsgemeinschaft (DFG, German Research Foundation) through grant number 501298479.
Declaration of interests
The authors report no conflict of interest.
Appendix A. Preliminary numerical tests
Extensive preliminary tests were carried out to assess the reliability of the numerical approach. According to the benchmark test for rising bubbles in Basilisk (Popinet Reference Popinet2017), the temporal and spatial accuracies of the predictions depend largely on five parameters: the Courant–Friedrichs–Lewy number $N_{CFL}$
, the standard tolerance in the Poisson solver
$N_{CFL}$
, the standard tolerance in the Poisson solver $T_\varepsilon$
, the grid refinement criteria for the phase fraction
$T_\varepsilon$
, the grid refinement criteria for the phase fraction $\zeta _f$
and velocity
$\zeta _f$
and velocity $\zeta _u$
and the minimum grid size
$\zeta _u$
and the minimum grid size $\overline \varDelta _{min }$
. For the specific problem under consideration, the tests conducted in Part 1 confirmed that setting
$\overline \varDelta _{min }$
. For the specific problem under consideration, the tests conducted in Part 1 confirmed that setting $N_{CFL} = 0.5$
,
$N_{CFL} = 0.5$
, $T_\varepsilon = 10^{-4}$
,
$T_\varepsilon = 10^{-4}$
, $\zeta _f = 10^{-3}$
,
$\zeta _f = 10^{-3}$
, $\zeta _u = 10^{-2}$
and
$\zeta _u = 10^{-2}$
and $\overline \varDelta _{min } = 1/68$
(further decreased to 1/136 when
$\overline \varDelta _{min } = 1/68$
(further decreased to 1/136 when $\overline \delta _{min } \leqslant 0.15$
) provides appropriately converged results. Specifically, the settings for the last two parameters guarantee a sufficient spatial resolution of the boundary layers at the wall and the bubble surface, as well as in the far wake (
$\overline \delta _{min } \leqslant 0.15$
) provides appropriately converged results. Specifically, the settings for the last two parameters guarantee a sufficient spatial resolution of the boundary layers at the wall and the bubble surface, as well as in the far wake ( $\gtrsim 10R$
downstream from the bubble centroid) for
$\gtrsim 10R$
downstream from the bubble centroid) for $Ga$
up to
$Ga$
up to $30$
, the highest
$30$
, the highest $Ga$
considered in Part 1. In the present work,
$Ga$
considered in Part 1. In the present work, $Ga$
goes up to 90, necessitating further verification of the values selected for these two parameters. For this purpose, we consider a case in the BTE regime with
$Ga$
goes up to 90, necessitating further verification of the values selected for these two parameters. For this purpose, we consider a case in the BTE regime with $(Bo, Ga) = (0.05, 90)$
, for which the bubble Reynolds number (based on the terminal velocity and bubble diameter) is approximately
$(Bo, Ga) = (0.05, 90)$
, for which the bubble Reynolds number (based on the terminal velocity and bubble diameter) is approximately $940$
. Therefore, with
$940$
. Therefore, with $\overline \varDelta _{min }=1/68$
(respectively
$\overline \varDelta _{min }=1/68$
(respectively $1/136$
) and
$1/136$
) and $\zeta _u = 10^{-2}$
, approximately three (respectively six) cells lie in the boundary layer surrounding the bubble surface.
$\zeta _u = 10^{-2}$
, approximately three (respectively six) cells lie in the boundary layer surrounding the bubble surface.
Figure 17 compares the predicted bubble motion for $(Bo, Ga) = (0.05, 90)$
using three different settings for
$(Bo, Ga) = (0.05, 90)$
using three different settings for $\overline \varDelta _{min }$
. For all three runs,
$\overline \varDelta _{min }$
. For all three runs, $\zeta _u$
is fixed to
$\zeta _u$
is fixed to $10^{-2}$
. Irrespective of
$10^{-2}$
. Irrespective of $\overline \varDelta _{min }$
, the predicted lateral motion remains largely within the wall-normal plane, as the deviation of the bubble in the spanwise wall-parallel direction remains small, with
$\overline \varDelta _{min }$
, the predicted lateral motion remains largely within the wall-normal plane, as the deviation of the bubble in the spanwise wall-parallel direction remains small, with $Z_b$
never exceeding
$Z_b$
never exceeding $0.2$
. The farthest wall-normal position where the bubble finally rests is approximately
$0.2$
. The farthest wall-normal position where the bubble finally rests is approximately $6.75$
with
$6.75$
with $\overline \varDelta _{min }=1/68$
, while it is approximately
$\overline \varDelta _{min }=1/68$
, while it is approximately $5.5$
, i.e. significantly closer to the wall, with
$5.5$
, i.e. significantly closer to the wall, with $\overline \varDelta _{min }=1/136$
. Close inspection of the predictions reveals that, as
$\overline \varDelta _{min }=1/136$
. Close inspection of the predictions reveals that, as $\overline \varDelta _{min }$
decreases from
$\overline \varDelta _{min }$
decreases from $1/68$
to
$1/68$
to $1/136$
, the bubble reaches a slightly larger separation during the final reversal stage (inset in panel
$1/136$
, the bubble reaches a slightly larger separation during the final reversal stage (inset in panel $a$
), resulting in a lower peak in the departure velocity as it escapes from the near-wall region (consider the situation at
$a$
), resulting in a lower peak in the departure velocity as it escapes from the near-wall region (consider the situation at $T\approx 12$
in panel
$T\approx 12$
in panel $c$
). The smaller final separation obtained with the finer grid follows. Conversely, the final rise speeds obtained with the different
$c$
). The smaller final separation obtained with the finer grid follows. Conversely, the final rise speeds obtained with the different $\overline \varDelta _{min }$
show no discernible difference (panel
$\overline \varDelta _{min }$
show no discernible difference (panel $d$
). These observations prove the importance of a sufficient spatial resolution within the wall boundary layer, especially during stages of intense bubble–wall interaction, to accurately predict the final wall-normal position of the bubble. This is further corroborated by the good agreement observed between predictions with
$d$
). These observations prove the importance of a sufficient spatial resolution within the wall boundary layer, especially during stages of intense bubble–wall interaction, to accurately predict the final wall-normal position of the bubble. This is further corroborated by the good agreement observed between predictions with $\overline \varDelta _{min }=1/136$
and those adopting an adaptive
$\overline \varDelta _{min }=1/136$
and those adopting an adaptive $\overline \varDelta _{min }$
, where
$\overline \varDelta _{min }$
, where $\overline \varDelta _{min }=1/68$
is decreased to
$\overline \varDelta _{min }=1/68$
is decreased to $1/136$
only during stages when
$1/136$
only during stages when $\overline \delta _{min }(T) \leqslant 0.15$
.
$\overline \delta _{min }(T) \leqslant 0.15$
.
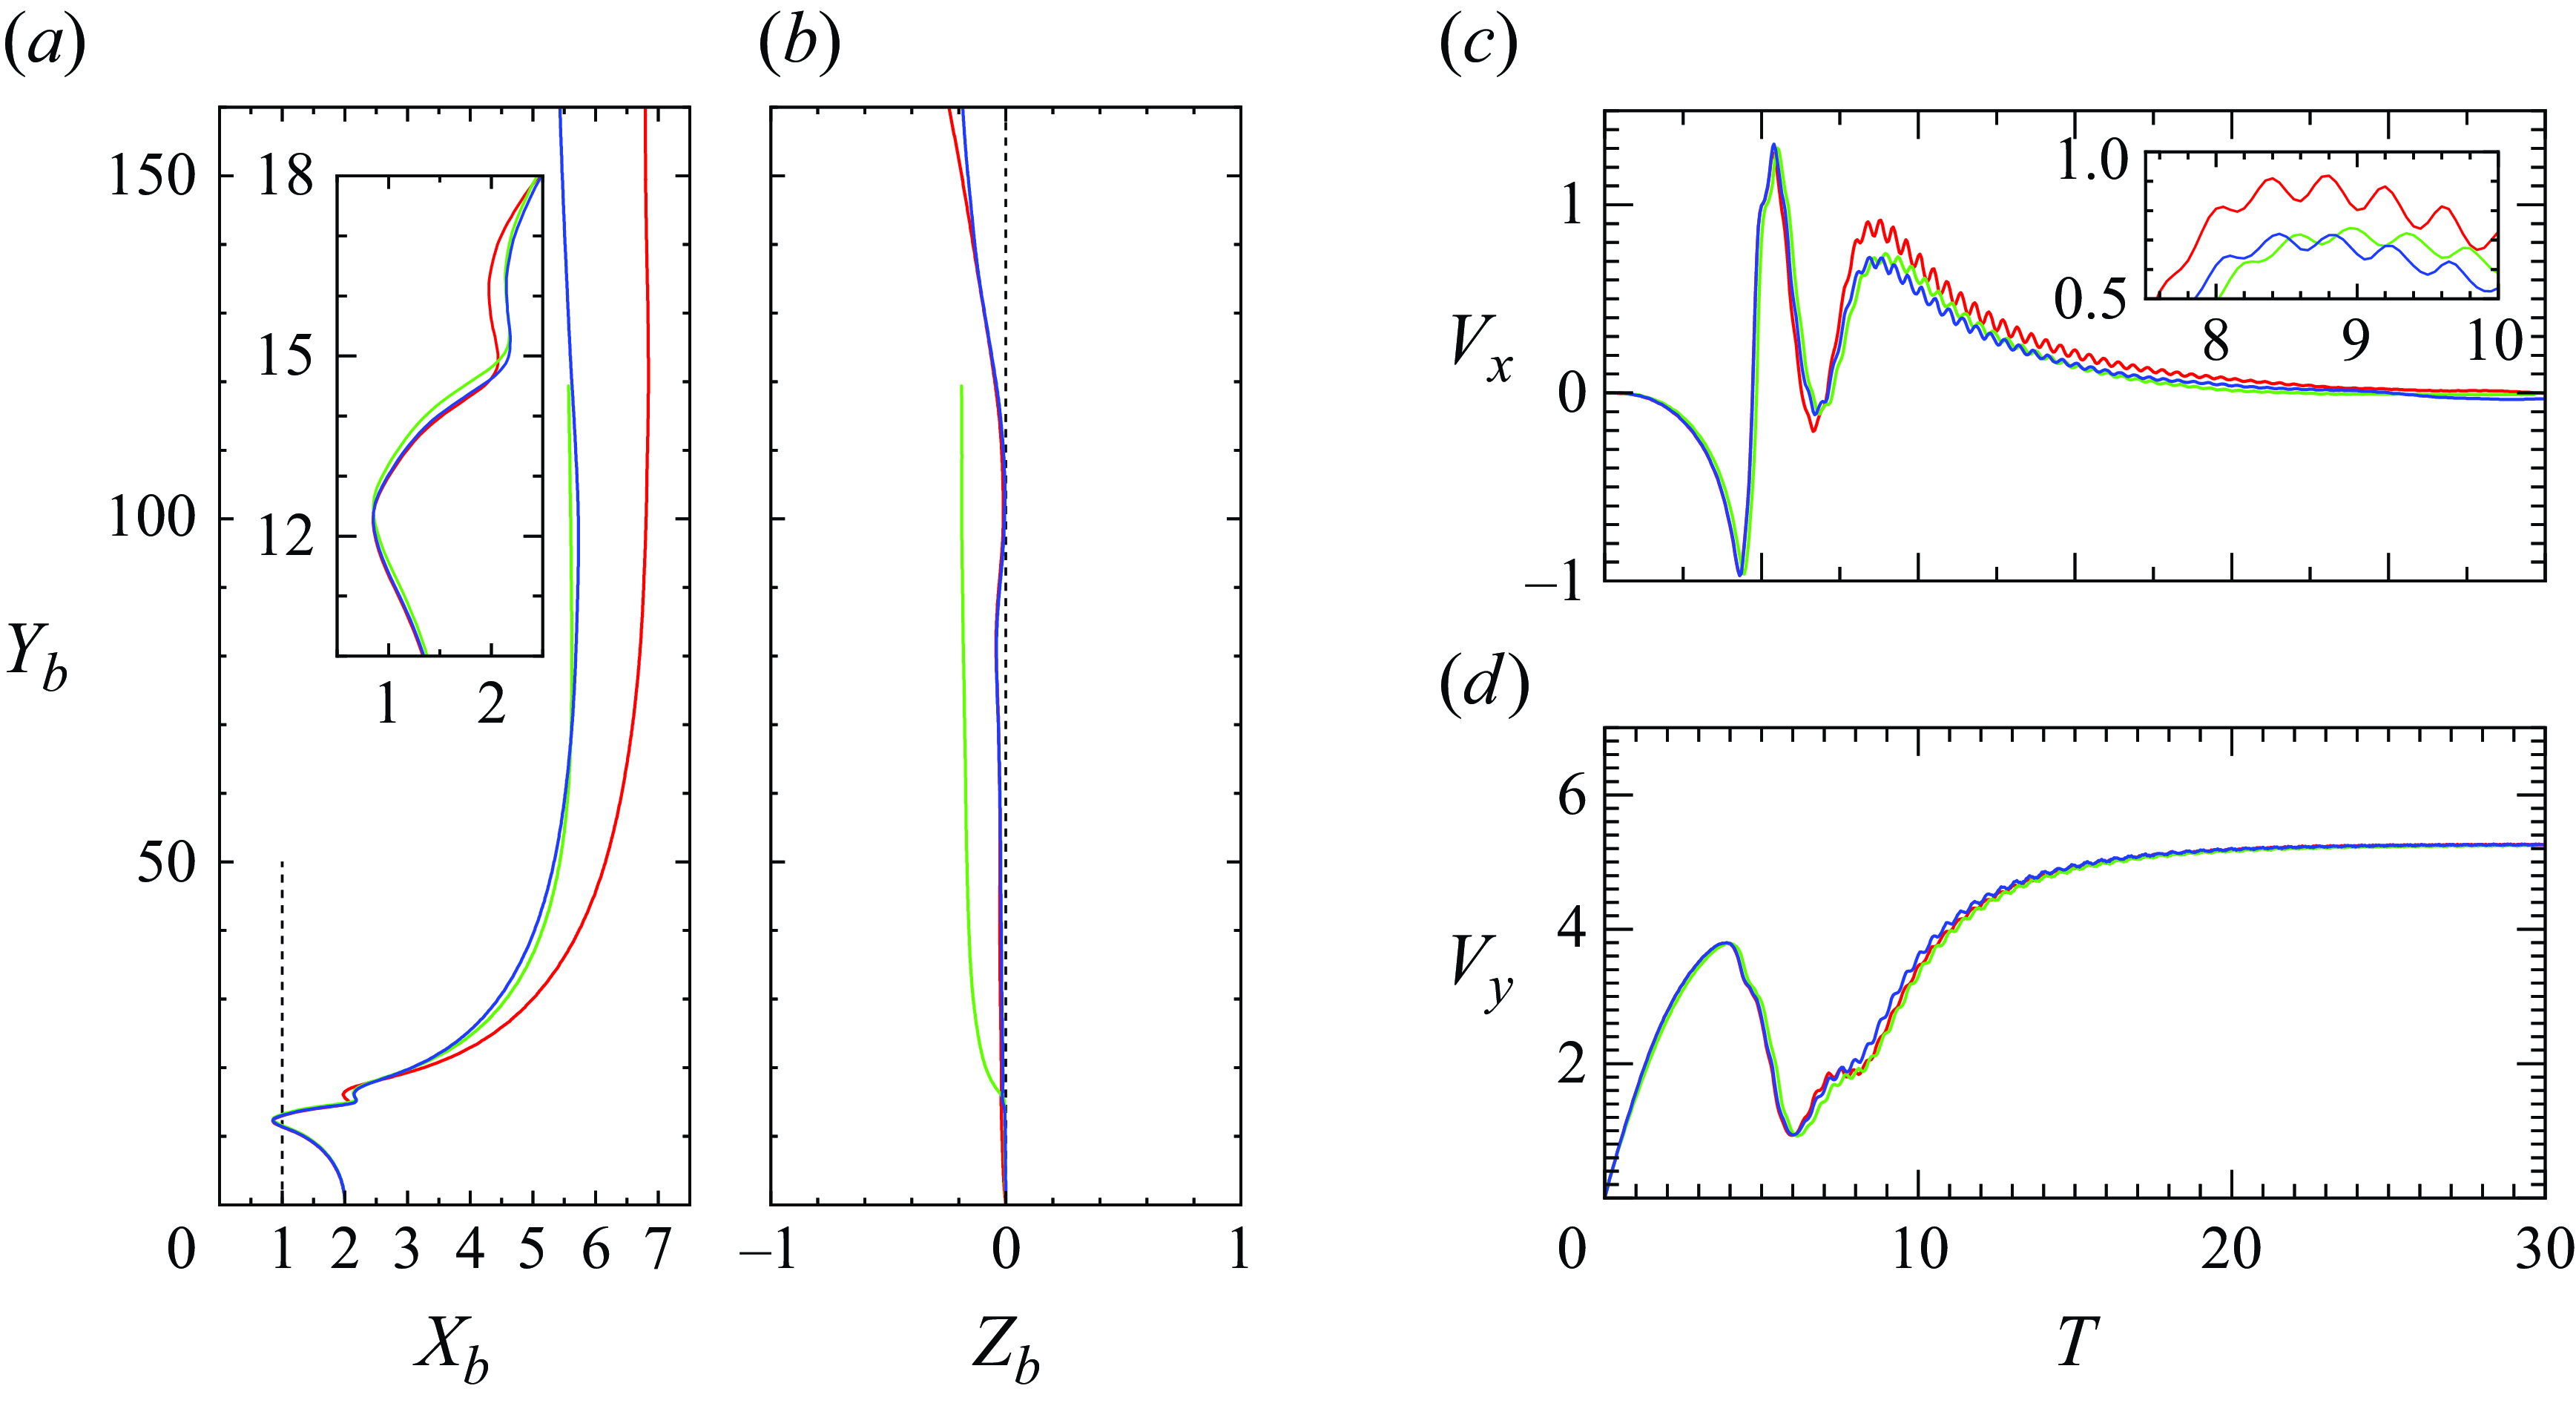
Figure 17. Effects of the minimum grid size on the predicted bubble motion for $(Bo, Ga) = (0.05, 90)$
. Red and green lines correspond to cases with
$(Bo, Ga) = (0.05, 90)$
. Red and green lines correspond to cases with $\overline \varDelta _{min } = 1/68$
and
$\overline \varDelta _{min } = 1/68$
and $1/136$
, respectively, while the blue line refers to the case where
$1/136$
, respectively, while the blue line refers to the case where $\overline \varDelta _{min }$
is decreased from
$\overline \varDelta _{min }$
is decreased from $1/68$
to
$1/68$
to $1/136$
only when
$1/136$
only when $\overline \delta _{min } \leqslant 0.15$
. Panels (
$\overline \delta _{min } \leqslant 0.15$
. Panels ( $a$
) and (
$a$
) and ( $b$
) show the bubble path in the wall-normal and wall-parallel planes, respectively; panels (
$b$
) show the bubble path in the wall-normal and wall-parallel planes, respectively; panels ( $c$
) and (
$c$
) and ( $d$
) show the evolution of the wall-normal (
$d$
) show the evolution of the wall-normal ( $V_x$
) and vertical (
$V_x$
) and vertical ( $V_y$
) velocities of the bubble centroid, respectively.
$V_y$
) velocities of the bubble centroid, respectively.
Effects of $\zeta _u$
are assessed based on the same test case. For this purpose,
$\zeta _u$
are assessed based on the same test case. For this purpose, $\overline \varDelta _{min }$
is set to
$\overline \varDelta _{min }$
is set to $1/68$
and
$1/68$
and $\zeta _u$
is decreased from
$\zeta _u$
is decreased from $10^{-2}$
to
$10^{-2}$
to $2\times 10^{-3}$
, which decreases the cell size within the far wake from
$2\times 10^{-3}$
, which decreases the cell size within the far wake from $1/17$
to
$1/17$
to $1/34$
. With this refinement, the total number of grid cells when the boundary layer at the bubble surface is fully developed increases from
$1/34$
. With this refinement, the total number of grid cells when the boundary layer at the bubble surface is fully developed increases from $4.3$
million to
$4.3$
million to $21.8$
million. Figure 18 compares the predictions obtained by varying
$21.8$
million. Figure 18 compares the predictions obtained by varying $\zeta _u$
for the wall-normal and vertical bubble velocity components. It appears that the coarser resolution in the far wake leads to an underestimate of viscous effects. Specifically, the departing velocity (and to some minor extent the terminal rise speed) predicted with
$\zeta _u$
for the wall-normal and vertical bubble velocity components. It appears that the coarser resolution in the far wake leads to an underestimate of viscous effects. Specifically, the departing velocity (and to some minor extent the terminal rise speed) predicted with $\zeta _u=10^{-2}$
is slightly larger than that obtained using smaller values of
$\zeta _u=10^{-2}$
is slightly larger than that obtained using smaller values of $\zeta _u$
. In contrast, predictions obtained with
$\zeta _u$
. In contrast, predictions obtained with $\zeta _u=5\times 10^{-3}$
and
$\zeta _u=5\times 10^{-3}$
and $\zeta _u=2\times 10^{-3}$
exhibit only modest differences. Given this finding, and considering the significantly larger number of grid cells required with
$\zeta _u=2\times 10^{-3}$
exhibit only modest differences. Given this finding, and considering the significantly larger number of grid cells required with $\zeta _u=2\times 10^{-3}$
(
$\zeta _u=2\times 10^{-3}$
( $21.8$
million compared with
$21.8$
million compared with $8.4$
million), we set
$8.4$
million), we set $\zeta _u=5\times 10^{-3}$
in all runs discussed in the paper.
$\zeta _u=5\times 10^{-3}$
in all runs discussed in the paper.
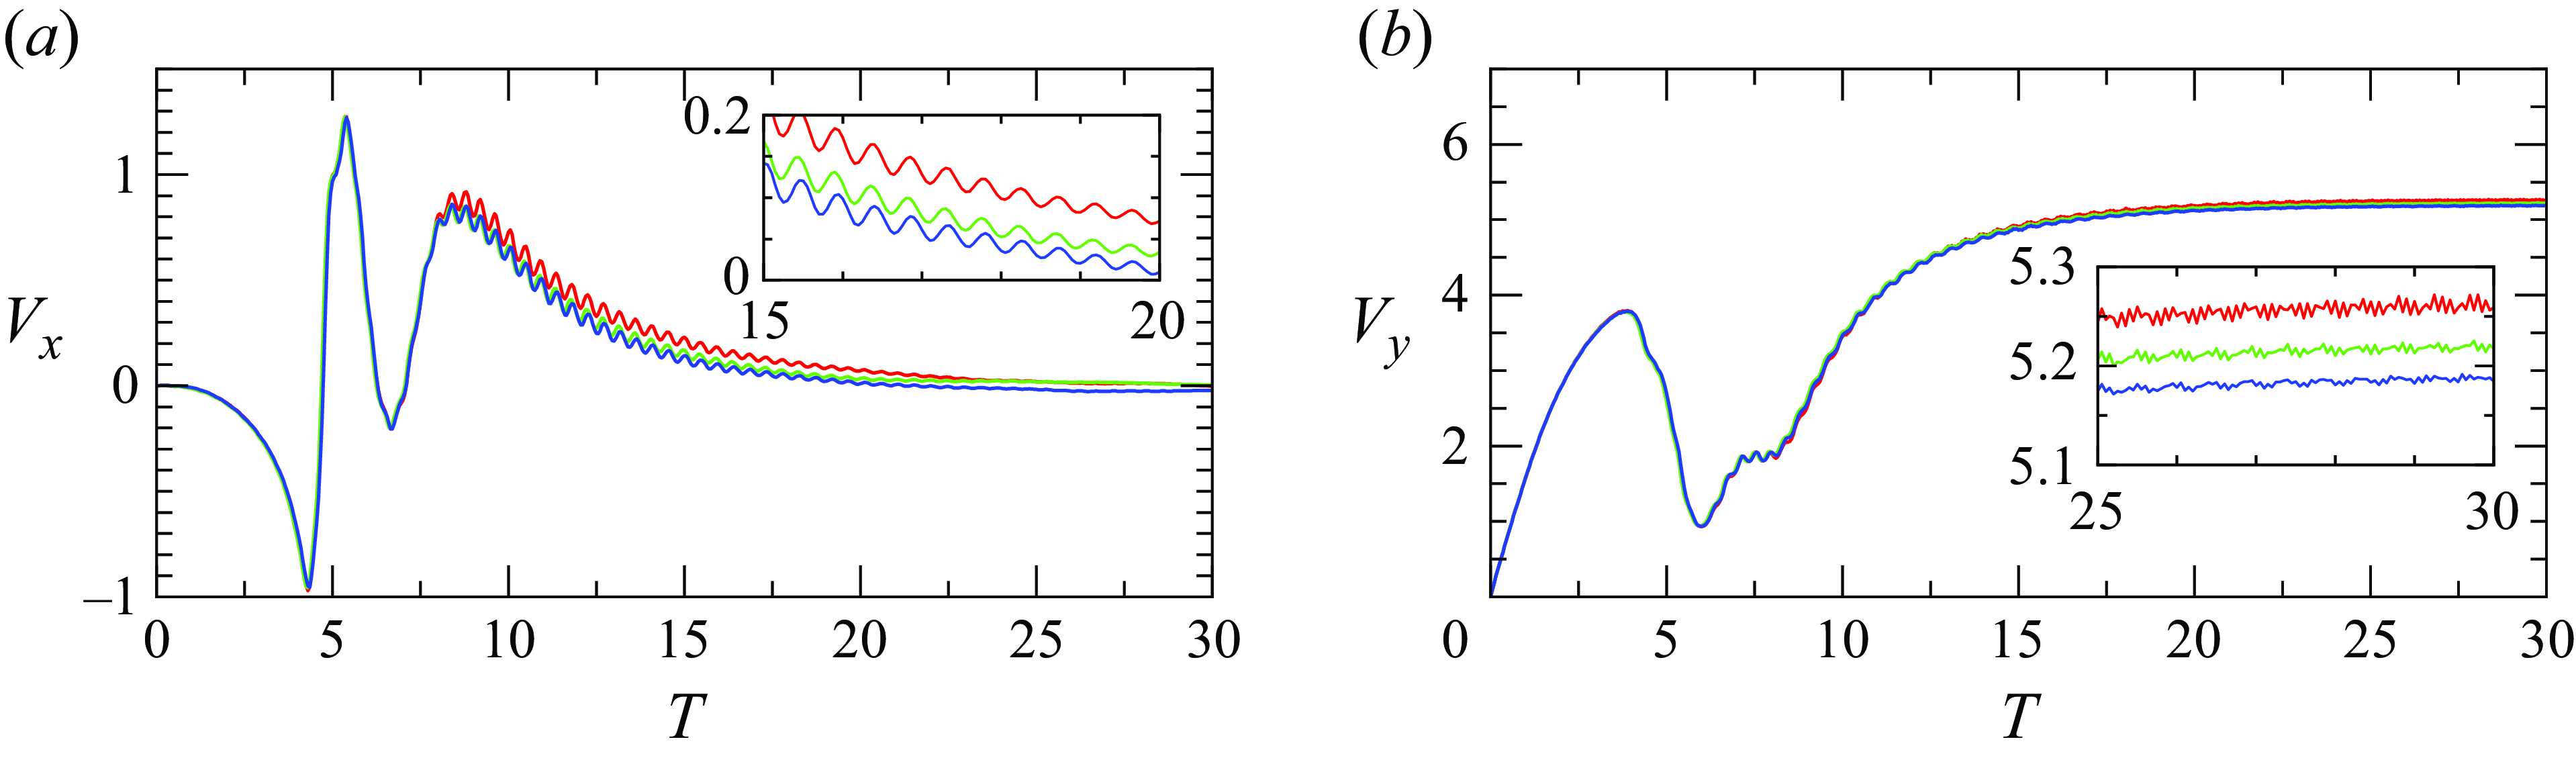
Figure 18. Effects of $\zeta _u$
on the predicted wall-normal (
$\zeta _u$
on the predicted wall-normal ( $V_x$
) and vertical (
$V_x$
) and vertical ( $V_y$
) velocities of the bubble centroid for
$V_y$
) velocities of the bubble centroid for $(Bo, Ga) = (0.05, 90)$
. Red, green and blue lines correspond to predictions obtained with
$(Bo, Ga) = (0.05, 90)$
. Red, green and blue lines correspond to predictions obtained with $\zeta _u=10^{-2}$
,
$\zeta _u=10^{-2}$
, $5\times 10^{-3}$
and
$5\times 10^{-3}$
and $2\times 10^{-3}$
, respectively.
$2\times 10^{-3}$
, respectively.
Following the above observations and taking advantage of our prior preliminary tests in Part 1, we find it reasonable to set the five numerical parameters as follows: $N_{CFL} = 0.5$
,
$N_{CFL} = 0.5$
, $T_\varepsilon = 10^{-4}$
,
$T_\varepsilon = 10^{-4}$
, $\zeta _f = 10^{-3}$
,
$\zeta _f = 10^{-3}$
, $\zeta _u = 5\times 10^{-3}$
and
$\zeta _u = 5\times 10^{-3}$
and $\overline \varDelta _{min } = 1/68$
, automatically reduced to
$\overline \varDelta _{min } = 1/68$
, automatically reduced to $\overline \varDelta _{min } =1/136$
when
$\overline \varDelta _{min } =1/136$
when $\overline \delta _{min }(T) \leqslant 0.15$
.
$\overline \delta _{min }(T) \leqslant 0.15$
.
To further check the numerical approach, we carry out two additional runs belonging to different $(Bo, Ga)$
ranges, for which reference data are available. First, we select
$(Bo, Ga)$
ranges, for which reference data are available. First, we select $(Bo, Ga) = (1, 35)$
, corresponding to an air bubble with
$(Bo, Ga) = (1, 35)$
, corresponding to an air bubble with $R\approx 1.46\,\text{mm}$
rising in silicone oil DMS-T05 (
$R\approx 1.46\,\text{mm}$
rising in silicone oil DMS-T05 ( $Mo=6.2\times 10^{-7}$
), as considered experimentally by Estepa-Cantero et al. (Reference Estepa-Cantero, Martínez-Bazán and Bolaños Jiménez2024). Present predictions and experimental observations both conclude that the bubble departs from the wall and exhibits path oscillations in the wall-normal plane. Figure 19 shows how the results for the evolution of the wall-normal bubble position,
$Mo=6.2\times 10^{-7}$
), as considered experimentally by Estepa-Cantero et al. (Reference Estepa-Cantero, Martínez-Bazán and Bolaños Jiménez2024). Present predictions and experimental observations both conclude that the bubble departs from the wall and exhibits path oscillations in the wall-normal plane. Figure 19 shows how the results for the evolution of the wall-normal bubble position, $X_b$
, and velocity,
$X_b$
, and velocity, $V_x$
, compare. Owing to differences in the bubble shape and rise speed in the initial state, differences are observed between the predicted and the experimental evolutions in the early stages of the near-wall motion. The agreement is fairly good in later stages, although slight deviations subsist in the maximum and minimum wall-normal position beyond
$V_x$
, compare. Owing to differences in the bubble shape and rise speed in the initial state, differences are observed between the predicted and the experimental evolutions in the early stages of the near-wall motion. The agreement is fairly good in later stages, although slight deviations subsist in the maximum and minimum wall-normal position beyond $T\approx 100$
. In the simulation, the Reynolds number based on the mean rise speed reached by the bubble when it moves far away from the wall (
$T\approx 100$
. In the simulation, the Reynolds number based on the mean rise speed reached by the bubble when it moves far away from the wall ( $X_b\geqslant 3$
) is
$X_b\geqslant 3$
) is $Re\approx 110.6$
, closely matching the value determined experimentally in the absence of the wall,
$Re\approx 110.6$
, closely matching the value determined experimentally in the absence of the wall, $Re=114.6$
. Additionally, for
$Re=114.6$
. Additionally, for $T\geqslant 100$
, the crest-to-crest amplitude of the transverse oscillations, the magnitude of the maximum wall-normal velocity and the reduced frequency of the oscillations are
$T\geqslant 100$
, the crest-to-crest amplitude of the transverse oscillations, the magnitude of the maximum wall-normal velocity and the reduced frequency of the oscillations are $\overline {a}=1.37$
,
$\overline {a}=1.37$
, $V_x^{\textit{max} }=0.370$
and
$V_x^{\textit{max} }=0.370$
and $St=0.108$
in the simulation, closely aligning with the experimental values
$St=0.108$
in the simulation, closely aligning with the experimental values $\overline {a}=1.36$
,
$\overline {a}=1.36$
, $V_x^{\textit{max} }=0.358$
and
$V_x^{\textit{max} }=0.358$
and $St=0.104$
.
$St=0.104$
.
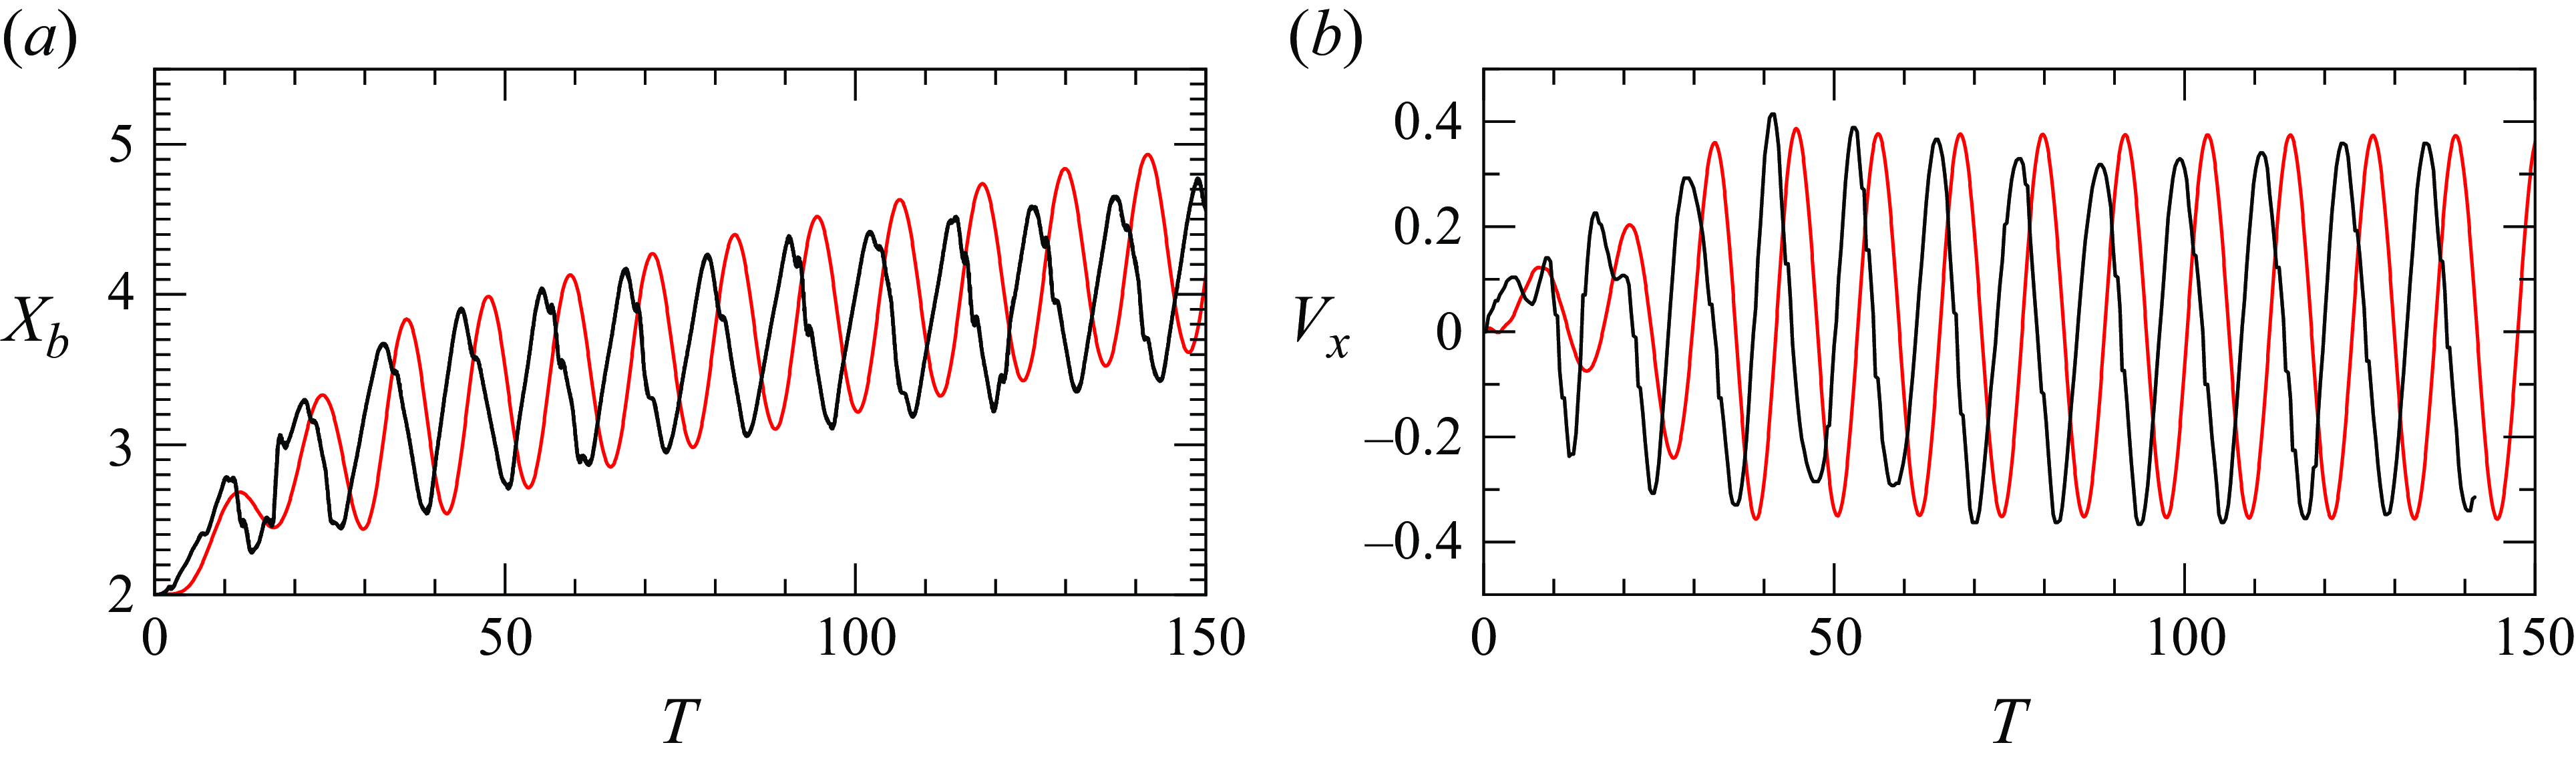
Figure 19. Comparison between predictions (red line, $(Bo, Ga) = (1, 35)$
) and experimental results from Estepa-Cantero et al. (Reference Estepa-Cantero, Martínez-Bazán and Bolaños Jiménez2024) (black line,
$(Bo, Ga) = (1, 35)$
) and experimental results from Estepa-Cantero et al. (Reference Estepa-Cantero, Martínez-Bazán and Bolaños Jiménez2024) (black line, $(Bo, Ga) = (0.97, 35)$
) for the evolution of (
$(Bo, Ga) = (0.97, 35)$
) for the evolution of ( $a$
) the wall-normal position of the bubble centroid; and (
$a$
) the wall-normal position of the bubble centroid; and ( $b$
) the wall-normal velocity of the centroid.
$b$
) the wall-normal velocity of the centroid.
In the second case, we consider a bubble rising from rest in an unbounded domain for $(Bo, Ga) = (0.134, 99)$
. This parameter set corresponds to an air bubble with
$(Bo, Ga) = (0.134, 99)$
. This parameter set corresponds to an air bubble with $R=1\,\text{mm}$
rising in pure water at
$R=1\,\text{mm}$
rising in pure water at $20\,^\circ \text{C}$
(
$20\,^\circ \text{C}$
( $Mo=2.54\times 10^{-11}$
), a configuration already considered in experiments (Duineveld Reference Duineveld1995; Tagawa et al. Reference Tagawa, Takagi and Matsumoto2014). Figure 20 illustrates the evolution of the bubble path, velocity and aspect ratio, all obtained from the present simulation. The bubble successively follows a straight path, then a flattened helical path and finally tends to transition to a planar zigzagging path. This transition sequence differs from that reported by Tagawa et al. (Reference Tagawa, Takagi and Matsumoto2014), presumably due to the different initial conditions in the simulation and the experiment (Tchoufag, Fabre & Magnaudet Reference Tchoufag, Fabre and Magnaudet2015). Aside from this difference, the mean values for the rise speed
$Mo=2.54\times 10^{-11}$
), a configuration already considered in experiments (Duineveld Reference Duineveld1995; Tagawa et al. Reference Tagawa, Takagi and Matsumoto2014). Figure 20 illustrates the evolution of the bubble path, velocity and aspect ratio, all obtained from the present simulation. The bubble successively follows a straight path, then a flattened helical path and finally tends to transition to a planar zigzagging path. This transition sequence differs from that reported by Tagawa et al. (Reference Tagawa, Takagi and Matsumoto2014), presumably due to the different initial conditions in the simulation and the experiment (Tchoufag, Fabre & Magnaudet Reference Tchoufag, Fabre and Magnaudet2015). Aside from this difference, the mean values for the rise speed $V_y$
, the reduced frequency associated with the wall-normal velocity
$V_y$
, the reduced frequency associated with the wall-normal velocity $V_x$
(which is half that associated with
$V_x$
(which is half that associated with $V_y$
), and the bubble aspect ratio (averaged over the last five periods of oscillation of
$V_y$
), and the bubble aspect ratio (averaged over the last five periods of oscillation of $V_y$
) are
$V_y$
) are $V_y=3.55,\, St=0.04,\,\chi=2.14$
, all in good agreement with the values from previous investigations, namely
$V_y=3.55,\, St=0.04,\,\chi=2.14$
, all in good agreement with the values from previous investigations, namely $V_y=3.59, St=0.038, \,\chi=2.14$
.
$V_y=3.59, St=0.038, \,\chi=2.14$
.
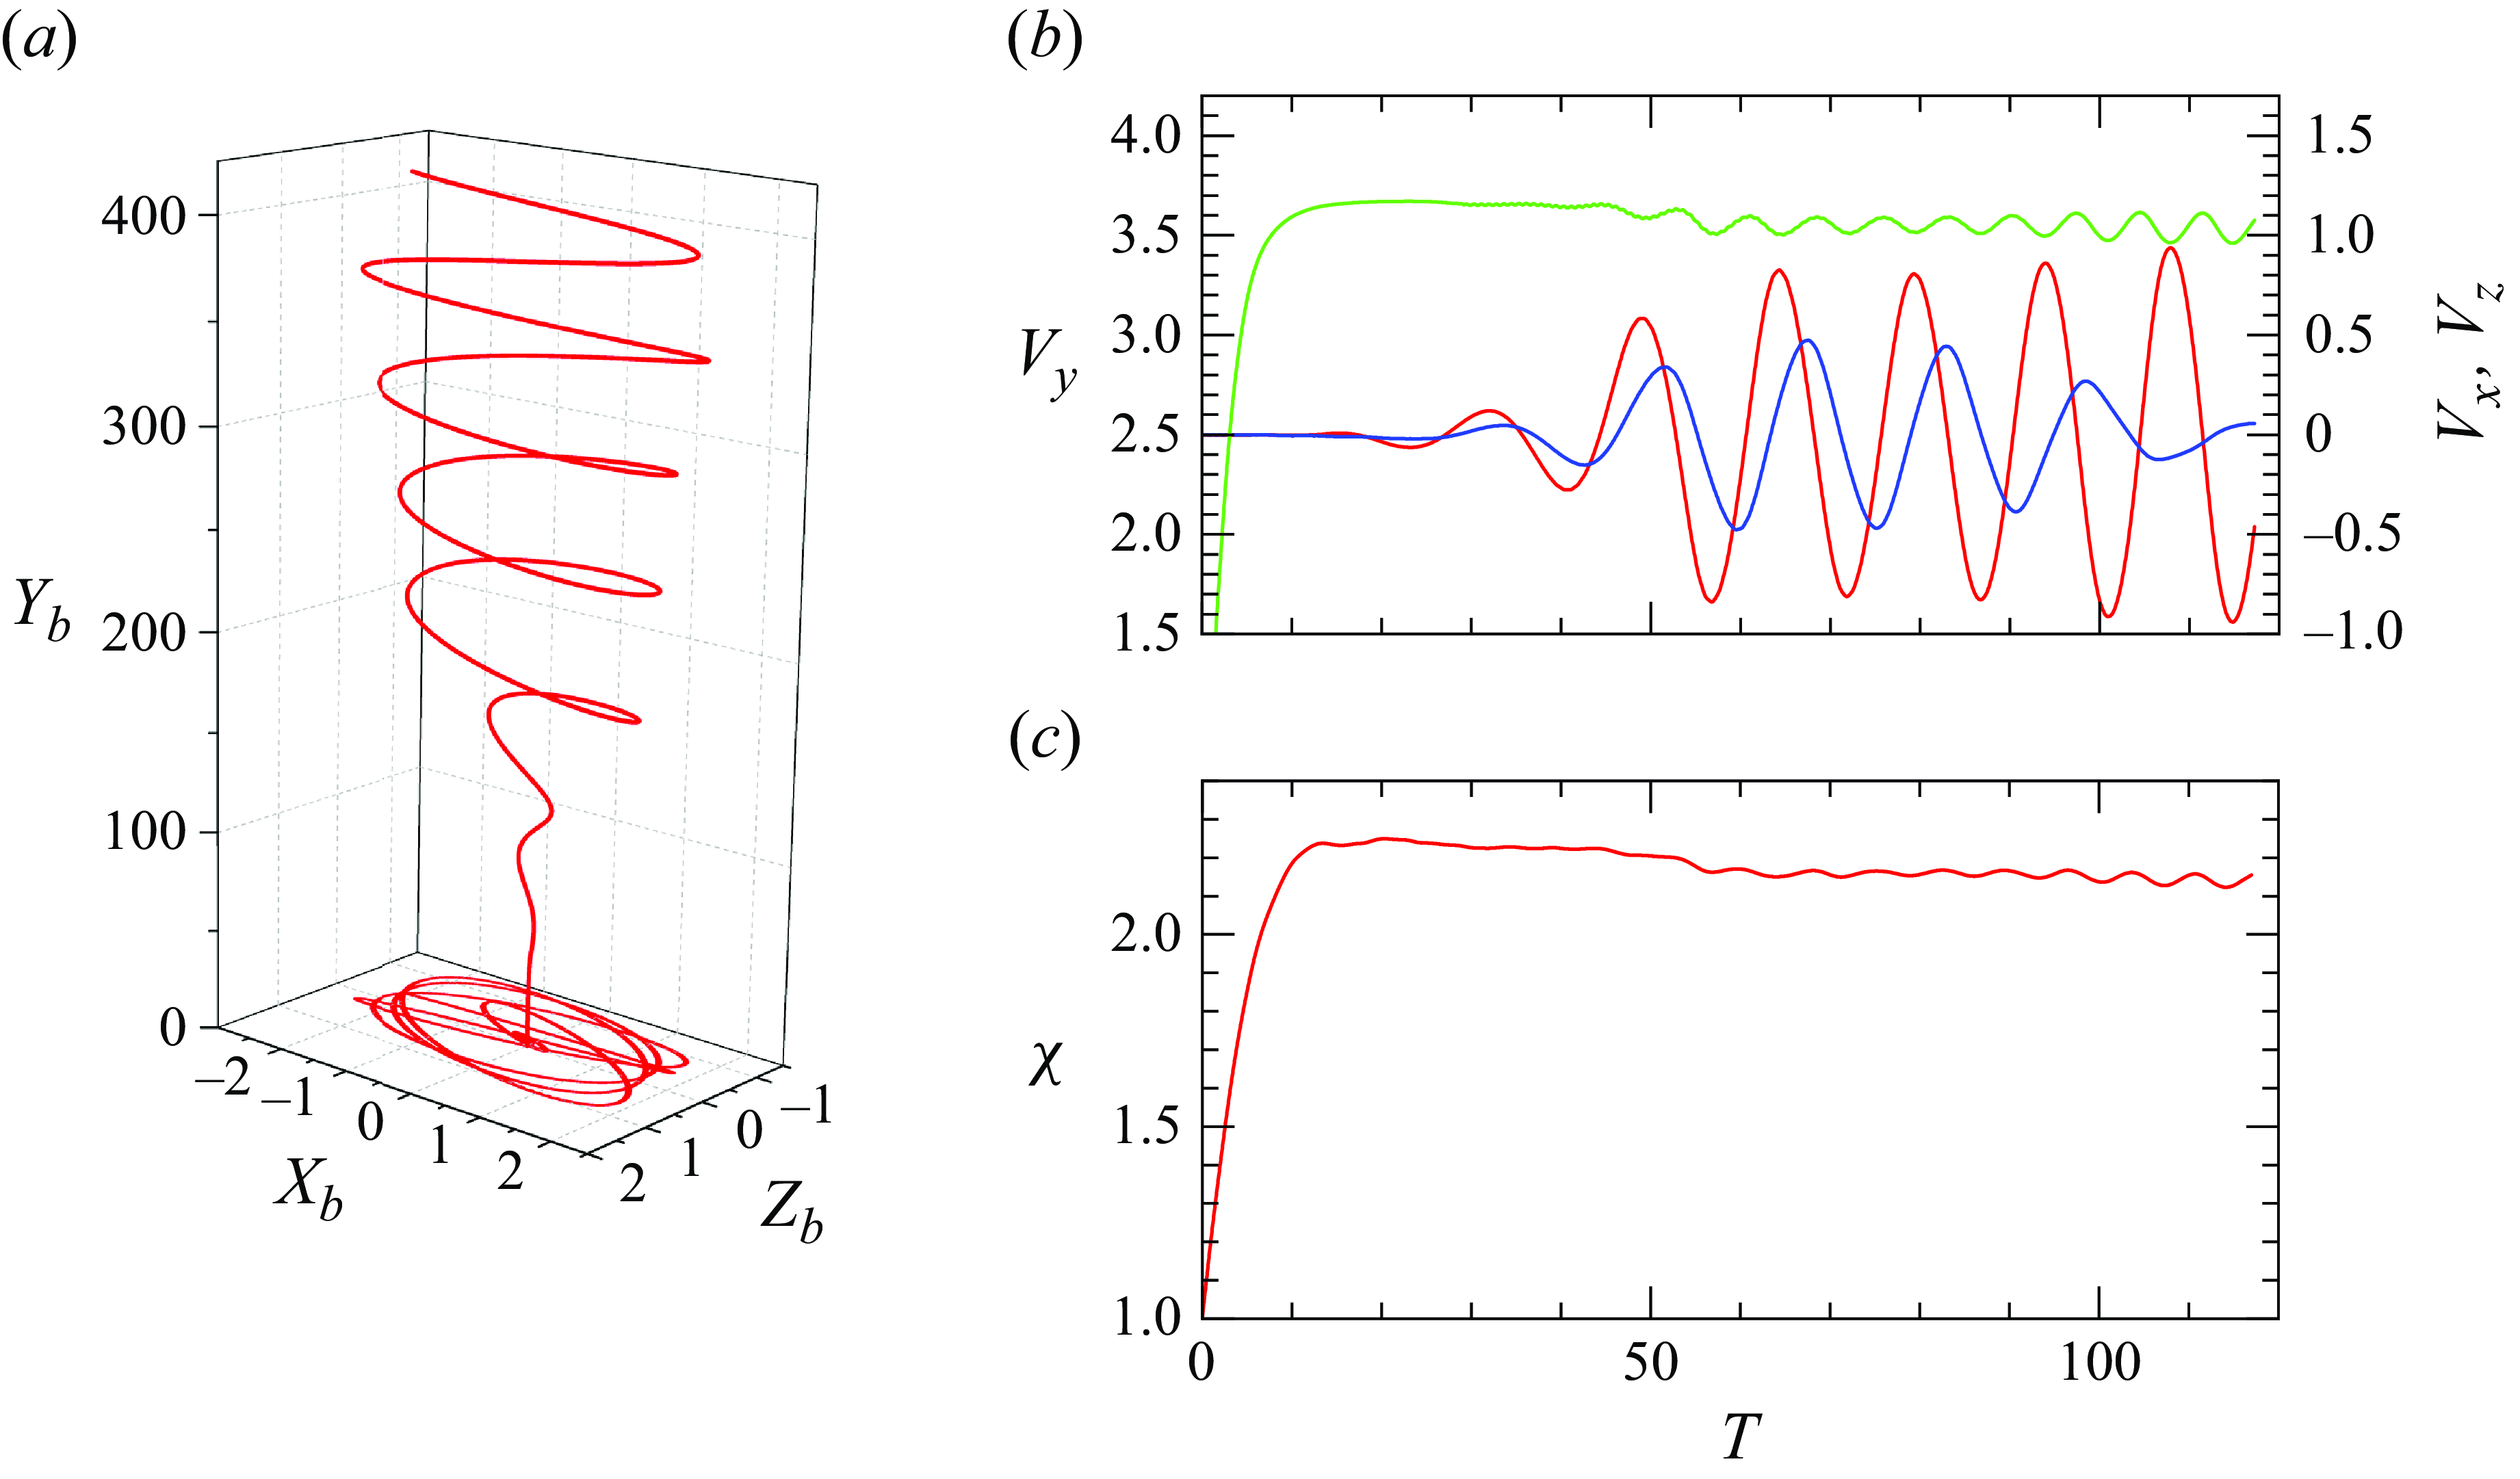
Figure 20. Predictions of the path characteristics of a single bubble with $(Bo, Ga) = (0.134, 99)$
rising from rest in an unbounded fluid domain. (
$(Bo, Ga) = (0.134, 99)$
rising from rest in an unbounded fluid domain. ( $a$
) Front and bottom views of the path; (
$a$
) Front and bottom views of the path; ( $b$
) evolution of the vertical (green line), and horizontal (red and blue lines) velocity components of the bubble centroid; (
$b$
) evolution of the vertical (green line), and horizontal (red and blue lines) velocity components of the bubble centroid; ( $c$
) evolution of the bubble aspect ratio. The path eventually converges to a planar zigzagging motion in the
$c$
) evolution of the bubble aspect ratio. The path eventually converges to a planar zigzagging motion in the $(x,y)$
plane.
$(x,y)$
plane.
Appendix B. Influence of initial separation
The regime map gathering the various styles of path that are observed (figure 2 $a$
) was established based on simulations with an initial bubble–wall separation
$a$
) was established based on simulations with an initial bubble–wall separation $X_0=2$
. However, as the following discussion shows, this regime map remains unchanged when the initial separation is varied, provided that
$X_0=2$
. However, as the following discussion shows, this regime map remains unchanged when the initial separation is varied, provided that $X_0$
is not too large for wall effects to remain sizeable.
$X_0$
is not too large for wall effects to remain sizeable.
Below the neutral curve of path instability, four distinct scenarios take place. The influence of the initial separation on the first three of them (periodic near-wall bouncing, damped bouncing, migration away from the wall) was assessed in Part 1 (see Appendix C therein). In all cases it was found that $X_0$
only affects the initial stage of the bubble motion, leaving it unchanged in the fully developed state. Here, while
$X_0$
only affects the initial stage of the bubble motion, leaving it unchanged in the fully developed state. Here, while $Ga$
is larger, the mechanisms responsible for these three scenarios remain unchanged and so are the conclusions reached in Part 1. Figure 21 displays the influence of the initial separation in a case typical of the last of these four scenarios, the BTE regime. The corresponding
$Ga$
is larger, the mechanisms responsible for these three scenarios remain unchanged and so are the conclusions reached in Part 1. Figure 21 displays the influence of the initial separation in a case typical of the last of these four scenarios, the BTE regime. The corresponding $(Bo,Ga)$
set is that considered in figure 6. All bubbles are found to eventually escape from the wall, since the final bubble–wall separation is large (
$(Bo,Ga)$
set is that considered in figure 6. All bubbles are found to eventually escape from the wall, since the final bubble–wall separation is large ( $X_b(T\rightarrow \infty)\gt 6$
) in all cases. The only noticeable effect of
$X_b(T\rightarrow \infty)\gt 6$
) in all cases. The only noticeable effect of $X_0$
is that the bubble needs to bounce twice against the wall before escaping when it is released close enough to wall, typically for
$X_0$
is that the bubble needs to bounce twice against the wall before escaping when it is released close enough to wall, typically for $X_0\leqslant 2.0$
. This is because the maximum wall-normal distance the bubble attains after a bounce depends largely on its impact velocity, which itself depends on the magnitude of the attractive force resulting from the irrotational Bernoulli mechanism. As figure 21(
$X_0\leqslant 2.0$
. This is because the maximum wall-normal distance the bubble attains after a bounce depends largely on its impact velocity, which itself depends on the magnitude of the attractive force resulting from the irrotational Bernoulli mechanism. As figure 21( $b$
) shows, the maximum rise speed achieved by the bubble before its first bounce decreases significantly with the initial separation when
$b$
) shows, the maximum rise speed achieved by the bubble before its first bounce decreases significantly with the initial separation when $X_0 \leqslant 2$
, making the attractive force resulting from this mechanism (which goes like
$X_0 \leqslant 2$
, making the attractive force resulting from this mechanism (which goes like $V_y^2$
) too weak to generate a large enough impact velocity during the first bounce in such cases.
$V_y^2$
) too weak to generate a large enough impact velocity during the first bounce in such cases.
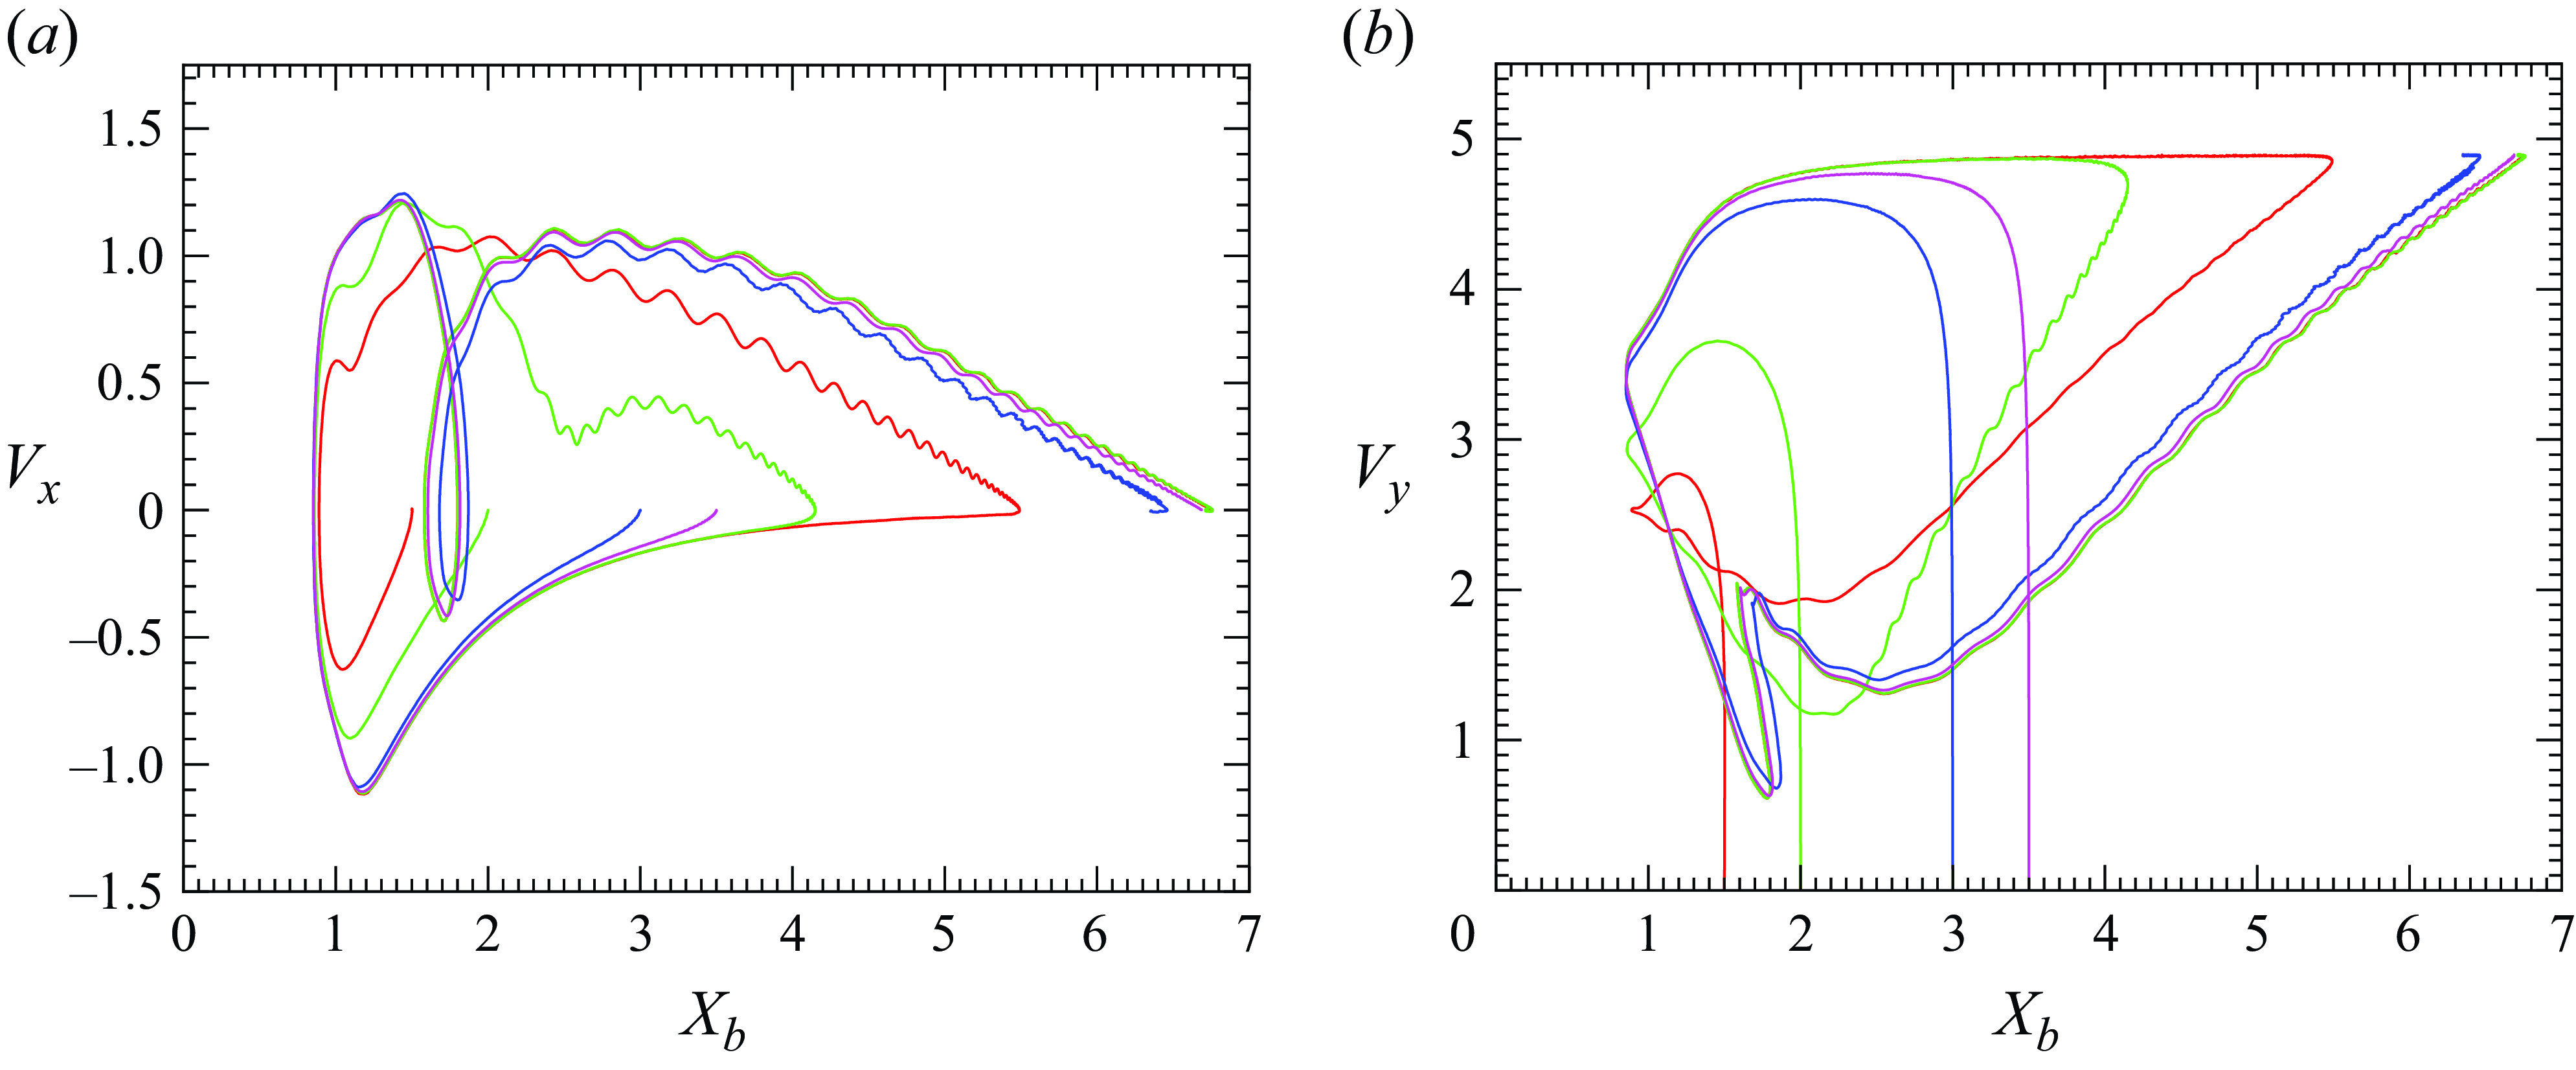
Figure 21. Influence of the initial separation, $X_0$
, on the evolution of the two components of the centroid velocity in the BTE regime for a bubble with
$X_0$
, on the evolution of the two components of the centroid velocity in the BTE regime for a bubble with $(Bo, Ga) = (0.05, 70)$
.
$(Bo, Ga) = (0.05, 70)$
. $(a)$
Wall-normal velocity,
$(a)$
Wall-normal velocity, $V_x$
;
$V_x$
; $(b)$
vertical velocity,
$(b)$
vertical velocity, $V_y$
. Red, green, blue and magenta lines correspond to initial separations
$V_y$
. Red, green, blue and magenta lines correspond to initial separations $X_0 = 1.5, 2.0, 3.0$
and
$X_0 = 1.5, 2.0, 3.0$
and $3.5$
, respectively. The red and green curves overlap in the second half of the evolution.
$3.5$
, respectively. The red and green curves overlap in the second half of the evolution.
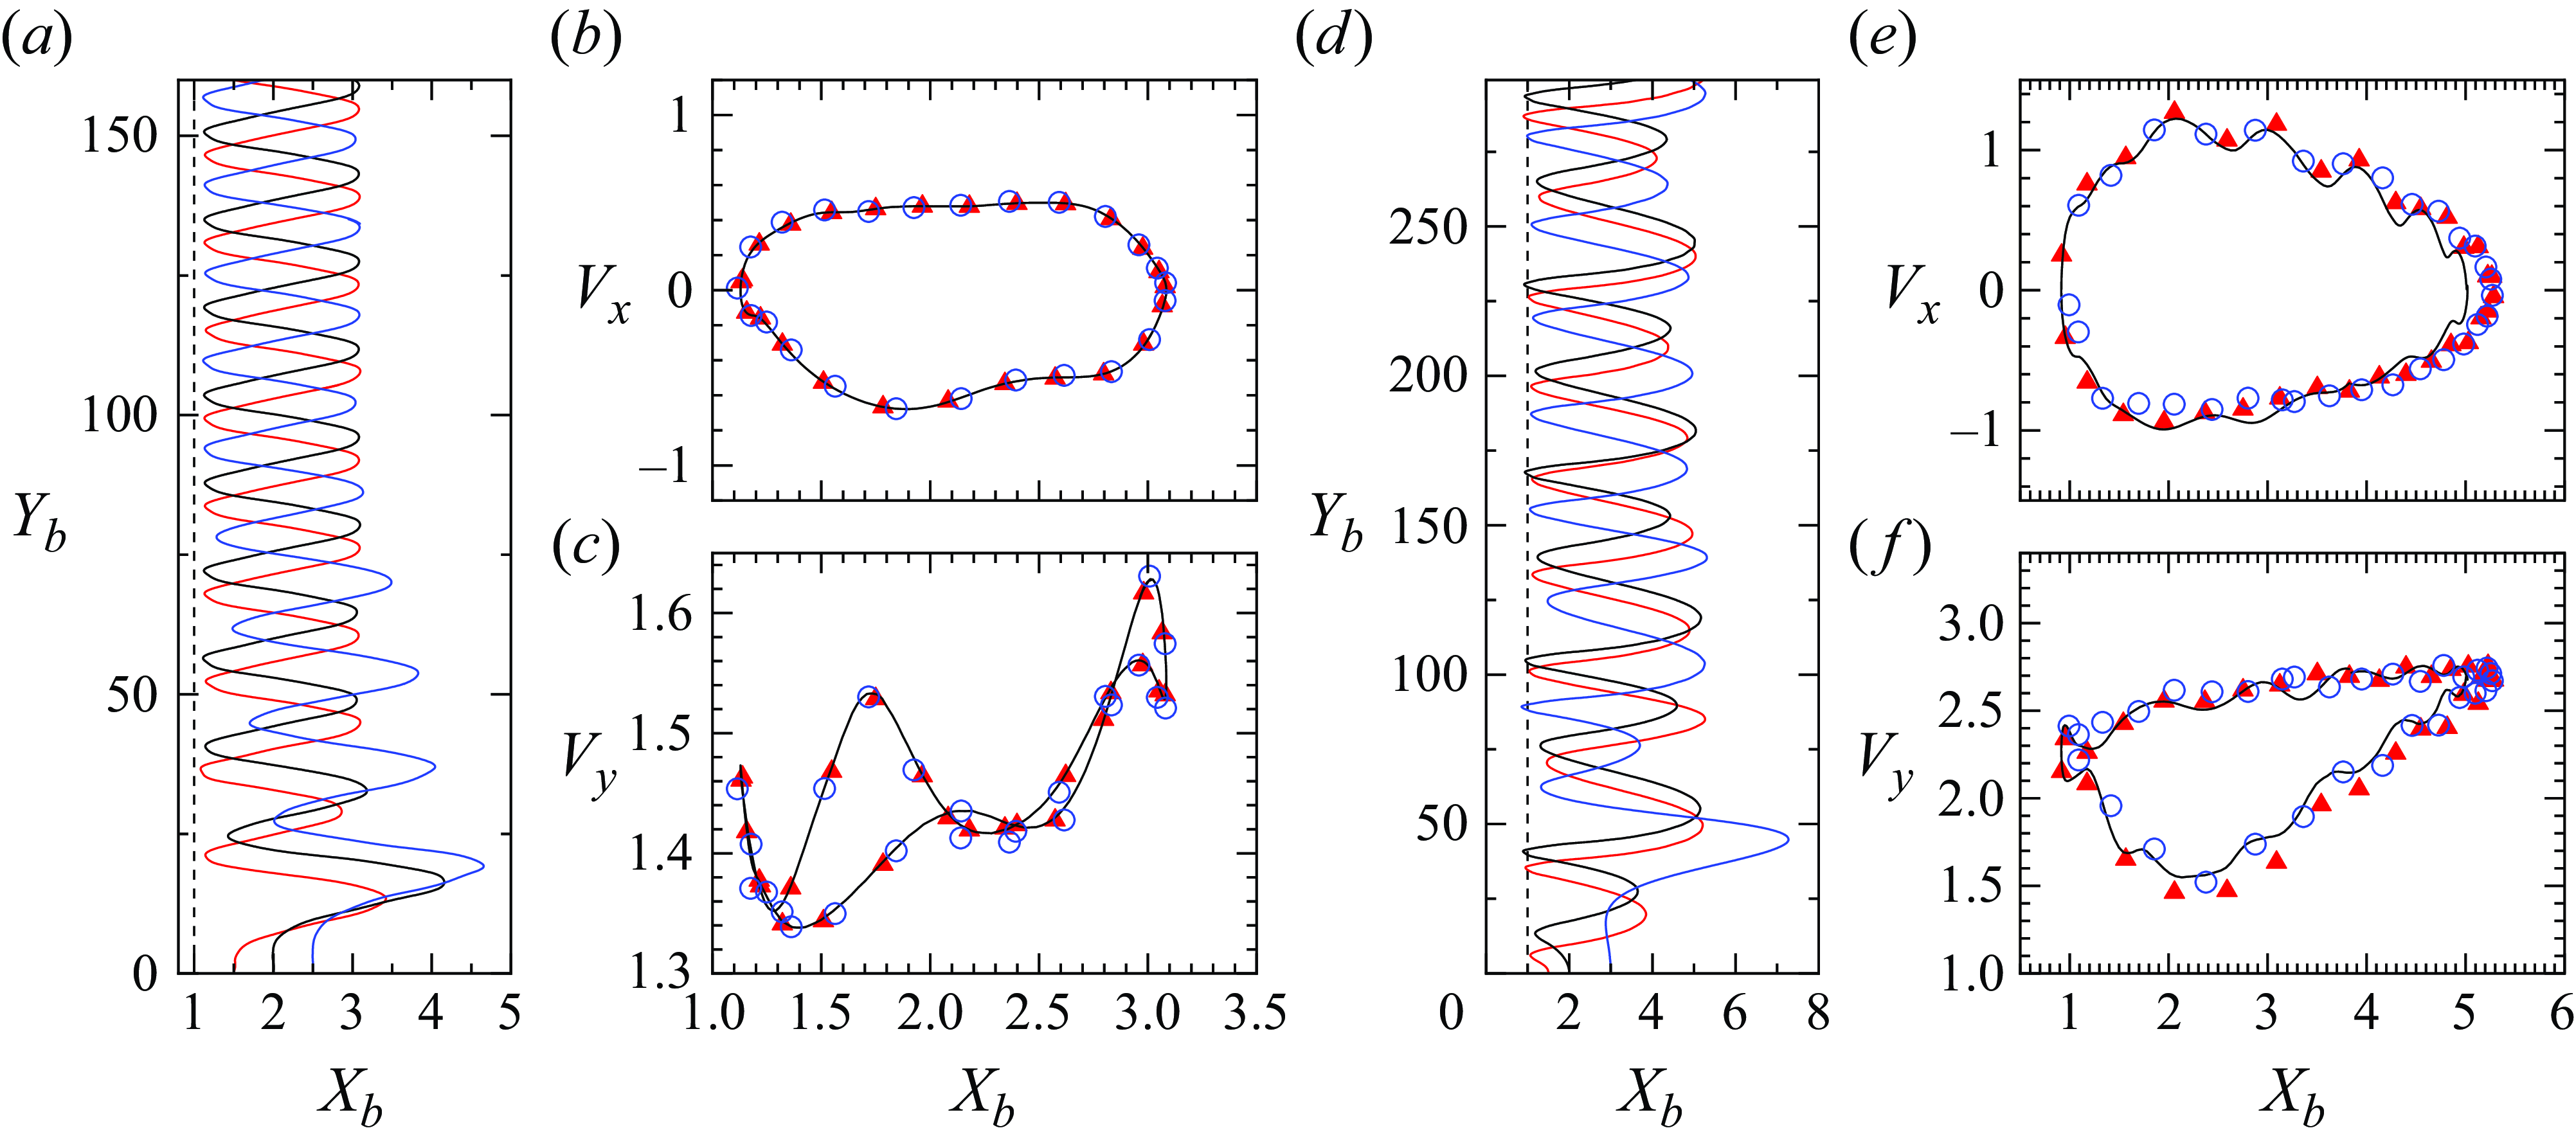
Figure 22. Paths and velocities of bubbles released at different initial separations. Panels $(a{-}c)$
and
$(a{-}c)$
and $(d{-}f)$
correspond to
$(d{-}f)$
correspond to $(Bo, Ga) = (1, 70)$
and (
$(Bo, Ga) = (1, 70)$
and ( $0.25, \,90$
), respectively. Black line:
$0.25, \,90$
), respectively. Black line: $X_0=2$
; red line and triangles:
$X_0=2$
; red line and triangles: $X_0=1.5$
; blue line and circles:
$X_0=1.5$
; blue line and circles: $X_0=2.5$
in
$X_0=2.5$
in $(a{-}c)$
and
$(a{-}c)$
and $X_0=3$
in
$X_0=3$
in $(d{-}f)$
. The time interval between adjacent points in
$(d{-}f)$
. The time interval between adjacent points in $(b{-}c, e{-}f)$
is 0.5. Evolutions in
$(b{-}c, e{-}f)$
is 0.5. Evolutions in $(b{-}c)$
correspond to the last zigzagging period, while in
$(b{-}c)$
correspond to the last zigzagging period, while in $(e{-}f)$
they refer to the last cycle of path oscillations when the bubble collides with the wall.
$(e{-}f)$
they refer to the last cycle of path oscillations when the bubble collides with the wall.
For $(Bo,Ga)$
sets located above the neutral curve, bubbles follow either a WMA or a NWZ scenario (figure 2
$(Bo,Ga)$
sets located above the neutral curve, bubbles follow either a WMA or a NWZ scenario (figure 2 $a$
). In the former case, the wall dictates the orientation of the plane in which the bubble oscillates in the early stages. Nevertheless, once the saturated state is reached, the characteristics of the motion are no longer affected by
$a$
). In the former case, the wall dictates the orientation of the plane in which the bubble oscillates in the early stages. Nevertheless, once the saturated state is reached, the characteristics of the motion are no longer affected by $X_0$
. To reach this conclusion, we examined the two typical NWZ cases discussed in § 5.2, comparing results obtained with three different initial separations. Figure 22 shows the evolution of the bubble trajectory and velocity in these two cases. In the first of them (figure 22
$X_0$
. To reach this conclusion, we examined the two typical NWZ cases discussed in § 5.2, comparing results obtained with three different initial separations. Figure 22 shows the evolution of the bubble trajectory and velocity in these two cases. In the first of them (figure 22 $a{-}c$
), direct collisions with the wall do not take place. As the corresponding panels show, the path characteristics always converge towards a developed state where the vertical displacement and amplitude of the lateral drift during a single period no longer vary over the zigzagging period. Comparing the evolutions obtained with different
$a{-}c$
), direct collisions with the wall do not take place. As the corresponding panels show, the path characteristics always converge towards a developed state where the vertical displacement and amplitude of the lateral drift during a single period no longer vary over the zigzagging period. Comparing the evolutions obtained with different $X_0$
confirms that the path characteristics in this fully developed state are independent of
$X_0$
confirms that the path characteristics in this fully developed state are independent of $X_0$
. Accordingly, the evolutions of the wall-normal and vertical velocities of the bubble centroid collapse on a single curve irrespective of
$X_0$
. Accordingly, the evolutions of the wall-normal and vertical velocities of the bubble centroid collapse on a single curve irrespective of $X_0$
(figure 22
$X_0$
(figure 22 $b{-}c$
). The initial separation only influences the time required to reach the developed state. Specifically, at the largest separation (
$b{-}c$
). The initial separation only influences the time required to reach the developed state. Specifically, at the largest separation ( $X_0=2.5$
), five periods of transverse oscillations take place before the developed state is reached. This is way slower than in a periodic near-wall bouncing scenario where the developed state is reached after the second period of bouncing irrespective of
$X_0=2.5$
), five periods of transverse oscillations take place before the developed state is reached. This is way slower than in a periodic near-wall bouncing scenario where the developed state is reached after the second period of bouncing irrespective of $X_0$
. This indicates a relatively long memory of the system with respect to the initial separation for bubbles evolving in the NWZ regime. This memory effect becomes more pronounced when
$X_0$
. This indicates a relatively long memory of the system with respect to the initial separation for bubbles evolving in the NWZ regime. This memory effect becomes more pronounced when $Ga$
is large enough for bubble–wall collisions to take place (figure 22
$Ga$
is large enough for bubble–wall collisions to take place (figure 22 $d{-}f$
). With
$d{-}f$
). With $X_0=2$
, the bubble path reaches a fully-developed state starting from the second bounce. In this developed stage, the amplitude of the lateral drift just after the collision is larger than that after the next or previous cycle of bouncing, where no collision takes place. In contrast, with
$X_0=2$
, the bubble path reaches a fully-developed state starting from the second bounce. In this developed stage, the amplitude of the lateral drift just after the collision is larger than that after the next or previous cycle of bouncing, where no collision takes place. In contrast, with $X_0=1.5$
and
$X_0=1.5$
and $3$
, a much larger number of zigzagging periods is required to reach a similar state (figure 22
$3$
, a much larger number of zigzagging periods is required to reach a similar state (figure 22 $d$
). The evolution of the two components of the bubble velocity in the last zigzagging cycle where collision takes place is reported in panels (
$d$
). The evolution of the two components of the bubble velocity in the last zigzagging cycle where collision takes place is reported in panels ( $e{-}f$
). While the evolutions corresponding to the three different
$e{-}f$
). While the evolutions corresponding to the three different $X_0$
are close, there are still sizeable differences, which highlights the long memory of the system with respect to
$X_0$
are close, there are still sizeable differences, which highlights the long memory of the system with respect to $X_0$
at large
$X_0$
at large $Ga$
and low-to-moderate
$Ga$
and low-to-moderate $Bo$
.
$Bo$
.
The non-negligible influence of $X_0$
has been reported in previous experiments with air bubbles rising near a wall in pure water (Jeong & Park Reference Jeong and Park2015; Cai et al. Reference Cai, Ju, Chen and Sun2023). These experiments were performed using bubbles with radii ranging from
$X_0$
has been reported in previous experiments with air bubbles rising near a wall in pure water (Jeong & Park Reference Jeong and Park2015; Cai et al. Reference Cai, Ju, Chen and Sun2023). These experiments were performed using bubbles with radii ranging from $1.14$
to
$1.14$
to $1.96\,$
mm, which corresponds to
$1.96\,$
mm, which corresponds to $120\lesssim Ga\lesssim 270$
. In most cases, these bubbles were found to follow the NWZ scenario reported here. Nevertheless, given the larger
$120\lesssim Ga\lesssim 270$
. In most cases, these bubbles were found to follow the NWZ scenario reported here. Nevertheless, given the larger $Ga$
, the memory effect related to the initial separation may last for much longer times than in present simulations, such that very long vertical displacements are required for the path to reach a fully developed state. It is even plausible that in these experiments, the vertical distance crossed by the bubble before it reaches the measurement window (
$Ga$
, the memory effect related to the initial separation may last for much longer times than in present simulations, such that very long vertical displacements are required for the path to reach a fully developed state. It is even plausible that in these experiments, the vertical distance crossed by the bubble before it reaches the measurement window ( $\approx 10R$
in Jeong & Park Reference Jeong and Park2015 and
$\approx 10R$
in Jeong & Park Reference Jeong and Park2015 and $\approx 200R$
in Cai et al. Reference Cai, Ju, Chen and Sun2023) is still not large enough for the corresponding memory effect to have completely faded away.
$\approx 200R$
in Cai et al. Reference Cai, Ju, Chen and Sun2023) is still not large enough for the corresponding memory effect to have completely faded away.


 Open access