


1. Introduction
A vortex ring, also known as a toroidal ring (three-dimensional case), is a torus-shaped confined region of vorticity embedded in a fluid medium. Vortex rings are inherently present in nature and play a predominant role in classical and modern fluid dynamics. It is seen in various artificial (firing artillery, mushroom cloud after a nuclear explosion, laser-induced breakdown in the air, transport and mixing, etc.) and natural (human heart during cardiac relaxation, bubble ring created by dolphins, microburst, quantised vortex rings in super-fluid helium, etc.) phenomena. A vortex–droplet interaction study can contribute to a better understanding of the physical phenomena associated with diverse applications such as atomisation of liquid fuel injected in internal combustion (IC) engines or gas turbines, or spray drying processes in food industries.
A vortex ring is a self-sustained and self-propelled coherent structure in which fluid particles are in a state of continuous rotation (toroidal direction or poloidal direction, or both). Once formed, vortex rings are difficult to destroy and can move long distances before diffusing their strength into the surrounding fluid medium (Turner Reference Turner1957). In recent years, vortex rings have been extensively studied in three different fields, (i) generation of sound, (ii) transport and mixing and (iii) vortex interactions with objects such as drops or bubbles. The first two fields have been studied in detail, but unfortunately, vortex interactions with objects have not been fully understood due to their complexities (Shariff & Leonard Reference Shariff and Leonard1992; Jha & Govardhan Reference Jha and Govardhan2015; Rajamanickam & Basu Reference Rajamanickam and Basu2017; Zednikova et al. Reference Zednikova, Stanovsky, Travnickova, Orvalho, Holub and Vejrazka2019). The complexities in the vortex interaction with objects depend on the coupling between the dispersed and continuous phase (i.e. one-way, two-way or four-way coupling) (Balachandar & Eaton Reference Balachandar and Eaton2010). These complexities can arise from several reasons, such as core deformation, cancellation/merging of vortices, topology change during interaction with objects (walls, particles, drops or bubbles), stretching, dissipation, generation of secondary vorticity, etc. and have hindered the proper understanding of the physics involved. The fundamental characteristics of vortex ring are described in Lamb (Reference Lamb1945), Batchelor (Reference Batchelor1967), Saffman (Reference Saffman1970), Maxworthy (Reference Maxworthy1972), Didden (Reference Didden1979), Gharib, Rambod & Shariff (Reference Gharib, Rambod and Shariff1998), Linden & Turner (Reference Linden and Turner2001) and more recently in Tinaikar, Advaith & Basu (Reference Tinaikar, Advaith and Basu2017). Didden (Reference Didden1979) reported rolling back of the vortex sheet when ejected from a tube into a stagnant medium as a reason for vortex ring formation. Norbury (Reference Norbury1973) discussed the existence of a family of vortical structures, ranging from Hill's spherical vortex to a thin vortex ring. Different values of the non-dimensional core radius in the range  $0 \leqslant \epsilon \leqslant \sqrt {2}$ were used to define these vortex rings. Here, $\epsilon = r_c/R$, where $r_c$ and $R$ are the core and ring radii of the vortex ring, respectively (see figure 2).
In recent years, the interaction of a vortex ring with dispersions has gained significant interest among researchers. The problem of a vortex ring interacting with a suspended particle layer was investigated by Munro, Bethke & Dalziel (Reference Munro, Bethke and Dalziel2009) and Bethke & Dalziel (Reference Bethke and Dalziel2012), while Rastello, Michallet & Marié (Reference Rastello, Michallet and Marié2020) studied a similar problem in a zero-mean shear turbulent flow. The critical conditions for re-suspension and crater formation were described in Munro et al. (Reference Munro, Bethke and Dalziel2009), and the induced velocity of the particle surface layer was investigated in Bethke & Dalziel (Reference Bethke and Dalziel2012). Maxey & Riley (Reference Maxey and Riley1983), Raju & Meiburg (Reference Raju and Meiburg1997) and Volkov (Reference Volkov2007) studied the interaction of a vortex ring with small solid particles. In their study, the dynamics of such interactions was classified as one-way coupled or two-way coupled based on the interaction between the dispersed and continuous phases. The effect of particles dispersed in a turbulent flow was studied by Squires & Eaton (Reference Squires and Eaton1990), Kulick, Fessler & Eaton (Reference Kulick, Fessler and Eaton1994) and Burton & Eaton (Reference Burton and Eaton2005). Squires & Eaton (Reference Squires and Eaton1990) investigated the particle response in isotropic turbulence and showed that heavier and lighter particles altered the flow field differently. The lighter particles were collected in the regions of low vorticity and high strain rate, while the heavier particles were found to be insensitive to the turbulent velocity fluctuations, and therefore no favoured concentration was observed for them. A one-way coupled equation of motion for a small spherical particle embedded in a non-uniform fluid flow was derived in Maxey & Riley (Reference Maxey and Riley1983) by considering the effect of disturbed and undisturbed flows separately. A detailed overview of the interaction of dispersed particles with vortices in turbulent flows is provided in Balachandar & Eaton (Reference Balachandar and Eaton2010).
In a vortex–bubble interaction study, Sridhar & Katz (Reference Sridhar and Katz1995) had investigated the drag and lift forces experienced by a bubble during its engulfment into the vortex core. They used experimental data to determine the buoyancy, inertia and pressure forces acting on the bubble and used tangential and normal components of the resultant force to determine the drag and lift forces on the bubble. An analytical model to estimate the trajectory of small bubbles during their entrainment into the vortex core was also discussed. In a later study, Sridhar & Katz (Reference Sridhar and Katz1999) investigated the effect of bubble entrainment on the vortex ring structure. It was shown that even a small fraction of micron-sized bubbles could significantly distort the vortex ring structure. Oweis et al. (Reference Oweis, van der Hout, Iyer, Tryggvason and Ceccio2005) evaluated the capture time for a bubble located at a radial location away from the line vortex. A significant deformation of the bubble was noticed as it approached the vortex core. Revuelta (Reference Revuelta2010) investigated the co-axial interaction of a bubble with a vortex ring of different sizes. They showed that the fragments of the primary bubble were more numerous if the size of the vortex ring was comparable to the bubble dimensions. Cihonski, Finn & Apte (Reference Cihonski, Finn and Apte2013) used a two-way coupled model to determine the effect of fluid displacement caused by bubble entrainment inside the vortex core. They found that the entrainment of the bubble into the vortex core distorted the vortex ring structure, and the radial location of the entrained bubble gets increased with increasing bubble size. Recently, Jha & Govardhan (Reference Jha and Govardhan2015) investigated the side interaction of a single bubble with a vortex ring and revealed different stages of bubble–vortex interaction, beginning from the bubble engulfment to the escape of the bubble from the vortex core. They showed that a differential pressure in the direction of the vortex tube (toroid direction) led to the stretching of the engulfed bubble. Further, at lower Weber numbers, the interaction had a vital influence on the convection speed of the vortex ring.
A droplet dispersed in an external flow field undergoes deformation due to the forces acting on it. For an accelerating and uniform external flow, Sor & García-Magariño (Reference Sor and García-Magariño2015) compared their deformation model with the Taylor analogy breakup (TAB) model (O'rourke & Amsden Reference O'rourke and Amsden1987), Clark's model (Clark Reference Clark1988) and the droplet deformation and breakup (DDB) model (Ibrahim, Yang & Przekwas Reference Ibrahim, Yang and Przekwas1993). They showed that the conventional models of droplet deformation were not suitable for predicting droplet deformation in accelerating air flows and provided a modified form of these models. Recently, in turbulent flows, droplet deformation due to its interaction with multi-scale vortices was studied by various researchers numerically (Albernaz et al. Reference Albernaz, Do-Quang, Hermanson and Amberg2017; Jiao et al. Reference Jiao, Jiao, Zhang and Du2019) and experimentally (Eastwood, Armi & Lasheras Reference Eastwood, Armi and Lasheras2004; Andersson & Andersson Reference Andersson and Andersson2006; Nachtigall, Zedel & Kraume Reference Nachtigall, Zedel and Kraume2016). Eastwood et al. (Reference Eastwood, Armi and Lasheras2004) showed that the droplets could deform up to the integral length scales of the turbulent fields. Andersson & Andersson (Reference Andersson and Andersson2006) observed deformation up to an aspect ratio (ratio of major to the minor axes of the deformed droplet) of 20. Jiao et al. (Reference Jiao, Jiao, Zhang and Du2019) showed that, in contrast to uniform flow deformation, turbulent flow deformations are characterised by an unsteady and unsymmetrical nature. A detailed overview of the deformation and breakup of droplets/bubbles in turbulent flows was carried out by Elghobashi (Reference Elghobashi2019). They showed that the continuous action of external flow forces deformed the droplet from its initial shape. Once these forces overcome the internal resistive forces that maintain the droplet integrity, droplet breakup occurred. An experimental study by Rajamanickam & Basu (Reference Rajamanickam and Basu2017) unfolded the different droplet breakup regimes during their interaction with a vortex. They showed that the modes of droplet breakup depend on the local vortex strength. Kolmogorov (Reference Kolmogorov1949) and Hinze (Reference Hinze1955) initially investigated the droplet break up in a turbulent flow. Later, it was further studied by various researchers using theoretical (Luo & Svendsen Reference Luo and Svendsen1996; Wang, Wang & Jin Reference Wang, Wang and Jin2003; Solsvik & Jakobsen Reference Solsvik and Jakobsen2016) and experimental techniques (Konno et al. Reference Konno, Matsunaga, Arai and Saito1980; Eastwood et al. Reference Eastwood, Armi and Lasheras2004; Andersson & Andersson Reference Andersson and Andersson2006). These studies were mainly directed at investigating breakup criteria, breakup frequency and the size distribution of atomised droplets. Andersson & Andersson (Reference Andersson and Andersson2006) pointed out that only a few studies in the literature had focussed on the experimental investigation of a single droplet/bubble breakup in a turbulent flow. A detailed overview of droplet breakup in turbulent flows was carried out by Lasheras et al. (Reference Lasheras, Eastwood, Martínez-Bazán and Montaes2002) and Liao & Lucas (Reference Liao and Lucas2009).
Interaction studies with deformable dispersed phases of larger diameter (bubble and droplet) are less frequent in the existing literature (Higuera Reference Higuera2004; Revuelta Reference Revuelta2010; Jha & Govardhan Reference Jha and Govardhan2015; Zednikova et al. Reference Zednikova, Stanovsky, Travnickova, Orvalho, Holub and Vejrazka2019). Among these studies, Higuera (Reference Higuera2004) and Revuelta (Reference Revuelta2010) used numerical techniques to study the co-axial interaction of a bubble with a vortex ring. Jha & Govardhan (Reference Jha and Govardhan2015) experimentally investigated the side interaction of a bubble with a vortex ring, while the co-axial interaction was studied by Zednikova et al. (Reference Zednikova, Stanovsky, Travnickova, Orvalho, Holub and Vejrazka2019). The above discussion shows that only a few studies have explored deformable dispersion (bubbles or droplets) whose sizes are comparable to the vortex ring size. Also, the previous studies were focused on vortex rings that interact mainly with bubbles. Therefore, the present study tries to fill this literature gap (Martínez-Bazán Reference Martínez-Bazán2015) by experimentally investigating vortex interaction with a droplet, for a size ratio  $(R/R_{d})$ of ${\sim } O(1)$, and predicting different regimes of interaction using existing theoretical models. The novelty of the present work lies in the problem considered for analysis, i.e. the investigation of co-axial interaction of a vortex ring with an oil droplet. As per the author's knowledge, no previous studies available in the literature have dealt with this configuration, which is the focal point of the current study. We have identified three different regimes of interaction that exist during the droplet lifetime, namely deformation (regime-I), stretching and engulfment (regime-II) and breakup (regime-III) of the droplet. The effect of interaction is investigated both in terms of the droplet dynamics and vortex dynamics. Further, the results presented in this study are based on extensive experimentation using multiple experimental techniques. Therefore, this work can serve as a benchmark for the validation of future experimental and numerical studies.
This paper is organised as follows: § 2 presents the experimental methods and range of parameters varied in this work, § 3 presents the global observation of the interaction phenomenon and also provides a brief overview of different regimes in the vortex–droplet interaction and § 4 presents the theoretical model for different interaction regimes. Section 5 presents the results of experimental observation and validation of the theoretical models. The conclusion of this work is presented in § 6.
2. Experimental set-up
2.1. Flow set-up
The arrangement of the experimental set-up is shown schematically in figure 1. A water-filled acrylic chamber of  $0.25\ \textrm {m} \times 0.25\ \textrm {m} \times 0.25\ \textrm {m}$ size has been used in the experiments (figure 1a). A vortex ring (travelling vertically downwards) was generated by using an 8 mm diameter pipe ( $D_p$) and by actuating a solenoid valve-1, which was connected to a pressurised chamber filled with water. The injection pipe edge was bevelled at $\delta \sim 10^{o}$ to ensure a smooth roll-up of the shear layer. The injected fluid pressure ( $P_v$) was varied between 5 and 40 psi, which resulted in different strengths of the vortex ring (see table 2). The opening time of solenoid valve-1 was controlled using a user-programmed Arduino board so that the value of $L_s/D_{p}$ ratio was always less than 4, which was necessary to generate a single vortex ring without any trailing edge (Gharib et al. Reference Gharib, Rambod and Shariff1998). Here, $L_s$ is the stroke length of the injected fluid and was calculated using the method described in Tinaikar et al. (Reference Tinaikar, Advaith and Basu2017). All the experiments in this study were performed using the same pipe diameter. Oil droplet was generated by actuating another solenoid valve-2, connected to a pressurised oil chamber. The oil chamber was filled with olive oil, and a small amount of dye (Rhodamine 6G) was added into it for preforming planer LIF. The viscosity ( $\mu _o = 68.695\pm 0.39\ \textrm {mPa}\text {-}\textrm {s}$) and surface tension ( $\sigma = 24.31\pm 1.42\ \textrm {mN}\ \textrm {m}^{-1}$) of the olive oil were measured at ambient conditions using a rheometer and pendent drop method, respectively. The fluid properties relevant to this work are shown in table 1. Characterisation of the solenoid valve-2 opening time and the oil chamber pressure was carried out, and a repeatable droplet diameter ( $D_d= 6.26 \pm 0.1$ mm) was obtained for all cases. The vortex ring generator and the droplet dispenser were mounted on a heavy-duty $X$-
$X$- $Y$-
$Y$- $Z$ stage (accuracy of 0.1 mm) for co-axial alignment of the vortex ring with the droplet (see figure 1b).

Figure 1. Schematic of the experimental set-up: (a) arrangement of different components, (b) representationof the vortex–droplet interaction, (c) simultaneous planner laser-induced fluorescence imaging (LIF) and particle image velocimetry (PIV) measurement, (d) simultaneous shadowgraphy and backlight imaging for side-view and top-view imaging.
Table 1. Values of relevant fluid properties. S No., serial number.

2.2. Backlight imaging set-up
A 22 000-lumen pulsed light source (Veritas, C-120E) along with a diffuser plate evenly illuminated the region of interest in the experiments (figure 1d). The side view and top view were captured simultaneously using a high-speed monochrome camera (Photron SA-5 at 12 000 f.p.s.) and a high-speed colour camera (IDT NR3S1 at 1500 f.p.s.), respectively. The exposure time and spatial resolutions of the high-speed monochrome camera were 1/12 000 s and  $640\ \textrm {pixels}\times 656\ \textrm {pixels}$ with $62.2\ \mathrm {\mu }\textrm {m}\ \textrm {pixel}^{-1}$, while those of the colour camera were1/10 000 s and $384\ \textrm {pixels}\times 336\ \textrm {pixels}$ with $76.16\ \mathrm {\mu }\textrm {m}\ \textrm {pixel}^{-1}$.
2.3. PIV and LIF imaging
High-speed double-pulse PIV measurements were carried out to measure the spatial displacement of neutrally buoyant borosilicate glass particles (density  $1100\ \textrm {Kg}\text {-}\textrm {m}^{-3}$ and mean diameter $9\text {--}13\ \mathrm {\mu }\textrm {m}$), which were uniformly dispersed in the injected fluid as well as in the water tank. The volume loading of seeding particles was maintained at $\sim$0.01 % by volume, and the particles were homogeneously dispersed in the base fluid. This concentration was achieved by progressively increasing particle concentration until a final concentration of $\sim$5–8 particles per interrogation window was achieved. This criterion was essential for reducing errors in the vector calculation (Raffel et al. Reference Raffel, Willert, Wereley and Kompenhans2007). The final volume loading of particles was insignificant for changing fluid properties. A high-speed Nd:YLF laser (make: Photonics Inc. with an emission wavelength of 527 nm, pulse duration of 9 ns, pulse energy of 30 mJ and a maximum repetition rate of 10 kHz) was used in a double-pulse mode for the PIV measurement. A cylindrical lens of focal length $(f) = -10 \ \textrm {mm}$, providing a sheet thickness of $\sim$1 mm was used for uniform illumination of the interaction region. The light scattered by the oil droplet also entered the camera sensor (see supplementary figure S1 available at https://doi.org/10.1017/jfm.2021.363) and caused an error in the PIV measurements. Therefore, to avoid these errors, a mask covering the droplet periphery during each time instant was used up to the droplet deformation stage, as the scattering was more significant during this stage. Moreover, it was difficult to apply a mask in later stages when the primary droplet had been engulfed into the vortex core in the form of multiple cylindrical ligaments that further disintegrated into tiny daughter droplets. To further avoid these issues in PIV and LIF measurements, a small amount of dye was added to the oil fluid, which reduced the scattering of light.
A high-speed camera (Photron SA5) was used to capture double-frame images in synchronisation with the laser pulses at a frame rate between 500 and 1000 Hz. Images were acquired with a region of interest of  $52\ \textrm {mm} \times 52\ \textrm {mm}$ (with a resolution of $51.1 \ \mathrm {\mu }\textrm {m}\ \textrm {pixel}^{-1}$). A band-pass filter of $530\pm 10\ \textrm {nm}$ was mounted in front of the camera lens, which only passes the scattered light from the particles onto the camera sensor. A commercially available PIV software, LaVision Davis 8.4, was used for capturing double-frame images with an optimal time interval $\Delta t_{PIV}$ of $100\text {--}900\ \mathrm {\mu }\textrm {s}$ between two consecutive images (see table 2). The optimal time interval was obtained when particles were displaced by 3–5 pixels within two consecutive frames of the PIV camera (Keane & Adrian Reference Keane and Adrian1990). The captured images were post-processed in Davis 8.4 to retrieve the velocity and vorticity fields. The displacement vectors were calculated using a cross-correlation technique with decreasing multi-pass interrogation window sizes. The first interrogation window size was $96\ \textrm {pixels}\times 96\ \textrm {pixels}$, and the final size was $24\ \textrm {pixels} \times 24\ \textrm {pixels}$ with 50 % overlap for all the experimental cases, which resulted in $86 \times 86$ velocity vectors in the window with a resolution of $0.609\ \textrm {mm} \times 0.609\ \textrm {mm}$.
Table 2. Range of different parameters and non-dimensional numbers covered in this work for different experimental cases (I–VIII). Here,  $P_v$ is vortex injection pressure; $\varGamma$ is circulation strength; $r_c$ is core radius; $\epsilon =r_c/R$ is non-dimensional core radius; $Re_c$ is circulation based Reynolds number; $We_c$ is circulation based Weber number; $U_c$ is tangential velocity at vortex core ( $r=r_c$); $\varDelta _{PIV}$ is time interval between two laser pulses for PIV; $R/R_d$ is vortex–droplet size ratio.

Another high-speed camera (Photron SA5, placed opposite to PIV camera (see figure 1c)) was used as a slave to the PIV camera for LIF imaging. The imaging rate, resolution and the field of view of this camera were also same as that of the PIV camera. This camera captured the fluorescent signal emitted due to the excitation of the dye mixed in the oil droplet. This arrangement helped us to observe the deformation, stretching, engulfment and breakup of the droplet. A band-pass filter of wavelength  $570\pm 10\ \textrm {nm}$ was mounted on the LIF camera lens to prevent the entry of scattered light from the glass spheroids.
2.4. Experimental conditions
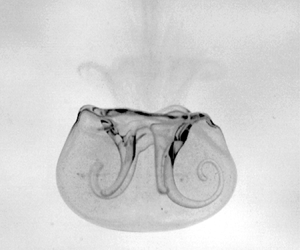
All measurements in this study (with and without vortex–droplet interaction) are performed in sets of five experiments. The results are averaged for all five datasets, and the error bars are included in the figures to show the variation between different runs. The shadowgraphy and backlight imaging (side view and top view) are performed simultaneously, while PIV and LIF (with/without dye in the vortex ring) are done together in a separate experiment. The velocity field obtained from PIV data is used to calculate the circulation strength, core radius and ring radius of the vortex ring. Figure 2 shows the variation in vertical flow velocity along the line connecting the vortex core centres. The ring radius is defined as half of the distance between the two core centres. The core radius is equal to half of the distance between the maximum and minimum velocities on either side of the core (Leweke & Williamson Reference Leweke and Williamson1998). Circulation based Reynolds number  $Re_{c}$ and Weber number $We_{c}$ are written as (Oweis et al. Reference Oweis, van der Hout, Iyer, Tryggvason and Ceccio2005)
 \begin{equation} Re_{c} = \frac{{\varGamma}}{\nu};\quad We_{c} =0.87\rho_{w}\left[\left.\left(\frac{{\varGamma}}{2{\rm \pi} r_{c}}\right)^{2}\right/\left(\frac{\sigma}{D_{d}}\right)\right]. \end{equation}
Here,  $\rho _w$ is the water density. The experimental data investigated in this work are distributed among laminar, transitional and turbulent regimes (Glezer Reference Glezer1988). The laminar vortex rings have a stable structure and show very little decay in their characteristics (translational velocity, vorticity distribution, circulation strength, etc.); as will be shown later in § 5, the converse is true for the turbulent rings. The circulation strength is evaluated by taking the area integral of the vorticity field over the vortex core area, and its precision ranges from ${\pm }1$ to ${\pm }10\ \textrm {cm}^2\ \textrm {s}^{-1}$ from laminar to turbulent vortex rings. The vortex ring is thinner or thicker depending on a non-dimensional core radius ( $\epsilon$), whose value in this work is between 0.37 and 0.43. This non-dimensional core radius corresponds to a thin vortex ring (Jha & Govardhan Reference Jha and Govardhan2015). The range of different experimental parameters covered in this study and the non-dimensional numbers corresponding to them are summarised in table 2. The size ratio $R/R_{d}$ of ${\sim }2$ is chosen in our experiments because the smaller vortices do not have enough energy to disturb and break the droplet, and the larger ones would transport it without breaking it (Martínez-Bazán Reference Martínez-Bazán2015). Thus, it is recommended to carry out additional experiments involving vortex rings with $(R/R_{d})\sim O(1)$. The probable outcome which can occur if we deviate either on the higher or lower side of this size ratio is provided in Revuelta (Reference Revuelta2010). He showed that with smaller size ratios $(R/R_{d} <$ $0.1$) no bubble rupture was observed, while the larger vortices ( $R/R_{d}\sim 5$) did not collide against bubbles; they pushed the fluid surrounding the bubble, which caused the bubble deformation and led to its subsequent breakup. During theoretical modelling of droplet engulfment and breakup, we have not assessed case-I and case-II results, and the reason for this exclusion is provided later in § 5.2.

Figure 2. Description of core radius ( $r_c$) and ring radius ( $R$) of the vortex ring. Here, $V_y$ represents the vertical flow velocity measured along $x_v$, which represents the line joining two vortex cores.
3. Global observations of vortex–droplet interaction
A brief overview of the co-axial interaction of a vortex ring with the droplet is shown in figure 3. The top two rows of images (figure 3a–h) show the side view, while the bottom two rows of images (figure 3i–p) show the top view of the interaction. The entire phenomenon of vortex–droplet interaction is divided into three regimes. Regime-I correspond to droplet deformation and is shown in figure 3(a,b,i,j). The droplet deformation is governed by the interplay among pressure, surface tension and viscous forces acting on the droplet. It begins when the magnitude of the pressure force is higher than the surface tension force. The viscous forces tend to dampen shape changes in the droplet. Regime-II corresponds to stretching and engulfment of the droplet into the vortex core, as shown in figure 3(c–f,k–n). In this regime, the droplet comes into contact with the vortex ring and experiences a shear force due to the rotating fluid flow, which causes stretching of the flattened droplet. The stretched droplet continues to wrap around the vortex ring (figure 3c,d,k,l), and deforms like a thin hollow bag, analogous to a deformed bag obtained in a bag breakup of a droplet in external aerodynamic flow (Jalaal & Mehravaran Reference Jalaal and Mehravaran2012; Kulkarni & Sojka Reference Kulkarni and Sojka2014; Jain et al. Reference Jain, Prakash, Tomar and Ravikrishna2015). The leading edge of the droplet then begins to engulf into the core of the vortex ring, as shown in figure 3(d–f,l–m).

Figure 3. Regimes of vortex–droplet interaction (case-VIII). Regime-I: droplet deformation (a,b) side view and (i,j) top view. Regime-II: droplet stretching (c,d) side view and (k,l) top view. Regime-II: droplet engulfment (e,f) side view and (m,n) top view. Regime-III: droplet break-up (g,h) side view and (o,p) top view. The side-view and top-view images were captured simultaneously. For details see supplementary movie 2.
During the transition of the regime from droplet deformation to engulfment, the thickness of the bag gradually decreased over time. As a result, holes are formed at some locations on the bag surface. These holes begin to expand further in all directions leading to fragmentation of the bag (figure 3g,h,o,p); we refer this as regime-III of interaction (droplet breakup regime). The transition between the droplet deformation, stretching and engulfment models (presented later in § 5) is carried out based on the experimental observations. The droplet deformation stage is considered from the first instance of droplet shape change to the time of its contact with the incoming vortex ring. The stretching is considered from the end of the deformation to the time when the leading edge of the stretched droplet reaches vertically above the vortex core. We considered the engulfment time to be from the end of the stretching stage to the time when the leading edge reaches the vortex core centre. The breakup time is defined as the time instant from the beginning of droplet deformation to the onset of nucleation holes on the stretched bag surface.
Existing mathematical models are used for predicting droplet behaviour in all three regimes. The complete interaction dynamics for case-II and case-VIII is available as supplementary movies 1 and 2, respectively. To determine the effect of a droplet interaction on characteristics of the vortex ring, we show the variation of circulation strength, convection speed, pressure distribution, vorticity distribution, total energy and total enstrophy of the vortex ring. A detailed discussion of these regimes and the interaction effect on the droplet and vortex dynamics are given in the following sections.
4. Theoretical model
This section provides a theoretical model for the deformation, stretching, engulfment and breakup of the droplet. The deformation model predicts the time required for the deformation of the droplet from its original spherical shape to a disc shape with an elliptical cross-section. The stretching model gives the stretching time of the droplet based on the scaling arguments. The droplet engulfment model is used for predicting the temporal evolution of the droplet's leading-edge location during the engulfment stage. In the end, the lifetime of the droplet is calculated.
4.1. Regime-I: droplet deformation
As suggested by Clark (Reference Clark1988) in his two-dimensional model for droplet deformation, a drop in an external flow field experiences a collective effect of the pressure force, viscous force, surface tension force and inertia force. In his model, the droplet is assumed as an equivalent two-mass spring–damper system. These masses are considered to be concentrated at the centroid of a half-droplet in the present case shown by  $(\bar {x},\bar {y})$ of figure 4(a). The origin of the coordinate system is fixed at the centroid of the undeformed droplet, which is assumed to deform from its initial circular cross-section to an elliptical cross-section. Here, $a$ and $b$ are the lengths of the semi-major and semi-minor axes of the ellipse and were equal to the radius of the droplet ( $R_d$) before the beginning of the droplet deformation. The original Clark model was further modified and improved by Sor & García-Magariño (Reference Sor and García-Magariño2015), where it is solved in a quasi-equilibrium form and using the slip velocity $(\boldsymbol {V}_s)$ as a time-dependent variable. Here, $\boldsymbol {V}_s = \boldsymbol {V}_w-\boldsymbol {\dot {y}}$, and $\boldsymbol {V}_w$ is the flow velocity ahead of the forward-stagnation point, which is determined from the PIV measurement in this study; $\boldsymbol {\dot {x}}$ and $\boldsymbol {\dot {y}}$ are the velocities of the droplet centroid. Due to the symmetry of the flow on the droplet, the location of the centroid along the $x$-axis is fixed during deformation. Thus, the centroid velocity in the $x$-direction is negligible. The same modified Clark model as presented by Sor & García-Magariño (Reference Sor and García-Magariño2015) is used here for predicting experimental results. The final governing equation for droplet deformation as presented by Sor & García-Magariño (Reference Sor and García-Magariño2015) is as follows:
 \begin{align} &(K+1) [(1+ B_v t^{\prime})^2] \frac{\textrm{d}^{2} a^{\prime}}{\textrm{d} {t^{\prime}}^2} + \left[(K+1) (2B_v + B_a t^{\prime})(N+1) (1+B_v t^{\prime}) \frac{9 {\rm \pi}^{2} }{4Re_t}\right] \frac{\textrm{d} a^{\prime}}{\textrm{d}t} \nonumber\\ &\quad + \frac{9 {\rm \pi}^{2}}{4 We_t} (a^{\prime} -1) = \frac{3}{2} C_p, \end{align}
where
 \begin{gather} B_v=\frac{R}{\boldsymbol{V}_s^2} \frac{\textrm{d} \boldsymbol{V}_s}{\textrm{d}t}, \quad B_a= \frac{R^2}{\boldsymbol{V}_s^3} \frac{\textrm{d}^2 \boldsymbol{V}_s}{\textrm{d} t^2} \end{gather}
 \begin{gather} K=\frac{\rho_o}{\rho_w}, \quad N=\frac{\mu_o}{\mu_w}, \quad Re_t=\frac{\rho_w \boldsymbol{V}_s R_d}{\mu_w}, \end{gather}
 \begin{gather} We_t=\frac{\rho_w {\boldsymbol{V}_s}^2 R_d}{\sigma}, \quad t^{\prime}=\frac{t \boldsymbol{V}_s}{R_d}, \quad a^{\prime}=\frac{a}{R_d}=\frac{3 {\rm \pi}\bar{x}}{4 R_d}. \end{gather}
Here,  $\rho _o$ and $\rho _{w}$ are the density of the oil and water, respectively, and $\mu _w$ is the dynamic viscosity of water. Initial conditions for solving equation (4.1) are as follows:
 \begin{equation} at \quad t^{\prime} = 0 \quad a^{\prime} = a_{exp}^{\prime} \quad \textrm{and} \quad \frac{\textrm{d} a^{\prime}}{\textrm{d}t} =0. \end{equation}
Equation (4.1) is converted into two first-order ordinary differential equations (ODEs). These equations are then solved simultaneously using a fourth-order Runge–Kutta method with the initial condition shown in (4.3d–f). The results of this formulation are used for estimating droplet deformation and deformation times (shown later in § 5.1).

Figure 4. Schematic diagram of (a) deformation, (b) engulfment and (c) stretching during vortex–droplet interaction.
4.2. Regime-II: droplet stretching and engulfment
The stretching time is the time taken by the droplet's leading edge after the end of deformation regime to reach at the top of the vortex core (figure 4c). By assuming the vortex ring as an ellipse, the length of the curve ( $L$) is determined from the point $i$ to $j$
$j$
 \begin{equation} L=\int_{i}^{j} \sqrt{\left((1+ \left(\frac{\textrm{d} x}{\textrm{d} y}\right)^2\right)}{\textrm{d} y} . \end{equation}
To determine the stretching time, the maximum velocity of the vortex core ( $U_c$, shown later in (4.9c)) is taken as the velocity scale. Therefore, it is written as
 \begin{equation} t_{{stretching}} \approx \frac{L}{U_c}. \end{equation}
The obtained stretching time is used for determining the droplet's lifetime, and the results are shown in § 5.3.
The pressure difference between the far field and vortex core causes the engulfment of leading edge of the droplet into the vortex core (see figure 4b). In this section, the engulfment of the droplet is modelled to determine the spatio-temporal position of the leading edge and subsequently the engulfment time ( $t_{{engulfment}}$, the time taken to complete the engulfment stage). It is assumed that the forces that cause droplet engulfment act on the leading edge of the engulfing ligament. As can be seen from supplementary figure S2, the actual shape of the engulfing ligament resembles a bulging cylinder. The bulging region (which corresponds to the leading edge) is approximated as a spherical shape because of its resemblance to a spherical shape. Furthermore, the expressions required to calculate the drag, lift and added mass coefficients for a spherical geometry are well established in the literature. The leading edge of the droplet experiences the following forces: inertia, pressure, buoyancy, added mass, lift, drag and Basset history force. Other than the above-mentioned external forces, the leading edge of the droplet also experiences surface tension and viscous forces. The effects of the surface tension and viscous forces acting on the leading edge are assumed to be negligible because the Weber number ( $We_s = {\rho _o \boldsymbol {V}_{eng}^2 D_{edge}}/{\sigma } \sim O (10\text {--}100)$) and Ohnesorge number ( $Oh = {\mu _o}/{\sqrt {\rho _o \sigma D_{edge} }}\sim O (0.1)$) (McKinley & Renardy Reference McKinley and Renardy2011) magnitudes, which are evaluated based on the stretching of the engulfing ligament. Here, $D_{edge}$ and $\boldsymbol {V}_{eng}$ are the diameter and velocity of the engulfing ligament. These values of $We_s$ and $Oh$ indicate that the inertia force dominates over the viscous and surface tension force and, therefore, the latter can be neglected. The validity of this assumption is further verified by comparing the predicted results with the experimental data (see figure 10). The free-body diagram showing all the forces acting on the leading edge is shown in figure 4(b).
Maxey & Riley (Reference Maxey and Riley1983) considered the forces acting on a rigid sphere in zero Reynolds number flows by separately modelling disturbed and undisturbed flows. Several other researchers have used a similar particle tracking model for moderate to large Reynolds number (Raju & Meiburg Reference Raju and Meiburg1997; Magnaudet & Eames Reference Magnaudet and Eames2000; Ni et al. Reference Ni, Zhang, Yao and Wang2012; Chen et al. Reference Chen, Zhang, Peng and Shao2019) values. The inertia force at the leading edge is expressed in terms of the other forces as
 \begin{align} \rho_o V_d \frac{\textrm{d} \boldsymbol{u}_d}{\textrm{d}t} = \boldsymbol{F}_{weight}+ \boldsymbol{F}_{buoyancy} + \boldsymbol{F}_{pressure} + \boldsymbol{F}_{added\: mass} + \boldsymbol{F}_{drag} + \boldsymbol{F}_{lift} + \boldsymbol{F}_{Basset} . \end{align}
Here,  $V_d$ is the volume of the spherical leading edge. The combined effect of the buoyancy and weight terms is written as
 \begin{equation} \boldsymbol{F}_b = V_d (\rho_o -\rho_w) \boldsymbol{g}. \end{equation}
Here,  $\boldsymbol {g}$ is the acceleration due to gravity. In this model, the vortex ring is assumed as equivalent to a sum of two Lamb—Oseen vortices (Gaussian vortex) whose centres are kept separated at $2R$ distance (Leweke & Williamson Reference Leweke and Williamson1998). The validity of this assumption is verified by comparing the vertical flow velocity from experimental data to the superimposition of two Lamb—Oseen vortices (along the line joining the centre of the vortex cores). A good agreement is found between the experimental and superimposed velocity profiles (see figure 5). Therefore, a Gaussian vortex model is used for modelling in this study (Oweis et al. Reference Oweis, van der Hout, Iyer, Tryggvason and Ceccio2005)
 \begin{gather} u_\theta =\frac{\varGamma}{2 {\rm \pi}r} \left[1-\exp\left( - \eta_1 \left( \frac{r}{r_c}\right)^2\right)\right], \quad u_r = 0, \quad U_c = \frac{\eta_2 \varGamma_o}{2 {\rm \pi}r_c}, \end{gather}
 \begin{gather} \boldsymbol{\nabla} p={-}\frac{\rho_w u_\theta^2}{r}={-}\frac{\rho_w}{r} \left[\frac{\varGamma}{2 {\rm \pi}r} \left[1-\exp\left( - \eta_1 \left( \frac{r}{r_c}\right)^2\right)\right]\right]^2, \end{gather}
where  $r$ is the radial location of the leading edge from the core centre, $\eta _1$ and $\eta _2$ are constants equal to 1.255 and 0.715, respectively, $\varGamma _o$ is the circulation value at $r_c$ and $u_\theta$ and $u_r$ are the velocities in the tangential ( $\theta$) and radial ( $r$) directions, respectively. Therefore, the pressure force is written as
 \begin{equation} \boldsymbol{F}_p ={-}V_d \boldsymbol{\nabla} p. \end{equation}
Figure 5. Comparison of vertical velocity measured along core centreline of two superimposed Lamb—Oseen vortices with the experimental data. The red dotted line corresponds to vertical velocity of Lamb—Oseen vortex 1 ( $V_{LO-1}$), while the blue dotted line corresponds to Lamb—Oseen vortex 2 ( $V_{LO-2}$), the solid green line corresponds to superimposed velocity ( $V_{sup}$) of $V_{LO-1}$ and $V_{LO-2}$ and the markings correspond to experimental vertical velocity ( $V_{exp}$) along the line joining the centre of the vortex ring.
The force  $m_f({\textrm {D}\boldsymbol {u}}/{\textrm {D}t})$, which comes due to the undisturbed fluid flow in the Maxey & Riley (Reference Maxey and Riley1983) work, is written as a pressure gradient force $(V_d \boldsymbol {\nabla } P )$ (Raju & Meiburg Reference Raju and Meiburg1997; Oweis et al. Reference Oweis, van der Hout, Iyer, Tryggvason and Ceccio2005; Finn, Shams & Apte Reference Finn, Shams and Apte2011) using an inviscid flow assumption. The added mass term is evaluated as
 \begin{equation} \boldsymbol{F}_a = \frac{1}{2} \rho_w V_d \left( \frac{\textrm{D}\boldsymbol{u}}{\textrm{D}t} - \frac{\textrm{d} \boldsymbol{u}_d}{\textrm{d}t}\right).\end{equation}
Here,  $\boldsymbol {u}$ is the undisturbed flow velocity, $\boldsymbol {u}_d$ is the leading-edge velocity and the added mass coefficient is chosen as $1/2$. In (4.11a), ‘ $\textrm {D}/\textrm {D}t$’ is a material derivative while ‘ $\textrm {d}/\textrm {d}t$’ is a total derivative. Auton, Hunt & Prud'Homme (Reference Auton, Hunt and Prud'Homme1988) has argued that, for a spherical particle in an inviscid weak shear flow, the correct definition for fluid acceleration is ${\textrm {D}\boldsymbol {u}}/{\textrm {D}t}$ instead of ${\textrm {d}\boldsymbol {u}}/{\textrm {d}t}$. He also showed the difference between the two representations (described in figure 1 of Auton et al. Reference Auton, Hunt and Prud'Homme1988). Drew & Lahey (Reference Drew and Lahey1990) and Ruetsch & Meiburg (Reference Ruetsch and Meiburg1992) further verified this correct form in their work, and a similar form was also used by Raju & Meiburg (Reference Raju and Meiburg1997), Maxey, Chang & Wang (Reference Maxey, Chang and Wang1994), Oweis et al. (Reference Oweis, van der Hout, Iyer, Tryggvason and Ceccio2005) and in several other works. Using Euler's equation (assuming an inviscid flow) and (4.9d), we get
 \begin{equation} \boldsymbol{F}_a = \frac{1}{2} \rho_w V_d\left( \frac{\rho_w u_\theta^2}{r} - \frac{\textrm{d} \boldsymbol{u}_d}{\textrm{d}t}\right).\end{equation}
Now, the drag force is calculated using,
 \begin{equation} \boldsymbol{F}_d = \tfrac{1}{2}\rho_w{\rm \pi} R_{edge}^2 C_d (\boldsymbol{u}- \boldsymbol{u}_d) |\boldsymbol{u}-\boldsymbol{u}_d| .\end{equation}
Here,  $R_{edge}$ is the radius of the spherical leading edge. We have used the drag coefficient ( $C_d$) as given in Naumann & Schiller (Reference Naumann and Schiller1935),
 \begin{equation} C_d = 24 \times \left( \frac{1+ 0.15 Re_d^{0.687}}{Re_d} \right), \quad Re_d= \frac{\rho_w D_{edge}}{\mu_w} |\boldsymbol{u}- \boldsymbol{u}_d| . \end{equation}
Similarly, the lift force on the droplet is determined as
 \begin{equation} \boldsymbol{F}_l = \frac{3}{8} \rho_w C_l V_d\frac{ (\boldsymbol{u}- \boldsymbol{u}_d) \times \boldsymbol{\omega} }{\alpha}. \end{equation}
Here, we have used the lift coefficient ( $C_l$) correlation as given in Sridhar & Katz (Reference Sridhar and Katz1995), where $\omega$ is the local vorticity value and $\alpha = {|\boldsymbol {\omega }| R_{edge}}/({|\boldsymbol {u}- \boldsymbol {u}_d|})$. For a Gaussian vortex
 \begin{equation} C_l=0.59 \times \alpha^{0.25}, \quad \boldsymbol{\omega}=\boldsymbol{\nabla} \times \boldsymbol{u} = \frac{\eta_1 \varGamma}{{\rm \pi} r_c^2} \left[\exp\left( - \eta_1 \left( \frac{r}{r_c}\right)\right)\right]. \end{equation}
Using (4.14a–c), an expression for the lift force is obtained. As suggested by Zhang & Ni (Reference Zhang and Ni2013), the Basset history force is neglected in the present modelling, as it is second order compared with the other forces. After substituting (4.8)–(4.14) in (4.7), and then performing some algebraic manipulation, the governing equation is written as
 \begin{align} \left(1+ \frac{\rho_w}{\rho_o}\right) \frac{\textrm{d} \boldsymbol{u}_d}{\textrm{d}t} &= \left(1- \frac{\rho_w}{\rho_o}\right) \boldsymbol{g} - \frac{3}{2} \frac{\boldsymbol{\nabla} p}{\rho_o} + \frac{\frac{3}{8} C_d \rho_w (\boldsymbol{u}- \boldsymbol{u}_d) |\boldsymbol{u}- \boldsymbol{u}_d|}{\rho_o R_{edge}} \nonumber\\ &\quad + \frac{\frac{3}{8} C_l \rho_w (\boldsymbol{u}- \boldsymbol{u}_d) \times \boldsymbol{\omega}}{\rho_o \alpha} . \end{align}
Equation (4.14b,c) is a governing equation for the leading-edge motion under the influence of various forces. The same equation is written in the vector form as
 \begin{align} \left(1+
\frac{\rho_w}{\rho_o}\right)
\left(\frac{\textrm{d}u_{d,r}}{\textrm{d}t}
\boldsymbol{\hat{r}} + r \frac{u_{d,\theta}}{\textrm{d}t}
\boldsymbol{\hat{\theta}}\right) & = \left(1-
\frac{\rho_w}{\rho_o}\right) (g_r \boldsymbol{\hat{r}} +
g_\theta \boldsymbol{\hat{\theta}}) - \frac{3}{2}
\frac{\rho_w u_{\theta}^2}{\rho_o r}
\boldsymbol{\hat{r}}\nonumber\\ &\quad + \frac{\frac{3}{4}
C_d \rho_w \sqrt{u_{d,r}^2 +(u_\theta - u_{d,\theta})^2}
(-{u_{d,r}\boldsymbol{\hat{r}}
}+(u_{\theta}\,{-}\,u_{d,\theta}) \boldsymbol{\hat{\theta}} )}{\rho_o R_{edge}}\nonumber\\ &\quad +
\frac{\frac{3}{8} C_l \rho_w
({(u_{\theta}-u_{d,\theta}) \omega_z
\boldsymbol{\hat{r}} } +u_{d,r} \omega_z
\boldsymbol{\hat{\theta}})}{\rho_o \alpha} .
\end{align}
\begin{align} \left(1+
\frac{\rho_w}{\rho_o}\right)
\left(\frac{\textrm{d}u_{d,r}}{\textrm{d}t}
\boldsymbol{\hat{r}} + r \frac{u_{d,\theta}}{\textrm{d}t}
\boldsymbol{\hat{\theta}}\right) & = \left(1-
\frac{\rho_w}{\rho_o}\right) (g_r \boldsymbol{\hat{r}} +
g_\theta \boldsymbol{\hat{\theta}}) - \frac{3}{2}
\frac{\rho_w u_{\theta}^2}{\rho_o r}
\boldsymbol{\hat{r}}\nonumber\\ &\quad + \frac{\frac{3}{4}
C_d \rho_w \sqrt{u_{d,r}^2 +(u_\theta - u_{d,\theta})^2}
(-{u_{d,r}\boldsymbol{\hat{r}}
}+(u_{\theta}\,{-}\,u_{d,\theta}) \boldsymbol{\hat{\theta}} )}{\rho_o R_{edge}}\nonumber\\ &\quad +
\frac{\frac{3}{8} C_l \rho_w
({(u_{\theta}-u_{d,\theta}) \omega_z
\boldsymbol{\hat{r}} } +u_{d,r} \omega_z
\boldsymbol{\hat{\theta}})}{\rho_o \alpha} .
\end{align}
For analysis purposes, the above equation is decomposed into the radial  $(r)$ and tangential $(\theta )$ directions. Thus, we will get two second-order differential equations in the $r$ and $\theta$-directions. Both differential equations are coupled and must be solved simultaneously. Each second-order differential equation is converted into two first-order differential equations. Therefore, we will have four first-order differential equations that must be solved simultaneously using the fourth-order Runge–Kutta method. The initial conditions required for the solution are as follows:
 \begin{equation} At \quad t = 0, \quad\theta = \theta_{exp} \quad \frac{\textrm{d}\theta}{\textrm{d}t} = u_\theta \quad r = r_i \quad \textrm{and} \quad \frac{\textrm{d}r}{\textrm{d}t} = 0 . \end{equation}
The initial condition values are chosen based on experimental observations. After solving these differential equations, we get values of
 \begin{equation} \left.\begin{gathered} r = \textrm{radial position of the leading edge }\\ u_{d,r}= \frac{\textrm{d}r}{\textrm{d}t} = \textrm{radial component of leading-edge velocity}\\ \theta= \textrm{angular position of leading edge }\\ u_{d,\theta}= r\frac{\textrm{d}\theta}{\textrm{d}t} = \textrm{tangential component of leading-edge velocity}. \end{gathered}\right\} \end{equation}
This model of droplet engulfment is described as model-1 in figure 10 and the corresponding discussion in § 5.3.
4.2.1. Simplified engulfment model
From the scaling arguments, model-1 of droplet engulfment can be further simplified. Since the  $\rho _{w} \sim \rho _o$ (see table 1), weight and buoyancy forces cancel out each other. The Basset history force is neglected based on the same argument presented earlier during the development of model-1. Therefore the remaining forces in (4.7) are written as
 \begin{equation} \rho_o V_d \frac{\textrm{d}\boldsymbol{u}_d}{\textrm{d}t}= \boldsymbol{F}_{pressure}+\boldsymbol{F}_{added mass} +\boldsymbol{F}_{drag} +\boldsymbol{F}_{lift} \end{equation}
 \begin{align} \rho_o V_d \frac{\textrm{d}\boldsymbol{u}_d}{\textrm{d}t}&={-}V_d \boldsymbol{\nabla} P +\frac{1}{2}V_d \rho_w\left(\frac{D\boldsymbol{u}}{Dt}-\frac{\textrm{d}\boldsymbol{u}_d}{\textrm{d}t}\right)+\frac{1}{2} {\rm \pi}R_{edge}^2 C_d(\boldsymbol{u}-\boldsymbol{u}_d)|\boldsymbol{u}-\boldsymbol{u}_d| \nonumber\\ &\quad + \frac{3}{8}\rho_{w}C_lV_d\frac{(\boldsymbol{u}- \boldsymbol{u}_d)\times \boldsymbol{\omega}}{\alpha}. \end{align}
 Considering  $\rho _w \sim \rho _o$ (see table 1), and substituting the value for $\boldsymbol {\nabla } P$ from (4.9d) and the added mass force from (4.11c), we get
 \begin{equation} \frac{\textrm{d}\boldsymbol{u}_d}{\textrm{d}t}=1+\frac{C_d(\boldsymbol{u}-\boldsymbol{u}_d)|\boldsymbol{u}-\boldsymbol{u}_d|}{4{u_\theta}^2}\left(\frac{r}{R_{edge}}\right) +\frac{C_l|\boldsymbol{u}-\boldsymbol{u}_d|(\boldsymbol{u}-\boldsymbol{u}_d)\times \boldsymbol{\omega} }{4{u_\theta}^2 |\omega|}\left(\frac{r}{R_{edge}}\right). \end{equation}
Here,  $r/R_{edge}\sim O(1)$, and $C_d$ and $C_l$ lie are $O(1)$ and $O(0.1)$, respectively. Since $u_\theta ^2 \gg |\boldsymbol {u}-\boldsymbol {u}_d|^2$, the last two terms corresponding to the drag and lift forces in (4.19b) are neglected. Therefore, the final expression is written as the balance between inertia, added mass and pressure forces.
Using this force balance, a proximate estimate of the engulfment time and leading-edge radial position are obtained after neglecting other forces in model-1. Hence, a simplified model that balances between inertia, added mass and the pressure force is written as
 \begin{gather} \frac{3}{2}\rho_o V_d \frac{\textrm{d}\boldsymbol{u}_d}{\textrm{d}t}={-}\frac{3}{2}V_d \boldsymbol{\nabla} p \end{gather}
 \begin{gather}\rho_o V_d \frac{\textrm{d}\boldsymbol{u}_d}{\textrm{d}t}={-}V_d \frac{\rho_w u_{\theta}^2}{ r} \end{gather}
 \begin{gather}\frac{\textrm{d}^2 r}{\textrm{d} t^2} \boldsymbol{\hat{r}} + \left(\frac{\textrm{d}r}{\textrm{d}t} \frac{\textrm{d} \theta}{\textrm{d}t} + r \frac{\textrm{d}^2 \theta}{\textrm{d} t^2} \right) \boldsymbol{\hat{\theta}}= \frac{\rho_w \varGamma^2}{\rho_o 4 {\rm \pi}^2 r^3} \left(1-\exp\left( - \eta_1 \left( \frac{r}{r_c}\right)^2\right)\right) \boldsymbol{\hat{r}}. \end{gather}
The above equation is called model-2 in the present study and can be solved similar to (4.16) with the same initial conditions. The results obtained from model-1 and model-2 are used to evaluate the location of the leading edge and the engulfment time of the droplet. The comparison of these two models and experimental data is shown in § 5.2.
4.3. Regime-III: droplet breakup
Since the mass of the droplet is conserved, the continuous engulfment of ligament towards the vortex core reduces the thickness of the stretched bag. This stretched thin sheet is susceptible to breakup due to the formation of instabilities and their amplification over a period of time. It is observed from figure 3(e,f,m,n) that when the engulfed ligament reaches near the inner surface of the stretching bag, it triggers the instability on the sheet surface. The augmentation of these instabilities leads to the nucleation of holes on the stretched bag (figure 12). The nucleation of holes on the bag surface occurs just after the end of the droplet engulfment stage. Thus, the droplet breakup time is expressed as the sum of the deformation, stretching and engulfment time of the droplet
 \begin{equation} t_{{breakup}}=t_{{deformation}}+t_{{stretching}}+t_{{engulfment}} . \end{equation}
The procedure used for identifying the deformation and engulfment stages was discussed in § 3. To quantify the deformation time ( $t_{{deformation}}$), we used the same data that are used for the representation of figure 7. Each representation in figure 7 defines the complete deformation stage and the last point on the time axis corresponds to the deformation time for that case. Similarly, figure 11 shows the complete engulfment stage for different experimental cases. Here too, the last point on the time axis signifies the engulfment time ( $t_{{engulfment}}$) for that case. The stretching time for the leading edge is determined from (4.6). The comparison of the droplet lifetime obtained from (4.22) to experimental data is presented in § 5.3.
5. Results and discussion
In this section, we will present and compare the results obtained from experimental observations with the prediction based on the theoretical models presented in § 4. First, we will show the results of droplet dynamics, which include the three regimes of interaction. Later, the effect of interaction on the vortex dynamics will be presented, where we will discuss the variation of vorticity distribution, circulation strength, total energy and enstrophy and translation speed of the vortex ring, and the results are compared with the reference case of no interaction.
5.1. Droplet dynamics regime-I: droplet deformation
The droplet dynamics of regime-I (for case-II) is shown in figure 6. The planer LIF, shadowgraphy, backlight top-view and PIV processed images are shown in figure 6(a–d), from top to bottom. The velocity vectors in the PIV image are shown to represent the flow direction, and the vorticity fields are blended in the background. The non-dimensionalised time ( $t^\prime = t \boldsymbol {V}_s/R_d$) is obtained after the product of the reference time ( $t$) with the ratio of the instantaneous slip velocity ( $\boldsymbol {V}_s$) to the undeformed droplet radius ( $R_d$). The reference time ( $t$) is measured from the commencement of droplet deformation. After injection, the droplet moves vertically upward due to buoyancy and attains a stable shape after travelling a certain distance, as shown in figure 6 ( $t^{\prime } =0$). Once the droplet begins to deform due to the induced flow of the vortex ring, we define this time instant as the beginning of droplet deformation. The regime of droplet deformation is considered to last until the vortex ring comes into contact with the droplet ( $t^{\prime } =0\text {--}1.2$). At this point, the droplet has deformed from a spherical shape to a disc with an elliptical cross-section, as shown in figure 6 ( $t^{\prime } =1.2$). During interaction, the deformation is caused by the generation of high-pressure regions near the forward (north pole) and backward (south pole) stagnation points. The high-pressure region from both ends tries to deform the droplet while the surface tension resists it. If the pressure force is greater than the surface tension force (which is present in all cases of this study), droplet deformation occurs. The viscosity of the oil droplet resists any change that occurs within the droplet. The results showing the theoretical prediction of droplet deformation with the experimental data are shown in figure 7. The theoretical model is in good agreement with the experimental data, and a maximum deviation of less than 10 % is observed in the results.

Figure 6. Regime-I: droplet deformation for case-II. (a) Planer LIF imaging (with dye in vortex ring). (b) Side-view imaging. (c) Top-view imaging. (d) PIV vector field with the vorticity field in the background. The side-view and top-view images were captured simultaneously, while the planer LIF and PIV images were captured simultaneously in a separate experiment. For details see supplementary movie S1.

Figure 7. Non-dimensional droplet deformation  $a^{\prime }=(a/R_d)$ variation with non-dimensional deformation time $t^{\prime }=(t \boldsymbol {V}_s/R)$ for different experimental cases. The continuous line corresponds to theoretical prediction (see (4.1)) and red markers correspond to the experimental data.
5.2. Droplet dynamics regime-II: droplet stretching and engulfment
At the end of the droplet deformation regime, the vortex ring comes into contact with the flattened droplet, as shown in figure 8 ( $t^{*} =2.66$). We have taken the time reference to be from the beginning of the droplet deformation. The non-dimensionalised time ( $t^{*}$) is obtained after the product of the reference time with the ratio of the maximum tangential velocity ( $U_c$) of the vortex ring to the vortex core radius ( $r_c$). During the deformation, a boundary layer is formed around the droplet due to the flow induced by the upcoming vortex ring (figure 8(d) at $t^{*} = 0\text {--}2.51$). The boundary layer is sheared away from the droplet surface by the external flow ( $t^{*} =2.51\text {--}2.66$) when the vortex ring reaches in the vicinity of the droplet. The separated shear layer rolls up and forms a secondary vortex ring ( $t^{*} =2.66\text {--}4.25$), which further wraps around the primary ring, and interacts with it. The vorticity field range in figure 8(d) is confined from $-300$ to $300\ \textrm {s}^{-1}$ so that the secondary vorticity ring can be displayed. A similar type of secondary ring was also observed in the interaction of the vortex ring with a wall (Walker et al. Reference Walker, Smith, Cerra and Doligalski1987; Hu & Peterson Reference Hu and Peterson2018) or its co-axial collision with a solid sphere (Allen, Joanne & Shashikanth Reference Allen, Joanne and Shashikanth2007; de Sousa Reference de Sousa2011; Yu, Huang & Lu Reference Yu, Huang and Lu2014; Nguyen, Degawa & Uchiyama Reference Nguyen, Degawa and Uchiyama2019). In the above studies, the interaction of primary and secondary vortex rings has shown significant influence on the primary vortex ring characteristics. The interaction has been shown to increase enstrophy (additional vorticity formed due to secondary vortex ring) and decrease the energy and circulation strength of the vortex ring. In the present study, the vortex ring Reynolds number ( $Re_c = 5135\text {--}18\,095$) is very high in comparison with the above-mentioned studies, where $Re_c<2000$. Therefore, in our case, the formation of the secondary vortex ring has a negligible influence on the characteristics of the primary vortex ring. As the vortex ring comes in contact with the droplet, it exerts a shear force on the flattened droplet that leads to stretching of the droplet. The stretched droplet wraps around the primary vortex ring, and the leading edge reaches at the top of the vortex core, as shown in figure 8 ( $t^{*} =2.66\text {--}6.68$). We have taken this time instant as the end of the stretching stage.

Figure 8. Regime-II: droplet stretching for case-IV. (a) Planer LIF (with dye in vortex ring). (b) Side-view imaging. (c) Top-view imaging. (d) PIV vector field with the vorticity field in the background. The side-view and top-view images were captured simultaneously, while the planer LIF and PIV images were captured simultaneously in a separate experiment.
The problem of vortex–droplet interaction is two-way coupled in nature, i.e. the characteristics of both vortex ring and droplet are influenced due to the interaction, as can be seen from the results of the current section (for the droplet dynamics) and subsequent § 5.4 (for the vortex dynamics). The droplet engulfment into the vortex core depends on the force due to the pressure gradient (4.9d), which further depends on the vortex ring circulation strength (4.9). Looking at the results of cases III–VIII in figure 18, the maximum decrement in the circulation strength values due to interaction (during the engulfment stage) is less than  ${\sim }10\,\%$, indicating that the effect of coupling on the vortex side is less in comparison with that on the droplet side (for the engulfment stage). Therefore, the engulfment model (§ 4.2) is solved using the one-way coupling assumption, which significantly reduces the complexity of the problem.
As will be explained later in § 5.5, the pressure distribution decreases from the outer region to the core of the vortex ring. This differential pressure exerts an inward pull at the leading edge of the stretched droplet towards the vortex core. The stretched droplet in the form of cylindrical ligaments entrains into the core of the vortex ring, as shown in figure 9. Along with droplet engulfment, a toroidal rim is formed on the top, which remains attached to the stretching bag during this stage. We have presented results for cases III–VIII in figures 10–11 while the result of cases I–II could not be evaluated. Due to the lower circulation strengths of case-I and case-II, the engulfment of the stretched droplet into the vortex core is not uniform from all directions (unlike the other cases). Therefore, only a single ligament in the form of a flattened sheet is observed to engulf into the vortex core (see supplementary figure S3). The engulfment for case-I and case-II can occur at any azimuthal location on the vortex ring, and it is unlikely for the engulfment plane to be in line with the plane of illumination during LIF imaging (used to evaluate the leading edge location). With five experimental runs, it is unlikely that the engulfment of the ligament will occur in the plane of illumination, and the choice of geometry taken for modelling engulfment of the ligament in § 4.2 is also inapplicable for these two cases. Thus, we have avoided calculating droplet engulfment for these two cases.

Figure 9. Regime-II: droplet engulfment for case-VIII. (a) Planer LIF imaging (without dye in the vortex ring). (b) Side-view imaging. (c) Top-view imaging. (d) PIV vector field with the vorticity field in the background. The side-view and top-view images were captured simultaneously, while the planer LIF and PIV images were captured simultaneously in a separate experiment. For details see supplementary movie S2.

Figure 10. Variation of the non-dimensional radial position ( $r^{*}=r/r_c$) of the leading edge with non-dimensional time ( $t^{*} =t U_c/r_c$) for different experimental cases. The dotted line corresponds to the complete model-1 and the simplified model-2 is shown with a solid line. The position of the marker defines the experimental data.

Figure 11. Engulfment time ( $t_{engulfment} =t U_c/r_c$) of droplet leading edge into the centre of the vortex core for different experimental cases. (b) Comparison of theoretical engulfment models (model-1 and model-2) with experimental data.
The theoretical models (model-1 and model-2), which discuss the entrainment of the leading edge into the vortex core, were presented in § 4.2. Figure 10 shows the variation of the non-dimensional radial location of the leading edge with non-dimensional time. In figure 10, the experimental data are shown with the markers, while the predictions based on model-1 (see (4.16)) and model-2 (see (4.21)) are shown using dashed and solid lines, respectively. In figure 10, the predictions of model-1 are in good agreement with the experimental data. However, a slight under-prediction is observed with model-2 due to the absence of other forces.
We define engulfment time ( $t_{engulfment}$) for the droplet as the time taken by the leading edge of the ligament to reach from the beginning of the engulfment ( $r^* = 1.5$ for most cases) to the centre of the vortex core $(r^* = 0)$. Figure 11(a) shows the trend of engulfment time for various experimental cases. The engulfment time for all experimental cases is between 1.3 and 2.5. Figure 11(b) shows a comparison of the engulfment times predicted by model-1 and model-2. Model-1 agrees mostly well with the experimental data, while a slight under-prediction is observed in model-2.
5.3. Droplet dynamics regime-III: droplet breakup
The final regime of vortex–droplet interaction is the droplet breakup regime, in which a primary droplet disintegrates into several secondary droplets. There are different modes through which primary droplet atomises into smaller daughter droplets. One of these modes is the rupture of the stretched bag and its detachment from the toroidal ring (see figure 14c). As the mass of the droplet is conserved, the thickness of the bag continues to decrease as the leading edge entrains into the vortex core (figure 12 at  $t^{*} =12.6$). This continuous reduction in bag thickness triggers nucleation of holes at a different location on its surface ( $t^{*} =13.1\text {--}13.9$). Next, the holes formed on the bag surface begin to spread in all directions, leading to its rupture ( $t^{*} =14.7\text {--}15.2$). Cylindrical shaped oil ligaments are formed after the rupture of the bag. These ligaments further undergo secondary atomisation into smaller droplets.

Figure 12. Regime-III: droplet breakup for case-VIII. (a) Side-view. (b) Top-view. For details see supplementary movie S2.
The breakup of the bag observed in the present work is similar to a droplet exposed to uniform fluid flow (Villermaux & Bossa Reference Villermaux and Bossa2009; Zhao et al. Reference Zhao, Liu, Li and Xu2010; Kulkarni & Sojka Reference Kulkarni and Sojka2014; Jain et al. Reference Jain, Prakash, Tomar and Ravikrishna2015). However, we have limited ourselves to establishing any analytical similarity between these two cases since the translation-based Weber number ( $We_t = \rho _w V_{s} D_d/ \sigma$) obtained in this work ( $We_t \approx 100$) is much higher than the regime of the bag breakup ( $We_t<30$) discussed in those studies (Zhao et al. Reference Zhao, Liu, Li and Xu2010; Jain et al. Reference Jain, Prakash, Tomar and Ravikrishna2015). We can see the nucleation of holes on the droplet surface in figure 12 ( $t^{*} =12.6\text {--}15.2$). However, the surface instabilities, which trigger the formation of holes, could not be identified from the images, even though the side-view images were taken at a 12 000 f.p.s. frame rate. These instabilities are difficult to perceive experimentally due to their small time scales. Similar observations were made by Guildenbecher, López-Rivera & Sojka (Reference Guildenbecher, López-Rivera and Sojka2009) in their review on secondary atomisation.
The breakup time is defined from the beginning of droplet deformation to the first appearance of a hole on the bag surface. The results of dimensional and non-dimensional breakup times observed for different experimental cases are shown in figure 13(a,b). The dimensional form of the breakup time is plotted in figure 13(a), which shows that the breakup time decreases with increasing strength of the vortex ring. The time required for droplet deformation, stretching and engulfment reduces as vortex strength increases. Since the breakup time is equal to the sum of all these times (4.22), we get a decrease in the droplet breakup time with increasing vortex strength. Figure 13(b) is a non-dimensional representation for the breakup time, and shows that it ranges from  $\sim$8.5 to 12 for different cases. A comparison between the experimental data and the theoretical model (discussed in § 4.3) is shown in figure 13(c).

Figure 13. Droplet breakup time for different Reynolds numbers. (a) Dimensional form. (b) Non-dimensional form. (c) Comparison of theoretical predictions to experimental data.
In the present study, three types of breakup are observed during the primary droplet atomisation (figure 14). In the first type, the ligaments entrained into the core of the vortex ring undergo secondary atomisation, as shown in figure 14(a). In the second type, the upper ring detaches from the bag, as shown in figure 14(b). The third type of breakup is the bag type breakup (figure 14c). The cylindrical ligaments that form after the rupture of the bag undergo further atomisation. The cylindrical ligaments stretch continuously, which results in the formation of instabilities in the form of capillary waves on their surface. Among all unstable waves, the instabilities with the highest growth rate lead to the creation of thinner and thicker diameter regions along the ligaments lengths (see figure 14). This development of thin and thick regions causes different Laplacian pressures, which triggers the liquid flow from smaller diameter regions to larger diameter regions. This results in the pinching of ligaments near the smaller diameter region. This droplet breakup mode is known as the Rayleigh–Plateau mode of breakup (Lin & Reitz Reference Lin and Reitz1998; Drazin & Reid Reference Drazin and Reid2004; Hagedorn, Martys & Douglas Reference Hagedorn, Martys and Douglas2004). The criterion for a liquid ligament to undergo this mode of breakup is that  ${\lambda }/{d_l}> {\rm \pi}$, where $\lambda$ is the wavelength of instability and $d_l$ is the diameter of the ligament. This criterion was indeed satisfied for ligament breakup in our experiments. We have not discussed the size distribution of atomised droplets because complete disintegration happens beyond the field of view of the camera. The complete regime map of the droplet dynamics based on experimental data is shown in figure 15. The result shows that the non-dimensional deformation time, stretching time and engulfment time are in the ranges 2–4, 6–10 and 9–15, respectively, for different experimental cases.

Figure 14. Different types of droplet breakup. (a) Breakup of engulfed ligaments. (b) Detachment of top rim from the stretched bag. (c) Breakup of the stretched bag.

Figure 15. Regime map of droplet dynamics. Deformation stage corresponds to  $t^* = 2\text {--}4$, stretching stage corresponds to $t^* = 6\text {--}10$, engulfment stage corresponds to $t^* = 9\text {--}15$ for different experimental cases. The results are plotted based on the experimental data. Note that cases I–II have different breakup modes which can be observed from the jump between the engulfment and breakup times.
5.4. Vortex dynamics: effect on vorticity distribution and circulation strength
We will now shift our attention to understanding the influence of vortex–droplet interaction on the characteristics of the vortex ring. We will first examine the effects of the interaction on the vorticity distribution of the vortex ring. The vorticity distribution for a vortex ring with and without interactions for case-I and case-VIII are shown in figures 16 and 17, respectively. Here, the first column of images shows the shadowgraphy images depicting different regimes of interaction at which the vorticity distribution for the no interaction (second column) and interaction cases (third column) is evaluated, and the last column shows the variation of centreline vorticity (measured along with the line joining the centres of two cores) normalised with the initial peak vorticity value. In figure 16, we show the vorticity distribution of case-I, which has the lowest circulation strength in this study. The vorticity range is capped between  $-150$ and $150\ \textrm {s}^{-1}$ so that the shedding of vorticity from the vortex ring could be recognised. The chronological sequence of images with $t^{*}$= 2.8, 7.1, 12.4 and 16.7 is shown in figure 16(a–d), respectively. These time sequences correspond to the deformation, stretching, engulfment and breakup of the droplet. For the non-interacting case, a similar structure and vorticity peaks are obtained on both cores of the vortex ring. A minimal amount of vorticity diffusion into the ambient fluid is observed as we move $t^{*}=2.8 \ \text {to} \ 16.7$, and the vortex ring retains its initial undeformed state. This can be further verified from the vorticity ratio plots. For an interacting case, a separation of the boundary layer from the droplet surface and a decrease in the peak vorticity by $\sim$10 % are observed during droplet deformation at $t^{*}=2.8$. For $t^{*}= 7.1$ (droplet stretching), a secondary vortex ring is formed, which wraps around the primary one. As a result, the vortex ring structure begins to distort, accompanied by a small amount of vorticity diffusion. Again, the peak vorticity is lower than the initial value. In case-I of this study, no uniform engulfment of the droplet is observed. The vorticity distribution shown in figure 16(d) corresponds to the interaction in which the engulfment of droplet occurs only at the left vortex core ( $t^{*}= 12.4$). As a result, the vorticity ratio on the left side is less than the reference case of no interaction. The vorticity on the right side is the same as that of the reference case since no droplet engulfment occurs in the right core. The position of the core centres gets shifted to the right due to the droplet engulfment; see figure 16. Moreover, the vorticity diffusion into the surrounding fluid is also increased during this time, and shedding of vortices continues from the sides of the vortex cores. At $t^{*}=16.7$ (droplet breakup), the engulfed ligaments in the left core of the vortex ring perturb the core structure and break it into two parts. Here too, the vortex ratio of the left core is lower than in the reference case.

Figure 16. The vorticity distribution for case-I. The first column shows the shadowgraphy image depicting the location of the droplet relative to the vortex ring. The second and third columns show the images of the non-interacting and interacting vortex ring cases, respectively. The fourth column compares the vorticity ratio that is normalised with the initial peak vorticity measured along the horizontal line joining the two core centres of the vortex ring. The rows of images ( $a$–
$a$– $d$) corresponds to $t^{*}=2.8$, 7.1, 12.4 and $16.7$, respectively. The dimensions in the second and third column are in mm.

Figure 17. The vorticity distribution for case-VIII. The first column shows the shadowgraphy image depicting the location of the droplet relative to the vortex ring. The second and third columns show the images of the non-interacting and interacting vortex ring case. The fourth column shows the comparison of the vorticity ratio that is normalised with the initial peak vorticity measured along the horizontal line joining the two core centres of the vortex ring. The rows of images a, b, c, and d corresponds to  $t^{*}= 3.1$, 9.8, 12.6 and $15.2$, respectively. The dimensions in the second and third column are in mm.
The vorticity distribution for case-VIII is shown in figure 17. The chronological image sequence shown in figure 17(a–d) corresponds to the  $t^{*}$ values of $3.1$, $9.8$, $12.6$ and $15.2$, respectively. These sequences correspond to the regime of deformation, stretching, engulfment and the breakup of the droplet, in an ordered manner. The vorticity values are capped between $-300$ and $300\ \textrm {s}^{-1}$ so that diffusion of vorticity can be perceived. For a non-interacting case, a slight vorticity diffusion of the vortex ring into the surrounding fluids is observed. However, the structure of the vortex ring remains unchanged for different time instances. For the interacting vortex ring, at $t^{*} = 3.1$ (droplet deformation), the vortex structure is deformed due to the vortex interaction, and diffusion from the core edges is observed. A decrease in the peak vorticity is observed for both the vortex cores. A similar trend is also observed during droplet stretching (at $t^*=9.8$); however, the degree of diffusion is more significant compared with droplet deformation. The diffused vortices travel upward in the form of a wake behind the vortex ring. At higher vortex strength (as in case-VIII), the stretched droplet is uniformly engulfed into the vortex core from all sides (in contrast to the case-I, see figure S3). Therefore, a decrease in the vorticity ratio is observed on both sides of the vortex ring ( $t^{*} = 12.6$). The distortion in the vortex ring structure is increased due to the interaction of the core with the engulfed ligaments. The engulfed ligaments also increase vorticity diffusion and dissipation of the vortex ring ( $t^{*} = 15.2$).
The important characteristics of a vortex ring are defined by its circulation strength, energy and enstrophy. The above characteristics of the vortex ring are evaluated by taking an area integral of the vorticity field over a circular area twice that of the vortex core. For a vortex ring in an inviscid flow, the total circulation of the vortex ring is conserved over time. However, in the case of viscous fluid, circulation strength continuously diffuses into the surrounding fluid. Figure 18 shows the variation in the circulation of the interacting vortex ring when compared to the reference case of no interaction. We have normalised the circulation at all times with the initial circulation value. The initial circulation is considered at a time instant when the complete vortex ring is formed (without any attached trailing jet). In figures 18 and 20, for different experimental cases, the timeline is divided into several sub-sections using vertical dashed lines representing deformation, stretching, engulfment and breakup of the droplet on moving from left to right. These sub-sections are not provided in cases I–II since the engulfment and breakup modes for these cases are different. Most experimental cases of non-interacting vortex rings show a constant circulation value over time, indicating negligible vorticity diffusion. In the case of the interacting vortex rings, a decrease in the circulation value is observed in all experimental cases, and the extent of decrement of the circulation is higher at low vortex strength (cases I–IV). Maximum decrement of  ${\sim }30\,\%$ is observed in cases-I and case-II, while it is ${\sim }20\,\%$ for cases-III and case-IV. At higher vortex ring strength (case V–VIII), the decrease in the circulation ratio of the interacting ring is very small. For cases-V and case-VI, the maximum decrement is ${\sim }10\,\%$, while for cases-VII and case-VIII, it is even lower at ${\sim }5\,\%$. As previously discussed, there is diffusion and dissipation of the vortex ring due to the interaction, which causes loss of vorticity in the wake, resulting in a decrement in the vorticity values, thereby resulting in a decrease in circulation values with time. During droplet deformation, the circulation trend is the same for both interacting and non-interacting vortex rings. This is because there is no contact between the vortex ring and the droplet during this time. The decreasing trend of circulation ratio begins during stretching and continues until the breakup.

Figure 18. Effect of droplet interaction on the circulation strength of the vortex ring for different experimental cases. The circulation strength for an interacting and a non-interacting case is shown with a blue and a red solid line, respectively. Different interaction regimes are represented by vertical dashed lines. In each case, the regimes of deformation (R-I), stretching (R-II(S)), engulfment (R-II(E)) and breakup (R-III) of the droplet are shown in sequence from left to right.
5.5. Vortex dynamics: effect on pressure distribution, energy and enstrophy
The difference in pressure at a particular spatial location to the pressure at the far-field location is normalised by the pressure difference between the core and far-field locations obtained from a Gaussian vortex model ( $0.87 \rho _w (\varGamma /2{\rm \pi} r_c )^2$. The velocity field obtained from PIV data is further processed to get the pressure distribution, as suggested by Dabiri et al. (Reference Dabiri, Bose, Gemmell, Colin and Costello2013). The unsteady term, convective term and diffusive term of the Navier–Stokes equation can be evaluated from the PIV data. These terms are further substituted into the Navier–Stokes equation to obtain the pressure gradient distribution. The pressure gradient field is integrated to get the pressure distribution. It should be noted that the PIV data have some inherent uncertainties, and the pressure distribution obtained after processing such data will also include these errors. To minimise such errors, a method was suggested by Dabiri et al. (Reference Dabiri, Bose, Gemmell, Colin and Costello2013). They used median polling of several integration paths instead of using a single integration path for reducing measurement error. The same code is used in this work for obtaining the pressure distribution, as shown in figure 19. A decrease in pressure is observed from the outer region of the vortex ring to its core. This differential pressure exerts an inward force on the droplet and tries to engulf it into the core region. In figure 19, the first column of images corresponds to the shadowgraphy image showing the actual location of the droplet with respect to the vortex ring, the second and third columns of images show the pressure distribution for a vortex ring without/with interaction, respectively. For an interacting case, a decrease in the absolute value of maximum pressure difference is observed. Using a Gaussian vortex model, the pressure difference between the ambient fluid and the centre of the core is written as follows:
 \begin{equation} P-P_\infty ={-}\rho_w \left( \frac{\varGamma_o}{2 {\rm \pi}r_c} \right )^2 f(r/r_c) ,\end{equation}
where  $f(r/r_c)$ is a function of the radial location from the centre of the vortex core (Oweis et al. Reference Oweis, van der Hout, Iyer, Tryggvason and Ceccio2005). When a vortex ring interacts, its circulation strength decreases (see § 5.4), and thereby the pressure difference between the vortex core and far-field region also reduces (see (5.1)).

Figure 19. First column depicts the location of the droplet with respect to vortex ring. Normalised pressure contours that were created after processing the PIV velocity field for the no-interaction case (second column) and interaction case (third column). (a) Case-I at  $t^* = 16.7$. (b) Case-V at $t^* = 12.4$. (c) Case-VIII at $t^* = 15.2$. All dimensions are in m.
An earlier study by Jha & Govardhan (Reference Jha and Govardhan2015) showed that the side interaction of a single bubble interacting with a vortex ring develops pressure gradients in the azimuthal direction along the centre of the vortex tube. In the present study, we have not observed such pressure differences between the two cores of the vortex ring. The side interaction of a vortex ring with a bubble or droplet is geometrically asymmetrical, which can trigger a pressure difference within the vortex tube. However, a co-axial interaction is geometrically symmetrical, and the engulfment of the droplet takes place from a different azimuthal direction of the vortex ring. Therefore, the pressure distribution along the vortex tube is similar in our case.
The total kinetic energy and enstrophy of the vortex ring are described as
 \begin{gather} \textrm{Total kinetic energy}\ (e)=\frac{1}{V}\int\int \frac{1}{2} \boldsymbol{u}^2 \,\textrm{d}V \end{gather}
 \begin{gather}\textrm{Total enstrophy}\ (E_s)=\frac{1}{V}\int \int \frac{1}{2} \boldsymbol{\omega}^2 \,\textrm{d}V. \end{gather}
Figure 20(a) shows the temporal distribution of the normalised total energy of a vortex ring. The total energy of a non-interacting vortex ring is almost constant over all experimental cases. A steep initial decay in the total energy of the non-interacting vortex ring is observed for cases VI–VIII. This decay in the total energy could be due to the small-scale instabilities present in the turbulent vortex rings, which lead to significant vortex shedding and show a rapid growth rate compared with laminar vortex rings (Lim & Nickels Reference Lim and Nickels1995). This rapid growth rate leads to significant core–core interaction, viscous diffusion and loss of circulation due to vortex shedding into the wake of the vortex ring. All these effects add up and lead to a rapid decay in the vortex ring energy.

Figure 20. Effect of droplet interaction on the (a) total energy (b) total enstrophy of the vortex ring, for different experimental cases. The total energy for an interacting and a non-interacting case is shown with a blue and a red solid line, respectively. Different interaction regimes are represented by vertical dashed lines. In each case, the regimes of deformation (R-I), stretching (R-II(S)), engulfment (R-II(E)) and breakup (R-III) of the droplet are shown in sequence from left to right.
For an interacting case, a significant reduction in the total energy of the vortex ring is observed. The degree of decrement is higher at lower vortex ring strengths (cases I–IV), where the total energy of interaction is reduced by  ${\sim }50\,\%$, compared with its reference case. At higher vortex ring strengths (case V–VIII), the total energy for an interacting ring is reduced by ${\sim }30\,\%$. The vortex ring's total energy gets utilised as work done on the droplet, including the work done for deformation, stretching, engulfment and the breakup of the droplet. Apart from this, there is a loss of total energy of the vortex ring due to the viscous dissipation by the engulfed ligaments and diffusion to the surrounding fluid. All of these effects lead to a reduction in the total energy of the interacting vortex ring.
During the droplet deformation regime, the total energy of the vortex ring, which interacts, is similar to its reference case since the energy is lost only for droplet deformation and viscous diffusion. A steep decrement in the value of energy is observed during the droplet stretching, and a slightly lower decrement is observed during the engulfment stage for all experimental cases. During droplet stretching, the vortex ring energy is lost against the droplet surface energy, viscous diffusion and dissipation, vortex ambient fluid interaction and the core–core interactions. All these energy losses sum up to show a higher decay in vortex energy during the stretching stage. Additional energy other than mentioned above is required to entrain the leading edge into the vortex core during the engulfment stage. In cases-I and II, the energy of the vortex ring is mainly used for deforming and stretching the droplets, as uniform engulfment is not noticed for these cases (see supplementary figure 3). Therefore, significant decay is observed during the initial stages of interaction. This decrement is steeper than the other cases (cases IV–VIII), as the value of initial energy for cases I–II itself is lower than the other cases. Therefore, the effect of loss of energy on deformation and stretching of the droplet is more prominent for these rings. No further decrement in total energy is observed during droplet breakup.
The enstrophy calculation determines the extent of vorticity present in the flow. The results of the variation of the enstrophy ratio of the vortex ring and its comparison with the reference case (without interaction) at different times are shown in figure 20(b). We have normalised total enstrophy at each time instant with the initial total enstrophy of the vortex ring. The enstrophy of the reference vortex ring is constant over time, and only a slight decrease in the enstrophy is observed, which is due to diffusion effects (figures 16–17). The enstrophy ratio decreases significantly when a vortex ring interacts with a droplet. The maximum reduction of  ${\sim }40\,\%$ is observed in most of the experimental cases. The extent of decrease in enstrophy is similar for all experimental cases regardless of the strength of the vortex ring. As discussed earlier, the structure of the vortex ring is disturbed due to interactions. As a consequence, it causes vorticity loss and, thereby, enstrophy loss. The reduction in enstrophy has also been reported by other researchers (Lu, Fernández & Tryggvason Reference Lu, Fernández and Tryggvason2005; Ferrante & Elghobashi Reference Ferrante and Elghobashi2007; van Gils et al. Reference van Gils, Guzman, Sun and Lohse2013; Jha & Govardhan Reference Jha and Govardhan2015). Lu et al. (Reference Lu, Fernández and Tryggvason2005) showed an approximately ${\sim } 60\,\%$ decrease in enstrophy in their investigation of bubbles in a turbulent channel flow.
5.6. Vortex dynamics: effect on vortex translation
A mathematical correlation for estimating the translational speed of the vortex ring in a viscous fluid medium is given in Fukumoto & Moffatt (Reference Fukumoto and Moffatt2008) as follows:
 \begin{equation} U_{convection}=\frac{\varGamma_o} {4{\rm \pi} r_c} \left(\ln\left( \frac{4 r_c}{\sqrt{ \nu t}}\right )- 0.558 -3.6716 \frac{\nu t}{r_c^2}\right) . \end{equation}
The above equation is derived using an asymptotic solution of the Euler equations for large Reynolds number and the assumption of a Gaussian vortex ring. This theoretical model predicts the translation of the vortex ring with reasonable accuracy for most of the cases (cases I–V), while a bit overprediction is observed for cases VI–VIII (see figure 21). The Fukumoto & Moffatt (Reference Fukumoto and Moffatt2008) model was developed for high Reynold number vortex rings with the ratio of core radius to ring radius  $(r_c/R) \ll 1$ (indicating that two cores do not interact) and by considering the higher-order terms of $\epsilon \sim O(3)$, but it does not take into account the physical effects of core interactions leading to vorticity loss. These diffusion effects are more prominent for turbulent vortex rings, leading to overprediction of the experimental results by the model. For the interaction case, the translational speed of the vortex ring decreases. Consequently, for a particular instant, the distance travelled by the interacting vortex ring is less than the non-interacting vortex ring for all experimental cases.

Figure 21. Influence of the droplet interaction on translational speed of the vortex ring. The temporal variation of the centre of the vortex ring core is shown for different experimental cases. The theoretical prediction is shown by the dotted black line, the reference case of no interaction is shown with a red marker and the interaction case is shown with a blue marker.
6. Summary and conclusions
The co-axial interaction of the vortex ring with a droplet was investigated experimentally, and the results were theoretically validated using the existing theoretical models. We have reported the effect of interaction on both droplet as well as the vortex dynamics. In the droplet dynamics, three regimes of vortex–droplet interaction were identified. Regime-I corresponds to droplet deformation, in which flow around the droplet surface was induced due to the incoming vortex ring. This causes the generation of high-pressure regions near the forward (north pole) and backward (south pole) stagnation points of the droplet. These high-pressure regions exert a compressive force on the droplet surface that exceeds the surface tension force and causes droplet deformation. In order to predict the deformation, a spring–mass–damper system analogy was used, which shows a fair agreement with the experimental data. Regime-I ends for different experimental cases at  $t^{*}=2\text {--}4$.
Regime-II in the droplet dynamics corresponds to the stretching and engulfment of the droplet. When a vortex ring comes in contact with the flattened droplet, it exerts a shear force, which causes stretching of the droplet and its subsequent wrapping around the vortex ring. The stretching of the droplet (regime-II) exists up to  $t^{*}=6\text {--}10$, for all experimental cases. A decrease in pressure from the outer far-field area to the vortex ring centre was shown by processing the PIV velocity field. This differential pressure exerts a net inward force on the leading edge of the droplet and results in its engulfment. The droplet engulfment time was modelled using an existing theoretical model and showed a reasonable match with the experimental data. The droplet engulfment for different experimental cases ends at $t^{*}= 9\text {--}15$.
The last regime in the droplet dynamics is the breakup of the droplet (regime-III). Three modes of droplet breakup were identified in this regime, including breakup of the engulfed ligament, detachment of stretched bag from the upper rim and the rupture of the stretched bag. The continuous reduction of droplet thickness leads to the nucleation of several holes in the stretched droplet bag and its subsequent rupture. A theoretical model that predicts the droplet breakup time shows an acceptable agreement with the experimental data.
In the vortex dynamics, we have investigated the effect of interaction on vorticity distribution, circulation strength, pressure distribution, total energy and enstrophy and the translational speed of the vortex ring. The circulation strength was decreased for all experiments due to vortex ring interaction. The reduction in circulation was higher at lower vortex ring strengths (case-I and case-II), where a maximum decrement of  ${\sim }30\,\%$ was found. Normalised pressure difference contours for the interacting vortex ring had lower absolute values compared with its reference case (without interaction). It was found that the total energy and enstrophy of the vortex ring drastically decreased during the period from stretching to the breakup of the droplet. In the cases I–IV of this study, significant decrements of ${\sim }50\,\%$ and ${\sim }40\,\%$ were observed in total energy and enstrophy of the vortex ring, respectively.
Finally, this work on a droplet interacting with a single vortical structure can serve as an idealised case for a single or multiple droplets/bubbles simultaneously interacting with multiple vortices in isotropic turbulence. Therefore, further experimental and numerical explorations in this direction are required. Studies can also be carried out to examine the size distribution of the daughter droplets and their effect on the vortex dynamics. This work encompassed a wide range of vortex rings (laminar to turbulent) and the studied interaction phenomenon is complex and involved different spatial–temporal scales. An extension to the present work can be carried out to provide universal insights into the interaction phenomenon.
Supplementary material and movies
Supplementary material and movies are available at https://doi.org/10.1017/jfm.2021.363.
Funding
The support of research by IGSTC (Indo-German Science and Technology Center) through project No. SP/IGSTC-18-0003 is gratefully acknowledged.
Declaration of interests
The authors report no conflict of interest.


 Open access