


Non-technical Summary
Punctuated equilibrium has two core, empirical claims: (1) stasis dominates—once species appear in the fossil record, they do not change much; and (2) morphological change is concentrated in pulses that occur associated with speciation. Here we assess the state of the evidence for these two claims, 50 years after punctuated equilibrium’s foundational paper. Spurred by controversy, paleontologists have amassed a large number of case studies in which morphology in species-level lineages is tracked over time. Compilations reveal that the directional trends predicted by gradualist expectations are infrequent. Although stasis is commonly observed, it is favored in less than half of cases, and meandering random walks or more complex models generally account for the majority of cases. The second claim of punctuated equilibrium has received much less empirical scrutiny than the first. Although speciational pulses are plausible, only a few paleontological studies integrate ancestor–descendant time series into a phylogenetic framework as is needed to estimate changes associated with speciation. These studies, as well as more indirect analyses of extant clades, suggest that speciational change can occur, but we cannot yet assess its frequency or importance compared with anagenetic changes.
Punctuated Equilibrium and Its Reach
It is difficult to overstate the influence that punctuated equilibrium has had on the field of paleontology. Since the publication of its foundational paper (Eldredge and Gould Reference Eldredge, Gould and Schopf1972), it has spurred many thousands of pages of scientific reaction—praise and rebuke, extensions and examinations—on its way to becoming the dominant frame that paleontologists adopt when considering how species change over their lifetimes. Indeed, the very existence of this special issue, devoted to the legacy of that single paper, is testament to the power and the reach of punctuated equilibrium as a scientific idea.
There is no doubting punctuated equilibrium’s impact. But is it correct? That is, are its predictions as a scientific model broadly supported by empirical evidence? Assessing this requires that we first delimit punctuated equilibrium’s boundaries. This task is not entirely straightforward, because it was entangled with a variety of other evolutionary and conceptual issues, including species selection (Stanley Reference Stanley1975; Jablonski Reference Jablonski2008), hierarchical conceptualizations of evolution (Vrba and Eldredge Reference Vrba and Eldredge1984), extensions into ecological change (Morris et al. Reference Morris, Ivany, Schopf and Brett1995), the relationship between micro- and macroevolution (Gould Reference Gould1980; Charlesworth et al. Reference Charlesworth, Lande and Slatkin1982; Hancock et al. Reference Hancock, Lehmberg and Bradburd2021), and its role more broadly in the history of paleontology as a science (Princehouse Reference Princehouse, Sepkoski and Ruse2009; Sepkoski Reference Sepkoski, Sepkoski and Ruse2009). Without denying the richness of its implications, we consider punctuated equilibrium itself to have two core, empirical claims: (1) stasis dominates: species do not change much after they appear in the fossil record; and (2) morphological change is concentrated into pulses of change associated with speciation. The complexity of punctuated equilibrium’s implications has led some to view the term as no longer useful (Pennell et al. Reference Pennell, Harmon and Uyeda2014; Rolland et al. Reference Rolland, Henao-Diaz, Doebeli, Germain, Harmon, Knowles and Liow2023), but the two core claims we identify match well the recent views of other paleontologists (Geary Reference Geary, Allmon, Kelley and Ross2009; Lieberman and Eldredge Reference Lieberman and Eldredge2014). Our goal in this essay is to evaluate these two claims in light of the paleontological evidence gathered over the past 50 years. We will argue that the discipline of paleontology has amassed a very large body of literature about the first claim, stasis, but that we still know surprisingly little about the link between speciation and morphological change.
Given the cumulative volume of ink devoted to punctuated equilibrium, it may seem that a review of its evidential support is hardly needed. After all, several reviews have addressed this question (Gingerich Reference Gingerich1985; Erwin and Anstey Reference Erwin, Anstey, Erwin and Anstey1995; Jackson and Cheetham Reference Jackson and Cheetham1999), even at book length (Hoffman Reference Hoffman1989; Levinton Reference Levinton2001), or longer (Gould Reference Gould2002). However, although these reviews consider overlapping sets of case studies, they do not agree with one another, and they form no useful consensus. Some conclude that punctuated equilibrium is dominant (Jackson and Cheetham Reference Jackson and Cheetham1999; Gould Reference Gould2002), others say that it is rarely supported (Gingerich Reference Gingerich1985; Levinton Reference Levinton2001), or that the evidence is mixed (Erwin and Anstey Reference Erwin, Anstey, Erwin and Anstey1995). Such disagreement could coexist because these reviews compiled verbal descriptions and qualitative judgments, with no clear recourse when these interpretations were in conflict.
From Verbal to Statistical Models of Trait Evolution
Punctuated equilibrium was initially presented without an operational testing strategy. The two core claims of stasis and speciational pulses were contrasted with an expectation of gradual trend whereby a species insensibly transforms into its descendant through a geological succession. Eldredge and Gould labeled this view “phyletic gradualism” and argued it was a pervasive, if often unstated, expectation among paleontologists. In 1972, few empirical case studies were up to the task of discriminating these two models, but the ensuing debate prompted researchers to tackle the problem with increased empirical rigor. And yet these new and better case studies could still receive diametrically opposing interpretations (e.g., Gould and Eldredge Reference Gould and Eldredge1977).
In response to this impasse, statistical tests were developed to guide evolutionary interpretation (Raup Reference Raup and Hallam1977; Raup and Crick Reference Raup and Crick1981; Bookstein Reference Bookstein1987; Gingerich Reference Gingerich1993; Roopnarine Reference Roopnarine2001). Most of these earlier tests set, as a null hypothesis, an unbiased random walk, a simple model in which trait changes from one time point to the next are independent and centered around zero. A trajectory would be classified as stasis if net change during the time series was less than what was predicted by a random walk. Conversely, a trait with net change greater or more consistent in direction than what a random walk predicted would be interpreted as a gradual trend. This shift in practice thus inserted an additional evolutionary mode—random walks—intermediate between stasis and gradualism, the two modes postulated by the punctuated equilibrium model. However, because these tests had low statistical power to reject random walks (Roopnarine et al. Reference Roopnarine, Byars and Fitzgerald1999; Sheets and Mitchell Reference Sheets and Mitchell2001), they made relatively little impact in practice.
The next generation of approaches used likelihood-based methods to fit and compare models (Hunt Reference Hunt2006; Hannisdal Reference Hannisdal2007). This approach requires that all evolutionary modes under consideration be defined as statistical models. Random walks were already well defined, but stasis and gradualism had previously been described somewhat impressionistically. For this model comparison approach, stasis is usually modeled as fluctuating white noise (Sheets and Mitchell Reference Sheets and Mitchell2001), and gradualism as a directional (also called biased) random walk. These modeling choices were a reasonable—though not exact—match to the initial qualitative accounts of stasis and gradualism. The latter term was particularly ambiguous; sometimes it meant a directional trend, but others used “gradual” to refer to the broader category of any incremental (non-punctuated) evolutionary change (see Hunt and Rabosky Reference Hunt and Rabosky2014; in this paper we use “gradualism” only to discuss the historical debate and shift to less ambiguous terms like directional or trend when discussing models). Likelihood approaches have several advantages over the previously developed null hypothesis tests, including that they naturally handle sampling error, they allow for valid parameter estimates and confidence intervals, and they can be extended to new models of evolution. Most important, however, was that these approaches could rigorously compare the evidential support competing models received in a way that treated each model on an equal footing, most commonly through the Akaike information criterion (Akaike Reference Akaike1974) or related metrics.
These features of likelihood analysis allowed for a new kind of review study of within-lineage evolution. Instead of tallying of subjective verdicts about stasis or gradualism, researchers could compile trait data and fit them to a standard set of models, the support for each could be summarized quantitatively (Hunt Reference Hunt2007b; Hopkins and Lidgard Reference Hopkins and Lidgard2012; Hunt et al. Reference Hunt, Hopkins and Lidgard2015; Voje Reference Voje2016). The two largest compilations (Hunt et al. Reference Hunt, Hopkins and Lidgard2015; Voje Reference Voje2016), with 709 and 450 time series of trait evolution, respectively, will form the bulk of the evidence we will draw upon to assess punctuated equilibrium’s predictions about within-lineage change. These two studies considered a partially overlapping set of time series and employed very similar methods. In both cases, statistical support for stasis, random walk, and directional trend was summarized using the sample size–corrected Akaike information criterion. Hunt et al. (Reference Hunt, Hopkins and Lidgard2015) fit additional models, including punctuations and models in which the mode shifted within a time series (e.g., a trait starts out in stasis and then experiences a trend). It has long been recognized that no evolutionary mode occurs universally, and so we use the cited studies to summarize the relative frequency with which relevant models are favored.
Claim 1: Stasis Dominates Within-Lineage Evolution
These surveys incorporate the outcomes of hundreds of instances in which paleontologists tracked morphological traits through time in unbranched, species-level lineages. In this section, we first focus on the relative frequency of support for different models (what do we know?), and then on the implications for the support of punctuated equilibrium as a model and for our understanding of the evolutionary processes that shape trait evolution (what does it mean?). Finally, we conclude this section with a brief look at the future of paleontological analysis of morphological time series.
What Do We Know about Patterns of Within-Lineage Change?
Stasis is common, but not the dominant mode of evolution within lineages. Voje (Reference Voje2016) found stasis to be best supported in 34% of cases. Hunt et al. (Reference Hunt, Hopkins and Lidgard2015) similarly found 38% for uniform stasis models, with many of the other best-supported models also having stasis as a component (e.g., two intervals of stasis separated by punctuation). In total, 63% of time series were best fit by a model with stasis occurring over some or all of its span. As expected, sequences for which stasis is favored show markedly less net change than other sequences (Voje Reference Voje2016); in fact, nearly half of them are better supported by a stricter version of the stasis model consistent with no real evolutionary variation (this means that sampling error on trait means is large enough to account for all observed trait variation; Hunt et al. Reference Hunt, Hopkins and Lidgard2015). However, in other cases, the stasis pattern encompasses substantial evolutionary change, and the average amount of trait change between samples can even be larger for stasis than for other models (Voje Reference Voje2016).
Sustained directional trends, on the other hand, are rather uncommon, comprising 12% (Voje Reference Voje2016) or 9% (Hunt et al. Reference Hunt, Hopkins and Lidgard2015), with the latter figure increasing to 13% if all models that include periods of directional change are included. Cases not best fit by uniform stasis or trends instead favor random walks or models with more complex dynamics. In both studies, these account for a majority of time series (54% for Voje [Reference Voje2016] and 53% for Hunt et al. [Reference Hunt, Hopkins and Lidgard2015]). Thus, most time series conform neatly to neither stasis nor gradual trends.
Which models are best supported can be influenced by the nature of the observational window. Stasis becomes less likely to be favored as the temporal duration of sequences increases (Hunt et al. Reference Hunt, Hopkins and Lidgard2015); if one waits long enough, it becomes increasingly probable that a trait will show some kind of accumulating evolutionary change.
What Do These Patterns Mean for Punctuated Equilibrium?
On balance, these aggregate results offer at least partial support for punctuated equilibrium’s claim about low net evolution during within-lineage change. Stasis is common over the 105–106 year timescales that paleontologists usually examine, and it occurs at much higher frequencies than the directional patterns associated with phyletic gradualism. Moreover, this differential must be even greater than indicated by these compilations, because paleontologists have surely documented trends disproportionately, hoping to capture “interesting” evolutionary change (Gould Reference Gould2002). On the other hand, most cases are not best explained as stasis, and its frequency falls short of what most observers would consider dominant.
Even if stasis is not quite dominant, punctuated equilibrium was important in recognizing stasis as a phenomenon of interest. Indeed, its most lasting contribution to evolutionary biology may well be the realization that net evolutionary rates are so often exceedingly slow compared with instances of rapid evolution in living populations. Although patterns of stasis were noted by some earlier paleontologists (see examples in Gould Reference Gould2002: pp. 745–755), it was not widely anticipated by evolutionary biologists and would not have been discovered without the fossil record. The frequent occurrence of stasis in the fossil record despite sometimes rapid evolution in extant populations (Hendry and Kinnison Reference Hendry and Kinnison1999) and strong directional selection and abundant genetic variance in extant populations has been termed “the paradox of stasis” (Hansen and Houle Reference Hansen, Houle, Pigliucci and Preston2004), and it has been suggested to be one of the significant unsolved problems in evolutionary biology (Williams Reference Williams1992). However, while stasis is commonly observed, it is not universal, and it has become clear that the binary categories of stasis and gradualism are not rich enough to capture the variety of patterns of trait evolution we see in fossil lineages. This observation has several implications to which we will return later.
What Do These Patterns Mean for Understanding Evolution?
Eldredge and Gould (Reference Eldredge, Gould and Schopf1972) cautioned that evolutionary process is difficult to infer from fossil data. Nonetheless, one front in the controversy that followed concerned the microevolutionary implications of the punctuated equilibrium model (Gould Reference Gould1980; Charlesworth et al. Reference Charlesworth, Lande and Slatkin1982; Hancock et al. Reference Hancock, Lehmberg and Bradburd2021). We accept that paleontologists usually lack the information needed to assess microevolution in any particular lineage. Stepping back, however, do the aggregate fossil patterns reveal anything about these underlying processes?
We will not examine this issue in detail (see Uyeda et al. Reference Uyeda, Hansen, Arnold and Pienaar2011; Hansen Reference Hansen, Svensson and Calsbeek2012; Hunt and Rabosky Reference Hunt and Rabosky2014). Instead, we will use Simpson’s (Reference Simpson1944) concept of phenotypic adaptive landscape to sketch out some useful ways to think about species-level morphological time series in the fossil record. Adaptive landscapes have axes that specify phenotype, with mean population fitness represented as elevation above these axes, similar to a contour map of topography. Natural selection pushes populations uphill, toward higher fitness, with drift adding a non-directional component of change. Simpson used this concept qualitatively to explore evolutionary patterns, such as the evolution of hypsodonty in the horse clade, but theory development starting with Lande (Reference Lande1976, Reference Lande1979) formalized this conceptual tool. We now have equations that describe how populations move on specified adaptive landscapes (Arnold Reference Arnold2023), which have become increasingly central to how evolutionary biologists understand microevolutionary processes over long timescales (Arnold et al. Reference Arnold, Pfrender and Jones2001; Hansen Reference Hansen, Svensson and Calsbeek2012; Uyeda and Harmon Reference Uyeda and Harmon2014; Rolland et al. Reference Rolland, Henao-Diaz, Doebeli, Germain, Harmon, Knowles and Liow2023).
In the simplest case of a fixed adaptive peak, populations located far from the adaptive optimum are pushed toward it, rapidly at first, but in a decelerating manner until the population converges to the peak. Even with weak selection, this convergence will usually be too rapid to resolve in the fossil record. Once the peak is attained, the population fluctuates around it in a balance between outward perturbations from drift and the inward pull of selection toward the optimum. These fluctuations are a plausible cause of stasis for traits that display a narrow range of variation (as for cases of strict stasis, noted earlier), but empirical investigations have not found support for this as a general explanation for stasis in the fossil record (Voje et al. Reference Voje, Starrfelt and Liow2018). Meta-analysis of studies of natural selection has found that selection coefficients can vary substantially over the course of several generations (Siepielski et al. Reference Siepielski, DiBattista and Carlson2009), although much of this apparent variation may be attributable to noise in estimating selection (Morrissey and Hadfield Reference Morrissey and Hadfield2012). Regardless, over timescales longer than a few generations, it seems unlikely that environmental and biotic conditions would remain constant. As factors that affect a species change, so does that species’ adaptive landscape. Peaks can change in height and position, and populations will follow them with lags that are generally much shorter than paleontological resolutions. This tracking of peaks may be cut short by population extinction, especially for large changes in the adaptive landscape that indicate substantial mismatch between a population’s traits and its conditions. The resulting population decline and extirpation may thus filter out many of the largest evolutionary responses that might have otherwise occurred (De Lisle et al. Reference De Lisle, Punzalan, Rollinson and Rowe2021). Nevertheless, with dynamic adaptive landscapes, long-term morphological changes are primarily governed by changes in the landscape itself, rather than the relatively quick population dynamics on stable landscapes.
This framework suggests a first-order interpretation for the distribution of patterns we see in paleontological time series (Uyeda et al. Reference Uyeda, Hansen, Arnold and Pienaar2011; Hansen Reference Hansen, Svensson and Calsbeek2012; Hunt and Rabosky Reference Hunt and Rabosky2014; Voje et al. Reference Voje, Starrfelt and Liow2018; Arnold Reference Arnold2023). Traits that are best fit as random walks are following peaks in the adaptive landscape that have meandered, and stasis results when conditions instead oscillate or fluctuate. These fluctuations need not be small (Voje Reference Voje2016), but as long as they are bounded and non-directional, a stasis model will be a good description of the pattern. When conditions change heterogeneously over time, evolutionary models that are uniform over time can fail, and complex models (punctuations, mode shifts) may better capture trait dynamics. Trends, which are otherwise difficult to account for (Gould Reference Gould2002), are likely rare, because conditions that species experience tend not to change as simple, linear trends over hundreds of thousands to millions of years. Short-term directional changes are probably common, but likely only rarely sustained long enough to result in accumulating change (Futuyma Reference Futuyma1987) or paleontological trends within species (e.g., Hunt and Roy Reference Hunt and Roy2006). Of course, these evolutionary patterns may be altered or distorted by temporal changes in preservation and sedimentation at a locality (Kidwell and Holland Reference Kidwell and Holland2002; Patzkowsky and Holland Reference Patzkowsky and Holland2012). The net effect of this geological overprint will depend greatly on both sedimentary context and on the true evolutionary pattern. Simulations and other approaches can be used to explore ranges of plausible effects (Holland Reference Holland2000; Hannisdal Reference Hannisdal2006, Reference Hannisdal2007; Hunt Reference Hunt2008; Patzkowsky and Holland Reference Patzkowsky and Holland2012; Hohmann et al. Reference Hohmann, Koelewijn, Burgess and Jarochowska2024), but this remains an understudied area of investigation. The immigration of morphologically similar lineages can also confound anagenetic patterns, but careful morphological analysis can at least sometimes reveal this dynamic (Van Bocxlaer et al. Reference Van Bocxlaer, Van Damme and Feibel2008; Hull and Norris Reference Hull and Norris2009).
This interpretative framework focuses on natural selection as the primary driver of morphological change, which is undoubtedly a simplification of a more complex evolutionary reality. Genetic drift will always operate and may be potent in small populations, but morphological change is far too slow in the fossil record for neutral evolution to be dominant (Hansen Reference Hansen, Svensson and Calsbeek2012; Hunt Reference Hunt2012). Trait variation may also influence the direction of evolution, with evolutionary changes potentially concentrated in more variable traits and combinations of traits (evolvability in its modern sense; Schluter Reference Schluter1996; Hansen and Houle Reference Hansen, Houle, Pigliucci and Preston2004; Hunt Reference Hunt2007a; Love et al. Reference Love, Grabowski, Houle, Liow, Porto, Tsuboi, Voje and Hunt2021; Opedal et al. Reference Opedal, Armbruster, Hansen, Holstad, Pelabon, Andersson and Campbell2023; Voje et al. Reference Voje, Grabowski, Holstad, Porto, Tsuboi, Bolstad, Hansen, Houle, Pavlicev and Pélabon2023; Holstad et al. Reference Holstad, Voje, Opedal, Bolstad, Bourg, Hansen and Pélabon2024). Some workers have also argued that population structure and gene flow may be particularly important contributors to stasis, as genetic exchange across variable environments may average out local adaptive changes (Lieberman et al. Reference Lieberman, Brett and Eldredge1994; Lieberman and Dudgeon Reference Lieberman and Dudgeon1996; Eldredge et al. Reference Eldredge, Thompson, Brakefield, Gavrilets, Jablonski, Jackson, Lenski, Lieberman, McPeek and Miller2005). The relationship between gene flow and evolutionary divergence can be complex (Hanski et al. Reference Hanski, Mononen and Ovaskainen2011; Kopp and Matuszewski Reference Kopp and Matuszewski2014), and testing the importance of spatial structure and gene flow for stasis will require adding to the few studies that document phenotypic evolution within a species across multiple environments or regions (e.g., Cisne et al. Reference Cisne, Chandlee, Rabe and Cohen1980; Lieberman et al. Reference Lieberman, Brett and Eldredge1995; Kucera and Malmgren Reference Kucera and Malmgren1998; Webber and Hunda Reference Webber and Hunda2007).
Despite all these potential complications, simulations by Hunt et al. (Reference Hunt, Hopkins and Lidgard2015) suggest that peak-tracking models have potential to account for many aspects of the aggregated data we have. Data simulated with a simple, calibrated model in which morphology tracks a long-term temperature curve resulted in frequencies of trends, random walks, stasis, and other models that were strikingly similar to the distribution we see in empirical fossil time series.
What Is Next for Analyzing Fossil Time Series?
We noted earlier that natural selection is usually too fast, and the fossil record is usually too coarse, to resolve evolutionary changes on a stable adaptive landscape. To our knowledge, there is just one such example, in which a varved lake deposit captures the adaptive reduction in skeletal armor in a lineage of stickleback as it invades a new lake (Hunt et al. Reference Hunt, Bell and Travis2008). Targeted work in high sedimentation rate environments, focusing on traits of adaptive significance, may produce more such examples in which paleontologists can hope to infer truly microevolutionary processes. In nearly all cases, however, the models discussed in this paper are better thought of as phenomenological, rather than process models. Their parameters do not reflect population genetic quantities such as selection gradients (although selection can be estimated in fossil populations by other means, at least under special circumstances; e.g., Van Valen Reference Van Valen1963; Hunt and Yasuhara Reference Hunt and Yasuhara2010; Di Martino and Liow Reference Di Martino and Liow2021). Instead, time-series models are tools to extract and quantify general features of evolutionary change such as directionality, pace, and punctuations. Recent papers have developed models to capture new features of interest, for example, initially rapid but then slowing changes in the adaptive landscape (Voje Reference Voje2020), dynamics that reflect underlying but hidden drivers (Reitan et al. Reference Reitan, Schweder and Henderiks2012), and sudden or gradual shifts in the adaptive landscape (Voje Reference Voje2023). There is more work to be done in crafting models to assess other dynamics of interest.
One striking feature about the aggregated literature on fossil time series is how univariate the analyses are. Often, multiple traits are measured, but the analysis almost always proceeds one trait at a time, sometimes after using principal components analysis or other techniques to reduce dimensionality (which has its own complications in this context; Bookstein Reference Bookstein2013; Uyeda et al. Reference Uyeda, Caetano and Pennell2015). The net effect is that we have good compilations of how traits evolve, but less clear of an idea about how morphology, as an integrated whole, changes. For example, it may be unremarkable when a single trait does not change over time. But when all observable aspects of form do not change, that is a more surprising outcome and greater validation of punctuated equilibrium’s contribution to evolutionary thought (Futuyma Reference Futuyma2010). Modeling traits jointly is complicated when different traits within the same lineage show different modes of evolution, which is a common outcome (Hopkins and Lidgard Reference Hopkins and Lidgard2012; Hunt et al. Reference Hunt, Hopkins and Lidgard2015). However, recent developments allow for differing trait dynamics within a unified modeling framework (Voje Reference Voje2023). Although these models can be more challenging to fit compared with univariate models, they open the door to an integrated organismal approach to understanding evolution on multivariate adaptive landscapes.
Although such methodological developments are welcome, the analysis of paleontological time series may be limited more by data availability than by the lack of appropriate models. The hundreds of cases gathered by recent compilations are only a small and somewhat idiosyncratic fraction of what has been collected by paleontologists, and they are insufficient for exploring differences in evolutionary outcomes across taxa, trait types, temporal scales, and other factors of interest. This limitation may be mitigated by the recently established Phenotypic Evolution Time Series database (PETS, https://pets.nhm.uio.no). This online community resource allows researchers to deposit for public use their own (or other published) data on morphological time series. The hope is that, just as for the Paleobiology Database, broad input from the paleontological community will quickly result in a much larger and richer store of data than could be compiled by any one researcher.
Claim 2: Most Change Is Associated with Speciation
When Eldredge and Gould (Reference Eldredge, Gould and Schopf1972) posited that most change is associated with speciation, they did not support this claim with direct paleontological evidence. Instead, they suggested that it was an expected consequence of allopatric speciation in small, peripheral populations. They also drew from ideas of Ernst Mayr and others that genetic homeostasis buffered against change and that speciation could disrupt this buffering. Mayr’s so-called genetic revolutions were not supported by later research (Coyne and Orr Reference Coyne and Orr2004), and this explanation for speciational pulses has mostly been abandoned (Gould Reference Gould2002).
Although the originally proposed mechanism is no longer viable, more recent work has focused on other processes that might accelerate rates of phenotypic evolution during speciation. Natural selection can spur trait changes under ecological speciation (Nosil Reference Nosil2012), as can sexual selection for traits related to mating preferences (Ritchie Reference Ritchie2007). Reduced population sizes in peripheral isolates and subsequent population expansion may also accelerate trait change (Slatkin Reference Slatkin1996). All these scenarios can result in pulses of elevated trait change associated with speciation. Another suggestion, proposed by Futuyma (Reference Futuyma1987, Reference Futuyma2010; see also Rosenblum et al. Reference Rosenblum, Sarver, Brown, Roches, Hardwick, Hether, Eastman, Pennell and Harmon2012; Futuyma Reference Futuyma, Serrelli and Gontier2015), is that speciation does not cause a pulse of morphological change but that the two nonetheless may be associated in the fossil record. Under this model, adaptive morphological change can occur at any time in a species’ lifetime in response to local ecological conditions, but these changes are usually ephemeral, erased by gene flow and population extirpation. Speciation, by shutting down gene exchange, gives these otherwise fleeting changes enough permanence to be detected in the fossil record. This ephemeral divergence model was received with enthusiasm by some paleontologists (Gould Reference Gould2002; Eldredge et al. Reference Eldredge, Thompson, Brakefield, Gavrilets, Jablonski, Jackson, Lenski, Lieberman, McPeek and Miller2005), although direct tests of this idea may be challenging to devise.
These scenarios predict pulses of trait change at speciation, but other plausible conditions allow for ample change without lineage splitting (Charlesworth et al. Reference Charlesworth, Lande and Slatkin1982; Kopp and Matuszewski Reference Kopp and Matuszewski2014). Species often experience strong directional selection in nature (Hereford et al. Reference Hereford, Hansen and Houle2004) and harbor enough standing genetic variation that the resulting evolutionary responses would be rapid and substantial (Hansen Reference Hansen, Svensson and Calsbeek2012; Hansen and Pélabon Reference Hansen and Pélabon2021). Indeed, large evolutionary changes are sometimes observed in living populations (Hendry and Kinnison Reference Hendry and Kinnison1999), which in part led to formulation of the paradox of stasis, as discussed earlier. Thus, while speciational pulses can plausibly occur, they are not required for substantial trait change.
The case for speciational pulses also had a process of elimination aspect that many paleontologists may have found appealing. If we only see stasis within lineages, when else could change occur other than between lineages? This argument would be strongest if we observed only narrowly fluctuating stasis when documenting changes within lineages. As we have seen, however, patterns other than stasis are very common, and some of them result in substantial evolutionary divergence in unbranched lineages (Fig. 1). Moreover, as anyone who has carefully studied a fauna knows, closely related species are often difficult to tell apart, which means that whatever evolutionary changes occur at speciation, they can be quite modest. Cryptic species (Struck et al. Reference Struck, Feder, Bendiksby, Birkeland, Cerca, Gusarov and Kistenich2018; Shin and Allmon Reference Shin and Allmon2023), of course, are the most extreme version of this phenomenon. Because changes within lineages are not always small, and because changes at speciation are not always large, resolving the nature of speciational pulses requires that we actually measure and compare them with anagenetic changes.
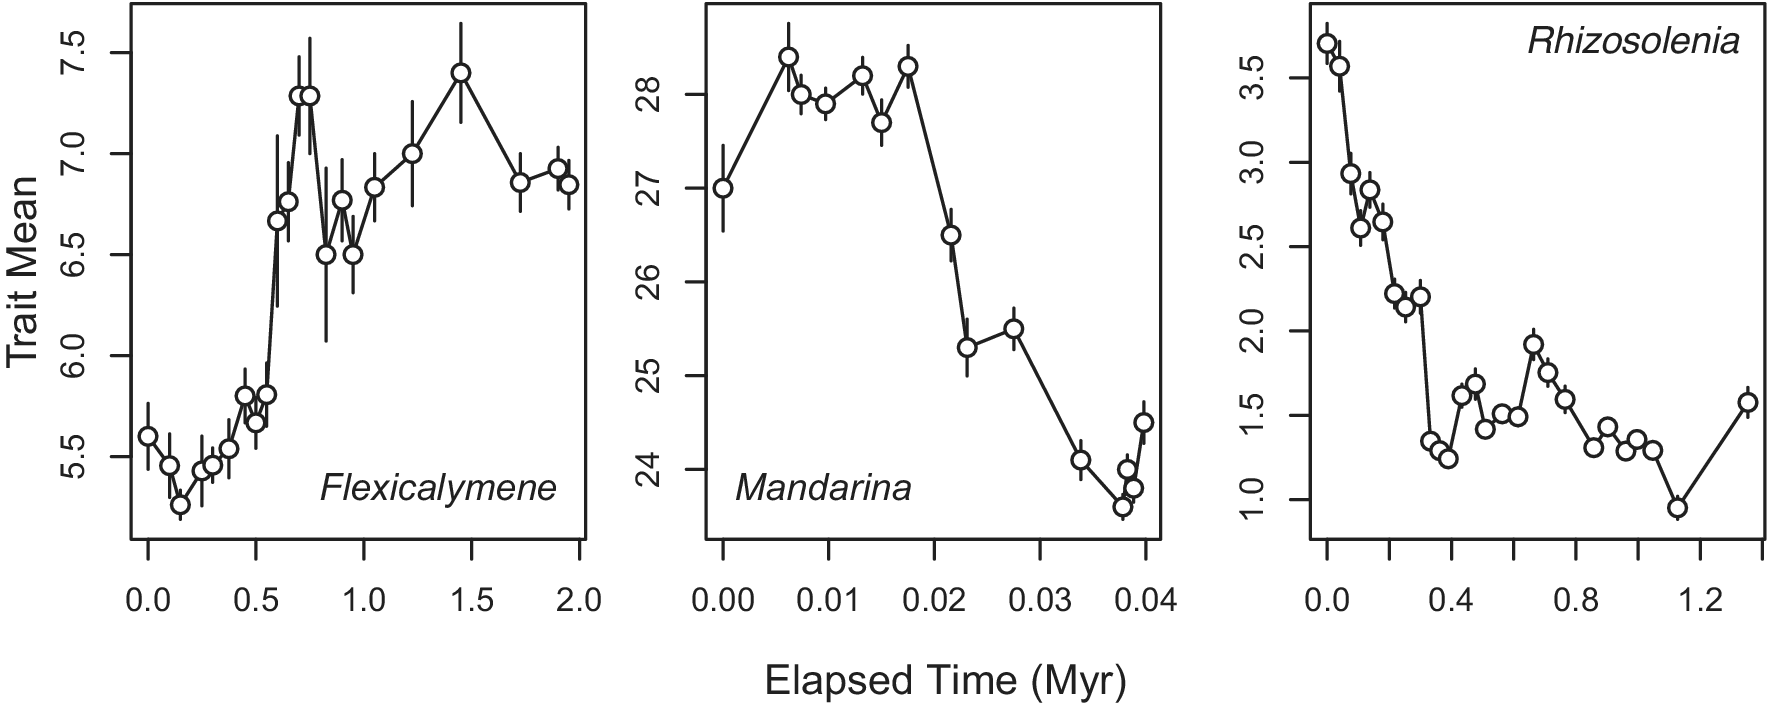
Figure 1. Examples of three paleontological time series that show substantial evolutionary change within unbranched, species-level lineages. Time is in units of millions of years (Myr) elapsed from the start of the sequence; error bars indicate 1 standard error of the mean. The three examples are, from left to right: number of axial rings in the pygidium in the trilobite Flexicalymene (Cisne et al. Reference Cisne, Chandlee, Rabe and Cohen1980); shell width in the land snail Mandarina (Chiba Reference Chiba1996); height of the hyaline area in the diatom Rhizosolenia praebergonii from DSDP 573 (Sorhannus et al. Reference Sorhannus, Fenster, Burckle and Hoffman1988).
Inferring Unobserved Speciational Pulses
Ideally, paleontologists could assess speciational pulses by sampling morphological changes through a cladogenetic event. Eldredge and Gould (Reference Eldredge, Gould and Schopf1972) considered speciation to be rapid—an event in the geological sense. Some mechanisms of speciation do proceed quite quickly compared with paleontological time resolutions (Coyne and Orr Reference Coyne and Orr2004; Hendry et al. Reference Hendry, Nosil and Rieseberg2007), but not all do so, and the reality may be complex (Norris and Hull Reference Norris and Hull2012; Dynesius and Jansson Reference Dynesius and Jansson2014; Etienne et al. Reference Etienne, Morlon and Lambert2014). Nevertheless, only a handful of paleontological studies have claimed to analyze trait evolution in detail as, or shortly after, a lineage splits (e.g., Gingerich Reference Gingerich1976; Kellogg Reference Kellogg1983; Lazarus Reference Lazarus1986; Sorhannus et al. Reference Sorhannus, Fenster, Burckle and Hoffman1988).
Thus, barring unusually protracted speciation captured by a fortuitous fossil window, the evidence used to assess speciational pulses will be indirect. The most important paleontological studies on this question were made by Alan Cheetham and colleagues on the bryozoan genus Metrarabdotos (Cheetham Reference Cheetham1986, Reference Cheetham1987; Jackson and Cheetham Reference Jackson and Cheetham1990; Cheetham et al. Reference Cheetham, Sanner and Jackson2007). These studies are widely seen as the best test of punctuated equilibrium because of their detailed stratigraphic and geographic sampling, careful delimitation of species, quantitative genetic analysis of traits, and demonstrated correspondence between genetic and morphological species. We would argue, however, that the most critical advance was that these studies integrated ancestor–descendant sequences into a phylogenetic framework, rather than analyzing them in isolation. This approach allowed Cheetham and colleagues to estimate changes within species and to compare them explicitly to the changes between species. Doing so indicated that Metrarabdotos showed only minor fluctuations within species and much larger differences between species, supporting the claim that speciation was associated with an extra burst of morphological change.
The status of Cheetham et al.’s conclusions is more clouded now, as a subsequent study (Voje et al. Reference Voje, Martino and Porto2020) revealed that the finding of speciational pulses depended on methodological decisions related to missing data and the combination of continuous and discretely measured traits in the same analysis (see that paper for details). Regardless of the outcome in this one case study, the approach of stitching ancestor–descendant sequences into a phylogenetic framework is clearly a promising one. It is therefore surprising to us that only a handful of subsequent studies have used this approach in the nearly 40 years since Cheetham first employed it (Polly Reference Polly, MacLeod and Forey2002; Pachut and Anstey Reference Pachut and Anstey2009; Hunt Reference Hunt2013).
We present a brief summary of one of these studies (Hunt Reference Hunt2013) to illustrate the potential—and the challenges—of this kind of study. Like Cheetham’s work, this one focused on a single genus, that of the deep-sea ostracode Poseidonamicus. This study characterized morphology through 10 geometric landmarks (Fig. 2A) that were largely independent of the features used to define species, avoiding the potential circularity of looking for speciational pulses in the same characters that were used to separate species in the first place (Levinton and Simon Reference Levinton and Simon1980). Fifty-one populations from 14 different species-level lineages were sampled (Fig. 2B). Visually, some of these species displayed little morphological change (e.g., P. rudis, P. miocenicus), whereas others experienced anagenetic changes comparable to the differences between closely related species (Fig. 2B). These data were fit to an evolutionary model, first proposed by Bokma (Reference Bokma2002), with anagenetic evolution within lineages that followed a random walk, plus an additional, instantaneous pulse of change that occurs at each speciation. A version of this model with stasis within lineages, rather than random walks, turned out to be better supported, and we focus on those results here.
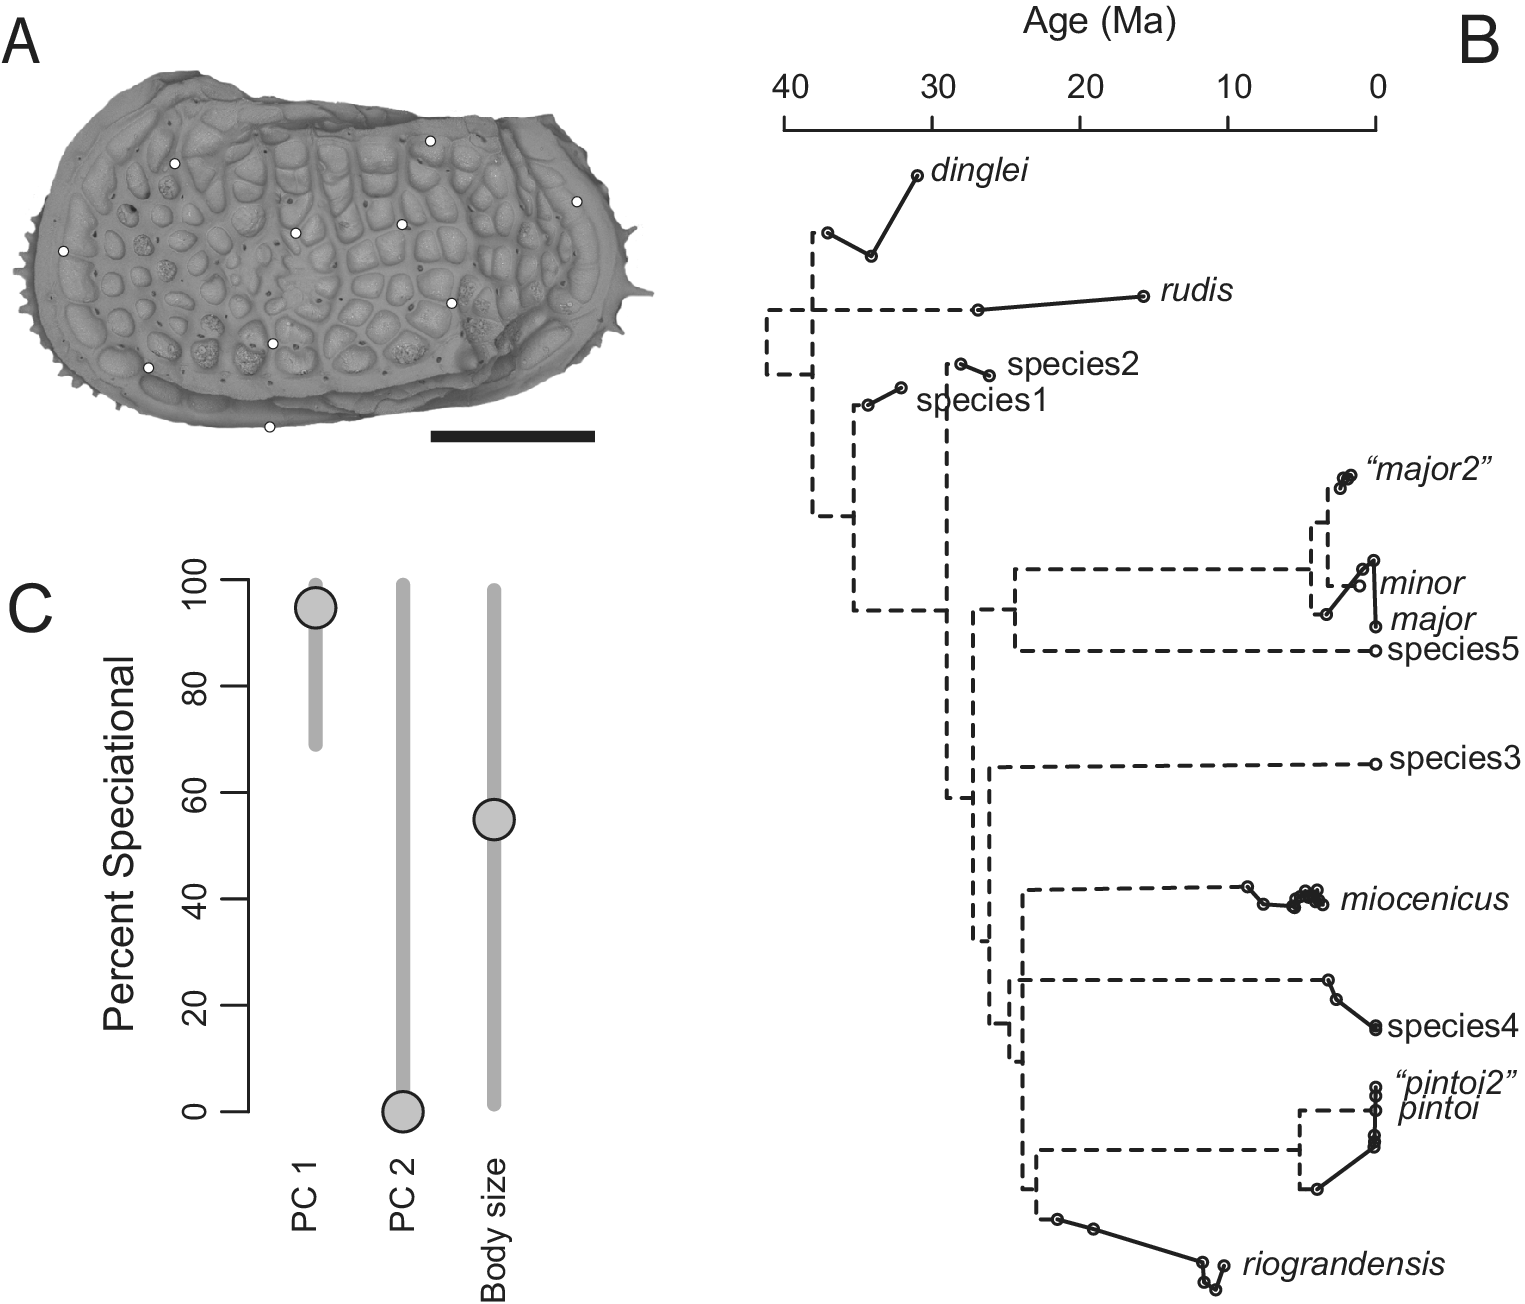
Figure 2. A, Representative of the ostracod genus Poseidonamicus with 10 landmarks used in morphological analysis; scale bar is 250 microns. B, Inferred phylogeny of the genus, with sampled anagenetic portions of the clade in solid lines. Population means are plotted vertically according to their mean scores on PC 1 and horizontally by their geological ages. C, Plot showing maximum-likelihood estimates (circles) and confidence intervals (vertical bars) for the proportion of evolutionary change in species attributable to speciational pulses. PC 1 and PC 2 accounted for 25% and 17% of the variation in the morphometric dataset, respectively. Body size was measured as log-transformed valve length.
The parameters of this model can be converted into a metric that summarizes the percent of total evolutionary change in a species that can be attributed to the speciational pulse at its origin. The best estimates for this metric differed by trait: PC 1’s estimate implies almost all change is speciational, whereas PC 2 shows the opposite pattern (Fig. 2C). Body size is intermediate, with nearly equal speciational and anagenetic contributions to evolutionary change. Except for PC 1, however, the confidence limits on these estimates are very broad, spanning solutions from near-zero to almost 100% speciational evolution (Fig. 2C). Thus, this dataset, even with its rather good phylogenetic and stratigraphic coverage, cannot discriminate speciational and anagenetic evolution for most traits.
The lack of similar paleontological studies makes it difficult to know how general these findings are. For extant species, there is a parallel literature in which the Bokma model or other tree-based approaches are used to infer speciational change (Mooers and Schluter Reference Mooers and Schluter1998; Pagel Reference Pagel1998; Ricklefs Reference Ricklefs2006; Bokma Reference Bokma2008; Mattila and Bokma Reference Mattila and Bokma2008; McPeek et al. Reference McPeek, Shen, Torrey and Farid2008; Ingram Reference Ingram2011; Ingram et al. Reference Ingram, Harrison, Mahler, Castaneda, Glor, Herrel, Stuart and Losos2016). Another strand of research tests for punctuated equilibrium more indirectly by looking for a correlation between lineage diversification rates and morphological divergence (e.g., Ricklefs Reference Ricklefs2004; Adams et al. Reference Adams, Berns, Kozak and Wiens2009; Rabosky et al. Reference Rabosky, Santini, Eastman, Smith, Sidlauskas, Chang and Alfaro2013), although this correlation can be positive even in the absence of speciational change (Rabosky Reference Rabosky2012). Some, but not all, of these studies find evidence for speciational evolution. Moreover, those studies that include confidence intervals often report that the data cannot well constrain the importance of speciational pulses (e.g., Mattila and Bokma Reference Mattila and Bokma2008; Ingram Reference Ingram2011; Ingram et al. Reference Ingram, Harrison, Mahler, Castaneda, Glor, Herrel, Stuart and Losos2016). This uncertainty may be unsurprising for modern studies, because they need to overcome the lack of data on within-species change with strong evolutionary assumptions (see Hunt Reference Hunt2013). But the Poseidonamicus case study shows that this uncertainty can persist even with good paleontological data constraining anagenetic evolution.
We conclude that punctuated equilibrium’s second core claim cannot yet be assessed with any degree of confidence (see also Rolland et al. Reference Rolland, Henao-Diaz, Doebeli, Germain, Harmon, Knowles and Liow2023). Limited fossil evidence, along with broader but less direct evidence from extant clades, indicates that pulses of morphological evolution associated with speciation occur. But the importance of these pulses compared with anagenetic change within lineages is still unresolved. Moreover, we foresee that this question will likely remain a challenging problem, because it faces inherent difficulties. Speciation is inferred indirectly, with uncertain timing, from an incomplete record of fossil occurrences. Models of morphological change are needed to convert morphological observations into parameters that are relevant for testing, but we do not know yet whether results will generally be robust across plausible models.
Furthermore, all these analytical sources of uncertainty are layered on top of the complexities of just recognizing the input units—species—in the fossil record (Allmon and Yacobucci Reference Allmon and Yacobucci2016). A long-standing criticism of punctuated equilibrium concerned its potential circularity: if species are defined on the basis of morphology, then rapid trait evolution will lead to new named species, and therefore a spurious association with “speciation” (Gingerich Reference Gingerich1976; Levinton and Simon Reference Levinton and Simon1980; see also Hopkins and Lidgard Reference Hopkins, Lidgard, Allmon and Yacobucci2016). Such a scenario is falsified when the putative ancestor persists beyond the origin of the descendant; thus, the stratigraphic configuration of species became an important line of evidence in these studies (Gould Reference Gould2002: p. 795). Recently developed phylogenetic methods incorporate stratigraphic data and are able to compare the support for hypotheses of anagenetic versus cladogenetic relationships among species (Wright et al. Reference Wright, Wagner and Wright2021). Although practical challenges remain, we are optimistic about future progress in this area.
Concluding Remarks
This special issue examines the legacy of a controversial paper. In our contribution, we have argued that punctuated equilibrium has two central claims. The first, that stasis dominates within-species evolution, has been subject to extensive empirical testing. Hundreds of compiled examples of trait evolution testify that stasis, although not dominant, is indeed common, and even when other patterns of change occur, magnitudes of trait divergence are often quite low. The second claim, that most morphological change is associated with lineage splitting, is inherently more difficult to test. Some paleontological and phylogenetic analyses suggest that speciational pulses can occur, but resolving their generality and importance awaits further theoretical, methodological, and empirical developments. Although not all the claims in Eldredge and Gould (Reference Eldredge, Gould and Schopf1972) are upheld today, all of us interested in understanding how morphological evolution operates within species owe this paper an enormous debt. Its insight and rhetoric provoked much of the empirical work that informs this subject today, while at the same time enriching the theoretical framework within which these data are interpreted.
Acknowledgments
We thank the conveners of the special GSA session associated with this special issue and are grateful for the opportunity to contribute to it. This paper benefited from thoughtful and knowledgeable reviews from S. Lidgard and an anonymous reviewer. Our ideas on this subject were shaped by discussions with many scientists over the years. In particular, we would like to acknowledge the insights of D. Jablonski, W. Allmon, S. Lidgard, M. Hopkins, T. Reitan, and T. Hansen, among others. K.L.V. was supported by an ERC-2020-STG (grant agreement 948465).
Competing Interests
The authors declare no competing interests.


 Open access