

Poor nutrition is a common problem among older adults with up to 40 % of older people living in the Australian community estimated to be malnourished or at risk of malnutrition(Reference Rist, Miles and Karimi1). Malnutrition risk and nutritional inadequacy in older adults are associated with a variety of factors including country of birth, socio-economic status, health status and oral health(Reference Iizaka, Tadaka and Sanada2–Reference de Andrade, de Franca Caldas and Kitoko6).
Oral health problems, such as loss of natural teeth, result in compromised dentition(Reference Wayler and Chauncey7). This can lead to older adults avoiding foods that are harder, stringier and more difficult to chew, instead opting for softer and nutritionally poorer food choices(Reference Akpata, Otoh and Enwonwu8,Reference Hildebrandt, Dominguez and Schork9) . It has also been shown that tooth loss is associated with poor consumption of foods like meat, nuts, dairy products, fruit and vegetables and suboptimal intakes of a range of micronutrients(Reference Marcenes, Steele and Sheiham5,Reference Akpata, Otoh and Enwonwu8,Reference Ervin and Dye10,Reference Joshipura, Willett and Douglass11) .
Prosthetic teeth are regularly used to replace missing teeth; however, there is evidence that prostheses, especially those that are poor fitting, are not functionally equivalent to natural teeth(Reference Ervin and Dye10,Reference Shinkai, Hatch and Rugh12) . Compared with intact natural teeth, people wearing partial or full prostheses have poorer consumption of fruit and vegetables, higher risk of malnutrition and are less likely to meet recommended nutrient intakes(Reference Ervin and Dye10,Reference Kikutani, Yoshida and Enoki13,Reference Sahyoun and Krall14) . Ervin et al. showed that, among older men with incomplete dentition (1–20 teeth), those with a mixture of natural and replaced teeth had lower intakes of vitamin C than those with only natural teeth(Reference Ervin and Dye15).
More recently, research has focused on the association between dietary intakes and posterior functional tooth units (FTU) in adults aged 60 years and older(Reference de Andrade, de Franca Caldas and Kitoko6,Reference de Andrade, Caldas Junior Ade and Kitoko16,Reference Iwasaki, Taylor and Manz17) . Due to their location and function, the loss of occluding pairs of molars and premolars is closely related to declines in masticatory ability(Reference Hildebrandt, Dominguez and Schork9,Reference Kwok, Yu and Hui18) . In particular, low vitamin A, riboflavin, Zn and folate(Reference de Andrade, de Franca Caldas and Kitoko6,Reference de Andrade, Caldas Junior Ade and Kitoko16–Reference Kwok, Yu and Hui18) . Sahyoun et al. found that those with full dentures had significantly lower Healthy Eating Index scores than those with five or more posterior pairs of teeth(Reference Sahyoun, Lin and Krall19). Another study found that older female adults with normal mini-nutritional assessment status had higher numbers of FTU (defined as posterior occluding pairs of teeth) of natural tooth against natural tooth compared with participants who were underweight(Reference Adiatman, Ueno and Ohnuki20).
While there has been a substantial body of research looking at the association between numbers of FTU and diet(Reference de Andrade, de Franca Caldas and Kitoko6,Reference de Andrade, Caldas Junior Ade and Kitoko16–Reference Adiatman, Ueno and Ohnuki20) , research into the association between the composition of teeth that make up FTU, independent of FTU numbers, and dietary intake of nutrients is limited. Therefore, the aim of this study was to examine the associations between the composition of FTU and nutrient intakes in community-dwelling older Australian men.
Methods
Study population
The Concord Health and Ageing in Men Project (CHAMP) is an ongoing longitudinal study, established in 2005, to investigate the health of men aged 70 years and older(Reference Cumming, Handelsman and Seibel21). Recruitment of subjects for the CHAMP study is described in detail elsewhere(Reference Cumming, Handelsman and Seibel21). Briefly, the subjects were selected from the NSW electoral roll for the geographical areas of Burwood, Canada Bay and Strathfield in Sydney(Reference Cumming, Handelsman and Seibel21). The only exclusion criterion was living in an aged care facility at the time of recruitment(Reference Cumming, Handelsman and Seibel21). Eligible men were sent a letter describing the study and, if they had a listed telephone number, were telephoned about 1 week later. Of the 2815 eligible men with whom contact was made, 1511 participated in the study (54 %). An additional 194 eligible men living in the study area heard about the study from friends or the local media and were recruited after contacting the study investigators prior to being identified through the electoral roll, yielding a total of 1705 subjects. Participants completed a self-administered questionnaire and attended a clinic at Concord Hospital that included an interview and clinical assessment at baseline, second wave (2-year follow-up) and third wave (5-year follow-up) of data collection. Collection of nutritional data, via a home visit, was added at the 3rd wave. For the fourth wave of data collection (8-year follow-up), men were seen predominantly in their homes. In addition to the self-completed questionnaire and some of the clinic assessments collected in previous waves, an oral health questionnaire and examination was conducted along with a diet history interview. The fourth wave of data collection occurred between August 2014 and July 2016.
Data collection
For this study, the fourth wave of CHAMP data collection was used. Data collection involved two home visits. The first, which collected general health and dietary information, was conducted by one of the three trained dietitians. The second visit, which included the oral health assessment, was conducted by one of the two trained oral health therapists using a standardised clinical protocol. A self-completed questionnaire, collecting socio-demographic, economic and health information, was sent to the participant’s home prior to the first visit. Of the original 1705 participants, 781 participated in the fourth wave of data collection. The main reasons for non-participation were death (72·4 %) or illness/age (10·1 %). Forty-six participants completed the self-administered questionnaire only, 735 completed the general health assessment, 718 completed the dietary assessment and 614 participants completed the dental examination. The men who participated in the oral health component were significantly younger and less likely to live alone than those who did not complete the oral health assessment. However, they did not differ significantly in income, marital status, post-school qualifications, country of birth, multi-morbidity and smoking status (data not shown).
Measurements
Oral health data collection
Participants were asked by interviewers about perceptions of pain, chewing ability and dental care. During the oral health examination, individual teeth were categorised as ‘present permanent tooth’, ‘implant’, ‘missing and replaced’, ‘missing and not replaced’, ‘root fragment decayed’ and ‘root fragment not decayed’. FTU were defined as opposing molars and premolars that were natural teeth or artificial (prosthetic teeth on implant-supported dentures, fixed bridge pontics and/or removable dentures)(Reference Ueno, Yanagisawa and Shinada22,Reference Wright, Chu and Milledge23) . FTU were counted according to the total number of FTU (defined as natural and prosthetic replacement molars and premolars, including implants) and the number of Natural FTU (defined as opposing natural molar and premolars only)(Reference Ueno, Yanagisawa and Shinada22,Reference Wright, Chu and Milledge23) . Root fragments were not counted as part of FTU. In total, there was a possible maximum score of twelve FTU(Reference Ueno, Yanagisawa and Shinada22,Reference Wright, Chu and Milledge23) . The four occluding pairs of molars (not including third molars) were given a score of two per pair, and the four occluding pairs of premolars were given a score of one per pair(Reference Ueno, Yanagisawa and Shinada22,Reference Wright, Chu and Milledge23) . Assessments also recorded whether the participant had partial or full maxillary and mandibular dentures, and if the dentures were likely to be defective – that is, non-retentive, not in occlusion, unstable or had any large defects.
Dietary assessment
Diet histories were administered using a standardised and validated interview method(Reference Waern, Cumming and Travison24). A structured questionnaire with open-ended questions, adapted from the Sydney South West Area Health Service outpatient diet history form, was the tool used by interviewers to ask participants about their usual dietary intake during the last 3 months. Food quantities were established by food models, photographs and household measures, such as measuring spoons(Reference Williams25). A checklist of over a dozen items at each meal was included to corroborate commonly consumed foods which may have been forgotten. Relatives, carers and/or family members of CHAMP men were encouraged to be present in the interview, to aid in participants’ memory recall. Validity of this method was established in a previous study in a sub-group of fifty-six CHAMP men, which compared the diet history with a 4-d weighed food record(Reference Waern, Cumming and Travison24). We used the interquartile range to identify potential outliers of energy intake(Reference Tukey26). Individual diet histories of potential outliers were examined and only one outlier was identified as having an unrealistic intake of food and excluded from the data set.
Data handling
Dietary records were converted to nutrient intakes using FoodWorks 7 Professional for Windows (Xyris Software (Australia) Pty Ltd), which uses the Australian Food, Supplement and Nutrient Database 2007 (AUSNUT 2007). This database has a maximum of thirty-seven nutrient values available for each of 4425 foods(27). Vitamin D values from AUSNUT 2007 need to be interpreted with caution due to the small set of analyses from which the values were obtained and the assumption that was made(28). A coding manual developed during the nutrition collection at the third wave of CHAMP data collection was updated and utilised at the fourth wave to define and standardise 1650 food items to ensure consistent coding of diet histories.
Dietary intake of nutrients
Participants’ median daily dietary intakes of energy, carbohydrates, sugar, protein, total fats, PUFA, dietary fibre, alcohol, Na, K, I, Fe, P, Ca, Mg, Zn, dietary folate equivalents, thiamin, niacin, riboflavin and vitamins A, C, D and E were compared with the respective nutrient reference value (NRV) recommendations for males aged 71 years and older(29). Vitamin B6 and Vitamin B12 were not analysed as these values are not available in AUSNUT 2007. Only Na, which is available naturally in foods and added during processing food products, was included in the analysis. Percentages of energy from carbohydrates, protein and fat were compared with the Acceptable Macronutrient Distribution Range, and protein intake/kg of body weight was calculated(29). Daily energy intakes were also compared with participants’ estimated energy requirements calculated using BMR (with a physical activity level of 1·6 for light activity).
Attainment of the NRV recommendations for total energy and six macronutrients (protein (g/kg of body weight), total fat (Acceptable Macronutrient Distribution Range), saturated fat (Acceptable Macronutrient Distribution Range), carbohydrate (Acceptable Macronutrient Distribution Range), long chain n-3 fatty acids and fibre) was summed for each participant(Reference Waern, Cumming and Blyth4). A dichotomised ‘macronutrient’ risk variable was created, where meeting the requirements for five or more nutrients was classed as ‘good’, and meeting the requirements for four or fewer nutrients was classed as ‘poor’(Reference Waern, Cumming and Blyth4). Attainment of the NRV recommendations for sixteen micronutrients (Na, K, I, P, Ca, Mg, Zn, Fe, dietary folate equivalents, thiamin, niacin, riboflavin and vitamins A, C, D and E) was also summed for each participant and a dichotomised ‘micronutrient’ risk variable was created(Reference Waern, Cumming and Blyth4,Reference Iwasaki, Taylor and Manz17) . Meeting the requirements for twelve or more nutrients was classed as ‘good’, and meeting the requirements for eleven or fewer nutrients was classed as ‘poor’(Reference Waern, Cumming and Blyth4,Reference Iwasaki, Taylor and Manz17) .
Composition of teeth and denture quality
The composition of teeth was categorised as natural only dentition, mixed dentition and prosthetic only dentition. Numbers of natural teeth were grouped (twenty-one or more teeth, eleven to twenty teeth, one to ten teeth and edentulous – no natural teeth). Denture quality was dichotomised as ‘good’ or ‘poor’. Dentures that were unstable, non-occlusive, non-retentive, presented with large defects or any combination of the four were classified as ‘poor’ quality. Participants were asked if they had difficulty chewing hard foods, and the responses were dichotomised as ‘Yes’ or ‘No’.
Functional tooth units composition and numbers
In addition to ‘Natural FTU’ and ‘Total FTU’, a separate ‘Replaced FTU’ variable was created, defined as the number of FTU where one or both teeth that compose the unit was prosthetic. Using these measures, participants were grouped according to the composition of their FTU. Group A had only ‘Natural FTU’, Group B had a mixture of ‘Natural FTU’ and ‘Replaced FTU’ and Group C had only ‘Replaced FTU’. As there was only a very small number without any FTU (n 28), these men were combined with participants in Group C. Participants were also grouped according to the number of FTU (irrespective of type of FTU): ‘12 FTU’, ‘7–11 FTU’, ‘1–6 FTU’ and ‘No FTU’. Again the ‘No FTU’ group was combined with the ‘1–6 FTU’ group.
Other measurements
Socio-demographic and economic measures, smoking, physical activity and health status were assessed by the self-completed questionnaire. Alcohol consumption and anthropometric measures were assessed during the first home visit.
Socio-demographic and economic measures
Men were asked their country of birth which enabled grouping into the categories of Australia/New Zealand, Greece/Italy and Other. Income was grouped into categories of ‘Age Pension Only’, ‘Age Pension and Other’ or ‘Other’ (superannuation or private income, own business/farm/partnership, wage or salary, repatriation pension, veteran’s pension, other or any possible combination of these options). Living arrangements were categorised as ‘Living alone’ or ‘Living with others’, marital status was dichotomised as ‘Married/Partner De facto’ or ‘Not Married’ and post-school qualifications were dichotomised as ‘Yes’ or ‘No’. Men were also asked about any limitations in access to food and food services, including Meals on Wheels.
Lifestyle factors
Smoking status was categorised into never smoker, ex-smoker or current smoker. Participants were categorised into ‘current non-drinkers’, ‘lifelong abstainers’ and ‘ex-drinkers’. For those who consumed at least twelve drinks in the past year, the frequency and quantity of alcohol consumption was assessed, enabling categorisation of drinkers as either ‘safe drinkers’ (1–21 drinks/week) or ‘harmful drinkers’ (>21 drinks/week)(30). Physical activity was measured using the Physical Activity Scale for the Elderly, a method that scores the level of physical activity in individuals aged 65 years or older(Reference Washburn, Smith and Jette31).
Anthropometric measurements
Height and weight were measured using standardised digital scales and portable stadiometer, and BMI was calculated as kg/m2 and categorised as ‘underweight’ (< 23), ‘normal weight’ (23–29·9) and ‘overweight/obese’ (30·0 or over)(32,Reference Winter, MacInnis and Wattanapenpaiboon33) .
Health status
Data on medical conditions were obtained from the self-administered questionnaire in which participants reported whether a doctor or a health care provider had told them that they had any of the following diseases: diabetes, thyroid dysfunction, osteoporosis, Paget’s disease, stroke, Parkinson’s disease, epilepsy, hypertension, heart attack, angina, congestive heart failure, intermittent claudication, chronic obstructive lung disease, liver disease, cancer (excluding non-melanoma skin cancers), osteoarthritis and gout. For the purposes of this study, comorbidity burden was defined as the presence of two or more of these conditions. Data on self-rated general health were obtained and dichotomised into excellent/good v. fair/poor/very poor. Self-rated oral health was also measured and dichotomised into excellent/very good/good v. fair/poor/don’t know.
Statistical analysis
All statistical analyses and calculations were completed using SAS On Demand for Academics (SAS Institute Inc.). Statistical analysis of distributions revealed that none of the nutrients analysed was normally distributed (Shapiro Wilk). Subjects’ characteristics and energy and nutrient intakes are reported as medians and 5th (P5) and 95th (P95) percentiles for numerical values, and percentages for categorical values. Evidence against null hypotheses was considered statistically significant if the P-value were less than 0·05.
Logistic regression models were used to examine the unadjusted associations between the dichotomous macronutrient and micronutrient risk variables and socio-demographic, economic, health and lifestyle factors. Associations between the nutrient risk variables and the two FTU variables (FTU composition and FTU number) were then further analysed via univariate and multivariate logistic regression, with a referent category of ‘Natural only’ for FTU composition and ‘FTU 12’ for FTU number. All logistic regression models controlled for age and energy intake (energy was excluded as a confounder if it was an outcome in the model). Other potential confounders, including BMI, birth country, income, smoking, Physical Activity Scale for the Elderly, comorbidity, alcohol intake, self-rated health and oral health, and post school qualifications, included in multivariate model analyses if P ≤ 0·25 in univariate analyses. Backwards-stepwise elimination was used to fit the final adjusted models. When the FTU composition or FTU numbers were the exposure variable, FTU numbers and FTU composition were controlled for respectively. Multivariate analysis using the backwards step analysis was also conducted between individual micronutrients and macronutrients, and the two FTU variables (FTU composition and FTU number). The Bonferroni method was used to account for multiple outcome measures. The goodness of fit of the final adjusted logistic regression model was assessed using the Hosmer–Lemeshow statistic.
Results
Participants’ characteristics
A total of 608 men completed both the dietary and oral health assessment. Mean age of these participants was 83·9 ± 4·1 years (age range 78–100) with 38 % over the age of 85 (Table 1). The majority of men were married or in de facto relationships (72 %), did not live alone (77 %), had an alternative income to the age pension (59 %) and were born in Australia (53 %) (Table 1). Mean BMI was 27·9 ± 4·2 kg/cm2 and 29 % were classified as overweight/obese (BMI ≥ 30·0). Nearly all the men did not currently smoke (97 %) and alcohol consumption was predominantly at a safe level (69 %) (Table 1). Oral examination revealed 14 % were completely edentulous, 28 % of men had a complete set of FTU. There was a similar proportion of men in the three ‘Number of FTU’ groups and in terms of FTU composition 32 % were classed as FTU Group A (Natural Only) (Table 1). Furthermore, 5 % of participants (n 33) had one or more implants.
Table 1 Characteristics and dentate status of the study population (n 608)

PASE, Physical Activity Scale for the Elderly; MOW, Meals on Wheels; FTU, functional tooth units.
* Superannuation or private income, own business/farm/partnership, wage or salary, repatriation pension, veterans pension or other.
† Group A: only ‘Natural FTU’, Group C: only ‘Replaced FTU’, Group B: mixture of ‘Natural FTU’ and ‘Replaced FTU’.
Individual nutrient intake and adequacy
The men’s median daily intake was 8767 kJ (P5 = 5529 kJ, P95 = 12 432 kJ). The majority of men in each of the three FTU composition categories did not meet their energy NRV requirements (Table 2). Mean and median percentage contribution of total and saturated fat was above the NRV recommendations for all FTU compositions, while the median percentage contribution of carbohydrate intake and median intakes of fibre were below the NRV across all categories (Table 2). For each FTU composition category, median intakes for the majority of micronutrients met NRV, except for vitamin D, vitamin E, Ca, K and Mg (Table 2). Furthermore, the majority of men in all FTU composition categories did not meet their NRV for these five micronutrients (Table 2). The association between individual nutrient intake and number of FTU can be found in online supplementary material, Supplemental Table 1.
Table 2 Median daily intake (and 5th/95th percentile) of energy and nutrients, proportion of participants (number and percentage) not meeting the recommended intake for each nutrient by FTU composition*
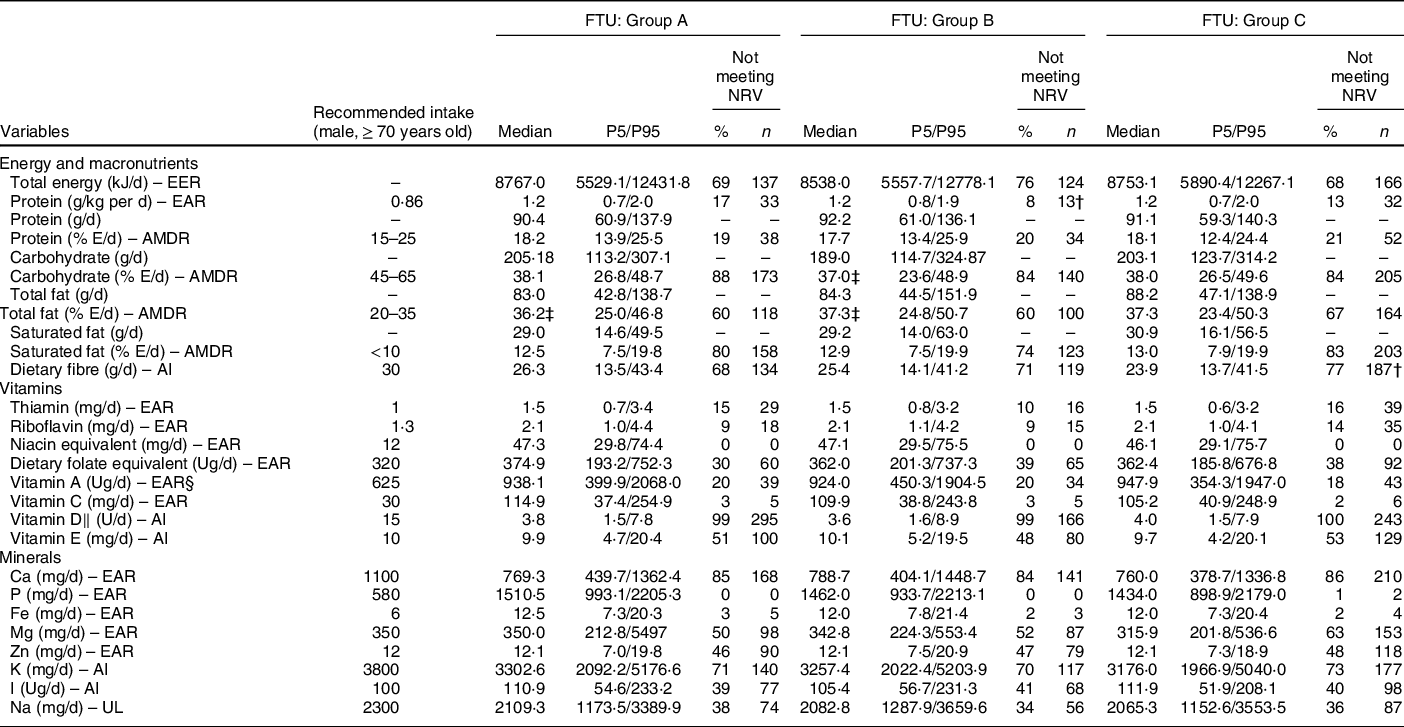
NRV, nutrient reference values; EER, estimated energy requirements; EAR, estimated average requirement; % E, percentage of energy contributed; AMDR, Acceptable Macronutrient Distribution Range; AI, adequate intake; ADG, adequate dietary guidelines; UL, upper level.
* Group A: only ‘Natural FTU’, Group C: only ‘Replaced FTU’, Group B: mixture of ‘Natural FTU’ and ‘Replaced FTU’.
† Statistically significant proportion not meeting recommended intakes, P-value < 0·025, adjusted using the Bonferroni method (reference category: FTU Natural Contacts Only).
‡ Mean used (Shapiro Wilke’s test satisfied).
§ Retinol equivalents.
‖ Vitamin D data should be interpreted with caution.
Univariate and multivariate analysis showed no statistically significant differences between number of FTU and individual macronutrient and micronutrient intake (online supplementary material, Supplemental Table 1).
Univariate analysis revealed that men in FTU Group C (No Natural FTU) were significantly more likely to have inadequate intakes of Mg and fibre, and men in FTU Group B (mixture of Natural and Replaced Only) were significantly more likely to meet required intakes of protein (g/kg of body weight) compared with men in FTU Group A (Natural only) (Table 2). After adjusting for confounders, FTU Group C remained significantly associated with inadequate intakes of fibre, and FTU Group B remained significantly associated with meeting required intakes of protein (g/kg of body weight; online supplementary material, Supplemental Tables 2, 3 and 4). Top food sources of protein were beef, whole cow’s milk and chicken.
Overall dietary intake and functional tooth units
Eighty-seven percentage of men (n 523) had poor macronutrient intakes, based on meeting the NRV recommendations of four or fewer macronutrients out of a possible seven. A total of 66 % (n 403) of participants had poor micronutrient intakes, based on meeting the NRV recommendations of eleven or fewer micronutrients out of a possible sixteen. In univariate analyses, FTU composition and numbers of natural teeth were significantly associated with micronutrient intake, while only FTU composition was significantly associated with macronutrient intake (Table 3). Denture quality and the self-reported ability to chew hard foods were not significantly associated in univariate analyses with either poor micronutrient or macronutrient intakes (Table 3).
Table 3 Univariate analysis of oral health variables and micronutrient and macronutrient intakes

FTU, functional tooth units.
* OR of meeting eleven or fewer recommended micronutrient intakes.
† OR of meeting four or fewer recommended macronutrient intakes.
‡ Statistically significant, P-value <0·05.
§ Group A: only ‘Natural FTU’, Group C: only ‘Replaced FTU’, Group B: mixture of ‘Natural FTU’ and ‘Replaced FTU’.
After multivariate adjustment, FTU Group C (No Natural FTU) was no longer significantly associated with poor micronutrient intake, meeting eleven or fewer micronutrient recommendations, although the association continued was close to statistical significance. However, multivariate analysis showed FTU Group C was significantly associated with poor macronutrient intake, meeting four or fewer macronutrient recommendation, compared with FTU Group A (Natural Only) (Table 4). Numbers of FTU were not significantly associated with poor intake of either micronutrients or macronutrients after adjusting for confounders (Table 4). A higher number of natural teeth remained statistically significantly associated with meeting micronutrient risk intake in multivariate analysis (data not shown).
Table 4 Multivariate logistic regression model of FTU composition and FTU number, and micronutrient (eleven or fewer) and macronutrient (four or fewer) risk variables

FTU, functional tooth units.
* OR of meeting eleven or fewer recommended micronutrient intakes.
† Adjusted for FTU numbers, age, energy, BMI, comorbidity and post-school education.
‡ OR of meeting four or fewer recommended macronutrient intakes.
§ Adjusted for FTU composition, age, BMI, PASE, birth country, living status and alcohol intake.
‖ Group A: only ‘Natural FTU’, Group C: only ‘Replaced FTU’, Group B: mixture of ‘Natural FTU’ and ‘Replaced FTU’.
¶ Adjusted for FTU numbers.
** Statistically significant, P-value <0·05.
†† Adjusted for FTU composition.
Discussion
In this epidemiological study, we found that among community-dwelling men aged 78 years and over living in Australia, those with No Natural FTU (FTU Group C) were more likely to have poor overall macronutrient than those who had only Natural FTU. Multivariate analysis showed no significant association between No Natural FTU and overall micronutrient intake, although it was close to statistical significance. There were also no significant associations between FTU numbers and overall intakes of either macronutrients or micronutrients.
Our results differ from those in a study of a group of Japanese older adults, aged 65–85 years, that compared intake of individual nutrients in participants who had retained at least one occluding pair of natural molars and those who had not(Reference Yoshida, Kikutani and Yoshikawa34). This study found significant differences between the two groups in individual intake of micronutrients and fibre, but not in the intake of macronutrients, possibly because they assessed intake of macronutrients individually, not the overall risk of meeting or not meeting all macronutrients(Reference Yoshida, Kikutani and Yoshikawa34). Furthermore, they did not examine the association of FTU composition and nutrient intake independently of FTU numbers(Reference Yoshida, Kikutani and Yoshikawa34). One explanation for inadequate consumption of macronutrients in men with FTU composed with No Natural FTU (FTU Group C) is difficulty with chewing. Chewing capacity with prosthetic teeth is not as effective as with natural teeth, which may lead to avoidance of foods considered difficult to chew, including crunchy and hard foods such as fruit and vegetables(Reference Hildebrandt, Dominguez and Schork9,Reference Naka, Anastassiadou and Pissiotis35) . It is also possible that the link between No Natural FTU and poor consumption of macronutrients and micronutrients may be due to overall poor denture quality, which can impact negatively on chewing ability(Reference Sahyoun and Krall14,Reference Marshall, Warren and Hand36) . Sayhoun et al. found that those who had ‘self-perceived’ poor denture quality had lower intake of fruits and vegetables, lower dietary quality scores and less variety in their diets(Reference Sahyoun and Krall14). However, in our study we did not find any association between the objective measurement of poor denture quality and inadequate dietary intake of nutrients, which agrees with a previous report by Shinkai et al. (Reference Shinkai, Hatch and Rugh12). Shinkai et al. measured denture quality by three technical criteria, retention, stability and tooth wear on posterior artificial teeth, and categorised denture quality as good, medium and poor(Reference Shinkai, Hatch and Rugh12). Their study found that energy, protein, vitamin A, vitamin C, folate, Fe and dietary fibre intakes were not significantly different across the three categories of denture quality(Reference Shinkai, Hatch and Rugh12).
Studies have also shown that people with prosthetic teeth have higher intakes of total fat, saturated fat and the percentage of energy from fat, compared to those with natural teeth(Reference Lee, Weyant and Corby37,Reference Moynihan, Butler and Thomason38) . Moynihan et al. found that those who had had their shortened dental arch replaced with partial dentures had a higher percentage of energy contributed from fat(Reference Moynihan, Butler and Thomason38). Another study showed that edentate older adults had significantly higher fat, saturated fat and percentage of energy from fat than dentate adults(Reference Lee, Weyant and Corby37). Higher intakes of fat and saturated fats in those with prosthetic teeth have been shown to be due to poorer masticatory ability(Reference Wayler and Chauncey7–Reference Hildebrandt, Dominguez and Schork9).
Our study did not find a relationship between having No Natural FTU and overall micronutrient intake. Previous studies on rehabilitation with prostheses have shown participants with dentures do not meet recommendations for fruit and vegetable intake, even if their perception of chewing ability increased(Reference Moynihan, Butler and Thomason38). Other studies examining the association between dentition and nutrient intakes have shown that denture wearers had poorer intakes of dietary fibre, fruit and vegetables, as well as nutrients associated with consumption of fruits and vegetables, such as carotenes and vitamin C(Reference Ervin and Dye10). De Marchi et al. found that edentulous participants (no natural teeth) and those who had at least one denture were at high risk of not meeting adequate vegetable and fruit intakes(Reference De Marchi, Hugo and Padilha39).
Interestingly, in our study, the number of FTU was not associated with poor macronutrient and micronutrient intakes, no individual intakes of nutrients. Previous studies have found an association between low FTU numbers and intake of individual nutrients(Reference de Andrade, de Franca Caldas and Kitoko6,Reference de Andrade, Caldas Junior Ade and Kitoko16–Reference Kwok, Yu and Hui18) . Our study defined FTU as opposing pairs of molars and premolars and categorised them into three ordinal levels: ‘12 FTU’, ‘7–11 FTU’ and ‘0–6 FTU’ regardless of their composition. Other studies used different methods of defining and categorising the numbers of FTU. Iwasaki et al. used the number of FTU and perceived denture fit as a measure of oral health status(Reference Iwasaki, Taylor and Manz17). They also formed a composite nutrient deficiencies variable, composed of macronutrients and micronutrients, where participants who were below the recommended intake of nine or more nutrients were classified as nutritionally at risk(Reference Iwasaki, Taylor and Manz17). The study also reported no association between oral health status and risk of nutrient deficiencies after adjusting for confounders(Reference Iwasaki, Taylor and Manz17). One study used a definition of occlusion much closer to our study, where they defined one FTU as a ‘single posterior occluding pair of teeth’ made up of natural or pontics of fixed bridges(Reference de Andrade, de Franca Caldas and Kitoko6). They found that participants with no posterior occluding pairs were more likely to have inadequate intakes of Ca, Fe and P, compared to participants with one or more posterior occluding pairs(Reference de Andrade, de Franca Caldas and Kitoko6). Kwok et al. defined FTU as one opposing pair of natural or denture teeth, with a possible maximum total of sixteen pairs of FTU(Reference Kwok, Yu and Hui18). Their study found that five or fewer FTU were associated with lower intakes of fibre, but no other individual macronutrient or micronutrients(Reference Kwok, Yu and Hui18).
The differences in results between studies are likely due to the differences in definition or categorisation of FTU, or the differences in measuring nutrient outcomes. While most studies defined the absence of natural FTU as no FTU present at all or replacement by full dentures, our study defined natural FTU absence as all FTU having one or both teeth replaced by prosthesis. This definition allowed for better determination of the impact that replacing FTU with prosthesis has on nutrient intake in older adults, independent of their number. Our study did find that the total number of natural teeth was related to micronutrient intake, even after adjusting for confounders. Participants with no natural teeth were more likely to have poor overall intake of micronutrients compared to those with twenty-one or more natural teeth. This is consistent with previous research on numbers of natural teeth and diet(Reference Ervin and Dye10,Reference Joshipura, Willett and Douglass11,Reference Iwasaki, Taylor and Manz17) .
One of the strengths of our study was that we used a validated diet history method administered by trained dietitians to collect dietary and subsequently nutritional information(Reference Waern, Cumming and Travison24). This particular method was not burdensome for participants, or subject to poor short-term memory recall, was more interactive and was not limited in the responses or information that could be provided(Reference Waern, Cumming and Travison24,Reference Gibson40,Reference van Staveren, Burema and Livingstone41) . Diet histories that consider dietary intake over long periods of time are more suited for older adults as their dietary intake is typically more consistent over long periods of time(Reference Waern, Cumming and Travison24,Reference Hankin42–Reference McNeill, Winter and Jia44) . However, all measures of nutrient intakes are only estimates, and the results for vitamin D in particular (see the ‘Methods’ section) should be interpreted with caution(28). The oral health assessments were conducted by calibrated professionals, providing objective clinical measures on numbers of teeth, FTU, presence of dentures and denture quality. This is a similar standard to those of other epidemiological studies on oral health.
There are some limitations to our study. First, difficulty in chewing hard foods was assessed using a self-completed questionnaire and participants’ self-report of perceived chewing difficulty of hard foods may be different from their actual chewing ability. This limitation may also extend to the self-reported nature of the diet history. Second, our study had a cross-sectional design; therefore, causal relationships cannot be established. It is possible that inadequate nutrition leads to tooth loss, rather than poor oral health leading to inadequate nutrition(Reference Adegboye, Fiehn and Twetman45). Third, the generalisability of our results to other populations, such as community-dwelling older women or institutionalised populations, is not clear. Fourth, we lacked detail information around the dose and frequency of dietary supplements, as such this was not included in the analysis. Another limitation is the likelihood of finding one statistically significant outcome due to multiple outcome measures. Online supplementary material, Supplemental Tables 2, 3 and 4 also provide the Bonferroni statistic to assess significance to mitigate this problem. Finally, prosthetic tooth replacement was not differentiated from replaceable or fixed prosthetics, like implants. Previous literature has shown that implant treatment has a positive impact on mastication and bite force, and therefore is likely to have limited impact on dietary intakes(Reference Van Der Bilt46). However, the percentage of participants with implants was very small in our study, the majority of these participants had No natural FTU (Group C) and the implants were not necessarily replacing premolars and molars.
In conclusion, this study suggests that maintaining posterior natural teeth in occlusion is needed for overall optimal dietary intake of macronutrients, but not micronutrients. This study also suggests that older people who have no natural posterior teeth in occlusion may be at risk of nutritional deficiencies. This suggests that dental health care providers should consider collaborating with dietitians to provide nutritional care and that dietitians should consider oral health as a risk factor when assessing nutrition in older adults. This was a cross-sectional study and so the direction of observed relationships is unclear; prospective investigation into the impacts of FTU composition on nutrition needs to be done. Additionally, the impact of the type of prosthetic replacement for FTU on dietary intake of nutrients should be investigated.
Acknowledgements
Acknowledgements: The authors thank all the staff and the participants of the study. Financial support: Kate Milledge, Prof. Cumming, Prof. Wright, Prof. Naganathan, Prof. Blyth, Prof. Le Couteur, Dr. Waite, Prof. Handelsman and A/Prof. Hirani report grants from The Australia National Health and Medical Research Council (project grant number 301916), during the conduct of the study; Kate Milledge. Conflict of interests: The authors declare they have no other conflicts of interest. Authorship: K.M. contributed to data acquisition, analysis and interpretation, drafted and critically reviewed the manuscript. V.H., R.G.C. and F.A.C.W. contributed to conception, design, analysis and interpretation, and critically reviewed the manuscript. V.N., F.M.B., D.G.L.C., L.M.W. and D.J.H. contributed to conception, design and critically reviewed the manuscript. Ethics of human subject participation: This study was conducted according to the principles in the National Statement on Ethical Conduct in Human Research 2007. The study was approved by the Sydney South West Area Health Service Human Research Ethics Committee, Concord Repatriation General Hospital, Sydney, Australia. All participants gave written informed consent.
Supplementary material
For supplementary material accompanying this paper visit https://doi.org/10.1017/S1368980021003566


