





Non-technical Summary
Sauropodomorphs were the biggest land animals to ever live. Earlier studies based on bones and computer models suggested that their front feet became rounder and relatively larger as they evolved. To test this idea more thoroughly, our study looked at fossilized footprints, which can provide a much larger sample size. We analyzed sauropodomorph trackways from different time periods, ranging from the Early Jurassic to the Late Cretaceous, to see how the shapes of the front and back feet changed over time and with body size. We introduced a novel method in dinosaur ichnology for quantitatively describing the shape of footprints. The results showed that the front feet changed shape and size over time; they became longer in the fore-back orientation and relatively bigger compared with the back feet, which stayed mostly the same. The front feet became rounder but not relatively larger in larger individuals. This suggests that rounder front feet were an adaptation to large body size, while the trend toward relatively bigger front feet reflects the spread of groups that possessed larger front feet.
Introduction
Sauropodomorph dinosaurs are the largest terrestrial animals that ever existed on Earth (Sander and Clauss Reference Sander and Clauss2008) and inhabited from the Late Triassic to the end of Cretaceous, globally. Their body weights were an order of magnitude larger than those of any other terrestrial taxonomic group (Sander et al. Reference Sander, Christian, Clauss, Fechner, Gee, Griebeler, Gunga, Hummel, Mallison and Perry2011), highlighting how large size constrained their ecology, particularly in locomotion (Sellers et al. Reference Sellers, Margetts, Coria and Manning2013). Among sauropodomorphs, the shape of the limbs changed significantly during their evolution (Bonnan Reference Bonnan2003; Fig. 1); the manus (forefoot) morphology especially showed drastic changes over time. Sauropodomorphs have a unique manus in which five metacarpals form an arc in proximal view (McIntosh Reference McIntosh, Weishampel, Dodson and Osmólska1990; Upchurch Reference Upchurch1994, Reference Upchurch1995, Reference Upchurch1998; Wilson and Sereno Reference Wilson and Sereno1998). In derived sauropods, including Macronaria and Titanosauria, an increase in the curvature of this manus arc and more columnar alignment of the metacarpals compared with more basal groups occurred, along with reduction or disappearance of the phalanges (Galton Reference Galton, Weishampel, Dodson and Osmólska1990; Bonnan Reference Bonnan2003; Fig. 1). These morphological changes had been described as a graviportal adaptation to their extremely large body size (Christiansen Reference Christiansen1997).
Phylogenetic diagram of representative sauropodomorphs with the proximal view of their articulated metacarpals (right metacarpals; modified from Bonnan Reference Bonnan2003). A, Saurischia, B, Sauropodomorpha, C, Sauropoda, D, Eusauropoda, E, Neosauropoda, F, Diplodocoidea, G, Macronaria, H, Titanosauria.

Figure 1. Long description
A left-to-right phylogenetic tree with seven terminal taxa, each topped by a proximal view outline of articulated right metacarpals. From left to right, taxa are Herrerasaurus, Massospondylus, Omeisaurus, Apatosaurus, Brachiosaurus, Opisthocoelicaudia. The tree starts at the lower left with node A, then branches upward and rightward. Node B splits off Massospondylus, node C splits off Omeisaurus, node D splits off Apatosaurus, node E splits off Brachiosaurus, node F splits off Apatosaurus and Brachiosaurus from Omeisaurus, node G splits off Opisthocoelicaudia, and node H is the terminal branch for Opisthocoelicaudia. A double-headed arrow below the tree indicates medial to lateral orientation. Each metacarpal outline above the taxa shows differences in bone arrangement and articulation.
These changes in the sauropodomorph manus arc can be assessed from temporal morphological changes in sauropodomorph manus prints. The usage of ichnofossils has advantages, because complete manus and pes skeletons of sauropodomorphs are scarce (Jannel et al. Reference Jannel, Salisbury and Panagiotopoulou2022), whereas trackway of sauropodomorphs exist in greater abundance (Wilson Reference Wilson, Curry-Rogers and Wilson2005). Moreover, sauropodomorph tracks record the shape of the manus, including the soft tissue pads beneath the metacarpals (Bell et al. Reference Bell, Woodruff, Nguyen, Mainbayar and Currie2025), whereas reconstruction of the metacarpal alignments can vary between researchers (Bonnan Reference Bonnan2003: fig. 11). For these reasons, the importance of integrating ichnofossil and body fossil data was already emphasized in the study of sauropod evolution (Wilson Reference Wilson, Curry-Rogers and Wilson2005), although ichnofossils have limitations in the coarse taxonomic identification of their trackmakers (Avanzini et al. Reference Avanzini, Leonardi and Mietto2003; Tomaselli et al. Reference Tomaselli, Ortiz-David, González-Riga, Coria, Mercado, Guerra and Sánchez-Tiviroli2022). However, with the exception of Castanera et al. (Reference Castanera, Santos, Piñuela, Pascual, Vila, Canudo, Moratalla, Falkingham, Marty and Richter2016), which clarified temporal changes in foot morphology based on sauropodomorph tracks from the Iberian Peninsula, there have been very few attempts to trace temporal changes in sauropodomorph foot morphology and locomotion from trackways. Because Castanera et al. (Reference Castanera, Santos, Piñuela, Pascual, Vila, Canudo, Moratalla, Falkingham, Marty and Richter2016) used only tracks from the Iberian Peninsula, it remains unclear whether the detected changes represent a global phenomenon.
Another possible sauropodomorph graviportal adaptation that can be assessed using the ichnofossil evidence is the cranial shift of their center of mass that occurred along their lineages (Henderson Reference Henderson2006; Bates et al. Reference Bates, Mannion, Falkingham, Brusatte, Hutchinson, Otero, Sellers, Sullivan, Stevens and Allen2016). The correspondence between the relative areas of manus and pes prints and relative weight borne by the forefeet and hindfeet was found by trackway-producing sauropod computer models (Henderson Reference Henderson2006). If these inferences are held, it is straightforward to test the cranial shift of the center of mass in sauropodomorphs through analyzing temporal change of manus-to-pes area ratio in sauropodomorph trackways. However, the relative size of manus to pes is only partially used in ichnotaxonomy, with little attention to its temporal changes. Lockley et al. (Reference Lockley, Farlow and Meyer1994) assigned a sauropod trackway from the Late Jurassic to a new ichnogenus Parabrontopodus. According to this study, one of the diagnoses of this ichnogenus is a smaller manus–pes ratio (heteropody) compared with the geologically younger ichnogenus Brontopodus, which is from the Cretaceous. Falkingham et al. (Reference Falkingham, Bates and Mannion2012) focused on the ratio of manus-only trackways and pes-only trackways of sauropods and tested how this ratio differs between the Jurassic and the Cretaceous and between cohesive and non-cohesive substrates. Along with Mannion and Upchurch (Reference Mannion and Upchurch2010), they found the correlation between trackway type and substrate type, but they could not detect any temporal change, possibly due to the small sample size and qualitative nature of the data. Furthermore, it has not yet been tested from trackways whether the ratio of manus to pes areas (the heteropody index) changes with body size to judge whether a relatively large manus represents an adaptation to gigantism.
For sauropodomorphs, which developed sole pads, separation of the digits is not as evident as in other dinosaurian clades, and quantitative comparisons of footprint morphology are often difficult. In this study, we aimed to compare the shapes of as many sauropodomorph tracks as possible to document temporal changes in sauropodomorph foot morphology. To maximize the sample size, we used the length and width of footprints: simple measurements that can be applied to most sauropodomorph trackways and serve as the line of evidence of their evolution independent of inferences based on body fossils. At the same time, to overcome the current analytical limitation, this study also used elliptic Fourier analysis to quantitatively describe the shape of footprints when anatomical features were sufficiently preserved to allow its application.
Elliptic Fourier descriptors (EFDs; Kuhl and Giardina Reference Kuhl and Giardina1982) can numerically express any shape with a close two-dimensional contour and have been used for quantification of plants or animal organ shapes in which homologous anatomical landmarks could not be easily assigned among individuals or species (Diaz et al. Reference Diaz, Zuccarelli, Pelligra and Ghiani1989; Iwata et al. Reference Iwata, Niikura, Matsuura, Takano and Ukai1998, Reference Iwata, Nesumi, Ninomiya, Takano and Ukai2002). This is also the case for sauropodomorph footprints that are without a clear division of digits, making the application of geometric morphometric methods difficult. However, EFDs allow the contour to be analyzed, enabling an objective evaluation of footprint shapes. Therefore, an analysis using EFDs and principal component analysis (PCA) would be ideal for the quantitative comparison of the sauropodomorph footprints. However, there is only one example of EFDs being used in footprint studies of extinct animals, in which the method was applied to the hoof impressions of Cenozoic mammals (Hsieh and Uchman Reference Hsieh and Uchman2022), and EFDs have never been applied to dinosaur footprints. In this study, morphological variations within Sauropodomorpha manus and pes prints were summarized using EFDs. Then, EFD-derived parameters were analyzed to assess temporal and allometric trends in footprint shape.
The purpose of this paper is to test two hypotheses of sauropod manus and pes evolution derived from osteological data and digital 3D models. The first posits that neosauropod evolution involved increased curvature of the manus arc and a more columnar alignment of the metacarpals (Galton Reference Galton, Weishampel, Dodson and Osmólska1990; Bonnan Reference Bonnan2003). If these changes are reflected in footprints, we expect to observe a statistically significant increase in relative anteroposterior length in manus prints following the emergence of the Neosauropoda as visually observed in Castanera et al. (Reference Castanera, Santos, Piñuela, Pascual, Vila, Canudo, Moratalla, Falkingham, Marty and Richter2016) and Wright (Reference Wright, Curry-Rogers and Wilson2005). Additionally, EFDs would show a temporal trend toward a more circular and horseshoe-shaped manus. The second hypothesis, based on digital 3D models suggesting a cranial shift in the center of mass during sauropodomorph evolution (Henderson Reference Henderson2006; Bates et al. Reference Bates, Mannion, Falkingham, Brusatte, Hutchinson, Otero, Sellers, Sullivan, Stevens and Allen2016), predicts a temporal increase in the manus-to-pes area ratio. The abundance of trackway data further allows us to evaluate whether these morphological changes––specifically the shift toward a more circular manus and an increase in manus size relative to the pes––are associated with increasing body size. If such correlations are observed, they would support the interpretation of these features as graviportal adaptations.
Materials and Methods
Analysis Using the Footprint Length and Width
Trackway Data Collection
A literature survey was conducted to collect sauropodomorph trackway data. The procedure was as follows: (1) Papers on dinosaur footprints were searched for using keywords such as “dinosaur”, “trackway”, or “footprints” in literature databases, Google Scholar, and Web of Science. Additionally, we collected papers that cited these papers or were referenced in them. (2) From these collected papers, we selected the trackways with trackmakers assigned to sauropodomorphs. (3) Among the selected trackways, those that included three or more consecutive manus and pes footprints were recorded for analysis.
As a result, data were collected from 171 papers that described 690 sauropodomorph trackways recovered from 198 tracksites (i.e., geological sites that yield fossilized trackways). These tracksites are distributed in North America (number of tracksites, N = 6), South America (N = 7), Asia (N = 127), Europe (N = 36), Africa (N = 22), and Australia (N = 1). The papers used in the analyses are summarized in the reference list in Supplementary Table S1. Their geological ages range from the Lower Jurassic to the Upper Cretaceous and are divided into the five epochs in chronological order, from oldest to youngest: Lower Jurassic (trackway and tracksite sample sizes, N = 34 and 13, respectively), Middle Jurassic (N = 56 and 19), Upper Jurassic (N = 199 and 30), Lower Cretaceous (N = 170 and 49), and Upper Cretaceous (N = 206 and 87).
Measurements of Footprints Used for the Analysis
In this study, footprint length (hereafter referred to as FL) and footprint width (FW) for both pes and manus were used FL and FW were measured in centimeters). FL represents the length of the anteroposterior diameter of the footprints, while FW represents the mediolateral diameter (Thulborn Reference Thulborn1990). Measurements were directly taken from the literature where they were originally measured and described. Footprint areas were approximated as: area = FL × FW. (Gonzalez Riga and Calvo Reference Gonzalez Riga and Calvo2009). Following Xing et al. (Reference Xing, Marty, Wang, Lockley, Chen, Xu, Liu, Kuang, Zhang and Ran2015), the aspect ratio of the footprints is calculated as FL/FW. This index may be a good criterion for quantification of metacarpal arrangement of Sauropodomorpha (Castanera et al. Reference Castanera, Santos, Piñuela, Pascual, Vila, Canudo, Moratalla, Falkingham, Marty and Richter2016). In addition, the heteropody index (Marty Reference Marty2008), the relative footprint area of the manus compared with that of the pes (Strickson Reference Strickson2022) was calculated as: heteropody index = footprint area (FL × FW) of manus/footprint area of pes. Regarding the footprint area, Romilio (Reference Romilio2025) noted that the footprint area estimation method employed in this study––multiplying footprint length (FL) by footprint width (FW)––tends to overestimate the true surface area. Although this limitation is valid, its impact on the current analysis is minimal, as the study focuses on the relative manus area (manus area/pes area), for which systematic bias is considerably reduced (see Romilio Reference Romilio2025: fig. 2). While the limitations of using simple footprint measurements have been noted (Romilio Reference Romilio2025), their use here was necessary to maximize sample size, given that many studies report only basic dimensional values. Furthermore, as shown later, we used EFDs to quantitatively evaluate and analyze footprint shapes when their outlines were available.
Analytical process of the elliptic Fourier analysis. The processes in the dotted-line box are conducted using SHAPE software (Iwata and Ukai Reference Iwata and Ukai2002). PCA, principal component analysis.

Figure 2. Long description
Starting at the left, a box labeled Footprint Images (Using sketch) contains a line drawing of an irregular footprint. A rightward arrow leads to Extracting the contour, with a filled black footprint shape below. Another rightward arrow points to Quantitative Description of the contour. Below this, a downward arrow labeled P C A leads to Extract the principal components. The processes from extracting the contour to extracting the principal components are enclosed in a dotted-line box labeled S H A P E Software. The arrow between extracting the contour and quantitative description is labeled Elliptic Fourier Analysis.
Statistical Analyses
Because the sample sizes were uneven across the tracksites, mean values for each tracksite were used in the following analyses. This procedure could minimize the risk of pseudo-replication, although it resulted in a reduction of the sample size, that is, N = 690 for trackways and N = 198 for tracksites.
Chronological changes in (1) aspect ratio (FL/FW) of manus and pes and (2) heteropody index were tested. Steel-Dwass tests (nonparametric multiple comparisons of groups) were conducted to determine whether these indexes changed across geological epochs. A Spearman’s rank correlation test was also conducted treating the geological epoch as an ordinal variable to detect temporal change. All data used in the statistical analyses are provided in Supplementary Table S1. Statistical tests were carried out using the software JMP Pro v. 18.0 (SAS Institute Inc., Cary, NC, USA).
Elliptic Fourier Analysis
Analyzed Footprints and Image Processing
In this study, sketches of 42 manus and 58 pedes were selected from sauropodomorph footprints dating from the Lower Jurassic to the Upper Cretaceous, collected from tracksites worldwide. As the fine morphological features were poorly preserved in most footprints, the selection criterion was that the contour was sufficiently preserved to allow the details to be distinguished. When footprints of the left pes or manus were well preserved, they were mirrored to match the corresponding right foot. Consequently, all analyzed images have the contour shapes of right feet. All images were taken from the sketch in the descriptive papers (N = 56) of footprint fossils (Supplementary Table S2, Supplementary Zip File S3). The sample size of each geological epoch is shown in Table 1, separately for manus and pes.
Sample size of the elliptic Fourier analysis for each epoch.

Table 1. Long description
The table has three columns: Epoch, Manus, and Pes. From top to bottom, the rows are: Lower Jurassic with Manus 5 and Pes 7, Middle Jurassic with Manus 5 and Pes 9, Upper Jurassic with Manus 10 and Pes 14, Lower Cretaceous with Manus 16 and Pes 17, and Upper Cretaceous with Manus 6 and Pes 11. Each row aligns the epoch name on the left, followed by the corresponding sample sizes for Manus and Pes to the right.
All images of footprints were converted to monochrome, then footprints were filled with black, saved in BMP format, and used for elliptic Fourier analysis. All image processing was done using the Paint application, which is the default software set in Windows 10.
Elliptic Fourier Analysis
An overview of analytical scheme is presented in Figure 2. First, a quantitative description of the footprint shapes was conducted using the SHAPE program package (Iwata and Ukai Reference Iwata and Ukai2002). To extract the footprints contours from the digital image of the footprint sketches, elliptic Fourier descriptors (EFDs) were used. In the derivation of EFDs, the x- and y-coordinates of the footprint contour are considered as periodic functions of the contour’s arc length (t), and mathematically obtained by expanding them in a Fourier series as follows (Iwata et al. Reference Iwata, Niikura, Matsuura, Takano and Ukai1998):


where T is the period, and n is the harmonic number.
The obtained Fourier coefficients (an, bn, cn, dn) were further standardized to ensure invariance due to size, direction, and starting point of contour. The larger harmonic number (N) gives the better fit of the result to the shape of footprint contours. In this analysis, the value of harmonic number was set at 20 (the default value of the SHAPE program package). It yielded the standardized EFDs containing 80 Fourier coefficients. To summarize the information contained in EFDs, PCA of EFDs was conducted. Each dataset that contains 80 parameters was transformed by PCA so that most variations within these 80 parameters can be expressed using a few principal components (PCs). Individual PC scores were saved for each footprint (Supplementary Table S2). A series of analyses from image processing to the calculation of PC scores were performed using the SHAPE software.
Statistical Analyses
Statistical analyses using PC 1 and PC 2 scores were conducted to clarify whether the morphology of the footprints changed over time. The Steel-Dwass test was conducted to determine whether each PC 1 and PC 2 varied among geological epochs. Additionally, Spearman’s rank correlation tests were conducted to reveal the relationship between PCs and the geological epoch as an ordinal variable. All statistical tests were conducted using the software JMP Pro v. 18.0.
Statistical Analyses to Detect Body-Size Effects
The relationship between footprint shapes and body size was tested as follows. Maher et al. (Reference Maher, Burin, Cox, Maddox, Maidment, Cooper, Schachner and Bates2022) demonstrated that in quadrupedal animals, body size and pes length increase in correlation. Therefore, the pes length is good index of the body size, and we used the mean pes length of each trackway as the body size index. Regression analyses were conducted using pes length as the independent variable and PC 1 and PC 2 scores obtained by elliptic Fourier analysis as the dependent variables. To test the allometric relationship between pes and manus areas, a regression analysis was conducted using pes area as the independent variable and manus area as the dependent variable. All statistical tests were carried out using the software JMP Pro v. 18.0.
Results
Analysis Using the Trackway Dataset
Footprint Aspect Ratio (FL/FW)
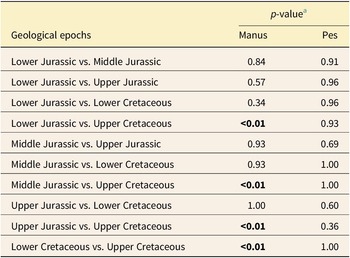
Throughout the Jurassic and Cretaceous, aspect ratio of manus footprints ranged from 0.40 to 1.93 (Fig. 3). Median value increased drastically in the Upper Cretaceous (Lower Jurassic: 0.63; Middle Jurassic: 0.67; Upper Jurassic: 0.68; Lower Cretaceous: 0.69; Upper Cretaceous: 1.30). The Steel-Dwass test showed that the aspect ratio of the manus was bigger in the Upper Cretaceous than in all other epochs (all p < 0.001; Table 2). No significant difference was found among other pairs of geological epochs. The Spearman’s rank correlation test revealed a significant positive correlation between geological epoch and aspect ratio of manus (Spearman’s rank correlation coefficient ρ = 0.55, p < 0.0001). It was indicated that relative manus length of sauropodomorphs had changed slightly from the Early Jurassic until the Early Cretaceous, and it increased more radically in the Late Cretaceous, resulting in more anteroposteriorly elongated manus shape in the Late Cretaceous.
Chronological change in aspect ratio (FL/FW) of the sauropodomorphs. A, Manus and B, pes. The box encloses the 25th and 75th percentiles, with the horizontal line representing the median. The whiskers show the range of observed values that fall within the interquartile range (i.e., 1.5× height of the box) from the top and bottom of the box.

Figure 3. Long description
The chart contains two vertically stacked panels. The top panel, labeled A, plots m F L forward slash F W on the y-axis against Epoch on the x-axis, with categories Lower Jurassic, Middle Jurassic, Upper Jurassic, Lower Cretaceous, and Upper Cretaceous. Each epoch is represented by a boxplot with individual data points: red triangles for Lower Jurassic, green circles for Middle Jurassic, blue squares for Upper Jurassic, yellow circles for Lower Cretaceous, and purple squares for Upper Cretaceous. The Upper Cretaceous shows the widest range and highest median for m F L forward slash F W. The bottom panel, labeled B, plots p F L forward slash F W on the y-axis against the same epochs on the x-axis, using the same color and shape scheme. Here, the aspect ratio remains more consistent across epochs, but the Upper Cretaceous still displays the greatest spread. Both panels use boxplots where the box spans the interquartile range, the horizontal line marks the median, and whiskers extend to 1.5 times the box height. Outliers are visible as points outside the whiskers.
The results of Steel-Dwass tests of footprint shape and geological epochs.

Table 2. Long description
The header row lists geological epochs in the first column, Manus p-values in the second, and Pes p-values in the third. From top to bottom, the comparisons are: Lower Jurassic vs. Middle Jurassic with p-values 0.84 for Manus and 0.91 for Pes; Lower Jurassic vs. Upper Jurassic with 0.57 for Manus and 0.96 for Pes; Lower Jurassic vs. Lower Cretaceous with 0.34 for Manus and 0.96 for Pes; Lower Jurassic vs. Upper Cretaceous with less than 0.01 in bold for Manus and 0.93 for Pes; Middle Jurassic vs. Upper Jurassic with 0.93 for Manus and 0.69 for Pes; Middle Jurassic vs. Lower Cretaceous with 0.93 for Manus and 1.00 for Pes; Middle Jurassic vs. Upper Cretaceous with less than 0.01 in bold for Manus and 1.00 for Pes; Upper Jurassic vs. Lower Cretaceous with 1.00 for Manus and 0.60 for Pes; Upper Jurassic vs. Upper Cretaceous with less than 0.01 in bold for Manus and 0.36 for Pes; Lower Cretaceous vs. Upper Cretaceous with less than 0.01 in bold for Manus and 1.00 for Pes. Significant differences are indicated by bold values in the Manus column.
a Significant differences are shown in bold.
Pes footprint aspect ratio showed little chronological changes. Median values of pes aspect ratio of all epochs ranged between 1.22 and 1.30, and both the Spearman’s rank correlation test (Spearman’s rank correlation coefficient ρ = −0.08, p = 0.27) and the Steel-Dwass test showed no significant difference between geological epochs (Table 2).
Heteropody Index (Relative Size of the Manus Footprints to the Pes)
Mean values of the heteropody index of Jurassic and Cretaceous epochs are as follows. Lower Jurassic: 0.30; Middle Jurassic: 0.36; Upper Jurassic: 0.37; Lower Cretaceous: 0.39; Upper Cretaceous: 0.39. When comparing the heteropody index between epochs using the Steel-Dwass test, the value of the Upper Cretaceous was significantly larger than that of the Lower Jurassic (p = 0.03; Fig. 4), the other pairs did not show significant differences (p > 0.05; Table 3). The Spearman’s rank correlation test also revealed a significant positive correlation between the heteropody index and the epochs (Spearman’s rank correlation coefficient ρ = 0.17, p = 0.029). It showed that the area of the manus footprints increased chronologically, especially during the Jurassic (Fig. 4) in sauropodomorphs.
Chronological change in heteropody index (manus area/pes area) of the sauropodomorphs. The format of the box plot is the same as Fig. 3.

Figure 4. Long description
The chart is a horizontal sequence of five box plots, each representing a geological epoch from left to right: Lower Jurassic, Middle Jurassic, Upper Jurassic, Lower Cretaceous, and Upper Cretaceous. The x axis is labeled Epoch and lists these five periods. The y axis is labeled Manus area forward slash Pes area, ranging from 0.1 to 0.8. Each box plot displays individual data points with different shapes and colors: red triangles for Lower Jurassic, green circles for Middle Jurassic, blue squares for Upper Jurassic, yellow circles for Lower Cretaceous, and purple squares for Upper Cretaceous. The Lower Jurassic group is tightly clustered around a median near 0.3. Middle Jurassic shows a wider spread, with most values between 0.2 and 0.5 and one outlier above 0.7. Upper Jurassic, Lower Cretaceous, and Upper Cretaceous all show further increased spread, with medians near 0.3 to 0.4 and whiskers extending from about 0.1 to 0.7. The Upper Cretaceous group has the largest number of data points and the widest distribution. No trend of consistent increase or decrease in median is visible, but variability increases through time.
The results of Steel-Dwass tests in relative manus size and geological epochs.

Table 3. Long description
Starting from the top, the table lists pairwise comparisons of geological epochs in the first column and their Steel-Dwass test p-values in the second column. The comparisons and p-values are as follows: Lower Jurassic versus Middle Jurassic, 0.80; Lower Jurassic versus Upper Jurassic, 0.36; Lower Jurassic versus Lower Cretaceous, 0.10; Lower Jurassic versus Upper Cretaceous, bold 0.03 indicating statistical significance; Middle Jurassic versus Upper Jurassic, 0.97; Middle Jurassic versus Lower Cretaceous, 0.80; Middle Jurassic versus Upper Cretaceous, 0.74; Upper Jurassic versus Lower Cretaceous, 0.99; Upper Jurassic versus Upper Cretaceous, 1.00; Lower Cretaceous versus Upper Cretaceous, 1.00. The only significant difference is between Lower Jurassic and Upper Cretaceous, as shown by the bolded p-value.
a The significant difference is shown in bold.
Elliptic Fourier Analysis
The cumulative contribution of the first two PCs of manus and pes EFD coefficients accounted for about 70% and 55% of the total variance, respectively (Table 4). In manus, the first PC (PC 1) represents distance in the anteroposterior direction that explains 49.3% of total variance, while the second PC (PC 2) represents manus skewed either laterally or medially, which explains 19.7% of total variance (Fig. 5). In the pes, PC 1 represents the convexity of the anterior part, explaining 36.6% of the total variance, and PC 2 represents the mediolateral width of the anterior part, explaining 19.5% of the total variance.
Eigenvalues of principal components (PCs) and variance explained by PCs obtained by the principal component analysis of 20 elliptic Fourier descriptors (EFDs).

Table 4. Long description
The table has five rows, each corresponding to a principal component, labeled PC 1 through PC 5. Each row contains four values: for Manus, the eigenvalue and explained variance percentage, followed by the same for Pes. For PC 1, Manus eigenvalue is 0.013 with 49.3 percent variance explained, Pes eigenvalue is 0.008 with 36.6 percent variance explained. For PC 2, Manus eigenvalue is 0.005 with 19.7 percent, Pes eigenvalue is 0.004 with 19.5 percent. For PC 3, Manus eigenvalue is 0.003 with 11.9 percent, Pes eigenvalue is 0.003 with 12.6 percent. For PC 4, Manus eigenvalue is 0.001 with 5.5 percent, Pes eigenvalue is 0.002 with 7.6 percent. For PC 5, Manus eigenvalue is 0.001 with 3.3 percent, Pes eigenvalue is 0.001 with 4.8 percent. The table shows that the first principal component explains the largest proportion of variance for both Manus and Pes, with subsequent components explaining progressively less.
Variations in footprint shape accounted for by the first and second principal components (PC 1 and PC 2). Each shape represents the contour that has the mean (center), mean –2×SD (left), or mean + 2×SD (right) value of the PC scores.

Figure 5. Long description
The diagram is organized in two rows and six columns. The top row is labeled P C 1, the bottom row P C 2. The first three columns show Manus footprints at minus two S D, mean, and plus two S D. The next three columns show Pes footprints at minus two S D, mean, and plus two S D. Each cell contains a single contour line representing the footprint shape for that P C value. At the center, a double-headed arrow indicates the anatomical axes: anterior is up, posterior is down, medial is left, and lateral is right. The contours illustrate systematic shape changes along each principal component.
Mean values for PC 1 of manus in each epoch are as follows. Lower Jurassic: −0.08; Middle Jurassic: −0.01; Upper Jurassic: −0.02; Lower Cretaceous: 0.03; Upper Cretaceous: 0.09. PC 1 values for the manus were larger in the Cretaceous period than in the Lower Jurassic, but the Steel-Dwass test indicated no significant differences (Table 5, Fig. 6A). However, the Spearman’s rank correlation test revealed the positive correlation between epoch and PC 1 (Spearman’s rank correlation coefficient ρ = 0.366, p = 0.004). Mean values for PC 2 of manus are as follows. Lower Jurassic: −0.01; Middle Jurassic: 0.02; Upper Jurassic: 0.03; Lower Cretaceous: −0.03; Upper Cretaceous: 0.04. There was no significant correlation between epoch and PC 2 (Spearman’s rank correlation coefficient ρ = −0.025, p = 0.873). In the pes, mean PC 1 values in each epoch are as follows. Lower Jurassic: −0.05; Middle Jurassic: 0.00; Upper Jurassic: 0.02; Lower Cretaceous: 0.01; Upper Cretaceous: 0.00. No significant difference was observed between epochs using the Steel-Dwass test (Table 4, Fig. 6B). This result was further supported by the Spearman’s rank correlation between epoch and PC 1 that showed no significant correlation (p = 0.404). Mean values for PC 2 of pes are as follows. Lower Jurassic: 0.00; Middle Jurassic: 0.00; Upper Jurassic: −0.01; Lower Cretaceous: 0.00; Upper Cretaceous: 0.02. There was no significant correlation between epoch and PC 2 (Spearman’s rank correlation test, p = 0.376).
The results of Steel-Dwass tests in principal components (PCs) and geological epochs.

Table 5. Long description
Beginning at the top row, the table compares geological epochs in the first column: Lower Jurassic vs. Middle Jurassic, Lower Jurassic vs. Upper Jurassic, Lower Jurassic vs. Lower Cretaceous, Lower Jurassic vs. Upper Cretaceous, Middle Jurassic vs. Upper Jurassic, Middle Jurassic vs. Lower Cretaceous, Middle Jurassic vs. Upper Cretaceous, Upper Jurassic vs. Lower Cretaceous, Upper Jurassic vs. Upper Cretaceous, and Lower Cretaceous vs. Upper Cretaceous. For each epoch pair, four p-values are listed: Manus P C 1, Manus P C 2, Pes P C 1, Pes P C 2. Values for Manus P C 1 range from 0.13 to 1.00, Manus P C 2 from 0.54 to 1.00, Pes P C 1 from 0.41 to 1.00, Pes P C 2 from 0.71 to 1.00. The lowest p-value is 0.13 for Manus P C 1 between Lower Jurassic and Lower Cretaceous. Most values are close to 1.00, indicating non-significant differences in principal components between epoch pairs for both Manus and Pes.
Chronological change in principal component (PC) 1 of manus (A) and pes (B). The format of the box plot is the same as Fig. 3.

Figure 6. Long description
There are two panels arranged vertically. The top panel, labeled A, shows box plots of P C 1 for manus across five epochs: Lower Jurassic, Middle Jurassic, Upper Jurassic, Lower Cretaceous, and Upper Cretaceous, from left to right. Each epoch has a distinct marker: red triangles for Lower Jurassic, green circles for Middle Jurassic, blue squares for Upper Jurassic, yellow circles for Lower Cretaceous, and purple squares for Upper Cretaceous. The y-axis ranges from negative 0.2 to positive 0.2. The bottom panel, labeled B, shows the same epochs and markers for pes, with the y-axis ranging from negative 0.3 to positive 0.1. Both panels display the spread, median, and outliers for each epoch. The data show variation in P C 1 values across epochs, with some epochs exhibiting wider ranges and more outliers.
Statistical Analyses to Detect Body-Size Effect
Regarding the relationship between the body size (as represented by the pes length) and footprint shape, a positive correlation between the body size and PC 1 of manus (Pearson correlation coefficient ρ = 0.002, p = 0.03; Fig. 7) was found, whereas no significant body size correlation was observed for other PCs of manus and pes. This means that within the sauropodomorphs, larger body sizes accompany more circular and anteroposteriorly longer manus shape.
The relationship between body size and principal component (PC) 1. A, Manus (correlation coefficient ρ = 0.002, p = 0.03) and B, pes (ρ = 0.0007, p = 0.16).

Figure 7. Long description
The top panel, labeled A, plots Body size (Pes Length) on the x-axis from 30 to 100 and P C 1 on the y-axis from minus 0.1 to 0.2. Data points are colored and shaped by period: red triangles for Lower Jurassic, green circles for Middle Jurassic, blue squares for Upper Jurassic, yellow open circles for Lower Cretaceous, and purple open squares for Upper Cretaceous. A black regression line trends upward. The legend at lower right identifies these symbols. The bottom panel, labeled B, has the same axes but with Body size from 20 to 120 and P C 1 from minus 0.3 to 0.1. The same color and shape scheme is used, but no regression line is present. Data points are more dispersed vertically in panel B. Both panels show overlapping distributions of periods, with panel A indicating a weak positive correlation and panel B showing no clear trend.
The manus area showed negative allometry against the pes area among sauropodomorphs, which the 95% confidence interval of the regression slope did not include 1 (p < 0.0001, regression slope = 0.91, 95% confidence interval: 0.85–0.98; Fig. 8). This result indicates that large sauropodomorphs have relatively smaller manus compared with small sauropodomorphs at the individual level.
The relationship between manus and pes areas. Both variables were log-transformed. Regression slope = 0.91, p < 0.0001.

Figure 8. Long description
The x axis is labeled Log open parenthesis Pes area close parenthesis, ranging from 4 to 9. The y axis is labeled Log open parenthesis Manus area close parenthesis, ranging from 4 to 8. Data points are grouped by period: red triangles for Lower Jurassic, green circles for Middle Jurassic, blue squares for Upper Jurassic, yellow open circles for Lower Cretaceous, and purple open squares for Upper Cretaceous. Most points cluster along a diagonal from lower left to upper right, indicating a positive correlation. A solid black regression line runs through the data, with the equation Log open parenthesis Manus area close parenthesis equals 0.91 times Log open parenthesis Pes area close parenthesis minus 0.39 displayed at the top. The legend at the bottom right identifies the symbols for each period.
Discussion
In this study, we investigated whether there are any chronological changes in the shape (aspect ratio, PC 1 and PC 2 of EFDs) of manus and pes tracks of sauropodomorphs and whether these shape changes are related to their body sizes or not. Additionally, we tested whether the heteropody index of sauropodomorphs shows any chronological change, and again, how this ratio correlates with their body sizes.
In our analysis, pes footprints showed little chronological changes in their aspect ratio, which is consistent with the previous osteological studies that suggested the morphological change in the pes was smaller compared with that of the manus (Upchurch Reference Upchurch1998; Wilson and Sereno Reference Wilson and Sereno1998). In contrast, manus tracks of sauropodomorphs changed their shape over time. Initially, in the Lower Jurassic, the shape of sauropodomorph manus footprints was wider in mediolateral direction. Subsequently, the temporal changes were observed through the Jurassic and, more rapidly, in the Cretaceous periods, with manus footprint becoming longer in the anteroposterior direction and approaching the horseshoe-shaped morphology. These morphological changes in manus and pes prints, which were detected through both Spearman’s rank correlation tests using EFDs and the aspect ratio, agree with the trend observed in sauropod trackways from the Iberian Peninsula (Castanera et al. Reference Castanera, Santos, Piñuela, Pascual, Vila, Canudo, Moratalla, Falkingham, Marty and Richter2016), which is from speech bubble shape to horseshoe shape. The morphology of sauropod manus footprints from the Upper Cretaceous, which is an anteroposteriorly elongated semicircular shape, generally matches the expected shape of the sole of the manus inferred from the arrangement of metacarpals of derived Neosauropoda, including Titanosauria (Bonnan Reference Bonnan2003).
In the Upper Cretaceous, the variance in the aspect ratio of the manus was drastically increased (Fig. 3). This increasing variance in manus aspect ratio suggests the possibility that diverse trackmakers coexisted or variation in locomotor style and interactions with environmental factors such as substrate (Falkingham et al. Reference Falkingham, Bates and Mannion2012). From the analysis of aspect ratio, it was found that the anteroposterior length of the manus print significantly increased between the Early Cretaceous and the Late Cretaceous. Derived Neosauropoda, such as Titanosauria, that are characterized by columnar manus, are believed to have appeared during the Late Jurassic (Wilson Reference Wilson, Curry-Rogers and Wilson2005; Sander et al. Reference Sander, Christian, Clauss, Fechner, Gee, Griebeler, Gunga, Hummel, Mallison and Perry2011). Therefore, there seems a temporal gap between osteological and ichnological records regarding the anteroposterior manus elongation of sauropods. This gap might be due to a bias in the sample used in this study, as many of the Upper Cretaceous footprints are from South America, where the derived Titanosauria were thought to be abundant (Vieira et al. Reference Vieira, Vieira, Nobrega, Montenegro, Filho, Santana, Alves, Almeida and Vasconcellos2014). In addition, the fact that some horseshoe-shape tracks are also found in the Upper Jurassic (Brontopodus plagnensis; Mazin et al. Reference Mazin, Hantzpergue and Olivier2017) indicates that this gap is likely due to sample bias. Limitation of the sample is, however, much serious in the body fossils than the trackway records. Body fossils that allow for the reconstruction of the sole of the foot are rare (Wright Reference Wright, Curry-Rogers and Wilson2005; Jannel et al. Reference Jannel, Salisbury and Panagiotopoulou2022), so this gap may also be attributable to the scarcity of body fossils or the difficulty in the reconstruction of soft tissue from body fossils.
Interestingly, manus shapes correlate with body sizes; larger sauropodomorphs had more circular manus than smaller sauropodomorphs (Fig. 7A). This finding matches those of previous biomechanical studies (although those studies examined pedes not manus) that showed the soft tissue pad of the pes in sauropodomorphs reduced bone stresses by making a skeletally digitigrade or sub-unguligrade foot a functionally plantigrade foot (Jannel et al. Reference Jannel, Nair, Panagiotopoulou, Romilio and Salisbury2019, Reference Jannel, Salisbury and Panagiotopoulou2022). The same evolutionary trend, returning to functionally plantigrade foot from digitigrade or unguligrade foot by obtaining foot pad beneath the foot skeleton is observed among different lineages of extant mammals when they obtain gigantic body sizes (Kubo et al. Reference Kubo, Sakamoto, Meade and Venditti2019).
The analysis using the trackway dataset revealed that the size of the manus increased against pes among sauropodomorphs, especially during the Jurassic (Fig. 4). However, manus track sizes showed negative allometry to pes track sizes among sauropodomorphs (Fig. 8). The observed chronological increase in the heteropody index is generally consistent with the results of the previous ichnological study (Lockley et al. Reference Lockley, Farlow and Meyer1994). This increase was not substantial, and the variance also increased. This may be caused by the coexistence of diverse trackmakers. Although this value would be influenced by the substrate or the preservation of tracks, these factors showed no bias between epochs. In addition, as with other indices, the footprint area used to calculate the heteropody index was the mean value for each trackway; therefore, we consider it generally robust against substrate and preservational variations that can occur within a trackway but can be minimized by averaging. It was indicated that the heteropody, the difference between manus and pes sizes, tended to decrease in the Lower Cretaceous, coinciding with the epoch when the ichnogenus Brontopodus was assumed to become dominant (Lockley et al. Reference Lockley, Farlow and Meyer1994). Although the size of the manus was always smaller than that of pes in all epochs, its relative increase suggests that while the center of mass of Sauropodomorpha was always closer to the hindlimbs than to the forelimbs, it shifted slightly forward over time. Bates et al. (Reference Bates, Mannion, Falkingham, Brusatte, Hutchinson, Otero, Sellers, Sullivan, Stevens and Allen2016) also showed steady temporal cranial shift of the center of mass among sauropodomorphs. Although their data were restricted to taxa that lived before the mid-Early Cretaceous, their result also matches with the temporal trend detected by this study (Fig. 4).
Henderson (Reference Henderson2006) estimated from 3D models of two sauropodomorphs that in larger sauropodomorphs, the center of mass tends to move forward. In contrast, Bates et al. (Reference Bates, Mannion, Falkingham, Brusatte, Hutchinson, Otero, Sellers, Sullivan, Stevens and Allen2016) argued using 3D models of 17 sauropodomorphs that there is only a weak positive correlation between body mass and the center of mass among sauropodomorphs, and phylogenetic effect plays a larger role in the temporal shift of the center of mass. They suggested that derived titanosaurs reduced the tail, which caused the cranial shift of the center of mass, and the diversification of titanosaurs during the Cretaceous caused the temporal cranial shift of the center of mass among sauropodomorphs. The detected negative allometry of the relative size of manus against pes (Fig. 8) indicates larger sauropodomorph individuals had a relatively small manus compared with smaller sauropodomorph individuals. Although we did not identify the trackmaker of trackways used in this study beyond Sauropodomorpha, temporal enlargement of the relative size of manus prints indicated the sauropod clade, which diversified later in their history, had relatively large manus. Therefore our results support the conclusion of Bates et al. (Reference Bates, Mannion, Falkingham, Brusatte, Hutchinson, Otero, Sellers, Sullivan, Stevens and Allen2016) that cranial shift of the center of mass in sauropodomorphs was mainly due to the phylogenetic effect. Titanosauria is known to attain the gigantic body size more often than any other sauropodomorph clade (Carballido et al. Reference Carballido, Pol, Otero, Cerda, Salgado, Garrido, Ramezani, Cúneo and Krause2017; D’Emic Reference D’Emic2023), and it is possible that their relatively large manus enabled them to evolve extremely large body size repeatedly. Regarding the estimation of footprint area, as stated by Romilio (Reference Romilio2025), footprint area should nevertheless be calculated using contour-based measurements for future footprint descriptions. The continued accumulation of such data will improve the accuracy of manus-to-pes area ratios in future research.
This study is the first to apply EFDs to analyze the shape of dinosaur footprints using their contour lines. In previous ichnological studies, classification of shape was based on visual observation of researchers, using clear features such as the presence or absence of claw impressions, as well as subjective diagnoses such as relative roundness of footprints (Lockley et al. Reference Lockley, Farlow and Meyer1994). The use of EFDs in this study enables objective quantification of footprint morphology and allows for direct, statistically grounded comparisons. However, because this method requires closed contours, footprints with unclear outlines or poor preservation cannot be used, and footprints that have been deformed due to changes in the substrate or by preservation cannot be appropriately evaluated. Due to these constraints, the sample size for the EFD analysis was much smaller (N = 42 for manus and 58 for pes) than that of the trackway dataset (N = 690), which used simpler indexes such as aspect ratio and footprint area. However, the temporal trends in manus and pes morphology inferred from EFD analyses were broadly consistent with the patterns identified from the larger dataset. Therefore, by increasing the number of samples and conducting analyses with EFDs, it may become possible to identify taxon-specific morphological traits that are useful for classifying ambiguous footprints currently lacking ichnotaxonomic assignment.
Conclusions
In this study, data from 690 sauropodomorph trackways were compiled from 171 published descriptions. Analyses of these data revealed temporal and body size–related changes in manus morphology, whereas no such trends were observed in the pes. Specifically, manus shape exhibited a temporal shift toward a more anteroposteriorly elongated and circular form, a pattern also associated with larger individuals. Additionally, a chronological trend toward a relatively larger manus compared with the pes was observed. These combined results support inferences from body fossil and digital 3D model studies, such as Bates et al. (Reference Bates, Mannion, Falkingham, Brusatte, Hutchinson, Otero, Sellers, Sullivan, Stevens and Allen2016), who reported a temporal increase in relative manus size, and Bonnan (Reference Bonnan2003), who proposed circular manus morphology evolved among derived Sauropodomorpha to accommodate increased body mass. Henderson (Reference Henderson2006) also hypothesized that a proportionally large manus evolved as an adaptation to increasing body size. However, our current regression results did not support this, as manus size showed negative allometry with respect to pes size.
This study represents the first application of elliptic Fourier descriptors (EFDs) to dinosaur footprints and the first comprehensive analysis of trackway data focused on sauropodomorphs––or any specific dinosaur clade. By quantitatively assessing footprint morphology from accumulated ichnological data, this research demonstrates that trackways can serve as an independent and complementary line of evidence for testing hypothesis on limb morphology and locomotor evolution derived from studies using skeletal remains.
Acknowledgments
We appreciate the following people for their constructive comments for this research: K. Sato (The University of Tokyo), M. Iijima (Institute of Vertebrate Paleontology and Paleoanthropology), and our seminar and lab members (K. Nara, M. Suzuki, K. Ito, A. Kohno, and H. Onizaki). We thank H. Iwata (The University of Tokyo) for his instruction for using SHAPE software for elliptic Fourier analysis. We thank two anonymous reviewers, whose comments substantially improved the quality of our article. This work was supported by a grant from the Japan Science Society (Sasakawa Scientific Research Grant).
Competing Interests
The authors declare that they have no competing interests.
Data Availability Statement
All the data used for the statistical tests are available from the Zenodo Digital Repository: https://doi.org/10.5281/zenodo.18752270.
・Supplementary Table S1_final.xlsx: The reference list of papers from which data were collected and the measurements of all tracksites used in statistical analyses.
・Supplementary Table S2_final.xlsx: PC1s and PC2s of manus and pes obtained by EFDs.
・Supplementary Zip file S3_final.zip: Footprint images used in Elliptic Fourier analysis.




 Open access

