





Introduction
Fasciola hepatica (F. hepatica), commonly known as liver fluke, has a worldwide distribution (Mas-Coma et al. Reference Mas-Coma, Valero and Bargues2022). This trematode has a complex life cycle (Torgerson and Claxton, Reference Torgerson, Claxton and Dalton1999). The final hosts are usually herbivorous animal species, with cattle, sheep and goats serving as main reservoir (Mehmood et al. Reference Mehmood, Zhang, Sabir, Abbas, Ijaz, Durrani, Saleem, Ur Rehman, Iqbal, Wang, Ahmad, Abbas, Hussain, Ghori, Ali, Khan and Li2017). Humans can also get infected, but have a minor role in the transmission of F. hepatica (Lan et al. Reference Lan, Zhang, Xing, Zhang, Wang, Zhang, Gao and Wang2024). In Western-Europe, the predominant intermediate host is Galba truncatula (G. truncatula), a pond snail (Torgerson and Claxton, Reference Torgerson, Claxton and Dalton1999). F. hepatica highly depends on suitable environmental conditions to complete its life cycle. For example, its eggs and larval stages within G. truncatula (sporocysts, rediae and cercariae) need temperatures above 10 °C to develop, and its eggs also need rainfall to be liberated from faeces (Torgerson and Claxton, Reference Torgerson, Claxton and Dalton1999; Modabbernia et al. Reference Modabbernia, Meshgi and Kinsley2024). Similarly, G. truncatula needs temperatures above 10 °C to reproduce, and its preferred habitat seems to be located on dense soil types and in moist environments, for example along pools and trenches (Dube et al. Reference Dube, Kalinda, Manyangadze, Mindu and Chimbari2023; Smith et al. Reference Smith, Morgan and Jones2024).
Infections with F. hepatica lead to significant production losses in ruminants, which were estimated at €39 million annually for the Dutch dairy cattle industry, with an average of €20 million for European countries (n = 16) (Charlier et al. Reference Charlier, Rinaldi, Musella, Ploeger, Chartier, Vineer, Hinney, von Samson-himmelstjerna, Băcescu, Mickiewicz, Mateus, Martinez-Valladares, Quealy, Azaizeh, Sekovska, Akkari, Petkevicius, Hektoen, Höglund, Morgan, Bartley and Claerebout2020). Reductions in milk yield range from 3% to 15% per cow at farms which were F. hepatica antibody positive in bulk tank milk (BTM) (Charlier et al. Reference Charlier, Duchateau, Claerebout, Williams and Vercruysse2007; Howell et al. Reference Howell, Baylis, Smith, Pinchbeck and Williams2015). In addition, a meta-analysis on fasciolosis in cattle and sheep found a reduction in daily weight gain of 9% and a reduction in live weight of 6% in infected animals (Hayward et al. Reference Hayward, Skuce and McNeilly2021). F. hepatica infections can be monitored at herd level using bulk tank milk ELISA and diagnosed at individual level using faecal egg counts. However, eggs are not excreted until 10 weeks post-infection, which limits diagnosis of early infections (Sabatini et al. Reference Sabatini, de Almeida Borges, Claerebout, Gianechini, Höglund, Kaplan, Lopes, Mitchell, Rinaldi, von Samson-himmelstjerna, Steffan and Woodgate2023). Few flukicides are available for treatment, most of which are solely effective against mature flukes and require a withdrawal period for milk of a few days, depending on national legislation. Triclabendazole is also effective against immature flukes, but this drug cannot be used in lactating cows producing milk for human consumption (Castro-Hermida et al. Reference Castro-Hermida, González-Warleta, Martínez-Sernández, Ubeira and Mezo2021). However, because of this unique efficacy against both immature and mature flukes, triclabendazole has been extensively used by cattle and sheep farmers to treat F. hepatica infections. As a result, F. hepatica populations are developing resistance to triclabendazole, which threatens effective treatment of both livestock and humans (Fairweather et al. Reference Fairweather, Brennan, Hanna, Robinson and Skuce2020). Moreover, there is increasing concern about residues of flukicides, mainly albendazole, in the environment, which can harm non-target organisms in both soil and water ecosystems (Vokřál et al. Reference Vokřál, Podlipná, Matoušková and Skálová2023).
Over the past decades, climate change has drawn renewed attention to F. hepatica and its transmission dynamics (Beesley et al. Reference Beesley, Caminade, Charlier, Flynn, Hodgkinson, Martinez-Moreno, Martinez-Valladares, Perez, Rinaldi and Williams2018). According to the Intergovernmental Panel on Climate Change, global temperatures are rising and precipitation will increase in most northern mid-latitudes this century (Ranasinghe et al. Reference Ranasinghe, Ruane, Vautard, Arnell, Coppola, Cruz, Dessai, Islam, Rahimi, Ruiz Carrascal, Sillmann, Sylla, Tebaldi, Wang, Zaaboul, Masson-Delmotte, Zhai, Pirani, Connors, Péan, Berger, Caud, Chen, Goldfarb, Gomis, Huang, Leitzell, Lonnoy, Matthews, Maycock, Waterfield, Yelekçi, Yu and Zhou2021). These climate changes could extend the period in which F. hepatica larvae and its predominant intermediate host, G. truncatula, can develop (Modabbernia et al. Reference Modabbernia, Meshgi and Kinsley2024; Smith et al. Reference Smith, Morgan and Jones2024). Mathematical models predict that the annual F. hepatica infection rate will increase in Central and Northwest Europe during the 21st century (Fox et al. Reference Fox, White, McClean, Marion, Evans and Hutchings2011; Caminade et al. Reference Caminade, van Dijk, Baylis and Williams2015). Besides those climate changes, environmental changes at regional or local level should not be neglected, as, for example, changes in land use can favour or disrupt the habitat of G. truncatula (Smith et al. Reference Smith, Morgan and Jones2024). In peat meadows, groundwater levels will likely increase to reduce CO2 emissions (Boonman et al. Reference Boonman, Hefting, van Huissteden, van den Berg, van Huissteden, Erkens, Melman and van der Velde2022). Those higher groundwater levels will moisten the pastures, which allows F. hepatica and G. truncatula to develop more successfully (Modabbernia et al. Reference Modabbernia, Meshgi and Kinsley2024; Smith et al. Reference Smith, Morgan and Jones2024). If F. hepatica infection rates increase, flukicide use will increase and, consequently, flukicide resistance and the expected environmental burden will likely increase (Fairweather et al. Reference Fairweather, Brennan, Hanna, Robinson and Skuce2020). Thus, we urgently need sustainable strategies to control F. hepatica infections, e.g. on dairy cattle farms. These strategies start with risk assessments and monitoring of infections, which could then guide farmers to implement more preventive measurements and to minimize flukicide use (Charlier et al. Reference Charlier, Vercruysse, Morgan, Van Dijk and Williams2014b; Castro-Hermida et al. Reference Castro-Hermida, González-Warleta, Martínez-Sernández, Ubeira and Mezo2021).
The risk of F. hepatica infections in dairy cattle herds can vary spatially and temporally due to differences in weather conditions, geographical settings or farm management practices (Beesley et al. Reference Beesley, Caminade, Charlier, Flynn, Hodgkinson, Martinez-Moreno, Martinez-Valladares, Perez, Rinaldi and Williams2018). Detailed understanding of those spatial and temporal differences is needed to manage this risk. In other words, risk assessments should identify factors associated with high risk areas, factors associated with interannual changes in prevalence in high risk areas, and factors associated with the timing and location of pastures that are most at risk on farm level (Charlier et al. Reference Charlier, Vercruysse, Morgan, Van Dijk and Williams2014b). If these factors have predictive value, they could be incorporated in models to predict the risk of F. hepatica infection. These predictions could guide farmers, veterinarians and policymakers in making decisions to manage the risk of infection. In several European countries, researchers have assessed associations between the seroprevalence of F. hepatica infection and potential risk factors in cattle herds (Bennema et al. Reference Bennema, Ducheyne, Vercruysse, Claerebout, Hendrickx and Charlier2011; McCann et al. Reference McCann, Baylis and Williams2010; Kuerpick et al. Reference Kuerpick, Conraths, Staubach, Fröhlich, Schnieder and Strube2013; Novobilský et al. Reference Novobilský, Novák, Björkman and Höglund2015; Munita et al. Reference Munita, Rea, Bloemhoff, Byrne, Martinez-Ibeas and Sayers2016). In Ireland, England and Wales, the risk of F. hepatica infection was most strongly associated with weather conditions such as rainfall and temperature (McCann et al. Reference McCann, Baylis and Williams2010; Munita et al. Reference Munita, Rea, Bloemhoff, Byrne, Martinez-Ibeas and Sayers2016). Whereas in Germany, the risk was most strongly associated with water bodies and grassed areas (Kuerpick et al. Reference Kuerpick, Conraths, Staubach, Fröhlich, Schnieder and Strube2013); in Sweden, with several soil characteristics (Novobilský et al. Reference Novobilský, Novák, Björkman and Höglund2015); and in Belgium, with grazing management (Bennema et al., Reference Bennema, Ducheyne, Vercruysse, Claerebout, Hendrickx and Charlier2011). These countries all have temperate climates, but factors that drive the risk of infection differ. This underscores the need to assess the risk of F. hepatica infection for both dairy and beef cattle at national or even regional level.
To our knowledge, no recent studies have been performed on the epidemiology of F. hepatica infections in dairy cattle in the Netherlands (Gaasenbeek et al. Reference Gaasenbeek, Over, Noorman and de Leeuw1992). As risk assessments are needed for sustainable management of F. hepatica infections, our study aimed to identify weather, soil and herd factors associated with F. hepatica antibody positivity in BTM in Dutch dairy cattle herds.
Materials and methods
Bulk tank milk samples
The study population consisted of 2660 Dutch dairy cattle farms that voluntarily participated in a programme in which antibodies against lungworm, gastrointestinal parasites and F. hepatica are monitored in BTM. BTM samples were collected yearly in October, from 2018 till 2023. Not all farms participated in the programme during the entire study period. BTM samples were analysed with a commercially available IDEXX ELISA (Fasciolosis Verification Test, Montpellier, France) according to the manufacturer’s instructions. The ELISA results were expressed as a sample-to-positive percentage (S/P%) and were calculated using the following formula:
 \begin{equation*}{\text{S/P\% = }}\frac{{{\text{optical density of sample}}}}{{{\text{optical density of positive control}}}}{\text{* 100}}\end{equation*}
The S/P% values of each ELISA plate were adjusted to enable comparison over the years between plates. The adjustment factor was based on two in-house control samples, which were included on each plate in accordance with standard lab procedures. The in-house weakly positive control sample was used to adjust weakly positive BTM samples, and the in-house highly positive control sample was used to adjust highly positive BTM samples. The adjustment factors were calculated using the following formula:
 \begin{equation*}{F_{{C_i}}} = \frac{{S{P_{{C_i}}}}}{{(\mathop \sum \nolimits_{i = 1}^{{n_C}} S{P_{{C_i}}})/{n_C}}}\end{equation*}
where FCi is the adjustment factor for samples on plate i which were adjusted by in-house control sample C, SPCi is the S/P% value of in-house control sample C on plate i, and nc is the total number of plates on which the in-house control sample C is tested. The S/P% values of BTM samples were then adjusted using the following formula:
 \begin{equation*}SP{A_{{M_i}}} = S{P_{{M_{{C_i}}}}} \cdot {F_{{C_i}}}\end{equation*}
where SPAMi is the adjusted S/P% value for sample M on plate i, SPMCi is the original S/P% value of sample M on plate i which were adjusted by in-house control sample C, and FCi is the adjustment factor for samples on plate i which were adjusted by in-house control sample C.
Meteorological data
Daily recordings of meteorological data were retrieved from the Royal Netherlands Meteorological Institute (KNMI) for 37 weather stations distributed throughout the Netherlands (Royal Netherlands Meteorological Institute, 2024). For each farm, daily mean temperature (in °C), daily rainfall sum (in mm) and daily global radiation (in J/cm2) were estimated using inverse distance weighting interpolation combined with the farms’ coordinates. Interpolation was performed with a power of two on a raster with cell size of 0.00304° in both x- and y-direction. The daily estimates were further averaged to monthly estimates. The twelve months preceding the month of BTM sampling were included in the analyses, which were October (year before sampling year, t-1) to September (sampling year, t). Furthermore, the annual number of days with temperature > 10°C was included, which was defined as the number of days with an average daily temperature greater than 10 °C from October (t-1) to September (t).
Soil data
Monthly estimates of relative soil moisture levels in root zones were obtained from FutureWater (Future Water, 2024). Those estimates were modelled using the Spatial Processes in HYdrology (SPHY) model, with 100-meter spatial resolution (Terink et al. Reference Terink, Lutz, Simons, Immerzeel and Droogers2015). For each farm, monthly estimates of relative soil moisture levels were included for October (t-1) to September (t) using the farms’ coordinates. In addition, the types of top-soil covering the Netherlands were retrieved from the Dutch Soil Information System (Wageningen University & Research, 2021). In the Netherlands, soil types are mainly classified based on soil texture, such as the clay fraction (lutum) and organic matter content (de Vries, Reference de Vries1999). Areas could also be classified as water or urban areas. For each farm, soil type was extracted using rasterized data with cell size 0.00304° in x-direction and 0.00308° in y-direction. The rasterized data consisted of several data layers, each denoting the presence or absence of a soil type, water or urban area. Six soil types were included in the analyses: sand (including loess and peaty sand), light loam, heavy loam, light clay, heavy clay and peat soils. Some farms got classified with multiple soil types, urban area or water. For those farms, the most common soil type in the surrounding eight raster cells was assigned. If soil types were equally present, or if only water and/or urban areas were present in the surrounding cells, a soil type was manually assigned to the farm (n = 29) based on the Dutch Soil Map (“Bodemkaart van Nederland’) (Wageningen University & Research, 2021).
Farm characteristics
Data from individual cows were obtained from the Identification and Registration (I&R) data of the Netherlands Enterprise Agency (Netherlands Enterprise Agency, 2024). From this data, the number of cows older than two years on 1st October (t) was computed for each herd. This number was included in the analyses as a proxy for the number of dairy cows. In addition, the number of cows introduced from other herds between 1st October (t-1) and 30th September (t) were computed. Introduction of cattle in the herd was included in the analyses, categorized into open (>2 cows), semi-closed (1-2 cows) or closed (no cows introduced) farms. Self-reported data from farmers on grazing of dairy cows were also obtained from the Netherlands Enterprise Agency. The annual data was limited to three categories: all cows, some of the cows or no cows had grazed. Grazing of dairy cows during the year of BTM sampling (t) was included in the analyses.
Statistical analyses
Associations between environmental factors and the presence of antibodies in BTM were explored with logistic regression analyses using generalized estimating equations. The ELISA results were dichotomized into S/P% ≤ 30 and S/P% > 30, as a proxy for a level of antibodies in BTM indicative of absence (antibody negative) or presence (antibody positive) of infection with F. hepatica according to manufacturer’s instructions. Continuous independent variables were a priori categorised into quartiles (Q1 to Q4) to account for potential non-linear exposure-response relationships. Each quartile contained 25% of the observations, ranked from low to high, thus the first quartile (Q1) included the lowest 25% of values and the fourth quartile (Q4) the highest 25%. A first-order autoregressive correlation structure (AR-1) was used in the model to account for temporal autocorrelation within farms. Goodness-of-fit of the models was assessed using the quasi-likelihood information criterium (QIC) and Efron’s pseudo-R2.
Univariate analyses were performed to explore associations between environmental factors and antibody positivity in BTM. Sufficiently associated variables (P < 0.2) were included in the full multivariate model on which stepwise backwards elimination was manually performed. The least significant independent variables were removed one by one, until all remaining variables were significantly associated with the dependent variable (P ≤ 0.05). The model was checked for collinearity and confounding by assessing the change in regression coefficients and QIC after an independent variable was removed. After backwards elimination, removed variables that worsened model’s fit (∆QIC > 2) were reintroduced by stepwise forward selection. Variables that best improved the model’s fit were added until no further improvement was possible (∆QIC ≤ 2). To evaluate the robustness of the final model, the multivariate analyses were repeated using manual stepwise forward selection, which identified the same final model.
Data on antibody positivity in BTM were stratified by soil type. The logistic regression analyses were repeated for each stratum because the associations between environmental factors and antibody positivity in BTM might differ per soil type. Multiple soil types were combined to one stratum due to the low sample size of some soil types; sand and light loam soils were combined (‘sand soils’), and heavy loam, light clay, heavy clay and peat soils were combined (‘clay-peat soils’). The categories ‘all cows’ and ‘part of the cows’ of the variable ‘grazing of dairy cows’ were combined to one category due to an insufficient number of observations in the category ‘part of the cows.’ The same modelling procedures were followed as for the model across soil types.
All analyses were performed with R version 4.4.1 using the packages tidyverse, geepack and performance (Wickham, Reference Wickham2023; Højsgaard et al. Reference Højsgaard, Halekoh, Yan and Ekstrøm2024; Lüdecke et al. Reference Lüdecke, Makowski, Ben-Shachar, Patil, Waggoner, Wiernik, Thériault, Arel-Bundock, Jullum, Bacher and Luchman2024). Unless stated otherwise, a significance level of 5% was adopted.
Results
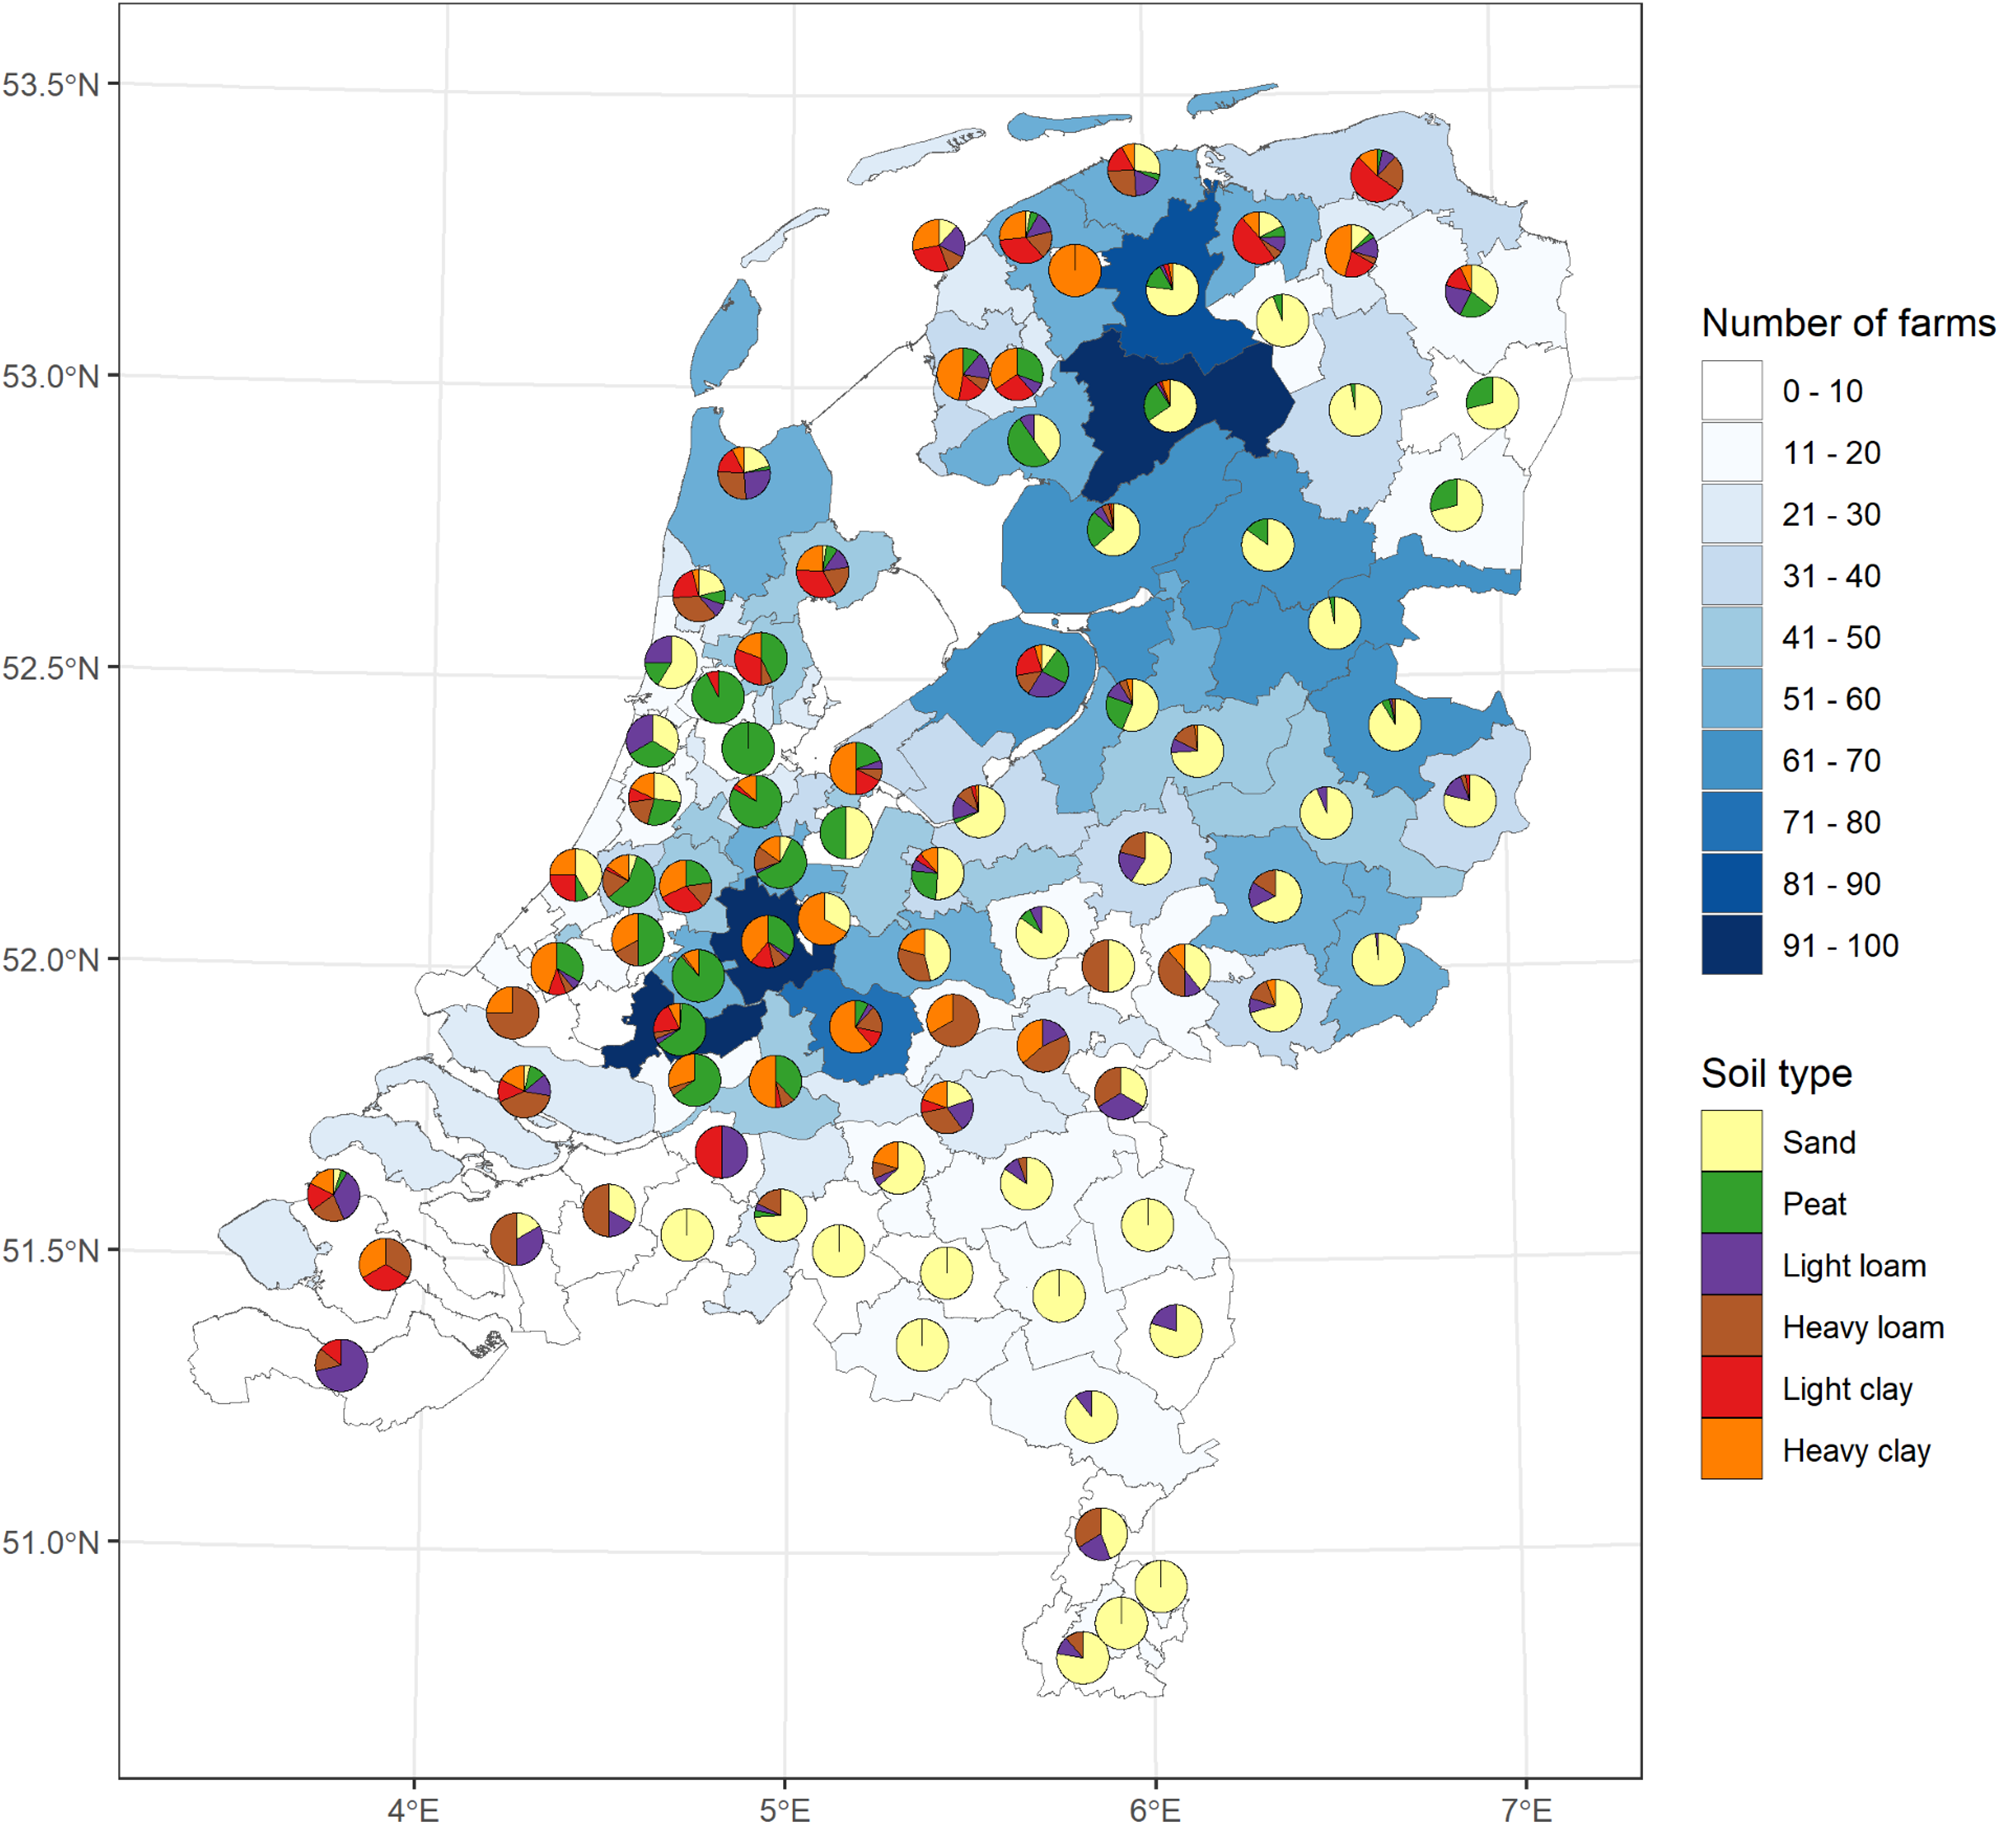
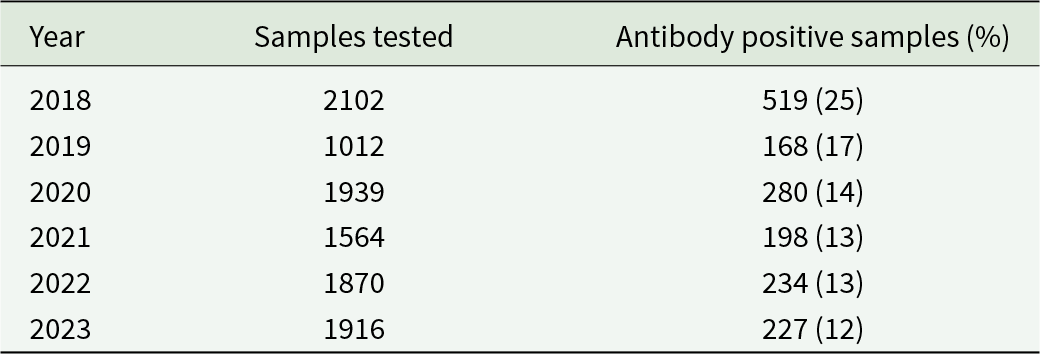
For 2660 farms at least one BTM sample was analysed from 2018 till 2023. In total, 10403 BTM samples were included in the analyses, with a F. hepatica antibody positivity of 15.6% (S/P% > 30; Table 1). Farms were distributed across all twelve provinces of the Netherlands, with an average of 151 dairy cows per farm. Most farms were located on sand soil (n = 1052), followed by peat soil (n = 512), while the fewest farms were located on light loam soil (n = 205; Figure 1).
Density of sampled farms per region in the Netherlands, with pie charts indicating the soil type on which the sampled farms are located.

Number of bulk tank milk (BTM) samples tested for Fasciola hepatica and number of F. hepatica antibody positive BTM samples (S/P% > 30) per year (2018-2023)

Analyses across soil types
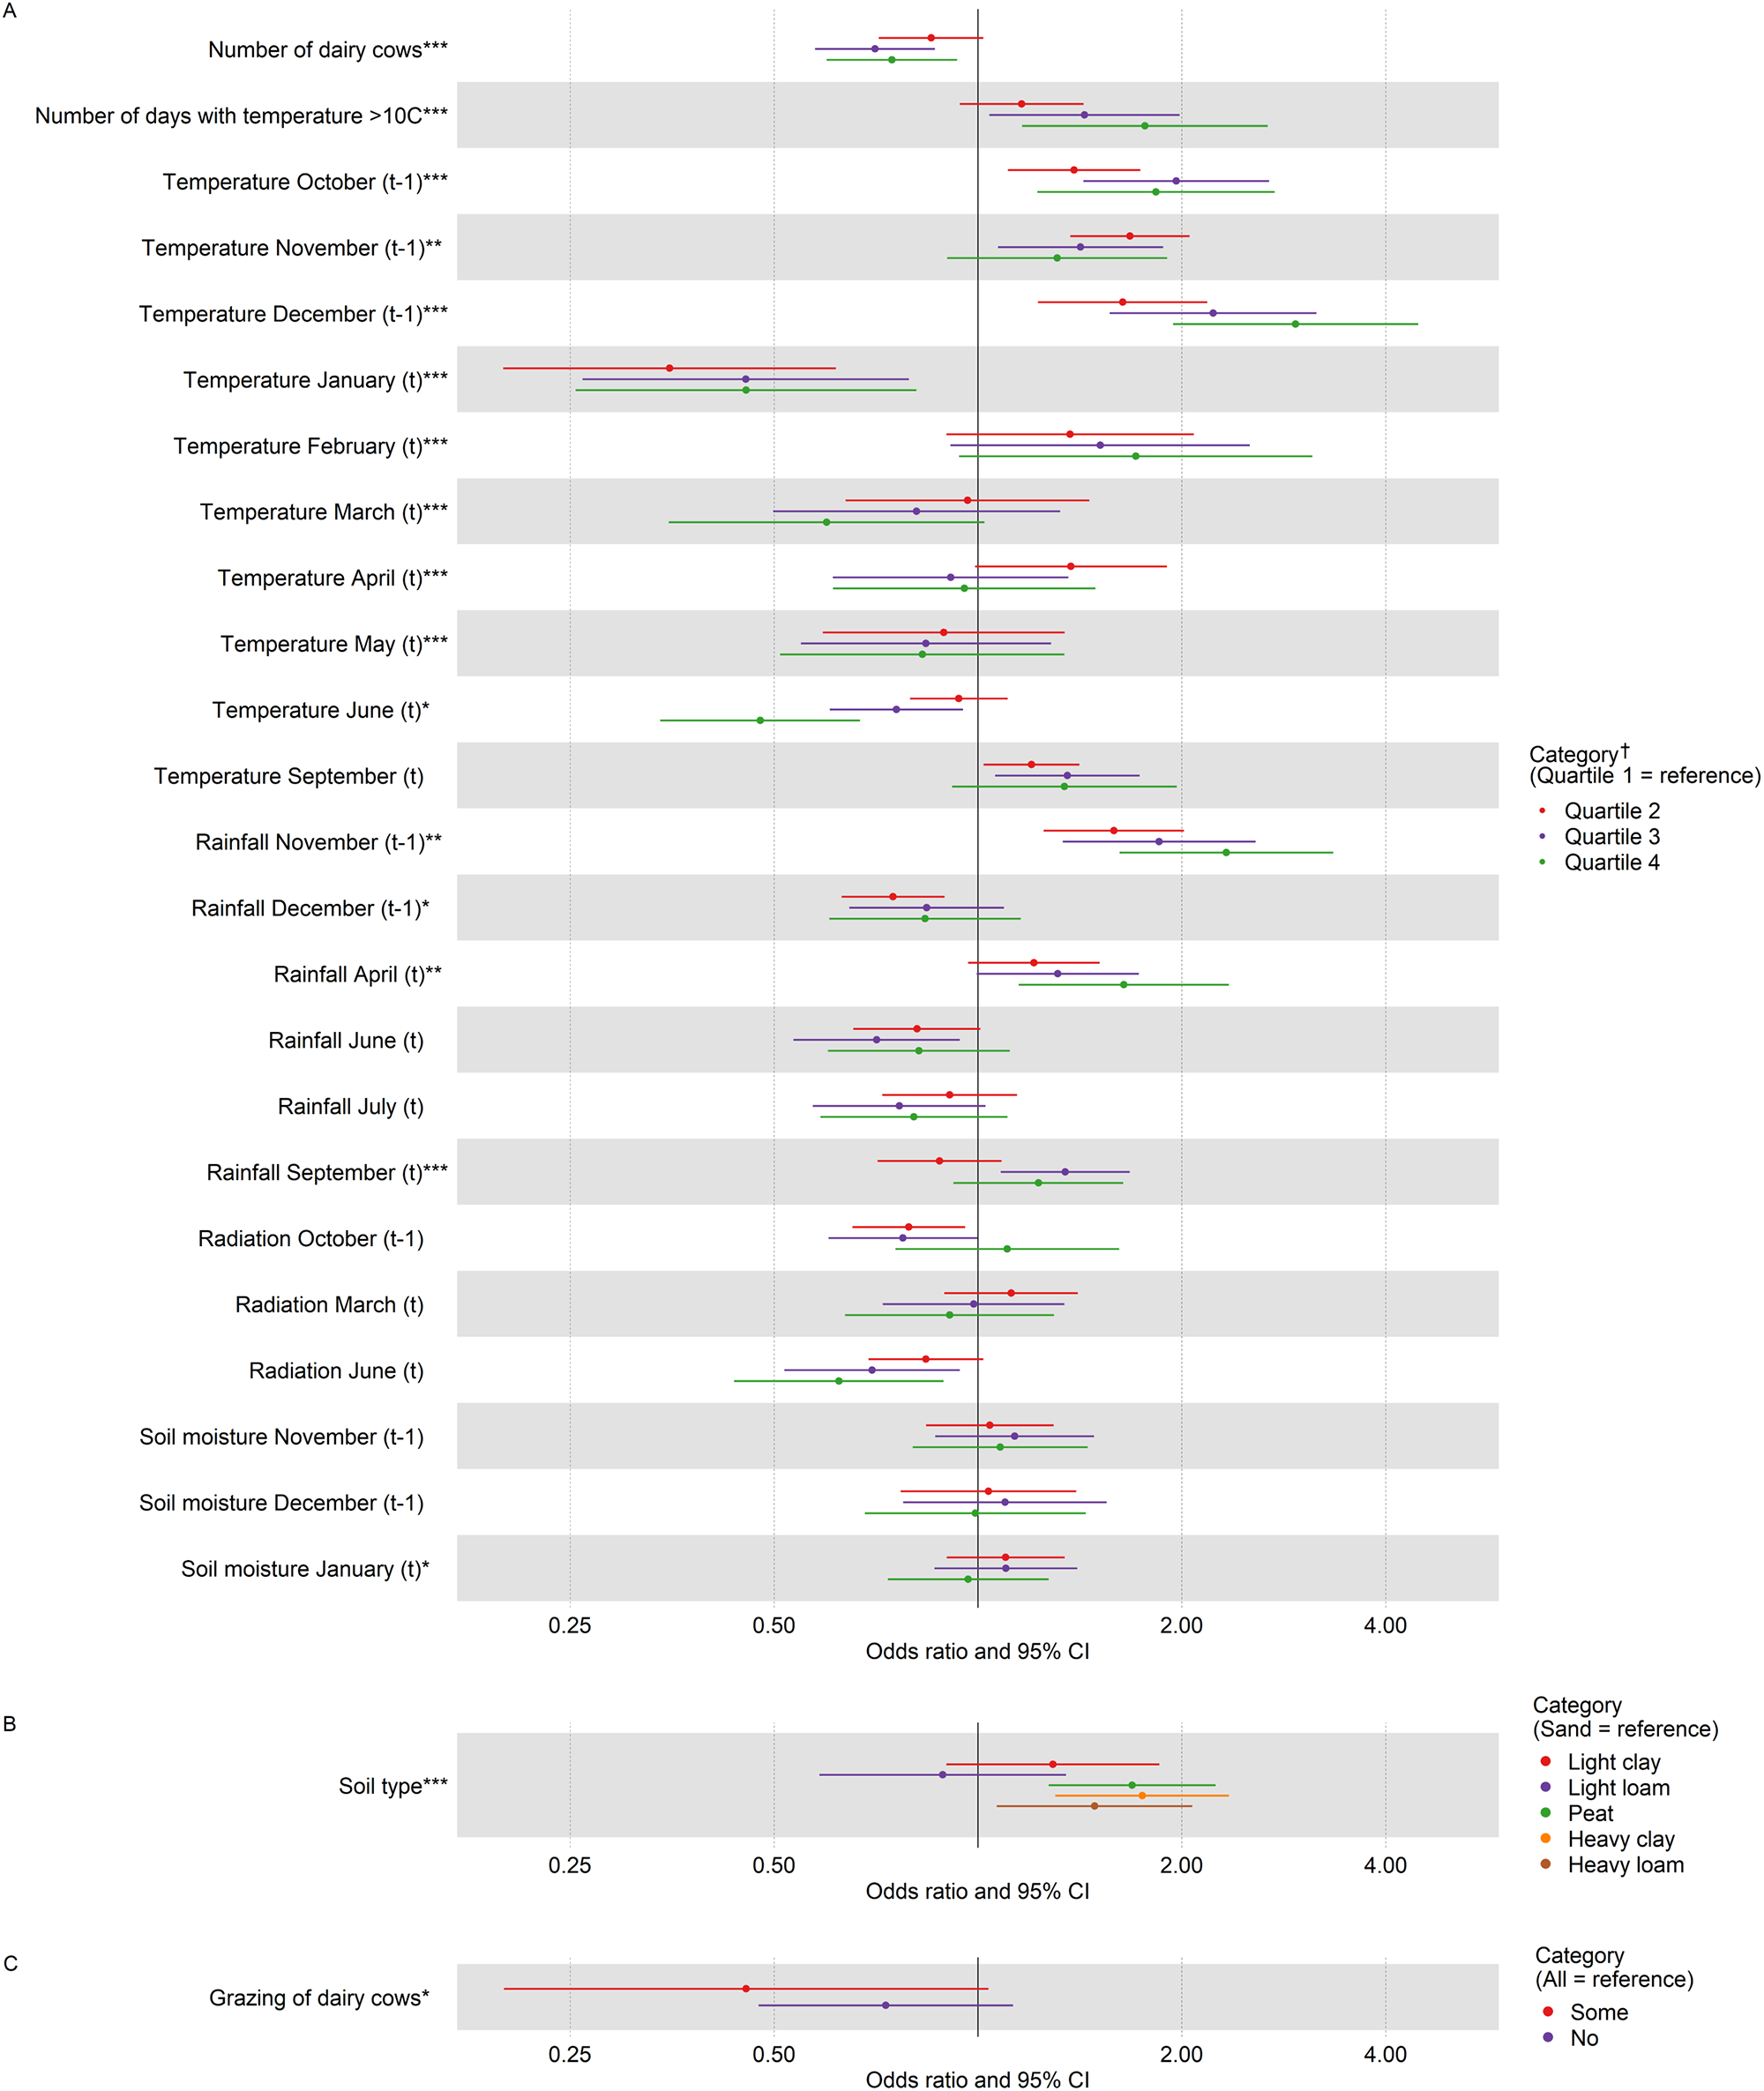
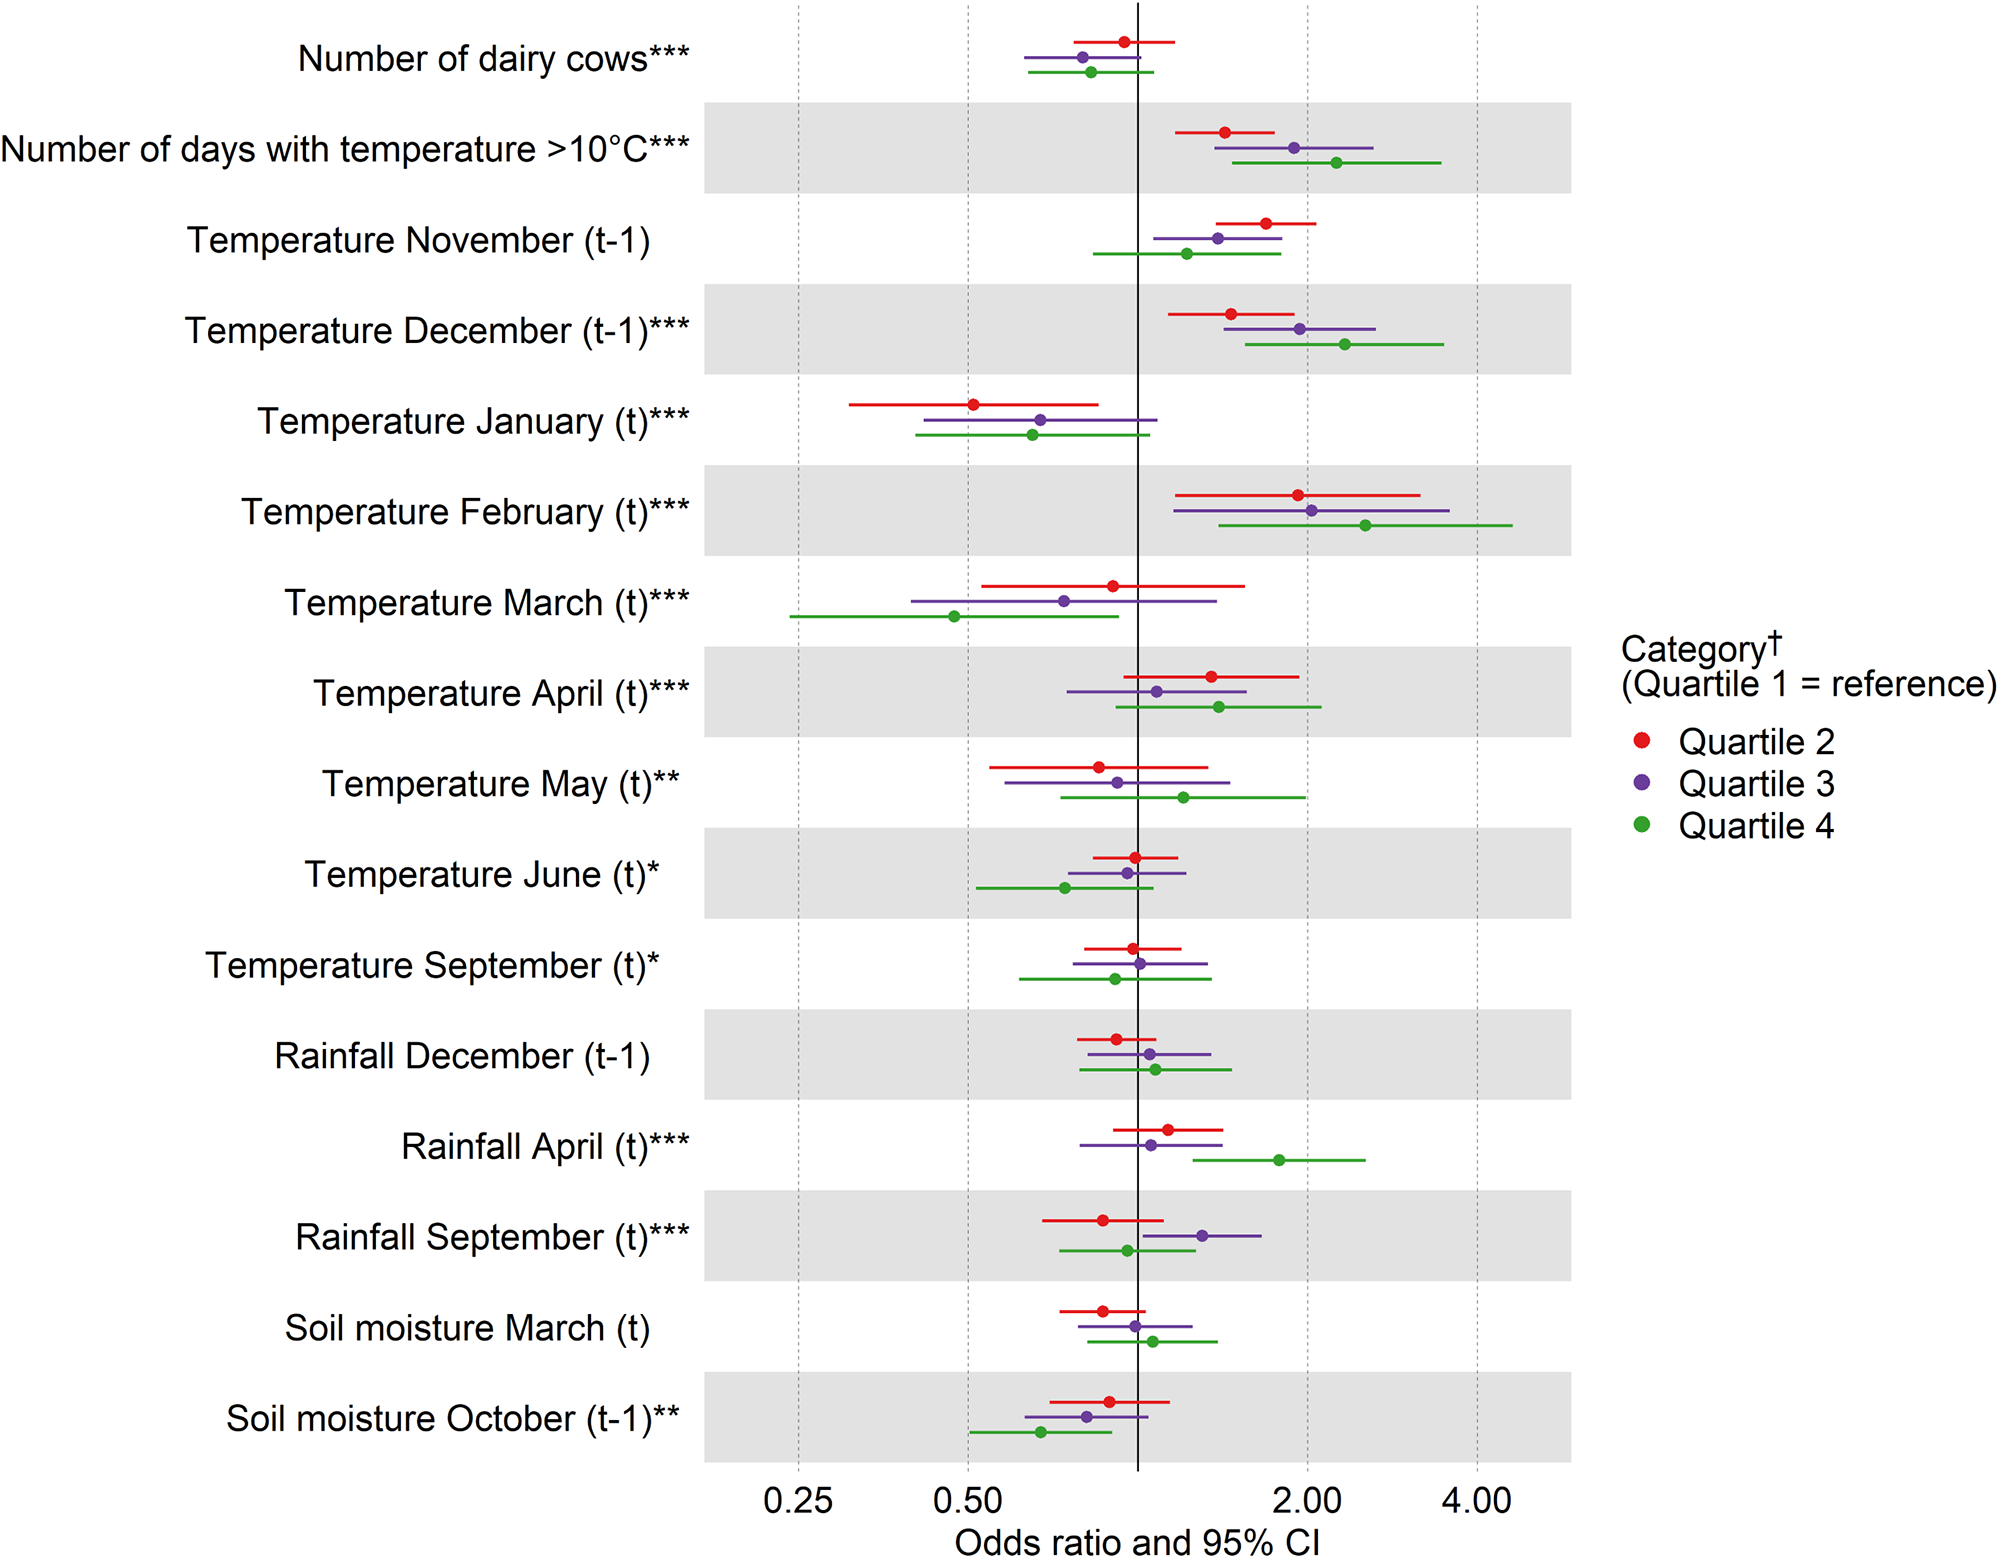
In the univariate analyses, all variables were associated with F. hepatica antibody positivity in BTM at a liberal P-value of 0.2, except for introduction of cattle from other herds (Supplementary Material: Tables 1 and 2). The results of the final multivariate model across soil types are outlined in Figure 2 and Supplementary Material: Table 4, and the corresponding significance levels of each variable are outlined in Supplementary Material: Table 3. The final model explained 13.0% of the variation in F. hepatica antibody positivity in BTM.
Results from multivariate logistic regression analyses across soil types assessing the association between herd and environmental factors and F. hepatica antibody positivity in bulk tank milk samples. Odds ratio and 95% confidence intervals (CI) are displayed for A) variables with ‘first quartile (Q1)’ as reference category, B) soil type with ‘sand soils’ as reference category, and C) grazing of dairy cows with ‘all cows’ as reference category.

The odds of F. hepatica antibody positivity in BTM are higher for farms located on heavy loam (OR 1.49, 95% CI [1.07, 2.07]), heavy clay (OR 1.75, 95% CI [1.30, 2.35]) or peat (OR 1.69, 95% CI [1.27, 2.24]) than for those located on sand soil (Figure 2, Supplementary Material: Table 4). No significant difference was observed between farms located on heavy loam, heavy clay and peat soil. Furthermore, the odds of antibody positivity are lower for farms with a larger number of dairy cows compared to those with a smaller herd size (ORQ1-Q3 0.70, 95% CI [0.57, 0.86]; ORQ1-Q4 0.75, 95% CI [0.60, 0.93]; Figure 2, Supplementary Material: Table 4).
The odds of F. hepatica antibody positivity in BTM increase with higher daily mean temperatures in October (t-1; ORQ1-Q3 1.96, 95% CI [1.43, 2.69]; ORQ1-Q4 1.83, 95% CI [1.22, 2.74]) and December (t-1; ORQ1-Q3 2.22, 95% CI [1.56, 3.16]; ORQ1-Q4 2.94, 95% CI [1.94, 4.46]). The odds of antibody positivity also increase with higher daily rainfall sum in November (t-1; ORQ1-Q3 1.85, 95% CI [1.33, 2.57]; ORQ1-Q4 2.33, 95% CI [1.62, 3.34]) and a higher annual number of days with temperature > 10°C (ORQ1-Q3 1.44, 95% CI [1.04, 1.98]; ORQ1-Q4 1.76, 95% CI [1.16, 2.68]; Figure 2, Supplementary Material: Table 4). In addition, the odds of antibody positivity are higher for the highest quartile of daily rainfall sum in April (t) compared to the lower quartiles (ORQ1-Q4 1.64, 95% CI [1.15, 2.35]; Figure 2, Supplementary Material: Table 4). In contrast, the odds of F. hepatica antibody positivity in BTM decrease with higher daily mean temperatures in June (t; ORQ1-Q3 0.76, 95% CI [0.60, 0.95]; ORQ1-Q4 0.48, 95% CI [0.34, 0.67]; Figure 2, Supplementary Material: Table 4).
Analyses stratified by soil type
Stratified analyses were performed for farms located on ‘sand soils’ (n = 1257) and ‘clay-peat soils’ (n = 1403). For farms on ‘sand soils,’ 4901 BTM samples were analysed, with a F. hepatica antibody positivity of 8.5%. This prevalence was lower compared to farms on ‘clay-peat soils,’ as 5520 BTM samples were analysed, with a F. hepatica antibody positivity of 22.0%.
For both soil type strata, introduction of cattle from other herds was not associated with F. hepatica antibody positivity in BTM in the univariate analyses at a liberal P-value of 0.2. In addition, for farms on ‘sand soils,’ grazing of dairy cows and relative soil moisture levels in June (t), July (t) and September (t) were not associated, and, for farms on ‘clay-peat soils,’ daily rainfall sum in February (t) and relative soil moisture levels in February (t), April (t) and August (t) were not associated (Supplementary Material: Table 5, 6, 9 and 10). The results of the two final multivariate models, and the corresponding significance levels of each variable are outlined in Supplementary Material: Table 7, 8, 11 and 12. The final model for farms on ‘sand soils’ explained 13.4% of the variation in F. hepatica antibody positivity in BTM, and the final model for farms on ‘clay-peat soils’ explained 8.4% of the variation.
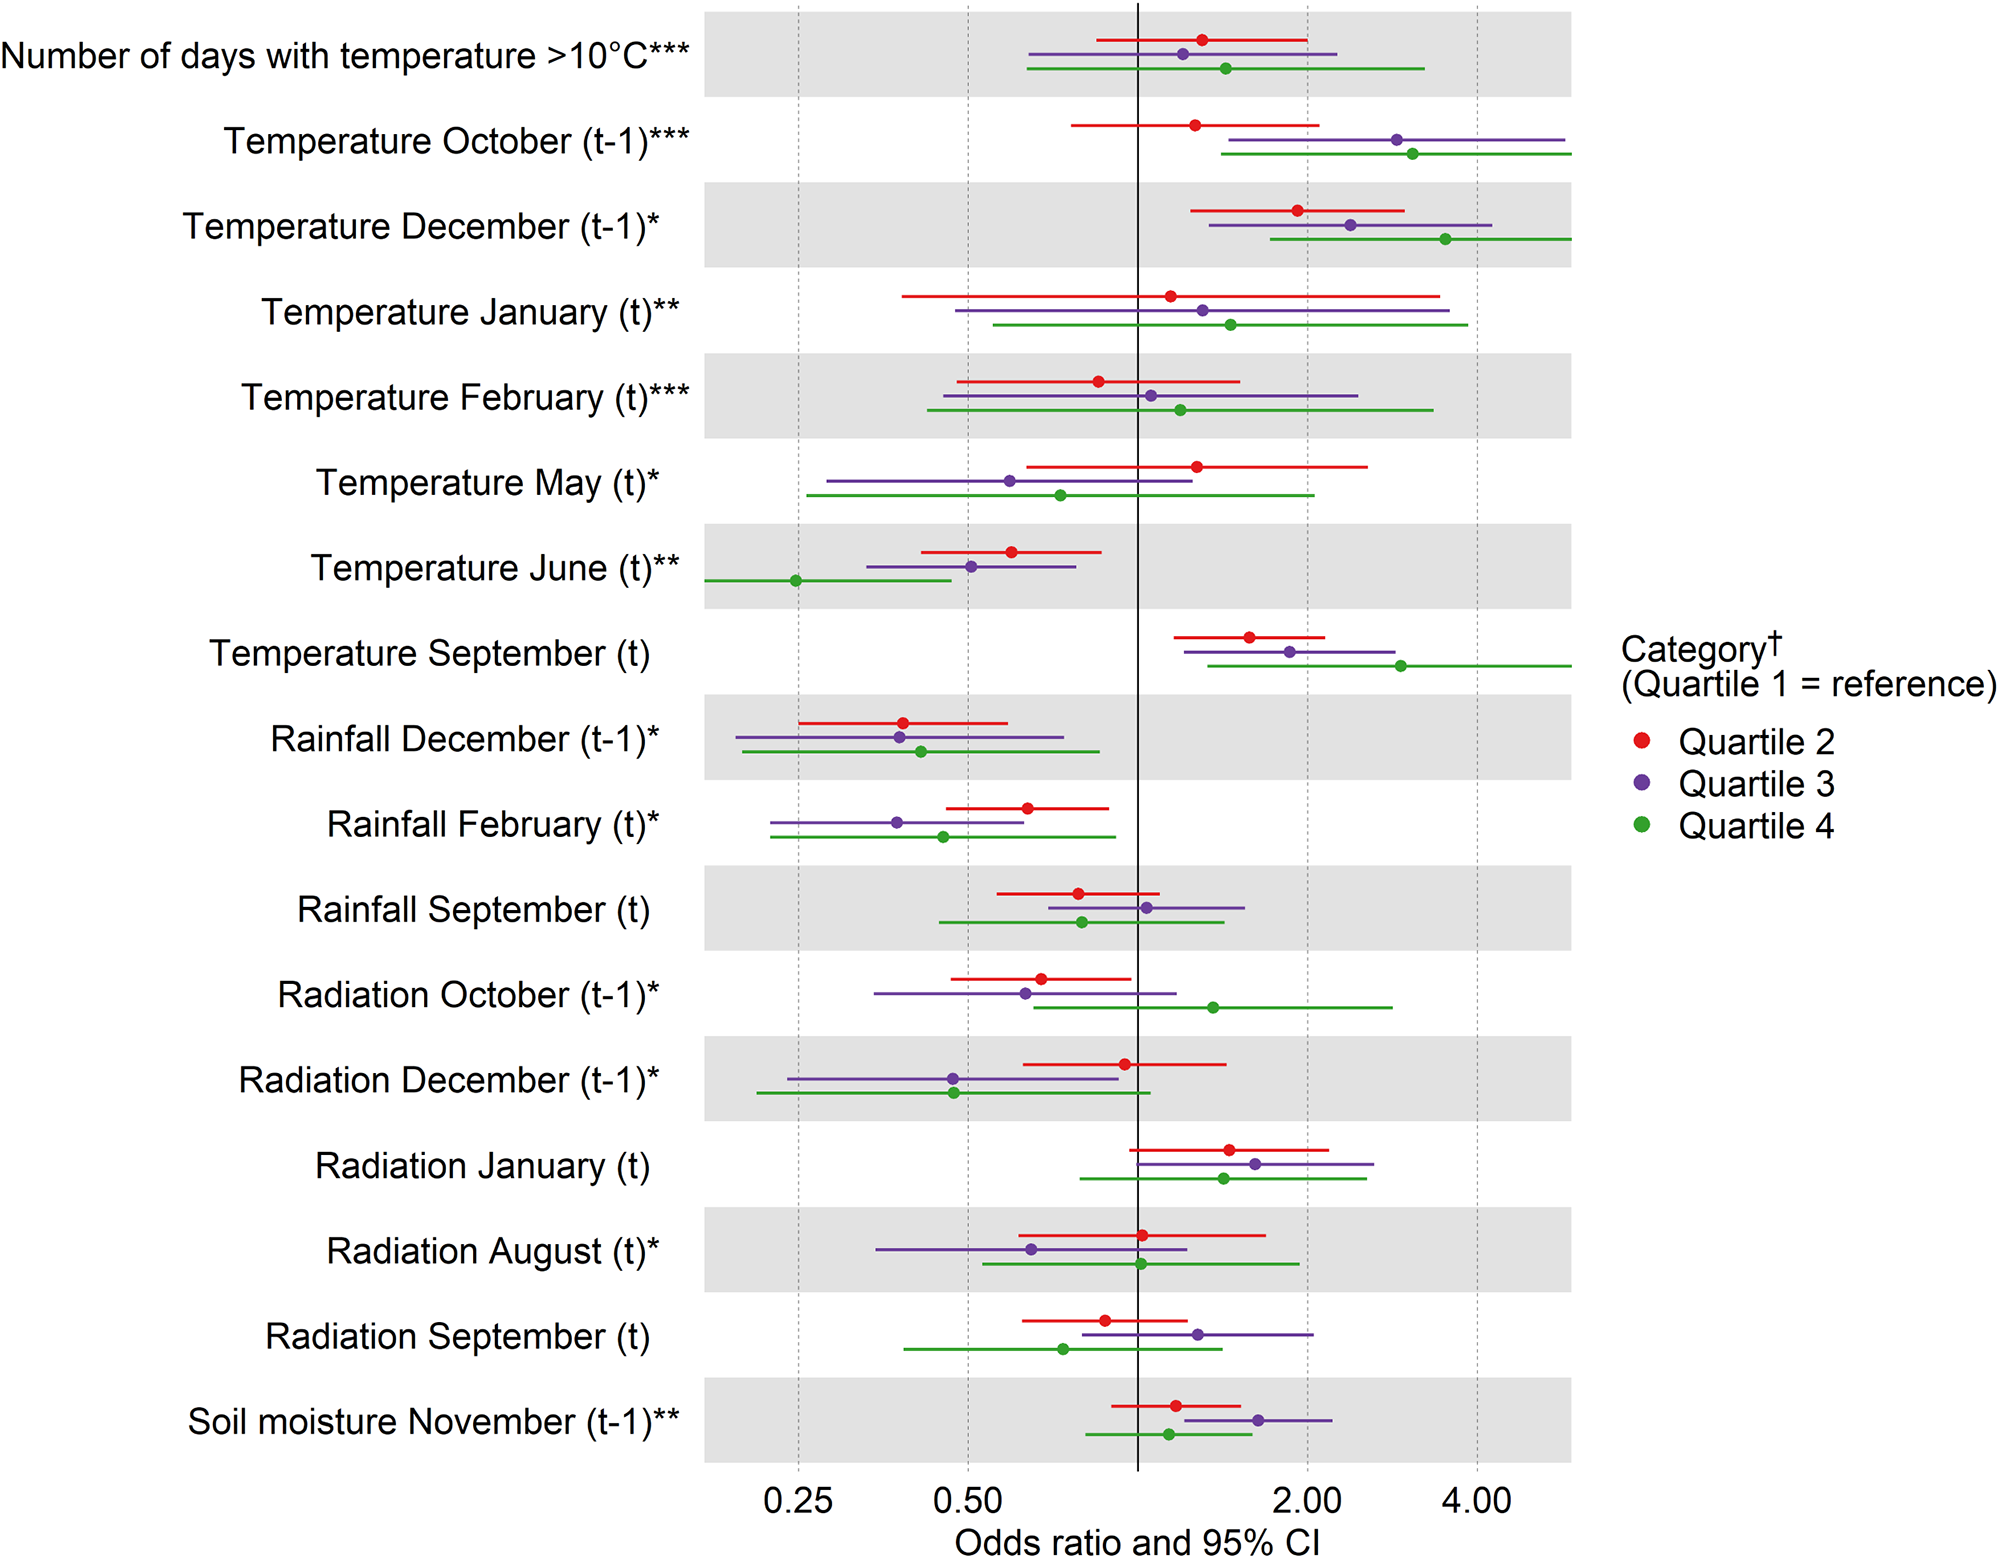
For both soil type strata, the odds of F. hepatica antibody positivity in BTM increase with higher daily mean temperatures in December (t-1; sand: ORQ1-Q3 2.38, 95% CI [1.34, 4.25] and ORQ1-Q4 3.51, 95% CI [1.72, 7.18]; clay-peat: ORQ1-Q3 1.94, 95% CI [1.42, 2.64] and ORQ1-Q4 2.33, 95% CI [1.55, 3.50]; Fig. 3 and 4, Supplementary Material: Table 8 and 12). In addition, for farms on ‘sand soils,’ the odds of antibody positivity increase with higher daily mean temperatures in October (t-1; ORQ1-Q3 2.88, 95% CI [1.45, 5.73]; ORQ1-Q4 3.07, 95% CI [1.41, 6.71]; Figure 3, Supplementary Material: Table 8). For farms on ‘clay-peat soils,’ the odds of antibody positivity increase with a higher number of annual number of days with temperature > 10°C (ORQ1-Q3 1.89, 95% CI [1.37, 2.62]; ORQ1-Q4 2.25, 95% CI [1.47, 3.46]) and the odds of antibody positivity are higher for the highest quartile of daily rainfall sum in April (t) compared to lower quartiles (ORQ1-Q4 1.78, 95% CI [1.25, 2.54]; Figure 4, Supplementary Material: Table 12). In contrast, for farms on ‘sand soils,’ the odds of F. hepatica antibody positivity in BTM decrease with higher daily mean temperatures in June (t; ORQ1-Q3 0.51, 95% CI [0.33, 0.78]; ORQ1-Q4 0.25, 95% CI [0.13, 0.47]) and higher daily rainfall sum in February (t; ORQ1-Q3 0.37, 95% CI [0.22, 0.63]; ORQ1-Q4 0.45, 95% CI [0.22, 0.92]; Figure 3, Supplementary Material: Table 8). For farms on ‘clay-peat soils,’ the odds of antibody positivity are lower for the highest quartile of daily mean temperature in March (t; ORQ1-Q4 0.47, 95% CI [0.24, 0.93]) and the highest quartile of relative soil moisture level in October (t-1; ORQ1-Q4 0.67, 95% CI [0.50, 0.90]) compared to the lower quartiles (Figure 4, Supplementary Material: Table 12).
Results from multivariate logistic regression analyses for farms on sand soils assessing the association between herd and environmental factors and F. hepatica antibody positivity in bulk tank milk samples. Odds ratio and 95% confidence intervals (CI) are displayed for variables with ‘first quartile (Q1)’ as reference category.

Results from multivariate logistic regression analyses for farms on clay-peat soils assessing the association between herd and environmental factors and F. hepatica antibody positivity in bulk tank milk samples. Odds ratio and 95% confidence intervals (CI) are displayed for variables with ‘first quartile (Q1)’ as reference category.

Discussion
F. hepatica infection rates are expected to increase due to environmental changes at global level such as climate change, and at regional level such as rewetting of peat meadows (Caminade et al. Reference Caminade, van Dijk, Baylis and Williams2015; Smith et al. Reference Smith, Morgan and Jones2024). Therefore, sustainable management strategies are needed to control infections with F. hepatica on dairy cattle farms, to limit the development of flukicide resistance and to minimize the environmental burden of flukicides (Charlier et al. Reference Charlier, Vercruysse, Morgan, Van Dijk and Williams2014b; Castro-Hermida et al. Reference Castro-Hermida, González-Warleta, Martínez-Sernández, Ubeira and Mezo2021). Those strategies start with assessing the risk of F. hepatica infection on farms, as the risk can vary spatially and temporally (Beesley et al. Reference Beesley, Caminade, Charlier, Flynn, Hodgkinson, Martinez-Moreno, Martinez-Valladares, Perez, Rinaldi and Williams2018). To our knowledge, no recent studies have been performed on the epidemiology of F. hepatica in the Netherlands or on the effects of current environmental changes on its transmission dynamics (Gaasenbeek et al. Reference Gaasenbeek, Over, Noorman and de Leeuw1992). Our study addresses this knowledge gap by providing valuable insights into potential herd and environmental risk factors for F. hepatica infections in Dutch dairy cattle herds. Using logistic regression, we found that soil type and weather conditions at the end of the previous grazing season were associated with the odds of F. hepatica antibody positivity in BTM of dairy cattle herds.
We found that the odds of F. hepatica antibody positivity in BTM was higher for farms on heavy clay and peat soils than for farms on predominantly sand soils. Similarly, Bennema et al. (Reference Bennema, Ducheyne, Vercruysse, Claerebout, Hendrickx and Charlier2011) identified sand soils as negative predictor and clay soils (in the region ‘Schor polders’) as positive predictor of F. hepatica infections (Bennema et al. Reference Bennema, Ducheyne, Vercruysse, Claerebout, Hendrickx and Charlier2011). Clay particles (‘lutum’) are small in size (< 2 µm), which results in dense soils with poor drainage and, consequently, wet pastures and trenches after rainfall (de Vries, Reference de Vries1999). These moist environments are preferred by G. truncatula and F. hepatica larvae, and could thus increase risk of F. hepatica infection in grazing cattle (Modabbernia et al. Reference Modabbernia, Meshgi and Kinsley2024; Smith et al. Reference Smith, Morgan and Jones2024). Those relatively high moisture levels also characterize peat soils (Joosten et al. Reference Joosten, Moen, Couwenberg, Tanneberger, Joosten, Tanneberger and Moen2017a). However, a systematic review by Smith et al. (Reference Smith, Morgan and Jones2024) showed that the presence of G. truncatula is strongly negatively associated with peatlands. They attributed this avoidance of peatlands to the low soil pH and/or the limited availability of algae for snails to feed on (Smith et al. Reference Smith, Morgan and Jones2024). It should be emphasized that peatlands are not uniform. Different types of peatland can be defined by specific characteristics, such as vegetation composition, water sources, nutrient availability and chemical gradients (Joosten et al. Reference Joosten, Moen, Couwenberg, Tanneberger, Joosten, Tanneberger and Moen2017a). Most dairy cattle farms in our study were located on fens (‘laagveen’) situated in the western part of the Netherlands (Joosten et al. Reference Joosten, Grootjans, Schouten, Jansen, Joosten, Tanneberger and Moen2017b). Nearly all Dutch fens have been cultivated and drained to form peat meadows (grassland) that were suitable for grazing of cattle and sheep and accessible for agricultural work (Joosten et al. Reference Joosten, Grootjans, Schouten, Jansen, Joosten, Tanneberger and Moen2017b). This cultivation to grassland has probably favoured the habitat of G. truncatula, as currently G. truncatula populations are predominantly found in or nearby trenches on Dutch peat meadows (Gaasenbeek et al. Reference Gaasenbeek, Over, Noorman and de Leeuw1992).
Soil moisture levels can vary within soil types, as each soil type comprises multiple soil profiles with distinct hydraulic properties (Heinen et al. Reference Heinen, Mulder, Bakker, Wösten, Brouwer, Teuling and Walvoort2022). Therefore, we expected that soil moisture levels would affect the odds of F. hepatica antibody positivity in BTM. However, relative soil moisture level in January was the only significant variable included in the final model across soil types, and no significant differences were found between the quartiles. Similarly, the analyses stratified by soil type did not reveal any pronounced effects of relative soil moisture levels. Those relative soil moisture levels were computed using the Spatial Processes in HYdrology (SPHY) model by FutureWater. This model integrates several hydrologic processes to simulate relative soil moisture levels with input of rainfall and evaporation (Terink et al. Reference Terink, Lutz, Simons, Immerzeel and Droogers2015). The variable relative soil moisture level in our model is thus closely related to the variables daily rainfall sum and daily mean temperature. Soil moisture levels mainly influence the survival of G. truncatula and F. hepatica eggs and metacercariae on pasture (Torgerson and Claxton, Reference Torgerson, Claxton and Dalton1999; Smith et al. Reference Smith, Morgan and Jones2024). Rainfall and temperature influence not only their survival, but also the rate and timing of development of G. truncatula and F. hepatica eggs and larvae, and of transmission of F. hepatica larvae. Consequently, rainfall and temperature determine the onset and abundance of metacercariae on pasture, which directly affects the risk of F. hepatica infection for cattle (Gettinby et al. Reference Gettinby, Hope-Cawdery and Grainger1974; Dube et al. Reference Dube, Kalinda, Manyangadze, Mindu and Chimbari2023; Modabbernia et al. Reference Modabbernia, Meshgi and Kinsley2024). The effect of soil moisture level on the odds of F. hepatica antibody positivity might thus be diminished by the more pronounced effect of rainfall and temperature on the odds of F. hepatica antibody positivity in our multivariate model.
Previous studies yielded inconsistent results on the importance of temperature and rainfall as potential risk factors associated with or predictors of F. hepatica infections in cattle, based on antibody positivity in BTM or blood samples. Those inconsistencies could result from different time scales of weather variables, or the inclusion of other variables in the model, such as farm management and geographical characteristics (McCann et al. Reference McCann, Baylis and Williams2010; Kuerpick et al. Reference Kuerpick, Conraths, Staubach, Fröhlich, Schnieder and Strube2013; Novobilský et al. Reference Novobilský, Novák, Björkman and Höglund2015; Charlier et al. Reference Charlier, Ghebretinsae, Levecke, Ducheyne, Claerebout and Vercruysse2016; Munita et al. Reference Munita, Rea, Bloemhoff, Byrne, Martinez-Ibeas and Sayers2016). In our study, rainfall and temperature were included as monthly averages, instead of annual averages (Bennema et al. Reference Bennema, Ducheyne, Vercruysse, Claerebout, Hendrickx and Charlier2011; Charlier et al. Reference Charlier, Ghebretinsae, Levecke, Ducheyne, Claerebout and Vercruysse2016; Munita et al. Reference Munita, Rea, Bloemhoff, Byrne, Martinez-Ibeas and Sayers2016) or seasonal averages (Kuerpick et al. Reference Kuerpick, Conraths, Staubach, Fröhlich, Schnieder and Strube2013; Novobilský et al. Reference Novobilský, Novák, Björkman and Höglund2015; Munita et al. Reference Munita, Rea, Bloemhoff, Byrne, Martinez-Ibeas and Sayers2016). In the Netherlands, the life cycle of F. hepatica can only complete once per year, as temperatures fall below 10 °C during the winter which inhibits development of G. truncatula and F. hepatica larvae (Gaasenbeek et al. Reference Gaasenbeek, Over, Noorman and de Leeuw1992; Modabbernia et al. Reference Modabbernia, Meshgi and Kinsley2024). The risk of F. hepatica infection can thus vary between years, depending on how closely weather conditions during the spring-to-autumn period align with the optimal conditions for the survival, development and reproduction of each life stage of both G. truncatula and F. hepatica. If weather conditions remain favourable throughout the grazing season, high numbers of metacercariae can accumulate on pasture before the grazing season ends, thereby maximizing the risk of infection for cattle (Modabbernia et al. Reference Modabbernia, Meshgi and Kinsley2024). The importance of those seasonal weather conditions was confirmed by Munita et al. (Reference Munita, Rea, Bloemhoff, Byrne, Martinez-Ibeas and Sayers2016), who found that, in Ireland, seasonal weather patterns more strongly influenced the risk of F. hepatica infection than annual weather patterns (Munita et al. Reference Munita, Rea, Bloemhoff, Byrne, Martinez-Ibeas and Sayers2016). In our study, the odds of F. hepatica antibody positivity in BTM increase with higher rainfall in November and higher temperatures in October and December of the previous grazing season, across all soil types. McCann et al. (Reference McCann, Baylis and Williams2010) found comparable results for England and Wales, as the minimum temperature in October and the number of rain days in December of the preceding year were positively associated with F. hepatica antibody positivity in BTM (McCann et al. Reference McCann, Baylis and Williams2010). Those high temperatures accelerate the development of eggs and hatching of miracidia (Modabbernia et al. Reference Modabbernia, Meshgi and Kinsley2024). Furthermore, rainfall combined with temperatures above 10 °C in autumn could result in a second peak of juvenile G. truncatula (Charlier et al. Reference Charlier, Soenen, De Roec, Hantson, Ducheyne, Van Coillie, De Wulf, Hendrickx and Vercruysse2014a). These snails can get infected with miracidia from eggs shed in late summer and autumn, i.e. ‘winter infection’ of snails (Ollerenshaw, Reference Ollerenshaw1966). This overwintering infected snail population will shed cercariae during the following spring, which will increase the infection risk for cattle at the start of the grazing season and, consequently, could increase the odds of F. hepatica antibody positivity in BTM.
The model across soil types included multiple weather variables that could affect the ‘summer infection’ of snails, which is considered the predominant transmission pattern in temperate climates compared to the ‘winter infection’ of snails (Ollerenshaw, Reference Ollerenshaw1966; Shaka and Nansen, Reference Shaka and Nansen1979). Although those variables that may affect the ‘summer infection’ accounted for some variation in F. hepatica antibody positivity in BTM, pairwise comparisons between quartiles revealed few clear or consistent patterns. Notably, the odds of antibody positivity in BTM increased with heavy rainfall in April, whereas multiple studies suggest that heavy and abundant rainfall can wash free-living F. hepatica larvae and G. truncatula off pasture, thereby limiting the infection of snails and cattle (Bennema et al. Reference Bennema, Ducheyne, Vercruysse, Claerebout, Hendrickx and Charlier2011; Charlier et al. Reference Charlier, Ghebretinsae, Levecke, Ducheyne, Claerebout and Vercruysse2016). (Rapsch et al. Reference Rapsch, Dahinden, Heinzmann, Torgerson, Braun, Deplazes, Hurni, Bär and Knubben-Schweizer2008) used a monthly rainfall of 210 mm as threshold for the ‘wash effect’ in F. hepatica risk mapping, which lies within the range of the fourth quartile of daily rainfall sum in April (220 – 343 mm) in our study (Rapsch et al. Reference Rapsch, Dahinden, Heinzmann, Torgerson, Braun, Deplazes, Hurni, Bär and Knubben-Schweizer2008). In contrary, the ‘wash effect’ of G. truncatula could also disperse the snails to new sites along trenches (Smith et al. Reference Smith, Morgan and Jones2024). Our results seem to suggest that the F. hepatica benefits from the ‘wash effect’ if it occurs at the start of the grazing season, as G. truncatula would be exposed to newly hatched miracidia at more sites on pasture.
In contrast, the odds of F. hepatica antibody positivity decreased with higher temperatures in June. This effect was also found by McCann et al. (Reference McCann, Baylis and Williams2010), as an anomalous high temperature in April to July decreased the risk of F. hepatica infection (McCann et al. Reference McCann, Baylis and Williams2010). The first generation of G. truncatula often hatches in late spring and early summer in temperate climates (Charlier et al. Reference Charlier, Soenen, De Roec, Hantson, Ducheyne, Van Coillie, De Wulf, Hendrickx and Vercruysse2014a). High temperatures could lead to desiccation or aestivation of those snails, which will decrease the risk of infection of snails with miracidia (Smith et al. Reference Smith, Morgan and Jones2024). In addition to daily mean temperature, the effect of daily global radiation on the odds of antibody positivity in BTM was studied. Significant effects were only found in the model for farms on ‘sand soils,’ but the effect size was limited. Solar radiation may both favour and disrupt the life cycle of F. hepatica, although few studies have investigated this effect (Suhardono and Copeman, Reference Suhardono and Copeman2006; Iglesias-Piñeiro et al. Reference Iglesias-Piñeiro, González-Warleta, Castro-Hermida, Córdoba, González-Lanza, Manga-González and Mezo2016). Iglesias-Piñeiro et al. (Reference Iglesias-Piñeiro, González-Warleta, Castro-Hermida, Córdoba, González-Lanza, Manga-González and Mezo2016) found that daily global radiation up to 18,000 kJ/m2 was positively associated with G. truncatula abundance, which could result from the increased growth of microalgae on which G. truncatula feed (Iglesias-Piñeiro et al. Reference Iglesias-Piñeiro, González-Warleta, Castro-Hermida, Córdoba, González-Lanza, Manga-González and Mezo2016). In contrast, Suhardono and Copeman (Reference Suhardono and Copeman2006) found that all metacercariae of F. gigantica were killed within eight hours of direct sunlight and dry conditions in Indonesia (room temperature: 28 °C). Viability of metacercariae of F. hepatica was expected to be similar to F. gigantica under those conditions (Suhardono and Copeman, Reference Suhardono and Copeman2006).
The model across soil types explained 13.0% of the variation in F. hepatica antibody positivity in BTM, which is similar to studies that predicted the risk of F. hepatica infection in Sweden (15.8%) and Germany (14.3%) but much smaller than the study in England and Wales (70%) (McCann et al. Reference McCann, Baylis and Williams2010; Kuerpick et al. Reference Kuerpick, Conraths, Staubach, Fröhlich, Schnieder and Strube2013; Novobilský et al. Reference Novobilský, Novák, Björkman and Höglund2015). The low explained variance in F. hepatica antibody positivity in BTM indicates that more factors affect the risk of F. hepatica infection than the environmental factors. For example, farm management factors determine to which extent cattle are exposed to metacercariae and how many eggs are excreted onto pasture by infected cattle (Morgan and Wall, Reference Morgan and Wall2009). Factors like grazing on dry or wet pastures, flukicide treatment and access to surface water have previously been associated with F. hepatica antibody positivity in BTM (Munita et al. Reference Munita, Rea, Bloemhoff, Byrne, Martinez-Ibeas and Sayers2016; Takeuchi-Storm et al. Reference Takeuchi-Storm, Denwood, Hansen, Halasa, Rattenborg, Boes, Enemark and Thamsborg2017). Notably, cohort studies in Belgium (2006-2013) and Ireland (2009-2014) suggested that farm management practices more strongly influenced the risk of F. hepatica infection than (changing) weather patterns, as the observed decreasing seroprevalence in BTM over years could not be attributed to weather factors (Charlier et al. Reference Charlier, Ghebretinsae, Levecke, Ducheyne, Claerebout and Vercruysse2016; Munita et al. Reference Munita, Rea, Bloemhoff, Byrne, Martinez-Ibeas and Sayers2016). Furthermore, the proportion of explained variance may be limited by bias introduced through estimating the daily weather conditions per farm by interpolation, followed by aggregation of the daily estimates to monthly averages. The effects of short-term and/or local (extreme) weather conditions are not fully captured by the model, but could affect the life cycle of G. truncatula and F. hepatica (Modabbernia et al. Reference Modabbernia, Meshgi and Kinsley2024; Smith et al. Reference Smith, Morgan and Jones2024). A similar bias was present in the soil type variable, as several top-soils were aggregated into six soil types, and sub-soils were not considered in our study. Different combinations of top-soils and sub-soils define numerous soil profiles, each with distinct characteristics such as soil pH, texture, organic matter content and mineral availability (de Vries, Reference de Vries1999). These physical-chemical characteristics of the soil may affect the presence and abundance of G. truncatula on pasture and, consequently, the F. hepatica infection risk and the odds of antibody positivity in BTM (Smith et al. Reference Smith, Morgan and Jones2024).
The model for farms located on ‘clay-peat soils’ explained 8.4% of the variation, while the model for farms on ‘sand soils’ explained 13.4%, similar to the model across soil types. The lower explained variance in the model for farms on ‘clay-peat soils’ may result from its soil characteristics, as clay and peat soils provide moist environments which favour the habitat of both G. truncatula and free-living F. hepatica larvae (Joosten et al. Reference Joosten, Moen, Couwenberg, Tanneberger, Joosten, Tanneberger and Moen2017a; Smith et al. Reference Smith, Morgan and Jones2024). As a result, less variation in antibody positivity in BTM can be attributed to weather factors (rainfall and temperature), which do highly attribute in creating moist environments on the dry sand soils. Nonetheless, the general pattern of weather effects on antibody positivity in BTM observed in the stratified analyses was largely consistent with the pattern in the analyses across soil types, except for daily global radiation.
In our study, ELISA results were dichotomized into presence or absence of F. hepatica antibodies in BTM according to manufacturer’s instruction. Duscher et al. (Reference Duscher, Duscher, Hofer, Tichy, Prosl and Joachim2011) found that, using IDEXX ELISA, BTM was classified as antibody positive if the within-herd seroprevalence was ∼ 20% or higher (Duscher et al. Reference Duscher, Duscher, Hofer, Tichy, Prosl and Joachim2011). Previous studies reported an average within-herd prevalence of active F. hepatica infections, based on faecal egg counts, above 20% (May et al. Reference May, Brügemann, König and Strube2019; Hecker et al. Reference Hecker, Raulf, König, Knubben-Schweizer, Wenzel, May and Strube2024). Given the strong correlation between fluke burden in the liver and antibody titres in serum, the average within-herd seroprevalence will probably also exceed 20% (Djemai et al. Reference Djemai, Ayadi, Boubezari, Djafar and Mekroud2024). In our study, antibody positivity in BTM was based on a single sample per herd, which introduces some variability because herd composition and the relative contributions of individual cows to the BTM can change over time. Nevertheless, we do not expect that dichotomized ELISA results affected the validity of our analyses to identify potential risk factors for F. hepatica infection in Dutch dairy cattle herds. Our study population consisted of dairy cattle farmers who voluntarily participated in a programme in which antibodies against lungworm, gastrointestinal nematodes and F. hepatica were monitored in BTM. Although selection bias may have occurred due to non-random sampling, lungworm and gastrointestinal nematodes are more common and more widely distributed throughout the Netherlands than F. hepatica (Smits, Reference Smits2019). Our data included BTM samples from dairy herds across all provinces of the Netherlands, including regions where F. hepatica is not or only sporadically observed (Smits, Reference Smits2019). Therefore, we expect that a considerable number of farmers did not specifically participate in the programme to monitor F. hepatica, which reduces the impact of selection bias on the results. The associations between antibody positivity in BTM, weather and soil factors provided valuable insights into potential environmental risk factors for F. hepatica infection in Dutch dairy cattle herds. We interpreted these associations in context of the life cycle of F. hepatica. Data on seasonal variation in F. hepatica infection rates in G. truncatula on the pastures of the studied farms would have strengthened the evidence for these interpretations, but such data were not available due to the retrospective design of this study. Conclusions regarding causality should thus be drawn with caution, but the observed associations seem consistent with the well-established knowledge on the life cycle of F. hepatica.
Our study served as a first step to the development of a practical tool to predict the risk of F. hepatica infection in Dutch dairy cattle herds. Future research should focus on early detection of new F. hepatica infections during the grazing season in high risk areas, to support farmers and veterinarians in implementing more sustainable management strategies (Charlier et al. Reference Charlier, Vercruysse, Morgan, Van Dijk and Williams2014b). This is especially important because once F. hepatica has been established in an area, its spatial distribution seems to remain relatively stable over time (Silva et al. Reference Silva, Freitas, Dutra and Molento2016). Antibodies against F. hepatica can persist in the blood up to 6-8 months after successful treatment, which is probably prolonged if more sensitive ELISAs are used (Castro et al. Reference Castro, Freyre and Hernaández2000). Detection of new F. hepatica infections on dairy cattle farms that previously were infected is thus not feasible when relying only the presence or absence of antibodies in BTM, as detected antibodies could result from past or current infections. Therefore, it would be interesting to study an increase in S/P% values during the grazing season, as proxy for new F. hepatica infections, rather than the presence or absence of antibodies in BTM. When combined with data on (changes in) environmental and farm management factors, these changes in S/P% values could support the prediction of F. hepatica infection risk on farm level and identify changes in that risk compared to previous years (Charlier et al. Reference Charlier, Vercruysse, Morgan, Van Dijk and Williams2014b). If, for example, weather conditions at the end of the previous grazing season have predictive value, this could facilitate early detection of new F. hepatica infections during the grazing season. This prediction of a more subtle change in the herd’s infection status, using an increase in S/P%, would ideally be combined with predictions at a more detailed geographical level, e.g. pasture level (Jones et al. Reference Jones, Brophy, Davis, Davies, Emberson, Rees Stevens and Williams2018). This combination would allow farmers to act upon the predicted changes in infection risk, for example by applying more preventive grazing strategies (Beesley et al. Reference Beesley, Caminade, Charlier, Flynn, Hodgkinson, Martinez-Moreno, Martinez-Valladares, Perez, Rinaldi and Williams2018).
Given the current environmental changes, such as globally increasing temperatures and local rewetting of peat meadows, updated knowledge on the epidemiology of F. hepatica is needed. Our study contributes to this knowledge gap by identifying potential risk factors for F. hepatica infections in Dutch dairy cattle herds. Heavy clay and peat soils were identified as high risk areas, since the odds of F. hepatica antibody positivity in BTM were higher for those soil types compared to sand soils, but no evidence was found for relative soil moisture levels. Weather patterns that favour the ‘winter infection’ of G. truncatula seemed to increase the odds of antibody positivity in BTM during the next grazing season. Those results highlight the need for a prediction tool for F. hepatica infections in dairy cattle herds, which could facilitate early detection of new F. hepatica infections during the grazing season, thereby working towards sustainable control of F. hepatica infections on dairy cattle farms.
Supplementary material
The supplementary material for this article can be found at https://doi.org/10.1017/S0031182026101875.
Acknowledgements
The authors thank the dairy farmers who voluntarily participated in the monitoring programme, and thereby provided results on F. hepatica antibody positivity in bulk tank milk samples.
Author’s contribution
All authors conceived and designed the study. LN and MH conducted data gathering. LN performed the data analyses, assisted by GS and MH. LN wrote the first draft of the article. All authors critically reviewed the data analyses, the interpretation of results and the article.
Financial support
This study was conducted as part of the project ‘Wise with Worms’ (LWV22248, BO-63-001-066), which is co-financed by the Top Consortium for Knowledge and Innovation ‘Agri & Food’ by the Dutch Ministry of Agriculture, Fisheries, Food Security and Nature; private partners Royal GD, LTO Nederland, zLTO, LTO Noord, COV and Zoetis; and Dutch peat meadow provinces North-Holland, South-Holland, Utrecht, Overijssel, Friesland and Groningen.
Competing interests
The authors declare there are no conflicts of interest.
Ethical standards
Not applicable.


 Open access

