


The epidemic rise in the incidence of allergic disorders over the last two decades has prompted the search for therapeutic approaches that can mitigate allergic manifestations( Reference Tai, Volkmer and Burton 1 – Reference Asher, Montefort and Björkstén 3 ). Dietary ingredients such as probiotics, prebiotics and polyphenols have emerged as possible interventions with the potential to minimise the development of allergy symptoms in sensitised individuals( 4 – Reference Singh, Holvoet and Mercenier 6 ). Polyphenols, in particular, represent a broad family of about 5000 compounds that are found in abundance in our daily diet as various plant-derived food products( Reference Beecher 7 ). Polyphenols have been demonstrated to confer multiple health benefits ranging from their effects on the cardiovascular system( Reference Schroeter, Heiss and Balzer 8 ) to those exerted due to their anti-diabetic( Reference Si, Fu and Babu 9 ) and anti-inflammatory properties( Reference Jung, Triebel and Anke 10 , Reference Skyberg, Robison and Golden 11 ). Different polyphenol-enriched extracts have been evaluated for their anti-allergy benefits in pre-clinical models and clinical trial settings, where they have been shown to either affect allergic sensitisation or inhibit allergy symptoms during allergen re-exposure( Reference Akiyama, Sakushima and Taniuchi 12 – Reference Abril-Gil, Massot-Cladera and Perez-Cano 17 ).
However, the majority of studies conducted in the field have not used well-characterised polyphenol-enriched plant or fruit extracts at varying doses to demonstrate a beneficial health effect. These extracts contain numerous bioactive classes of polyphenols at a range of concentrations. In addition, very few studies dealing with allergic disorders have investigated the specific class of bioactive polyphenols and the required dosage to mediate a protective effect in pre-clinical or clinical settings.
To further build on these scientific observations, in the present study, we aimed to (1) identify the bioactive component in beneficial polyphenol-enriched extracts and determine the effective dose that confers in vivo benefits; (2) examine the impact of polyphenols on immunological events that dictate the sequelae of allergic responses, in particular, at the site of local inflammatory; and (3) establish a robust methodology to detect bioavailable metabolites whose presence matches the in vivo anti-allergic effect and subsequently investigate how these metabolites themselves affect the immune response( Reference Singh, Holvoet and Mercenier 6 ). Herein, we report that epicatechin is one of the key bioactive polyphenols mediating the observed anti-allergic effect. Epicatechin is a well-studied polyphenol belonging to the flavanol (flavan-3-ol) class of polyphenols that is abundantly present in cocoa, green tea and certain species of apples( Reference Actis-Goretta, Lévèques and Giuffrida 18 – Reference Vrhovsek, Rigo and Tonon 23 ). We also report for the first time that epicatechin exhibits in vivo efficacy for mitigating clinical symptoms in an ovalbumin (OVA)-induced murine model of food allergy.
Materials and methods
Ovalbumin food allergy model
The OVA food allergy model has been described previously( Reference Zuercher, Holvoet and Weiss 16 , Reference Cooper, Campos-Giménez and Jiménez Alvarez 24 ). Briefly, 6-week-old conventional female BALB/c OlaHsd mice (10–15 animals per group) (Harlan Laboratories) were sensitised via the oral route daily during the first 3 d and then at weekly intervals with 20 mg of OVA (Sigma) along with 10 μg/mouse of cholera toxin used as an adjuvant (List Biological Laboratories) for a continuous period of 7 weeks. Different polyphenol-enriched apple extracts (1 % included in the diet: extract A – Diana Naturals; extract B – Evesse apple extract manufactured by Coressence Limited and kindly supplied by Danisco-Dupont), a polyphenol-enriched cocoa extract (6 % included in the diet, obtained from Monteloeder) or purified epicatechin (1, 0·3 and 0·01 % included in the diet; Sigma) were mixed with powdered mouse chow pellets (Kliba Nafga), packaged in 50 g sachets and fed to the sensitised mice for 8 d (at the end of the sensitisation phase: days 42–49) (schematic representation shown in Fig. 1(a)). New sachets of the prepared diet were used to feed the mice daily and the amount of diet left at the end of the day was measured. Negative control (sensitisation with cholera toxin alone) and positive control (given the regular diet) groups of mice were included in the experiments to ascertain the efficacy of the treatments. The polyphenol content of the original mouse diet was also verified to minimise the effect of confounding variables in the experiments; no epicatechin was detected in the originally sourced mouse chow pellets. After the treatment period, all the sensitised mice were exposed to an oral challenge of 100 mg OVA. Starting 30 min after the challenge, the mice were individually observed for 30 min for allergic clinical symptoms. The allergy symptom score was calculated as follows: 0, no symptoms; 1, four to ten episodes of scratching around the nose and head and no diarrhoea; 2, more than ten episodes of scratching or presence of soft stools; 3, more than ten episodes of scratching and presence of soft stools or diarrhoea; 4, diarrhoea in combination with immobility, bristled fur, laboured respiration or cyanosis; 5, anaphylaxis. Any animal achieving a score of 4 in the experiments was immediately killed for ethical reasons. The mice were killed 4 h after the challenge, and blood, mesenteric lymph nodes, and segments from the last few centimetres of the ileum and jejunum were isolated and stored for further analysis. All investigators who performed the scoring were blinded during symptom evaluation, organ harvesting and subsequent in vitro cell-culture assays. All experiments were approved by the Nestec Internal Ethics Committee and the Service Vétérinaire of the Canton of Vaud, Switzerland (Authorisation no. 1970·1).
Ability of two different polyphenol-enriched apple extracts to affect allergy symptoms in sensitised mice. (a) Ovalbumin (OVA)-induced murine model of food allergy and timing of dietary intervention. (b) Allergy symptom scores after intervention with polyphenol-enriched apple extracts. (c) Distribution of allergy symptom scores (scale 0–4) in the different groups (0,  ; 1,
; 1,  ; 2,
; 2,  ; 3,
; 3,  ; 4,
; 4,  ), with 4 being the score indicating the severest symptom. (d) Drop in temperature (°C) recorded in the different groups before and after the challenge. (e) Concentration of OVA-specific IgG2a (μg/ml) in the different groups. Groups are represented as negative control (Neg cont, ■), positive control (Pos cont, □), apple extract A (
 ) and apple extract B (
 ). ** Mean value was significantly different from that of the positive control group (P< 0·01).

Analysis of the polyphenol composition of apple extracts
The polyphenol composition of the extracts used in the present study was analysed by HPLC as described previously( Reference Zuercher, Weiss and Holvoet 25 ). The polyphenol classes evaluated were flavonoids, mainly flavonols (catechin, epicatechin and procyanidins) and dihydrochalcones (phloridzin).
Quantitative determination of gene expression levels by real-time PCR (low-density arrays)
Total RNA were extracted from the ileal samples using the SV Total RNA Isolation System Kit (Promega) according to the manufacturer's protocol. RNA was quantified using the Quant-IT Ribogreen Reagent Kit obtained from Promega according to the manufacturer's protocol. Reverse transcription was carried out on 1 μg of total RNA using the Multiscribe Reverse Transcriptase Kit obtained from Applied Biosystems. Total RNA was mixed with 50 μm of random hexamers, 0·5 mm of deoxynucleotide triphosphates (dNTP), 20 U of RNase inhibitor (Applied Biosystems), 62·5 U of Multiscribe Reverse Transcriptase, 1 × RT buffer and 5·5 mm of MgCl2 in a final volume of 50 μl. Reverse transcription was carried out using a T3 thermocycler (Biometra) with the following cycle program: 10 min at 25°C; 30 min at 48°C; 5 min at 95°C; cycle completion at 4°C. Low-density arrays were designed online on the Applied Biosystems website. The samples were loaded and run on a quantitative ABI-Prism 7900HT system (Applied Biosystems) according to the manufacturer's protocol. Quantification values were normalised to the mean values of three housekeeping genes: β-actin; glyceraldehyde-3-phosphate dehydrogenase (GAPDH); hypoxanthine guanine phosphoribosyltransferase (HPRT). Based on the cycle threshold (C
t) values obtained, a relative and normalised mRNA expression level was determined for each gene using the ΔC
t method. The C
t value for each gene was corrected by the mean C
t value of the three housekeeping genes. The results were calculated as a relative expression using the following formula:
 $$2^{ - \Delta C _{t}} $$
× K, where K is a 106 factor, and expressed as arbitrary units. Fold increase in the expression levels of the experimental groups was normalised to those of the negative control group.
$$2^{ - \Delta C _{t}} $$
× K, where K is a 106 factor, and expressed as arbitrary units. Fold increase in the expression levels of the experimental groups was normalised to those of the negative control group.
Analysis of the bioavailable metabolites of epicatechin in the plasma of ovalbumin-sensitised mice
Plasma (200 μl) samples were analysed using a previously reported methodology( Reference Actis-Goretta, Lévèques and Giuffrida 18 ). Briefly, the samples were directly loaded onto a protein precipitation and phospholipid removal plate (Ostro; Waters Corporation). Plasma protein precipitation was ensured by adding 600 μl of acetonitrile to the samples and mixing the contents thoroughly with a pipette. Then, the samples were filtered using a vacuum manifold for 5 min and recuperated in a 1 ml collection plate. The extraction procedure was enhanced by including a washing step with 200 μl of methanol. Later, the eluates were dried to a residue at room temperature under a flow of N2. Finally, the residue was dissolved in 100 μl of 8 % acetonitrile in acidic water. Once the residue was resuspended, ( − )-epicatechin metabolites were separated by reversed-phase ultra-performance liquid chromatography using an Acquity UPLC HSS C18 2·1 × 100 mm, 1·8 μm column (Waters) equipped with a HSS C18 VanGuard pre-column (Waters) as described previously. The standardisation and validation of the methodology were done by analysing calibration samples prepared from plasma (concentration range: 0·025–5 μm). The procedure followed is summarised in Table S1 (available online).
Quantification of the serum concentrations of ovalbumin-specific IgE
The serum concentrations of OVA-specific IgE were quantified by ELISA. Plates (NUNC Maxisorp; VWR) were coated overnight at 4°C with rat anti-mouse IgE (2 μg/ml; BD Pharmingen). The wells were washed and then blocked with PBS containing Tween and 1 % bovine serum albumin (BSA) for 1 h at room temperature. Serially diluted sera and standard (monoclonal mouse anti-OVA; ABD Serotec) were incubated for 2 h at 37°C. Then, biotinylated OVA (4 μg/ml; US Biological) was added to the plates for 1 h at 37°C, followed by incubation with horseradish peroxidase (HRP) labelled streptavidin (1:200; R&D Systems) for 30 min at 37°C. The plates were developed with a tetramethylbenzidine substrate (KPL). The reaction was stopped with 1 m-HCl (Merck). Optical densities were measured at 450 nm. The concentrations of OVA-specific IgE were calculated by converting the optical density values in pg/ml using a polynomial standard curve.
Quantification of the serum concentrations of ovalbumin-specific IgG1 and IgG2a
The serum concentrations of anti-OVA IgG1 and IgG2a were quantified by ELISA. Briefly, microtitre plates were coated with OVA (Sigma) (100 mg/ml) overnight at 4°C. The wells were washed with PBS containing 0·05 % Tween (Bio-Rad) and then blocked with PBS containing 1 % BSA for 1 h at room temperature. Serially diluted standard (monoclonal mouse anti-OVA IgG1 and monoclonal mouse anti-OVA IgG2a from Antibody Shop; Lucerna-Chem) and sera were incubated for 2 h at 37°C, followed by incubation for 2 h with a HRP labelled goat anti-mouse IgG1 or IgG2a antibody (1:5000; Southern Biotech; Bioconcept). The plates were developed, read and analysed as described above.
Quantification of the serum concentrations of mouse mast cell protease 1
The serum concentrations of mouse mast cell protease 1 (mMCP-1) were quantified by ELISA (Moredun Scientific) according to the manufacturer's instructions. The concentrations of mMCP-1 were calculated by converting the optical density values in pg/ml using a polynomial standard curve.
Isolation and culture of mesenteric lymph node cells
Mesenteric lymph nodes were homogenised using a syringe plunger in a cell strainer (BD Falcon; Milian). The cells were centrifuged and washed two times with Roswell Park Memorial Institute (RPMI) medium (Sigma) supplemented with 10 % fetal bovine serum (Bioconcept), 1 % l-glutamine (Sigma), 1 % penicillin/streptomycin (Sigma) and 0·1 % gentamicin (Sigma), and 50 mm-β-mercaptoethanol (Sigma). The cells (3E5 cells/well) were cultured in a ninety-six-well flat-bottom plate (Corning, Milian) in the absence or presence of OVA (1000 μg/ml). After 72 h of culture, the plates (including the supernatant and cells) were frozen at − 20°C.
Determination of the concentrations of cytokines in mesenteric lymph node cultures
The concentrations of cytokines in cell-culture supernatants were determined with an electrochemiluminescence-based multiplex assay using the mouse TH1/TH2 4-Plex Kit (Meso Scale Discovery) according to the manufacturer's instructions.
Statistical analyses
All the outcome measures were analysed using a non-parametric approach. Kruskal–Wallis tests were used initially, followed by the Mann–Whitney–Wilcoxon tests for the group comparisons of interest (mainly tested ingredients v. positive control as well as positive control v. negative control). For each comparison between two groups, only raw Wilcoxon P values are reported, and results are considered significant if P value is ≤ 0·5.
Results
Ability of two different polyphenol-enriched apple extracts to modulate allergy symptoms in an ovalbumin-induced murine model of food allergy
We evaluated two different polyphenol-enriched apple extracts to assess their in vivo anti-allergic effect. The mice were sensitised via the oral route to the allergen OVA and cholera toxin given as an adjuvant. The polyphenol-enriched apple extracts (1 % in the diet) were administered to the sensitised mice for 8 d to determine whether the symptoms would be attenuated upon a challenge with a high dose of OVA (Fig. 1(a)). As shown in Fig. 1(b), the allergy symptom scores of the positive control group were significantly increased upon exposure to the OVA challenge when compared with those of the negative control group (P= 0·002). The allergy symptom scores of the two groups of sensitised mice fed diets containing polyphenol-enriched apple extracts were significantly different from those of the positive control group. No significant effect was observed on the allergy symptom scores of the group treated with polyphenol-enriched apple extract A (P= 0·65) when compared with those of the positive control group, whereas the allergy symptom scores of the group treated with polyphenol-enriched apple extract B were significantly decreased (P= 0·01) when compared with those of the positive control group. The distribution of allergy symptom scores based on their magnitudes across the different groups of mice is shown in Fig. 1(c). Both the positive control group and the apple extract A-treated group had a similar distribution, i.e. a greater percentage of mice with high allergy symptom scores (between 2 and 4), whereas the apple extract B-treated group had a higher percentage of mice with lower allergy symptom scores (between 0 and 1). The drop in temperature (measured before and after the challenge) was more evident in the positive control group and the apple extract A-treated group, whereas differences in temperature were minimal in the apple extract B-treated group (Fig. 1(d)). Among the circulating allergen-specific Ig in the plasma of the different groups of mice, interestingly, an increase in the concentrations of OVA-specific IgG2a was observed after treatment with apple extract B (P= 0·01; Fig. 1(e)). No significant changes in the concentrations of other specific Ig (OVA-specific IgE and OVA-specific IgG1) or mMCP-1 were observed in the experimental groups (data not shown).
Polyphenol composition analysis of apple extracts A and B
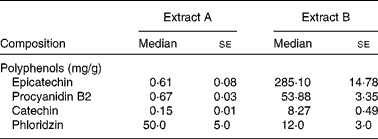
We analysed two apple extracts obtained from different suppliers and administered them in vivo to the OVA food allergy model to determine which bioactive factors contributed to the differential effect in vivo on allergy symptoms, as both were essentially advertised to be polyphenol-enriched extracts (Table 1). The analysis revealed the extracts to have similar levels of energy, fat and moisture. Interestingly, when the polyphenol concentrations of the two extracts were quantified, extract B was found to be highly enriched with flavanols, especially epicatechin (285·10 (se 14·78) mg/g) and its polymeric compounds, whereas extract A had minimal concentrations of this class of polyphenols (0·61 (se 0·08) mg/g). Extract A was found to be enriched with other classes of polyphenols such as phloridzin (5 % by weight equivalent to 50 mg/g), while extract B had minimal concentrations of polyphenol classes other than flavanols.
Polyphenol composition of the apple extracts (Median values with their standard errors)
Effect of oral administration of purified epicatechin and epicatechin-enriched cocoa extract on allergy symptoms in ovalbumin-sensitised mice
As the polyphenol-enriched apple extract that exhibited a significant anti-allergic effect had high concentrations of epicatechin, we investigated the effect of oral administration of purified epicatechin and another well-known epicatechin-enriched plant extract – cocoa extract – on allergy symptom scores in sensitised mice. In the first experiment (Fig. 2(a)), we administered either epicatechin (1 % included in the diet) or an epicatechin-enriched cocoa extract (6 % included in the diet, adjusted by the amount of epicatechin present as provided by the supplier) to the sensitised mice for 8 d. Compared with the positive control group, which had significantly increased allergy symptom scores when compared with the negative control group (P= 0·001), the 1 % epicatechin-treated group had significantly lower allergy symptom scores (P= 0·007). The same pattern was observed in mice treated with the epicatechin-enriched cocoa extract when compared with the positive control group (P= 0·04). The positive control group had an increased proportion of mice with very high allergy symptom scores ( ≥ 2) in comparison with the group treated with epicatechin 1 % or epicatechin-enriched cocoa extract (Fig. 2(b)). We subsequently investigated whether the anti-allergic effect of epicatechin was dose dependent. Epicatechin was included at three different doses (1, 0·3 and 0·01 %) in the diet of sensitised mice. The results of this experiment are shown in Fig. 2(c). Compared with those of the negative control group, the allergy symptom scores of the positive control group were significantly increased (P= 0·01); administration of epicatechin at low doses (0·01 %) had no effect on the allergy symptom scores of this group (P= 0·75) when compared with those of the positive control group. However, the allergy symptom scores of the 0·3 and 1 % epicatechin-treated groups were significantly decreased (P= 0·1 in the 0·3 % group and P= 0·03 in the 1 % group) when compared with those of the positive control group. The positive control group and the 0·01 % epicatechin-treated group had a greater percentage of mice with high allergy symptom scores (Fig. 2(d); 60 % or more animals in these groups had an allergy symptom score ≥ 2 upon a challenge with OVA) compared with the 0·3 and 1 % epicatechin-treated groups, which had a lower percentage of mice with high scores ( ≤ 25 % of the animals in the group).
Effect of epicatechin on allergy symptom scores. (a) Allergy symptom scores after dietary intervention with 1 % epicatechin (Epi,  ) or a cocoa extract enriched with epicatechin (
 ) in comparison with those of the negative control (Neg cont, ■) and positive control (Pos cont, □) groups. (b) Distribution of allergy symptom scores (scale 0–4) in the different groups (0,
  ; 1,
; 1,  ; 2,
; 2,  ; 3,
; 3,  ; 4,
; 4,  ), with 4 being the score indicating the severest symptom. (c) Dose-dependent effect of epicatechin included at three different doses (0·01 % Epi, 0·3 % Epi and 1 % Epi) in the diet on allergy symptoms. (d) Distribution of allergy symptom scores (scale 0–3) in the different groups (0,
  ; 1,
; 1,  ; 2,
; 2,  ; 3,
; 3,  ), with 3 being the score indicating the severest symptom. Mean value was significantly different from that of the positive control group: * P= 0·04, ** P= 0·03, *** P= 0·007.

Effect of oral administration of epicatechin on specific Ig (ovalbumin-specific IgE, IgG1 and IgG2a) concentrations and effector cell responses (mouse mast cell protease 1 and cytokines after mesenteric lymph node stimulation) in ovalbumin-sensitised mice
Significant differences were observed between the negative control group and the positive control group with regard to the concentrations of OVA-specific Ig, with the latter group having higher concentrations. The positive control group had higher concentrations (median values with their standard errors) of OVA-specific IgE (144·09 (se 70·27) ng/ml) than the 0·3 % epicatechin-treated group (89·11 (se 34·88) ng/ml) and the 1 % epicatechin-treated group (26·28 (se 13·31) ng/ml). The concentrations of OVA-specific IgG2a of the epicatechin-treated groups were higher (417·87 (se 146·16) ng/ml in the 0·3 % group and 916·41 (se 364·49) ng/ml in the 1 % group) than those of the positive control group (311·33 (se 148·73) ng/ml). No statistically significant differences were observed in the concentrations of OVA-specific IgG1, mMCP-1 or cytokines between the groups after the stimulation of mesenteric lymph nodes (Tables 2 and 3).
Concentrations of specific immunoglobulins and mouse mast cell protease 1 (mMCP-1) in ovalbumin (OVA)-sensitised mice(Median values with their standard errors)

Concentrations of cytokines in ovalbumin-stimulated mesentric lymph node cells(Median values with their standard errors)

IFN-γ, interferon-γ.
Effect of oral administration of epicatechin on gene expression (cytokines and T-cell function-regulating transcription factors) in the small intestine of ovalbumin-sensitised mice
To further elucidate the effect of oral administration of epicatechin at the site of local inflammation, we determined the mRNA expression levels of various genes involved in T-cell-mediated immune responses in the ileum by real-time PCR. The gene expression levels of T-helper (Th)-1 cell (IL-12a) and Th-2 cell (IL-13) cytokines and transcription factors (T-box transcription factor 21 (T-bet) and GATA-binding protein 3 (GATA-3)) that, respectively, regulate the Th-1 and Th-2 cell responses were investigated in the ileum after the administration of epicatechin along with those of other relevant immune genes (IL-10, IL-17A and IL-22). The positive control group exhibited higher relative expression of both Th-1 and Th-2 cell-related cytokine genes in the ileum in comparison with the negative control group. The expression of GATA-3 in the 0·3 % epicatechin-treated group was significantly affected when compared with that in the positive control group (Fig. 3(a); P= 0·07), whereas the expression of T-bet in the 1 % epicatechin-treated group was significantly lower (Fig. 3(b); P= 0·03). The 1 % epicatechin-treated group also exhibited lower relative gene expression of both the allergy-related Th-2 cell-related cytokine IL-13 (Fig. 3(c); P= 0·1) when compared with the positive control group and the Th-1 cell-related cytokine IL-12a (Fig. 3(d); P= 0·07). The expression of other genes investigated, such as IL-10 (Fig. 3(e)) and IL-17 (data not shown), was not affected after treatment with epicatechin in the sensitised mice. Interestingly, a dose-dependent increase in the expression of IL-22 in the ileum of the epicatechin-treated groups was observed (Fig. 3(f)), but it was only suggestive, as it was not statistically significant.
Effect of epicatechin on T-helper (Th)-1 and Th-2 cell-related cytokine gene expression in the ileum. Genes that were evaluated were (a) GATA-binding protein 3 (GATA-3), (b) T-bet, (c) IL-13, (d) IL-12a, (e) IL-10 and (f) IL-22. Groups are represented as negative control (Neg cont, ■), positive control (Pos cont, □), 0·01 % epicatechin (Epi,  ), 0·3 % Epi (
 ) and 1 % Epi (
 ). * Mean value was significantly different from that of the positive control group (P= 0·003).

Epicatechin metabolites present in the plasma of allergic mice and relationship of bioavailable metabolite concentrations with allergy symptom scores
We hypothesised that the anti-allergic effect of epicatechin could be due to a systemic effect after its oral administration. To address this hypothesis, we aimed to correlate the anti-allergic effect observed with epicatechin bioavailability. After oral absorption, epicatechin is rapidly transformed into its conjugated metabolites. We first validated our previously reported methodology for detecting epicatechin metabolites in mouse plasma (Table S1, available online). Bioavailable metabolites detected in mouse plasma were distributed into three main classes, namely glucuronides, methylated glucuronides and sulphated metabolites, with the 4′-O-glucuronide and 7′-O-glucuronide metabolites being the major classes of circulating compounds in mice (Fig. 4(a)). Interestingly, the epicatechin metabolite profile of mice significantly differs from that previously found in human plasma( Reference Actis-Goretta, Lévèques and Giuffrida 18 ). Due to the experimental protocol, animals in the food allergy model could have different amounts of epicatechin in the plasma during the experiment. Next, we investigated whether the concentrations of total epicatechin metabolites in the plasma of allergic mice had any relationship with the intensity of allergy symptoms after the OVA challenge in sensitised mice. In Fig. 4(b), the concentrations of the detected bioavailable epicatechin metabolites in the different groups of allergic mice, i.e. treated, respectively, with 1, 0·3 and 0·01 % of epicatechin included in the diet, are shown. The 1 % epicatechin-treated group had the highest concentrations of bioavailable epicatechin metabolites in comparison with the 0·3 and 0·01 % epicatechin-treated groups. On comparison of the concentrations of the total epicatechin metabolites in each allergic mouse with their corresponding allergy symptom scores (n 43 mice, all mice from the 0·01, 0·3 and 1 % epicatechin-treated groups were pooled), mice that had lower allergy symptom scores (0–1) were found to have higher concentrations of bioavailable epicatechin metabolites in their plasma than those having higher allergy symptom scores (2–3) and lower concentrations of bioavailable epicatechin metabolites (Fig. 4(c)).
Concentrations of ( − )-epicatechin metabolites and their relationship with allergy symptom scores. (a) Panel of various ( − )-epicatechin metabolites in the epicatechin-treated mice. (b) Total ( − )-epicatechin metabolite concentration (nm) measured in the plasma of treated mice in the three different groups: 1 % epicatechin (Epi); 0·3 % Epi; 0·01 % Epi. (b) Correlation between total ( − )-epicatechin metabolite concentration (nm) measured in the plasma of treated mice (n 43 mice) and allergy symptom scores recorded in individual animals.

Discussion
We and others have previously reported on the beneficial effect of polyphenol-enriched plant extracts in experimental animal models of allergy( Reference Akiyama, Sakushima and Taniuchi 12 , Reference Zuercher, Holvoet and Weiss 16 , Reference Abril-Gil, Massot-Cladera and Perez-Cano 17 ). A few clinical trials carried out using polyphenol-containing apple extracts have also shown that their consumption leads to the alleviation of allergy symptoms such as runny nose and nasal congestion in subjects suffering from allergic rhinitis( Reference Enomoto, Nagasako-Akazome and Kanda 13 , Reference Kishi, Saito and Saito 14 ). Polyphenols are a heterogeneous class of bioactive compounds that are abundantly present as multiple classes across several plant and fruit species( Reference Beecher 7 ). Currently, there is no necessary dietary intake recommendation for polyphenols, although it is estimated that the combined intake from various plant and fruit resources totals about 1 g/d in certain diets across the world( Reference Perez-Jimenez, Fezeu and Touvier 26 , Reference Valls-Pedret, Lamuela-Raventós and Medina-Remón 27 ). In plant extracts, numerous classes of polyphenols with a potential to exert beneficial effects on health, e.g. with respect to immune disorders, have been described previously( Reference Mackenzie, Carrasquedo and Delfino 28 , Reference Okada, Oh-Oka and Nakamura 29 ). We found that the two polyphenol-enriched apple extracts (>40 % enriched with polyphenols) evaluated in the present study had different in vivo efficacy to modulate allergy symptoms.
Herein, we report the discovery of epicatechin as one of the key bioactive polyphenols within the matrices of plant extracts that exhibit a beneficial anti-allergic effect. Although the oral administration of epicatechin attenuated allergy symptoms in a dose-dependent manner, polyphenol-enriched extracts with minimal concentrations of epicatechin had no impact on allergy symptoms. These findings are novel and suggest that foods rich in epicatechin, such as apples and cocoa, may exert an anti-allergic effect in individuals suffering from allergic disorders. Alternatively, pharmaceutical-grade preparations specifically containing epicatechin at an optimal dosage could also bring relief to those suffering from allergy symptoms.
We have previously observed in our mouse model that mucosal allergen challenge via the oral route following sensitisation results in the local up-regulation of immune cytokines in the ileum( Reference Cooper, Campos-Giménez and Jiménez Alvarez 24 ). With this knowledge, we next investigated whether purified epicatechin delivered via the diet to sensitised mice has an immunological effect at the site of local inflammation, i.e. the ileum of allergic mice. Epicatechin at the doses of 0·3 and 1 % had an impact on the expression of both Th-1 and Th-2 cell-related cytokine genes. The relative gene expression of IL-13, IL-12a and T-bet in the 1 % epicatechin-treated group was decreased when compared with that in the positive control group, while the relative gene expression of GATA-3 was significantly affected in the 0·3 % epicatechin-treated group. These findings, which correlate well with the observed effect of epicatechin treatment on clinical symptoms, are reflective, in general, of the potential effect that epicatechin can have on both the Th-1 and Th-2 arms of the adaptive immune response. It can be argued that a decrease in the gene expression of T-bet locally at the site of inflammation may further bias the Th-2 cell-driven response observed in our model; however, the adaptive immune response to a foreign antigen involves a complex interplay of many cell- and tissue-related players. The T-helper cell response, as we know today, is simply not just restricted to a Th-1 or a Th-2 bias, but can exist in many phenotypes (Th-17, regulatory T cell (Treg), Th-9 and Th-22), and this is highly dependent on the context of the inflammatory response. In line with our observations are the results of previous studies demonstrating a beneficial effect of apple extracts enriched with polyphenols on both Th-1( Reference Skyberg, Robison and Golden 11 ) and Th-2 diseases( Reference Zuercher, Holvoet and Weiss 16 , Reference Abril-Gil, Massot-Cladera and Perez-Cano 17 ). Interestingly, we also observed a dose-dependent up-regulation of IL-22 relative gene expression in the ileum after the administration of epicatechin. IL-22 is an immune-modulatory cytokine that has recently been described to play an important role at mucosal surfaces( Reference Ouyang and Valdez 30 ). IL-22 is thought to be secreted by innate lymphoid-like cells that line mucosal surfaces and has been shown to inhibit inflammation in a murine model of allergic airway disease( Reference Taube, Tertilt and Gyulveszi 31 ). It has recently been reported in the literature that one of the signalling pathways implicated in the up-regulation of IL-22 gene expression involves the aryl-hydrocarbon receptor, for which flavonoids and other dietary polyphenols are the well-known ligands( Reference Monteleone, Rizzo and Sarra 32 ). Our observations related to IL-22 are preliminary in nature, but warrant future investigations into the role of IL-22 and aryl-hydrocarbon receptor following the administration of epicatechin.
A majority of the absorbed native polyphenols are extensively converted into conjugated metabolites and circulate within different systemic compartments( Reference Mullen, Borges and Lean 33 – Reference Urpi-Sarda, Ramiro-Puig and Khan 35 ). The beneficial anti-allergic effect can probably be the result of the generation of these metabolites in vivo within the host. Epicatechin metabolites and their kinetics of appearance in the systemic circulation have been well studied in human subjects( Reference Actis-Goretta, Lévèques and Giuffrida 18 , Reference Roura, Almajano and Bilbao 34 , Reference Baba, Osakabe and Yasuda 36 ). However, no previous studies have reported the detection or a profile of these metabolites in mice. We established a robust detection assay to detect in vivo epicatechin metabolites in the plasma of mice. The extensive profile of epicatechin metabolites in mice comprises glucuronides and sulphated and methylated metabolites. When we matched the bioavailable epicatechin metabolite concentrations measured in the plasma of allergic mice with individual allergy symptom scores of the epicatechin-treated mice, we found that mice that had lower allergy symptom scores had increased concentrations of bioavailable metabolites of epicatechin. This is an intriguing and relevant finding, which suggests that bioavailability measurements should be taken into consideration in experimental settings where the bioefficacy of a dietary intervention is investigated to better understand the variable responses in a group of experimental subjects or animals.
In summary, we report novel results that identify epicatechin as an anti-allergic agent. Epicatechin when administered at higher doses or epicatechin-enriched polyphenol extracts administered orally by inclusion in diet suppress allergy symptoms. This effect may result from direct signalling to host receptors leading to a local effect at the site of inflammation and/or from a systemic effect mediated by the epicatechin-derived metabolites; this does not exclude the possibility that other major bioactive components, i.e. other polyphenols such as catechin, procyanidin B1 and procyanidin B2 within the matrix of apple or cocoa extracts, could play an important role as well and have an impact on allergic manifestations. Future studies should investigate the role of some of these components within the matrix and address the cellular immune mechanisms and signalling pathways involved in the described anti-allergic effect. We also established a metabolite profile that allows systemic tracking of the therapeutic effect of epicatechin. These findings remain to be investigated in translational settings (we have begun preliminary investigations into the immunological profile of epicatechin metabolites using human ex vivo assays; Fig. S1, available online) and in human clinical trials to ascertain the anti-allergic effect of epicatechin.
Supplementary material
To view supplementary material for this article, please visit http://dx.doi.org/10.1017/S0007114514000877
Acknowledgements
The authors cordially thank Dupont and Coressence Limited for kindly providing the apple Evesse extract and for helpful discussions on the manuscript.
The authors' contributions are as follows: A. S., A. D., L. A.-G., S. H., A. L., S. N. and A. M. designed the research; A. S., A. D., L. A.-G., S. H. and A. L. conducted the research; A. S., A. D., L. A.-G., S. H., A. L. and M. L. analysed the data; A. S., A. D., L. A.-G., S. N. and A. M. wrote the final paper. All authors read and approved the final manuscript.
All co-authors are employees of Nestec S.A., which funded the study. A. S., L. A.-G., S. H., A. M. are listed as co-inventors on a provisional patent application describing the anti-allergic effect of epicatechin.



