


Introduction
Political responsiveness and political equality are fundamental aspects of representative democracy. Yet, the reality is that not everyone has equal access to power; certain groups of constituents—typically minority or otherwise disadvantaged groups—experience considerably less responsive legislators and weaker representation of their interests more generally (Butler and Broockman Reference Butler and Broockman2011; Canon and Posner Reference Canon and Posner1999; Grose Reference Grose2011; Mansbridge Reference Mansbridge1999). Understanding the nature of such inequalities and, concomitantly, the potential means for furthering more equal representation, are core questions for political science, as their answers carry implications for fundamental discussions about the quality—and equality—of democracy.
A large body of research demonstrates that politicians are more likely to advance the preferences of constituents with whom they share personal characteristics, especially in terms of race and ethnicity (Canon and Posner Reference Canon and Posner1999; Carnes Reference Carnes2012; Grose Reference Grose2005; Iyer et al. Reference Iyer, Mani, Mishra and Topalova2012; Nye, Rainer, and Stratmann 2011). For example, white legislators are significantly less likely than are Black legislators to support policies that specifically benefit Black communities (Grose Reference Grose2011), and race and ethnicity influence how much time and effort politicians spend on behalf of their constituents in oversight of bureaucratic policy making (Minta Reference Minta2009). There is also ample evidence that such in-group favoritism manifests itself directly in the legislator-constituent relationship. Several recent field experimental audit studies of legislator responsiveness to simple constituent requests—a simple, but face-valid indicator of legislator attention to constituent concerns—show that politicians are more responsive to citizens with whom they share race or ethnicity (Broockman Reference Broockman2013; Butler and Broockman Reference Butler and Broockman2011; Gell-Redman et al. Reference Gell-Redman, Visalvanich, Crabtree and Fariss2018; Mendez and Grose Reference Mendez and Grose2018). For example, when state legislators are asked for help with voter registration, Black voters are significantly less likely to receive an answer from white legislators, whereas the reverse pattern is true for Black legislators responding to white constituents (Butler and Broockman Reference Butler and Broockman2011; McClendon Reference McClendon2016). Because racial and ethnic minority groups tend to be descriptively underrepresented among elected politicians (Bloemraad Reference Bloemraad2013; Dancygier et al. Reference Dancygier, Lindgren, Oskarsson and Vernby2015), such ethnocentric legislator behavior implies unequal access to policy making—and, consequently, unequal inclusion in democracy—for these groups.
Departing from the pervasive finding of ethnocentric responsivenessFootnote 1 and existing work on the underlying motivations that animate such legislator behavior, this paper asks under which circumstances parity in responsiveness occurs. Ultimately, this is the question of interest from the perspective of ethnic minorities, who experience lower legislator responsiveness and poorer constituency service more generally. More specifically, we contribute to the debate about legislator responsiveness by proposing and testing two potential explanations for the occurrence of equal responsiveness. Originating in pluralist theories of democracy (Dahl Reference Dahl1967), the first explanation—which we label the electoral incentives hypothesis—builds on the assumption that politicians are extrinsically motivated, specifically in regard to obtaining (re)election, and therefore respond to electoral incentives (Alt, Bueno de Mesquita, and Rose Reference Alt, de Mesquita and Rose2011; Fenno Reference Fenno1978). In essence, this “structural” perspective predicts that if elections are sufficiently competitive, this will crowd out concerns other than (re)election and, in turn, animate instrumental legislators to be responsive to their constituents, independent of their ethnic background (or any other characteristic), in order to gain their votes (Fenno Reference Fenno1978). In other words, this perspective predicts that under sufficiently competitive elections, we should observe no differences in legislators’ responsiveness towards minority and majority constituents.
The second explanation, which we refer to as the candidate selection hypothesis, makes no assumptions regarding the motivations of legislators but instead puts individual voters in focus by emphasizing their ability to identify politicians that are (more) responsive to them. Because acquiring the information necessary to determine responsive politicians is demanding, we expect voters to resort to heuristics—cognitive shortcuts—that reduce these costs (Lau and Redlawsk Reference Lau and Redlawsk2001; Lupia and McCubbins Reference Lupia and McCubbins1998). Candidate co-ethnicity is perhaps the simplest example of this (Brady and Sniderman Reference Brady and Sniderman1985; Popkin Reference Popkin1994), and previous work indicates that this is indeed an efficient heuristic for legislator responsiveness (Butler and Broockman Reference Butler and Broockman2011). We also probe this heuristic here, but given its limited applicability in our context, we focus primarily on two other types of heuristics regarding legislator responsiveness: legislators’ partisan affiliation and their stated policy preferences. The party serves as a “low-cost” heuristic, potentially enabling voters to identify groups of responsive (on average) politicians. Obtaining individual legislators’ stated preferences is costlier in information-seeking terms, but it is also more efficient as politicians may vary in responsiveness within parties.
We assess the hypothesized explanations vis-à-vis legislator responsiveness to ethnic minorities (immigrants) by combining a field experiment eliciting the responsiveness of incumbent local politicians in Denmark by asking for their help in locating polling stations in the upcoming municipal election with auxiliary observational data on electoral performance (seat winning margin), politicians’ decision to run for reelection, and their stated preferences on a range of policy issues gauged via a voting advice application. Following previous work, in the field experiment, each politician was randomly treated with a name (“alias”) that signaled ethnicity (majority Danish/Middle Eastern-origin), gender (male/female), and personal voting intention (included or not), specifically stating the intention to vote for the politician in question in the upcoming election. The observational data serve to assess the two hypotheses in various auxiliary analyses building on the field experimental data.
We report several important findings. First, as a baseline result, we replicate previous findings of ethnocentric responsiveness—from the United States and South Africa—in the Danish setting, thereby indicating that in-group favoritism is a more general phenomenon and not confined to specific racial or ethnic out-group constellations. Second, focusing on majority legislators, we address the electoral incentives hypothesis by analyzing responsiveness among a subset of legislators with strong electoral incentives for responding to constituent requests. We find little evidence that even very strong electoral incentives reduce majority legislators’ ethnocentric responsiveness. Third, we scrutinize the candidate selection hypothesis, and the predicted use of the two heuristics, by breaking down responsiveness by, first, legislator’s party affiliation and, second, their individually stated policy preferences on immigration—the political issue we expect to be most predictive of ethnocentric responsiveness given its conceptual proximity. We find that using party affiliation is an effective strategy for locating legislators that are more responsive; in fact, incumbents from the most pro-immigration parties do not display statistically distinguishable bias in relative responsiveness vis-à-vis ethnic majorities and minorities. There is also considerable variation in immigration policy preferences between individual candidates, and we find that these preferences are strongly predictive of responsiveness within parties, thus implying that even within a relatively immigration-skeptic party (e.g., the centre-right party Venstre or the center-left party, Socialdemokratiet), higher responsiveness can be obtained by locating a pro-immigration candidate.
Group-Centric Responsiveness: Previous Work and Our Approach
Responsiveness to constituency concerns and questions expressed in their queries is a principal activity of local politicians and an essential feature of legitimate democratic representation (Fenno Reference Fenno1978; Fiorina Reference Fiorina1989; Grose Reference Grose2011). Assisting voters, especially with answering service questions unrelated to policy issues, is also a relatively easy way for politicians to reach out to voters to gain trust and enhance their reputations (Butler, Karpowitz, and Pope Reference Butler, Karpowitz and Pope2012; Cain, Ferejohn, and Fiorina Reference Cain, Ferejohn and Fiorina1987). Accordingly, high-quality and prompt responsiveness offers a pathway for politicians to maximize their electoral prospects. This is especially true in local elections where a few personal votes are often decisive for the electoral outcome.
Despite the potential electoral benefits of being responsive to their constituents, existing research demonstrates that politicians exhibit in-group favoritism in their communication to constituents. Specifically, several recent field experiments on legislator responsiveness—predominantly in the US context—show that politicians are more likely to respond to citizen requests for constituency service from those with whom they share a racial or ethnic background (e.g., Broockman Reference Broockman2013; Butler and Broockman Reference Butler and Broockman2011; Gell-Redman et al. Reference Gell-Redman, Visalvanich, Crabtree and Fariss2018; Mendez and Grose Reference Mendez and Grose2018).Footnote 2 For example, when state legislators are asked for help with voter registration, Black voters are significantly less likely to receive an answer from white legislators, whereas the reverse pattern is true for Black legislators responding to white constituents (Butler and Broockman Reference Butler and Broockman2011). Similarly, majority (white) American legislators are less responsive to Latino and Asian constituents compared with white constituents (Gell-Redman et al. Reference Gell-Redman, Visalvanich, Crabtree and Fariss2018; Mendez and Grose Reference Mendez and Grose2018). Considering that these groups are politically underrepresented relative to ethnic or racial majorities, the differential treatment by legislators implies that they are disadvantaged in their access to policy making. Moreover, the lack of quality and inclusiveness of political representation negatively affects minorities’ political participation and trust in government (Banducci, Donovan, and Karp Reference Banducci, Donovan and Karp2004; Mansbridge Reference Mansbridge1999).
The observed unequal responsiveness has raised the question of what motivates legislators to be more or less responsive to ethnic in- and out-groups. Theoretically, the observed ethnocentric responsiveness has been viewed primarily through the lens of legislators’ underlying motivations, distinguishing between strategic (instrumental) considerations, which are typically related to (re)election (extrinsic motivations), and noninstrumental considerations, which relate to values (e.g., out-group distaste or in-group loyalty—intrinsic motivations).
According to the former perspective, utility-maximizing politicians respond to constituent requests, including non-policy ones, as a way to vote-maximize (Fenno Reference Fenno1978). It follows from this proposition that politicians act in a strategic manner by investing fewer resources in voters less decisive for their reelection chances. Since constituents’ personal characteristics might serve as a cue of partisanship and the propensity to vote in elections, such motives may explain why political candidates—especially within parties not widely supported by racial or ethnic minorities—are less responsive to minority voters (Broockman Reference Broockman2013; Grose Reference Grose2011). The other class of motives—intrinsic motivations—suggests that legislators are animated by “a private preference for others’ well-being” (Ariely, Bracha, and Meier Reference Ariely, Bacha and Meier2009, 544; see also Broockman Reference Broockman2013). However, this often manifests itself asymmetrically so that they advance the interests of voters that share their own personal characteristics due to in-group affirmation or loyalty (Broockman Reference Broockman2013). The underlying motivations for legislators’ lack of responsiveness toward racial and ethnic minority groups are difficult to disentangle, but existing evidence indicates that while strategic incentives matter (Gell-Redman et al. Reference Gell-Redman, Visalvanich, Crabtree and Fariss2018; Janusz and Lajevardi Reference Janusz and Lajevardi2016), this mechanism explains only a portion of the observed differential treatment (Butler and Broockman Reference Butler and Broockman2011). In the absence of any extrinsic motivations, legislators still favor in-group constituents (Broockman Reference Broockman2013), thereby indicating a role for intrinsic motivations in unequal responsiveness.
Mitigating Ethnocentric Responsiveness: The Role of Electoral Incentives and Candidate Selection
In this paper, we build on the existing research on ethnocentric responsiveness and the underlying motivations outlined above and ask a related, but different research question than previous studies. Specifically, departing from the prevalent finding of ethnocentric responsiveness, we explore when—under which circumstances—this differential treatment is curbed. Pinpointing the conditions under which disparity in responsiveness occurs is an important first step in understanding the options for countering it.
We scrutinize two explanations for when equal responsiveness occurs among legislators. The first explanation, manifested in the electoral incentives hypothesis, departs from the above-mentioned assumption that politicians are motivated by strategic considerations and therefore seek office by investing more time appealing to voters who are likely to cast a vote for them (Fenno Reference Fenno1978; Mayhew Reference Mayhew1974). As a consequence, if politicians compete in sufficiently competitive elections, we would expect them to be more responsive to their constituents independent of their ethnic background because they cannot afford to be irresponsive to certain parts of the electorate. Based on this rationale, we hypothesize that an increase in electoral incentives will result in (i) higher overall responsiveness and, most importantly for our research question, (ii) less differential treatment based on ethnicity. This notion is supported by previous studies suggesting that electorally unsafe legislators are more responsive to their constituents (Cain, Ferejohn, and Fiorina Reference Cain, Ferejohn and Fiorina1987; Freeman and Richardson Reference Freeman and Richardson1996). To test the implications of the electoral incentives hypothesis for curbing responsiveness bias, we explore how majority legislators’ responsiveness varies by strong electoral incentives, including an experimental manipulation of a personal vote cue.
The second explanation, yielding the candidate selection hypothesis, switches the focus to individual voters and their ability to identify politicians who are likely to be responsive. It is generally demanding to identify such legislators, which makes it likely that voters use complexity-reducing heuristics—cognitive shortcuts—to select a candidate (Popkin Reference Popkin1994; Sniderman, Brody, and Tetlock Reference Sniderman, Brody and Tetlock1991). More specifically, we expect two heuristics to be particularly effective in this regard.Footnote 3 First, as a simple, but likely effective, heuristic, immigrant-origin voters may be able to use parties’ policy images on specific issues as a signal of the likelihood of responsiveness. Indeed, the efficacy of the party-label heuristic for identifying responsive legislators is supported by evidence from the US context, where studies have demonstrated a partisan divide in legislators’ bias towards Latino constituents (Gell-Redman et al. Reference Gell-Redman, Visalvanich, Crabtree and Fariss2018; Janusz and Lajevardi Reference Janusz and Lajevardi2016). More specifically, we focus on the policy area of immigration and integration of immigrants. This is based on the rationale that such positions are likely to reflect—at least partly—latent sym- or antipathy towards immigrants, which we also expect to influence responsiveness towards this group. As such, policy positions towards immigration/immigrants are plausibly a strong heuristic for immigrant constituents when trying to identify responsive legislators. Because other policy areas do not directly link to immigrants as a group in the same way, they are unlikely to be as informative vis-à-vis responsiveness towards immigrant constituents.
Second, in addition to relying on party heuristics, voters may resort to a higher “information cost” strategy, in terms of using stated legislator preferences on specific policy issues, to identify responsive legislators. This hinges on two assumptions: first, that there is within-party variation in incumbents’ policy positions and, second, that voters have meaningful ideas about these policy positions. Below, we verify the first assumption empirically and provide indications that the second is also likely to be met in our setting. Highlighting the potential relevance of focusing on legislator policy positions, Mendez and Grose (Reference Mendez and Grose2018) demonstrate that legislators who vote for restrictive voting laws are more likely to exhibit responsiveness bias towards Latino constituents. This suggests that candidates’ individual policy preferences are indicative of their responsiveness to ethnic minority voters.Footnote 4 As for parties in the aggregate, we again focus on policy positions on immigration, which is further justified by Mendez and Grose’s finding.
In essence, the candidate selection hypothesis asks whether the bias in responsiveness observed in previous work is inescapable. If the differential treatment spans parties and even extends to individual legislators, who explicitly voice policies that favor minority groups, it leaves immigrant-origin voters with few tools to obtain equality in responsiveness.
Empirical Context: Municipal Politics in Denmark
We study responsiveness among legislators in the context of local politics in Denmark. There are 98 municipalities in Denmark, which range between approximately 2,000 and 600,000 inhabitants. The members of the city councils are elected every four years under a proportional electoral system. For the 2017 election, 9,558 candidates were competing for 2,432 seats in the local councils. The legislators receive a substantial salary (varying by committee membership, etc.), but typically only mayors are full-time politicians.
A number of features of Danish local politics makes it a nearly ideal setting for studying potential ethnocentric bias in responsiveness among legislators, more generally, and for addressing our two proposed hypotheses regarding when responsiveness occurs, more specifically. First, municipalities are politically and administratively highly significant in Denmark. The municipality councils are responsible for around 50% of government expenditures on public spending, including services such as schools, infrastructure, and social benefits, and they enjoy a large degree of financial and political autonomy. Local elections thus have real consequences for constituents, which in turn means that they enjoy high attention from parties, the media, and voters. High turnout—70.8% in the last election in 2017—is one clear indication of that.Footnote 5 Second, relevant for our research question, and in contrast to national elections, noncitizens are allowed to vote provided that they hold a residency permit and have lived uninterrupted in Denmark for more than three years prior to the election (at the time of the 2017 election). In other words, even individuals with a status as refugees could vote in the 2017 election after three years of residency. This makes requests to legislators from immigrants (broadly conceived) a likely scenario. Third, local politicians in Denmark report that they use requests from citizens to influence agendas in the councils to a considerable extent (Pedersen et al. Reference Pedersen, Houlberg, Hansen, Olsen and Bordacconi2013). There is thus strong reason to believe that local legislators take such requests seriously and therefore potentially also respond to them. Fourth, with a few exceptions—most notably the far-left party (the Red-Green Alliance)—the established parties predominantly use an open-list system in most municipalities. Therefore, personal votes within the party decide which candidates win a seat. Further, the median candidate across all major parties received less than 100 votes, thereby indicating that for many candidates, a few additional votes can be decisive for their chances of winning a seat. By implication, they have a strong electoral incentive for constituency service in general, thereby rendering the electoral competitiveness hypothesis plausible ex ante. Fifth, the Danish multiparty system, which is also present at the municipal level, provides a good case for testing the hypothesis that parties’ and candidates’ positions on issues concerning ethnic minority groups also shape their interactions with minority voters. Given the large number of parties, we would, ceteris paribus, expect greater variation in party positions related to questions of immigration and integration—from parties running on highly restrictionist immigration policy platforms to parties that represent very liberal ones. Sixth and related, municipal councils feature a much larger number of elected officials compared with the national parliament (2,444 elected at the local level in 2013 versus 175 elected for national parliament). Collectively, marked variation and a higher number of observations in the municipal context strengthen our test of the proposed explanations for ethnocentric responsiveness.
Research Design and Data
To determine whether local incumbents are responsive to simple requests from their constituents, we conducted a field experimental audit study in the context of the 2017 local elections for municipality councils in Denmark (see Appendix A for more details on data sources and measurement). The experiment involved sending a request to all incumbent politicians with a publicly available email address approximately six weeks prior to the elections. Further, we merge observational data on the incumbents from various sources to the field experimental data. These include a host of personal characteristics (party affiliation, decision to stand for reelection, their election outcomes in the previous election, and stated policy preferences on immigration) as well as characteristics of their municipality.Footnote 6
Designing Requests
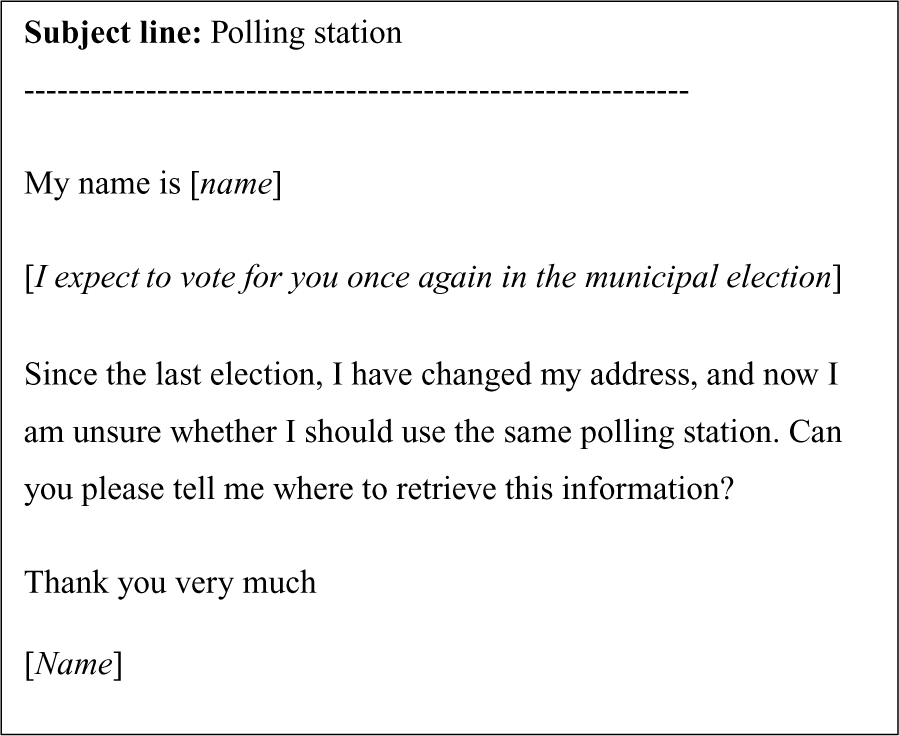
Incumbents all received one email from a voter six weeks prior to the municipal election.Footnote 7 The requests stated that the constituent had recently moved to a new address within the same municipality and therefore was unsure about the geographic location of the polling station. The choice of this specific request was based on five considerations. First, it presented incumbents with an opportunity to provide critical constituency service. Second, the question is easy to answer because information on where to vote is provided on the voting ballot that is mailed to all voters prior to the election. Third, this implies that answering the request kept the burden imposed on legislators’ time at a minimum, which is reflected in the actual replies with a median answer length of 30 words (see below for further considerations on ethics of the field experiment). Fourth, constituent requests to incumbent local politicians are relatively common—for example, in a survey from 2001, 22% of the voters said that they had contacted local politicians within the last two years (Houlberg Reference Houlberg, Kjær and Mouritzen2003; see also Berg and Kjær Reference Berg and Kjær2008)—and politicians indicate that they use citizens’ requests in their work (Pedersen et al. Reference Pedersen, Houlberg, Hansen, Olsen and Bordacconi2013), thus rendering the treatment ecologically valid. Fifth and finally, the request allowed us to include, in an organic way, a randomly assigned explicit voting preference—to strengthen electoral incentives—that stated that the voter intended (as in the last election) to cast a personal vote for the candidate.
Treatments and Randomization
To examine the effect of ethnic in- and out-group cues and electoral incentives, we randomly assigned incumbents to configurations of three treatments (2 × 2 × 2): the requesters’ ethnic affiliation and gender and whether the requests included an explicit vote preference.Footnote 8 , Footnote 9 Ethnicity and gender are manipulated through names (“aliases”) holding distinct Danish (majority) or Middle Eastern/North African (minority) as well as male or female connotations. Following Dahl and Krogh (Reference Dahl and Krog2018), we relied on a combination of five popular traditional majority/native Danish female and male first names and last names as well as five popular Turkish or Arab first and last names.Footnote 10 By examining names connoting Turkish or Arab background, we focus on the largest subset of non-Western minorities in Denmark (Statistikbanken 2020), which are arguably also the primary ethnic out-group in contemporary political discourse. As such, our assessment of ethnocentric responsiveness pertains to an important and salient minority group in Danish society, but it also plausibly constitutes an upper-bound estimate of ethnocentric responsiveness vis-à-vis both the larger subset of non-Western immigrants and, in particular, immigrants as a whole. We discuss the scope conditions of our study further in the conclusion.
Finally, our manipulation of a personal voting preference for the politicians was included in half of the requests by the statement “I expect to vote for you once again in the municipal election” (in the control condition, the voter just noted “I am looking for information regarding where my polling station for the municipal election is located”). This personal vote cue is a stronger incentive than what has been used in previous research by randomizing party membership (Butler and Broockman Reference Butler and Broockman2011; McClendon Reference McClendon2016) or simply an intention to vote (Gell-Redman et al. Reference Gell-Redman, Visalvanich, Crabtree and Fariss2018). Moreover, the strength of the personal vote cue used in the experiment is underlined by the fact that the local elections are often determined by small vote margins (Dahlgaard Reference Dahlgaard2016).
The voter request is reproduced in Figure 1 above. We randomly assigned incumbent legislators to treatment groups using block randomization by five variables that we believed to be predictive of the outcome variable: the size of the municipality, the share of ethnic minority inhabitants (larger/smaller than average), incumbents’ political leaning (left or right), gender, and ethnicity.Footnote 11
Voter Request

Implementation Details
Before launching the experiment, we conducted a pilot study (a random sample of 50 legislators) to test our experimental protocol. The initial request included in the pilot was formulated slightly differently, and from the replies it was clear that a few incumbents misunderstood the question, which led us to modify the wording of the request to avoid such misunderstandings.Footnote 12 The pilot data were not included in the final sample. The requests were emailed with five-minute intervals in batches of 60 requests at a time. This procedure enabled us to send all emails on the same evening between 6 pm and 10 pm, thus minimizing extraneous variation from events etc. between requests. Moreover, the time interval between the requests reduced the risk that two or more incumbents that were in the same location (e.g., at a campaign meeting) would receive an identical message at the same time, which could raise suspicion and thus cause interference between subjects. We gathered responses until the voting booths closed on the day of the election, thereby giving incumbents 42 days to respond. As reported in Online Appendix C, 90% of the replies arrived within a day and 96% within three days.
Ethical Concerns
Three ethical concerns are especially pertinent for the field experiment: (i) the burden imposed on experimental subjects; (ii) the time required to answer requests from the experiment, which takes time away from other citizens who may have been seeking help at the time; and (iii) the use of deception by relying on fictitious aliases. We followed several procedures to keep the burden imposed on subjects at a minimum. First, to minimize the risk of misunderstanding and thus wasting incumbents’ time, we carried out the aforementioned pilot study before fielding the experiment to ensure that the treatments were correctly understood and to test our experimental protocol. Second, the email sent in the context of the experiment was short, and the request in the email was straightforward to answer, thereby minimizing the time burden placed on each incumbent. The median reply of about 30 words validates this assertion. Third, to minimize any harm to the subjects, we only present results that do not enable identification of individual legislators. Accordingly, we believe that through the design of the experiment, we have minimized the potential harm to incumbents as well as constituents who were seeking help at the time that our experiment was conducted. Finally, the use of deception is essential for the validity of our design. In order to provide an unbiased estimate of whether public legislators are responsive, some degree of deception is arguably unavoidable.
Auxiliary Data
In addition to the field experiment, we use observational data from additional sources that we link to individual legislators’ responses in the audit (see Appendix A). First, we use data on politicians’ decision to run for reelection in the 2017 election as well as their election outcome in the 2013 election. This serves as a proxy for how electorally exposed each candidate was when responding to the request; the closer the outcome in the previous election, the stronger the incentive to respond for those who are running for office again. Second, to gauge parties’ and legislators’ policy preferences, we use data from the voting advice application “The Candidate Test,” which is intended to inform voters about the positions of their local candidates on key political issues. The majority of incumbents seeking reelection participated in the test, the result of which was publicized prior to the election. The data from the test enable us to examine how responsiveness varies by individual candidates’ stated policy preferences as well as parties’ aggregate preferences on the immigration/integration issue.
Measures
Outcome Variables
Our main outcome is a dichotomous variable measuring legislators’ response (response to request vs. nonresponse).Footnote 13 Since we technically treat incumbents’ email addresses, not the incumbents themselves, some replies could potentially have been sent from staff members. We observed only 16 instances where legislators were not personally responsible for answering the requests, and classifying the answers as nonreplies has no effect on the results. We also received 12 automated responses, which we chose to code as nonresponses in the analysis due to their impersonal and unhelpful nature (Costa Reference Costa2017). Other studies have documented that by focusing exclusively on whether political elites or public officials respond or not, and not how they respond, one may miss important qualitative nuances (Hemker and Rink Reference Hemker and Rink2017). We therefore complement the dichotomous outcome with qualitative measures that take the content of each individual email into account. In Online Appendix D, we replicate the main result using the qualitative outcome measures.
Measuring Electoral Incentives
As noted above, we randomly assign a personal vote cue by which half of the requests included the statement “I expect to vote for you once again in the municipal election.” In addition to the experimental manipulation of the personal vote intention, we use two observational measures indexing electoral incentives to gauge legislators’ extrinsic motivation for constituency service. Parallel to earlier studies, the first measure is a simple dichotomous indicator of whether incumbents are running for reelection, in which case they should be more inclined to respond than are candidates who are in their final term (Butler Reference Butler2014; Butler and Broockman Reference Butler and Broockman2011; Butler, Karpowitz, and Pope Reference Butler, Karpowitz and Pope2012). The second measure gauges closeness of the previous election in 2013, which is a proxy for incumbents’ perceived likelihood of maintaining their seat. Some candidates have safe seats, having won by a wide margin in the last election, while others face a more competitive election over marginal seats. Incumbents who won a seat by a narrower margin in the last election presumably feel less safe and therefore have a stronger incentive to respond to requests than the clear winners.Footnote 14 To measure individual candidates’ experienced electoral competition in the Danish PR system, we used a bootstrapping-method inspired by Kotakorpi, Poutvaara, and and Terviö (Reference Kotakorpi, Poutvaara and Terviö2017) and Dahlgaard (Reference Dahlgaard2016). This procedure measures all candidates’ share of reelections in 1,000 alternative elections by resampling from the actual distribution of votes (See details in Online Appendix E).
Since neither running for reelection nor electoral competitiveness are randomly assigned, these factors are not exogenous vis-à-vis responsiveness. However, in combination with the experimentally assigned personal vote cue, it is possible to identify candidates, who have very strong reasons to respond given that they ran for reelection, faced a close previous election, and received a request stating a personal vote intention. We believe this provides a rigorous test of whether electoral incentives potentially moderate in-group favoritism.
Measuring Stated Policy Preferences
To measure parties’ and incumbents’ policy preferences, we used a questionnaire (a voting advice application) fielded by a major Danish news outlet prior to the experiment in which individual candidates reported their stances on 15 policy questions relevant for municipal politics (see Online Appendix A). The answers were publicly available in an online template such that voters were able to answer the same questions as the politicians to find out which candidates best represented their opinions. As noted, we focus specifically on stated immigration/integration policy preferences (broadly conceived) as a heuristic for responsiveness towards ethnic minorities (immigrants). We measure these preferences by two available questions: “Local municipal institutions try too hard to accommodate to religious minorities” (reversed) and “The municipality should accept more refugees.” Both questions are answered on a 5-point scale (for descriptive statistics, see Online Appendix A). The immigration/integration policy scale takes on values from 0 (most negative) to 8 (most positive), with a mean of 4.4 (SD = 2.4; see Online Appendix F). A total of 1,522 majority incumbents gave valid answers to both immigration questions just before the experiment was fielded. In Online Appendix G, we demonstrate that the subset of incumbents that answered the questionnaire are largely representative of the full sample of incumbents (in total and specifically for majority legislators) on a number of characteristics.
Results
In total, we received 1,504 replies to the 2,395 requests sent by email, corresponding to an overall response rate of 62.8%. This is a high response rate compared with the results from previous studies on political responsiveness (Costa Reference Costa2017), thus indicating relatively high political responsiveness in general among local politicians in Denmark. Yet, our interest is in the potential variation in responsiveness toward individuals with different ethnic backgrounds.
Experimental Baseline Results: Ethnocentric Political Responsiveness in Denmark
As a first-order question, we examine the effect of our treatment of primary interest—the ethnic alias of the sender—on the response rate. We discuss the effect of the explicit personal vote intention below. The gender cue had no effect on the likelihood of receiving a reply, either in general or across incumbents’ own gender (see Online Appendix H). This is an interesting finding in its own right and aligns with results from the US context (Butler Reference Butler2014). For the remainder of the paper we focus on the ethnic alias and the vote-intention treatment.
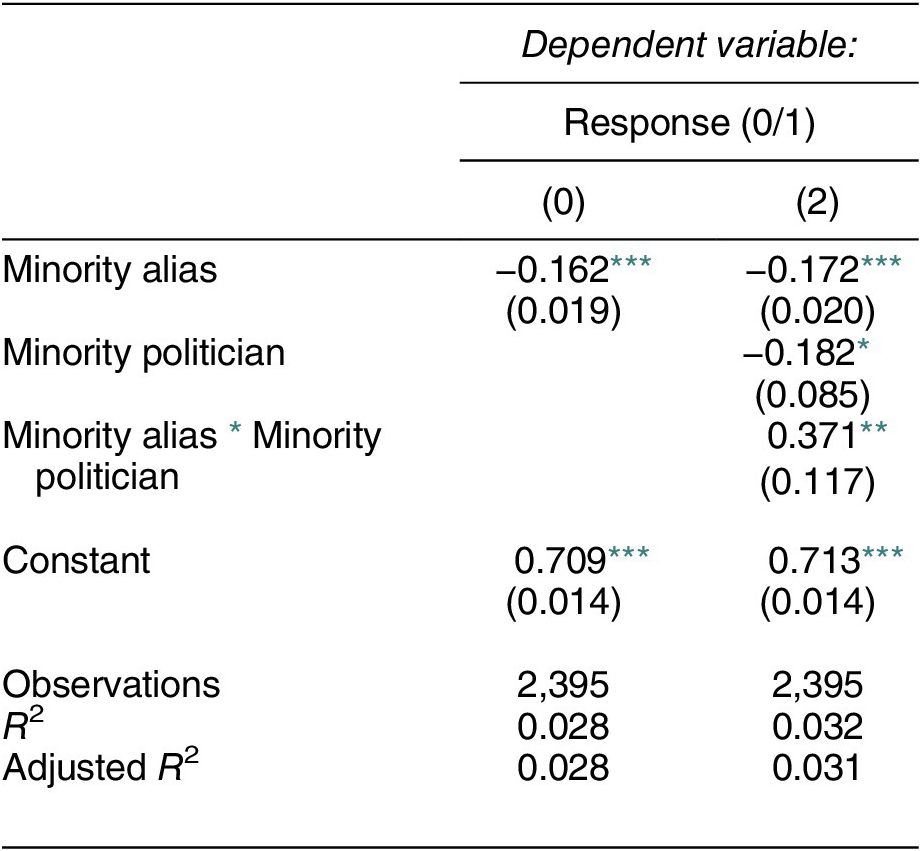
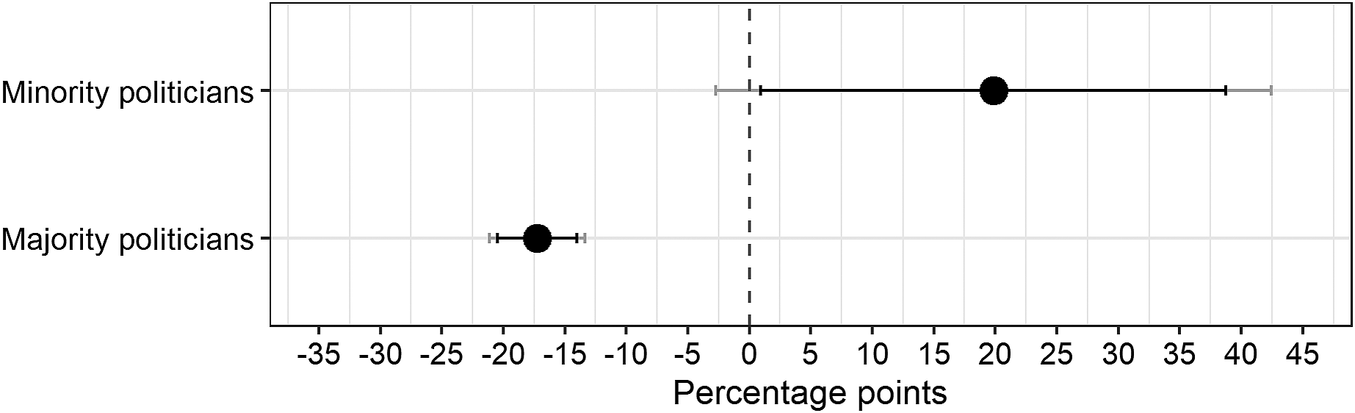
Table 1 reports the average treatment effect of the ethnic minority alias (column 1) as well as the interaction with incumbent politicians’ ethnic affiliation (column 2). The results show that requests signed with an ethnic minority alias received 16.2 percentage points fewer replies than did those sent by an ethnic majority alias. The differential treatment also materializes in responses that are on average less friendly, less helpful, and less elaborate (see Online Appendix D). By interacting the ethnic alias with legislators’ ethnic background, we can explore whether the observed irresponsiveness is primarily a function of majority aversion towards the minority or ethnic in-group favoritism more generally. The results reported in column 2 and shown in Figure 2 strongly indicate general ethnocentrism in responsiveness. Majority incumbents (N = 2,326) are 17.2 percentage points (p < 0.01) more likely to reply to requests from an ethnic in-group member than to requests from an out-group member. However, strikingly parallel to this, minority incumbents (N = 69) are 19.8 percentage points (p = .08) more likely to respond to requests from ethnic in-group members than to requests from out-group members (however, do note the small number of observations and the associated statistical uncertainty). The strong pattern of ethnocentrism in responsiveness among legislators in Danish local councils confirms findings from the US and South Africa showing that incumbents in general provide better service to ethnic in-group constituents (Broockman Reference Broockman2013; Butler Reference Butler2014; Butler and Broockman Reference Butler and Broockman2011; Gell-Redman et al. Reference Gell-Redman, Visalvanich, Crabtree and Fariss2018; McClendon Reference McClendon2016; Mendez and Grose Reference Mendez and Grose2018). If anything, the effects are stronger in the Danish context.Footnote 15 Ethnocentric responsiveness is thus not confined to the contexts with a strong tendency for ethnic (racial) voting; instead, it appears to be a phenomenon that extends to settings where politics traditionally have had a less ethnicized character.
Ethnocentric Responsiveness in Denmark

Note: The dependent variable is receiving a reply or not (coded as 0/1). Both models are estimated by OLS regression. Coefficients are reported as percentage points (divided by 100). Standard errors are reported in parentheses.
* p < 0.05;
** p < 0.01;
*** p < 0.001.
Effect of the Ethnic Minority Alias among Ethnic Majority and Minority Politicians
Note : The effect of ethnic minority alias compared with that of a majority alias subset by incumbents’ ethnic affiliation. Bars indicate 90% (black) and 95% (gray) confidence intervals. Based on the results from column 2 in Table 1.

Addressing Inferential Concerns
Before moving to the analyses of primary interest, we address—based on the baseline analysis—a range of general concerns pertaining to the successful implementation of the field experiment that may compromise our results more generally. First, a potential concern is that some incumbent politicians perceive the request as unrealistic. In particular, politicians from parties with an immigration-skeptic profile may be less likely to perceive the ethnic minority treatment as a genuine request. To assess this possibility, we reestimate the baseline analysis excluding the incumbents who are, arguably, most likely to perceive the treatment as dishonest—that is, incumbents running for parties who are known for their immigration-skeptical profile—and find substantively similar results (ethnic minority cue = −13.2 percentage points, p < 0.001) (this analysis is reported in Online Appendix I).Footnote 16
Second, incumbents from demographically small municipalities may be more inclined to perceive requests from minority voters to be unrealistic.Footnote 17 In other words, legislators may perceive and respond to the emails differently due to their knowledge of the demographics of their constituents and/or simply because they know a larger share of their constituents. To address this concern, we repeat the main analysis on subsets of the data across municipality size and find that the treatment effect is very consistent (see Online Appendix J)—the estimates of ethnocentric responsiveness range between 16 and 18.3 percentage points in differential responsiveness. Even when including only the seven smallest municipalities, where these concerns should be most pronounced, the estimated treatment effect of the ethnic cue is 16.8 percentage points (SE = 10.6).
A final concern involves interference between subjects. As noted earlier, the fact that the emails were sent over a given time interval reduces the risk that two incumbents received the mail at the same time, and from the replies, there is no sign that incumbents have discussed the requests. Taken together, our analyses of potential threats to the validity of our field experimental audit study indicate that it worked as intended, which therefore strengthens the credibility of our results.
Do Electoral Incentives Reduce Ethnocentric Bias in Responsiveness?
Having established that legislators exhibit strong ethnic in-group favoritism when responding to constituents, we now consider whether such bias can be curbed—specifically, among majority incumbents—through electoral incentives for responding to requests in the interest of reelection. We test the electoral incentives hypothesis in a series of analyses probing majority legislators’ responsiveness under increasingly strong electoral incentives.
First, to establish that variations in electoral competitiveness affect responsiveness more generally—and thus validate our manipulation of electoral incentives—we compared the response rate between baseline requests (without the stated intention to vote) and requests that included the explicit intention to cast a personal vote for the incumbent. The average treatment effect of the explicit personal vote intention increases the average response rate by 6 percentage points (p < 0.01), thus indicating that incumbents are responsive to this type of electoral incentive. We further validate this assertion in Online Appendix K, where we demonstrate that incumbents who seek reelection are much more likely to respond (22.2 percentage points higher response rate, p < 0.001) to the requests compared with candidates in their final term.
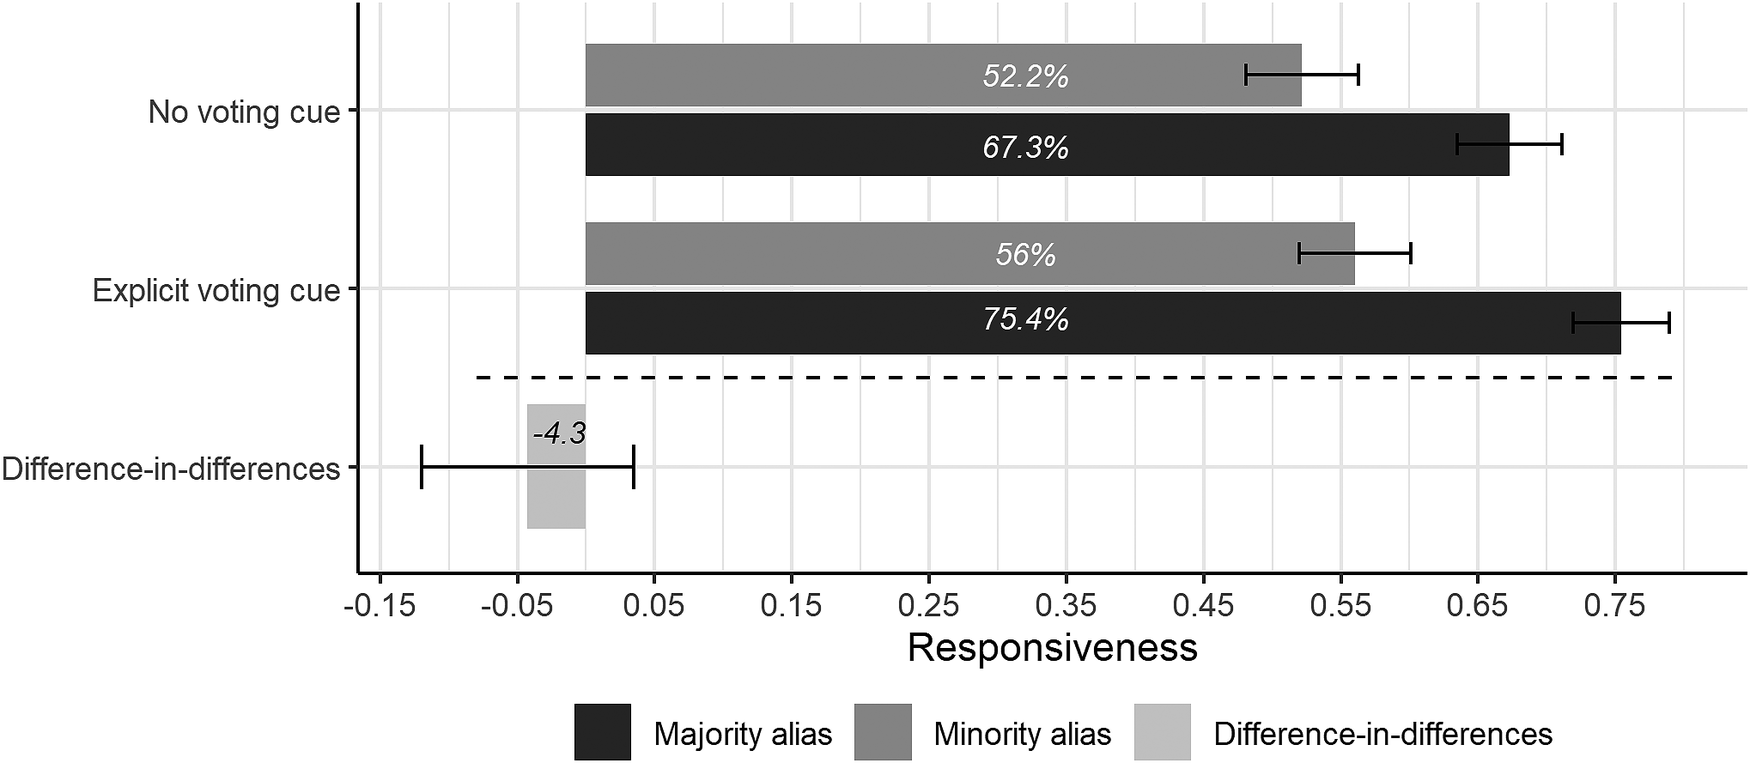
Yet, our primary interest is whether this increase in electoral incentives equalizes differences in responsiveness between ethnic majority and ethnic minority voters. To test this, we interact the stated vote intention with the ethnic cue. Figure 3 illustrates the primary result of this analysis (based on the results from Table 2, column 1). It shows that the stated vote intention does not diminish majority legislators’ ethnocentric responsiveness. In fact, in-group favoritism increases slightly under the explicit vote cue compared with requests without such a cue, as indicated by a negative but statistically insignificant interaction term (4.3 percentage points, p = 0.28).Footnote 18
Effect of the Personal Vote Cue across the Ethnic Cue-Treatment
Note: The figure plots the average response rate (in percentage points) to voters with a majority or a minority alias conditional on whether a personal vote cue was included, as well as the difference-in-differences between these groups. Based on the results from column 1 in Table 2.

Interactions between Vote Cue and Minority Alias

Note: The dependent variable is receiving a reply or not (coded as 0/1). All models are estimated by OLS regression. Coefficients are reported as percentage points (divided by 100). Standard errors are reported in parentheses.
* p < 0.05;
** p < 0.01;
*** p < 0.001.
While tapping electoral incentives in a very direct (and experimentally manipulated) way, the relevance of the stated personal vote intention necessarily depends on the legislators’ stake in the electoral outcome. For example, some candidates hold safer seats than others and are therefore less likely to be animated by one extra potential vote. To strengthen the electoral incentives, we explore whether two observational variations in our data—politicians’ decision to stand for reelection and their seat-winning margin in the previous (2013) electionFootnote 19 —decrease ethnocentric responsiveness when seen in conjunction with the stated vote intention. Although we cannot identify the causal effects of these variations, they arguably serve to strengthen the electoral incentives for responsiveness.
More specifically, we report the interaction between the ethnic cue and the personal vote cue in two subsets of incumbent politicians facing increasingly strong electoral incentives. For comparison, column 1 in Table 2 shows the interaction in the sample of majority politicians (as depicted in Figure 3). In column 2, we subset the data to include only majority candidates seeking reelection, and finally, in column 3, we further restrict our sample so that it excludes all clear winners.Footnote 20 The overall result remains the same in all specifications; providing a personal vote cue does not reduce differential treatment. In fact, the interaction remains negative (although imprecisely estimated), implying that, if anything, strong electoral incentives prompt majority legislators to respond less to requests from minority aliases. The results are robust to subsetting by candidates only competing in parties with open-list systems (i.e., those who have an extra strong incentive to respond due to the stronger correspondence between number of votes and election), including controls for incumbents’ party and municipality characteristics, and using a close reelection subset based on the actual 2017 election as an alternative measure of electoral competitiveness (see Online Appendix L).
Overall, the results show that in-group favoritism in constituency service occurs even when there are clear strategic incentives for incumbents to respond to voters. This is particularly striking given that at least two of the electoral incentives examined—receiving a request with an explicit vote intention in one’s favor and rerunning for election—strongly animates representatives to be more responsive to voters on average. Yet, it does not constrain in-group favoritism. This result also indicates that the observed ethnocentric responsiveness does not reflect extrinsic (instrumental) motivations on the part of legislators but, more likely, intrinsic motivations (deep-held values or preferences), which is in line with Broockman’s (Reference Broockman2013) findings from the US.
Using Party Affiliation and Stated Policy Preferences to Identify Responsive Politicians
Finding lacking responsiveness to ethnic minority out-group constituents among majority incumbents even in the face of clear electoral incentives is unsettling, and it effectively puts the burden on the constituents to identify parties and specific legislators that are responsive to them—what we have referred to as “candidate selection.” This “solution” is particularly important in situations when voting for a co-ethnic political candidate—a simple heuristic solution following from the findings in the baseline model—is either not possible (e.g., due to the limited number of ethnic minority candidates) or undesirable (e.g., due to this person having a low likelihood of being elected). More specifically, we examine whether ethnic minority voters—by using party affiliation and stated immigration/integration preferences as heuristics—can obtain equal responsiveness from parties and majority incumbents that explicitly articulate a motivation to promote the interest of their group. We do so in two steps, relying on data from the voting advice application as described previously. First, we examine whether ethnocentric responsiveness varies by political parties’ positions on immigration and integration (broadly conceived). Second, we test whether ethnocentric responsiveness varies by individual majority politicians’ stated preferences within parties.Footnote 21
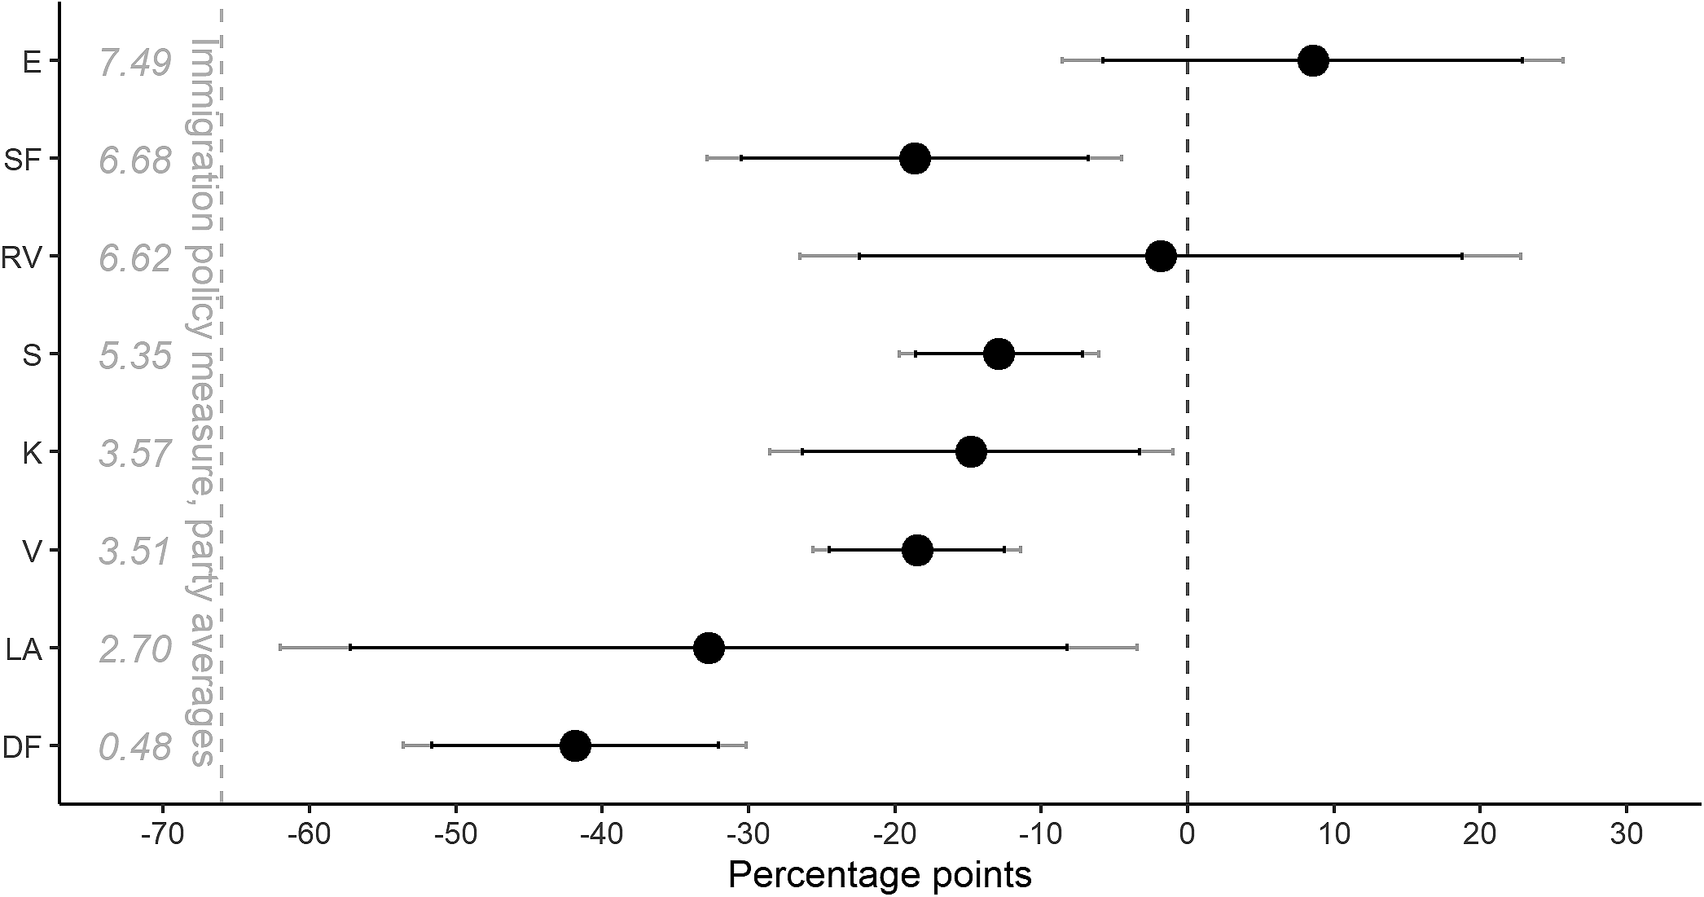
Figure 4 plots the effect of the ethnic cue for each of the eight largest partiesFootnote 22 ranked based on candidates’ average score on the immigration policy measure along with confidence intervals (Online Appendix M reports the pairwise differences in ethnocentric responsiveness for each party, including tests of statistical significance). A lower score indicates that members of the parties on average express more restrictive immigration positions. With the exception of one party (Liberal Alliance [LA]), the ranking tracks voters’ perception of the parties’ position on refugees (a closely related issue) at the national level (Stubager et al. Reference Stubager, Hansen, Callesen, Leed and Enevoldsen2016), which indicates that party position on immigration is indeed a low-information cost cue; on average, constituents basically only need to know the national party’s position, not the position of its local branch.
Effect of the Ethnic Cue across Parties
Note: The plot shows the effect of the ethnic cue among legislators from the eight largest parties (analysis subset by parties). Parties are ordered based on their incumbent politicians’ average score on the immigration policy measure (scores reported in italics). The immigration policy measure ranges between 0 and 8, which indicate, respectively, the most and the least restrictive immigration policy profile. Bars indicate 90% (black) and 95% (gray) confidence intervals. Sample: All available majority legislators from the eight largest parties. N (total) = 2,162. Number of legislators vary by party from Liberal Alliance (LA, N = 42) to Venstre (V, N = 724).

The pattern depicted in Figure 4 suggests that using candidates’ party affiliation can be quite effective in identifying legislators that are more responsive to minority constituents. Candidates from more pro-immigration parties are generally substantially more responsive to requests than are candidates from more restrictionist parties. Incumbent politicians representing the leftmost party (the Red-Green Alliance [E]), which hold by far the most liberal immigration policies on average, are actually—as the only party—more responsive toward minority than majority constituents (8.6 percentage points), although this is within the margin of statistical error (p = 0.329). Except for the Social Liberal Party (RV), majority legislators from all other parties display significantly stronger pro-majority favoritism compared with those representing the Red-Green Alliance. Further, politicians from the Social Liberals are also the only other group of legislators that are not significantly less responsive to ethnic minorities vis-à-vis majorities. The larger center-left and center-right parties, the Social Democrats (S), the Conservatives (K), and the liberal party (Venstre [V]) display levels of ethnocentric responsiveness in the range of 12.9 to 18.5 percentage points. Between the two parties with the most restrictive immigration policy attitudes, Danish People’s Party (DF) and LA, minority voters have a much lower likelihood (41.9 and 32.7 percentage points, respectively) of receiving a response than majority voters (however, note the much larger uncertainty estimate for LA legislators). The primary outlier are legislators from the left-wing Socialist People’s Party (SF), which hold the second most immigration-positive positions on average but display ethnocentric responsiveness at a level parallel to the major center-left/center-right parties (18.7 percentage points lower responsiveness vis-à-vis immigrants). In Online Appendix N, we present alternative specifications that indicate that the patterns reported in Figure 4 are robust to the inclusion of municipality population size and share of immigrant-origin inhabitants in the municipality as well as running the analysis on the subset of majority incumbents who answered the questions in the voting advice application (rather than the full sample of majority legislators from the eight parties).
For minority voters, using party as a heuristic for obtaining equality in responsiveness is thus quite effective; by voting for strongly pro-immigration parties, specifically the far-left party (the Red-Green Alliance) and the Social Liberals, they identify legislators that are on average as likely to serve them as their majority counterparts. However, in reality this strategy is not always attractive for minority voters to pursue. First, while these pro-immigration parties are represented in most municipalities, their actual political influence varies substantially. A significant share of municipalities (typically more rural ones) has historically been heavily dominated by right-of-center parties (the Conservative People’s Party and the liberal party, Venstre). This implies that in these municipalities, the political leverage of candidates from the pro-immigration parties is likely to be marginal and voting for them is therefore a suboptimal strategy for interest representation. Second, voting for a specific subset of parties is only a solution to representation if it is viewed strictly through a perspective that is devoid of any specific policy preferences. In reality, voters do of course vary individually in their preferences, and the fact that ethnic minority voters can only choose among a few parties representing a narrower subset of the political spectrum limits their policy options.Footnote 23 , Footnote 24 In other words, there are both strategic and policy-substantive reasons for voters to try to identify responsive politicians from a broader set of parties. Given the lower average responsiveness among most parties, this requires minority voters to identify particularly responsive majority politicians within otherwise less responsive parties. Again, policy position on immigration and integration—but now for individual candidates—is a plausible heuristic.
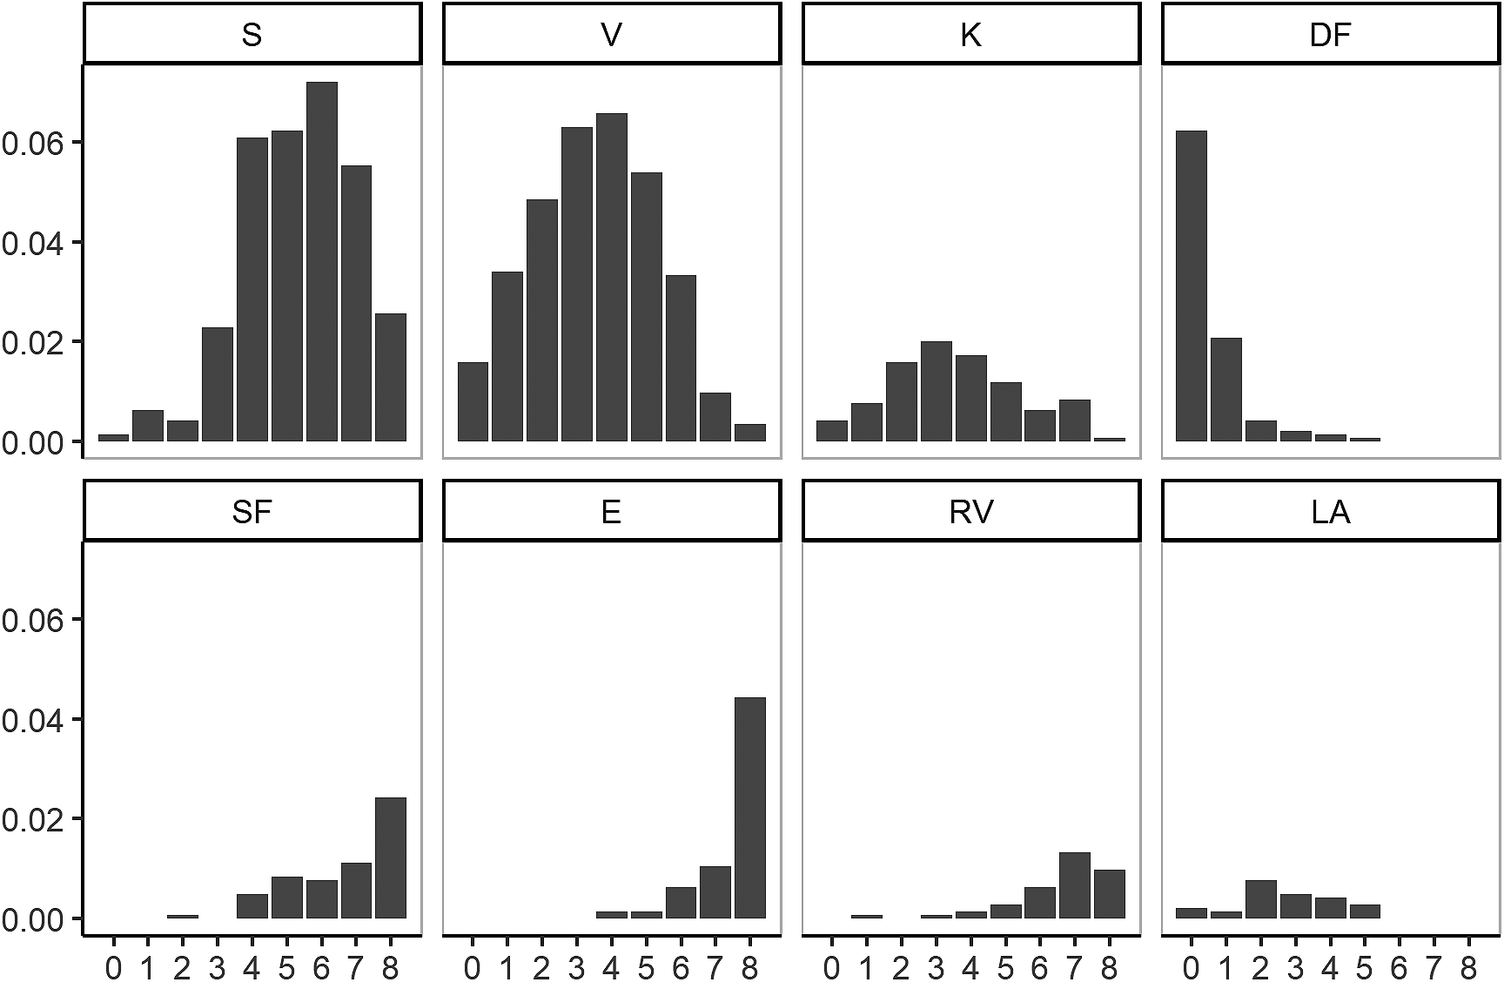
Figure 5 displays substantial within-party variation, and thus hints at the potential usefulness of using incumbent politicians’ stated policy position on immigration/integration to identify responsive legislators—at least for the largest parties, the center-left Social Democrats (S), the center-right Liberal Party (V), and the Conservatives (K). Within these parties, there are both candidates who favor very restrictive policies and candidates who favor very liberal immigration policies. This reflects that local political candidates’ often deviate from official party policies, and it also highlights that immigration policy is a divisive topic in Danish politics, especially within the large centrist parties.
Distribution of Incumbents’ Position on Immigration Policy across Parties
Note: The plots show the distribution of legislators’ positions on the stated immigration policy preference measure across political parties. Sample: Majority legislators from the eight largest parties with valid responses to the questions regarding immigration/integration in the voting advice application. N (total) = 1,444. Number of legislators varies by party from Liberal Alliance (LA, N = 33) to Venstre (V; N = 473).

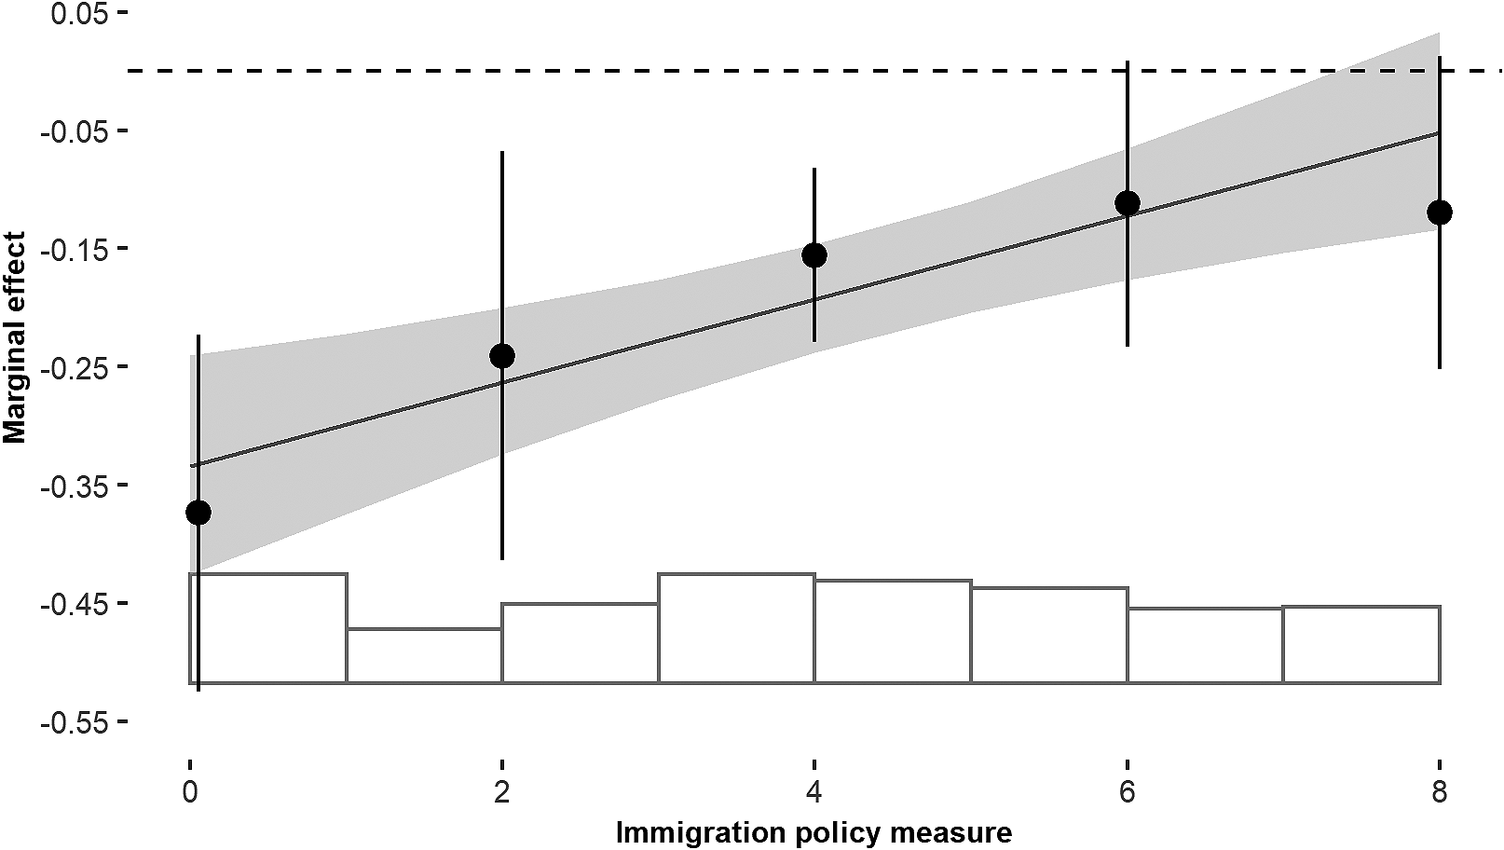
To examine the efficacy of individual incumbent politicians’ policy preferences as a means to identify candidates that are more responsive to minority requests (even if they are not running for parties with a clear pro-immigration profile), we analyze how the effect of the ethnic cue varies by individual legislator immigration policy preferences while taking party affiliation into account. Figure 6 plots the marginal effect of the minority alias treatment on legislator response conditional on legislators’ immigration policy positions, based on a regression model in which response is regressed on minority alias, candidate positions, and their interaction, as well as party fixed effects—that is, when the relationship is analyzed within parties (the visual model includes bins to assess the effect heterogeneity as suggested by Hainmueller, Mummolo, and Xu [Reference Hainmueller, Mummolo and Xu2019]). As is evident from the figure, the conditional marginal effect changes at a near constant rate with individual legislator preferences. The interaction is positive and statistically significant (0.035, p < 0.001), indicating that even when differences between parties are accounted for, more liberal individual preferences on issues of immigration and integration are strongly associated with being more responsive to minority voters vis-à-vis majority voters.Footnote 25 To put the effectiveness of immigration preferences as a heuristic in perspective, we examined interactions between the ethnic cue and each of the 13 remaining policy questions in the voting advice application. This analysis yielded one other significant interaction effect at p < 0.01 and three at p < 0.05—and these are for policy issues that are relatively strongly correlated with answers to the immigration policy measure (see Online Appendix P for an overview).Footnote 26 Preferences for immigration and integration policies are therefore among the most informative policy stances for ethnic minorities to use to locate responsive (majority) politicians.
Lastly, as noted earlier, the effectiveness of candidate positions as a heuristic for identifying responsive politicians ultimately hinges on whether voters have reasonable impressions of such positions. Given the modest level of political knowledge among the majority of voters (Carpini and Keeter Reference Carpini and Keeter1996; Galston Reference Galston2001), one might worry that they do not possess the detailed knowledge about candidates’ positions necessary to use this as a heuristic cue for responsiveness. While we cannot assess voters’ knowledge about specific candidates’ positions, auxiliary evidence from Danish surveys on local politics in the general population indicates a relatively high level of knowledge—both general and specific—about local politics. For example, the 2013 municipal election survey found that 84% of respondents knew the name of the mayor and 94% knew the mayor’s party (Elmelund-Præstekær and Skovsgaard Reference Elmelund-Præstekær, Skovsgaard, Elklit, Elmelund-Præstekær and Kjær2017; see also Pedersen Reference Pedersen, Kjær and Mouritzen2003), and the average number of correct answers was almost 5 out of 6 on general knowledge questions about the local political system. Danes also feel relatively well informed about municipal politics (Elmelund-Præstekær and Skovsgaard Reference Elmelund-Præstekær, Skovsgaard, Elklit, Elmelund-Præstekær and Kjær2017) and indicate that they feel that they have more sufficient knowledge for navigating local politics than they do regarding national politics (Andersen Reference Andersen, Andersen and Andersen2000). Taken together, while we should not exaggerate the extent of voters’ knowledge about municipal politics, these findings indicate that local politics is at least not foreign for most Danes, and obtaining knowledge of specific candidate position therefore seems within the reach of a significant share of the electorate.Footnote 27 Regardless, the introduction of voting devices such as the Vote Compass have made identifying candidate positions much easier, consequently reducing the cost of using this heuristic for identifying responsive legislators.
Marginal Effect of the Ethnic Cue across Immigration Policy Positions (Including Party Fixed Effects)
Note: The plot shows the marginal effect of the ethnic cue across legislator’s individual immigration/integration policy preferences, including party fixed effects. Sample: Majority legislators from all available parties with valid responses to the ethnic minority/immigration questions on the voting advice application (N = 1,522). A score of 0 on the immigration policy measure indicates the most restrictive immigration profile. Bins with 95% confidence intervals are included.

In summary, our results regarding the candidate selection hypothesis suggest that parties’ positions on immigration policy correlate strongly with politicians’ likelihood of answering the ethnic minority voter. However, the analysis also reveals that unless one sympathizes with a few parties, generally on the left in terms of noneconomic issues, whose representatives do not systematically display ethnic in-group favoritism, it is not enough to simply pay careful attention to party policies; minority voters must be cognizant of individual candidates’ policy preferences to identify incumbents who are indiscriminate in their responsiveness.
Conclusion and Discussion
Studies have consistently demonstrated that politicians are more likely to provide various types of constituency service to members of their racial or ethnic in-group. This paper contributes by theorizing and testing two perspectives on which factors may help promote parity in responsiveness across ethnic groups. First, building on the assumption that politicians are extrinsically motivated by a desire for (re)election (the electoral incentives hypothesis), we explored whether electoral incentives animate legislators to be responsive to their constituents independent of the constituents’ ethnic background. Second, we examined whether candidates’ partisan affiliation and their stated policy preferences on immigration/integration-related issues are useful heuristics for minority voters to identify responsive legislators by (the candidate selection hypothesis). We tested these hypotheses using a field experiment eliciting responsiveness of Danish local incumbents toward a simple request for constituency service from individuals with names signifying either ethnic majority or ethnic minority affiliation, subsequently merged with auxiliary observational data on incumbent characteristics including their stated policy preferences.
Our baseline results show patterns of ethnocentric responsiveness in Denmark similar to those observed in the United States and South Africa: ethnic majority legislators respond 17.2 percentage points less to requests signed with ethnic minority aliases relative to requests from majority aliases, and the reverse pattern applies to ethnic minority legislators. We find little evidence for the electoral incentives hypothesis. While majority incumbents who face strong electoral incentives (e.g., receiving a stated vote intention in their request) devote more overall effort to responding to constituents, these incentives do not curb their ethnocentric bias in responsiveness. We find more evidence for the candidate selection hypothesis; ethnic minority voters can use information on parties’ and, especially, majority incumbents’ position on immigration/integration as a heuristic for identifying responsive politicians.
Our findings contribute in several ways to our understanding of in-group favoritism in politicians’ responsiveness to constituents and its consequences for representation. First, scholars have argued that racial or ethnic biases in responsiveness are symptoms of a history of racial segregation and subjugation (McClendon Reference McClendon2016). By replicating the findings of unequal responsiveness from the United States and South Africa in the Danish setting, our analysis indicates that in-group favoritism is a more general phenomenon and not confined to societies with particular histories of racial or ethnic out-group discrimination. Thus, the results suggest that problems of inequality in responsiveness may be more widespread than previously thought.
Second, we provide insights into which strategies might potentially eradicate ethnocentric responsiveness. Our results carry bleak perspectives for solutions originating in pluralist political thought; electoral competition appears to do little to equalize majority legislator responsiveness vis-à-vis ethnic minority constituents. This arguably reveals the “deep” nature of this form of ethnocentrism. While this is obviously concerning, there is a silver lining; ethnic minority constituents can at least identify parties and politicians who are as responsive to them as they are to majority constituents. Yet, this solution is far from ideal or cost free. Many voters know little about individual candidates’ policy positions (Carpini and Keeter Reference Carpini and Keeter1996), and few citizens are motivated to learn the details of specific policy issues (Lupia and McCubbins Reference Lupia and McCubbins1998). Minorities must thus pay a higher cost of acquiring the necessary information to obtain the same constituency service as their majority counterparts. In addition, the candidate selection approach limits the range of policy options they have at their disposal in the first place.
Third, the diagnostic function of individual candidates’ issue positions for identifying responsive legislators emphasizes the importance of transparency and accessibility of candidate positions. Voting advice applications such as “Vote Compass” and other devices that allow voters to easily identify candidates’ policy positions are clearly helpful innovations in this regard. Further, it also underlines the importance of the possibility for voters to hold individual candidates accountable. This speaks in favor of electoral systems—that is, the open-list proportional representation system—in which the personal vote enables minority voters to enforce representation by electing specific candidates.
Fourth, the results have important implications for discussions about equal representation in Denmark and other Western democracies with substantial and growing immigrant-origin populations. The gaps in incumbents’ propensity to communicate with voters, conditional on their putative ethnic characteristics, signify unequal access to the democratic process. While we found that in-group favoritism applied equally to ethnic minority and ethnic majority legislators, the general underrepresentation of ethnic minorities in legislatures implies that ethnic minority groups are generally provided with poorer constituency service than are their ethnic majority counterparts. This finding highlights the importance of descriptive representation for securing minority groups’ equal substantive political representation.
Zooming out, it is relevant to think about the scope conditions of our findings. Given that Denmark is fairly representative of immigrant-receiving societies in Western Europe in terms of (i) the demographic trends in immigration, (ii) public attitudes towards immigration, (iii) the presence of immigration-sceptic parties (Dinesen and Sønderskov Reference Dinesen and Sønderskov2015), and (iv) discrimination in the labor market (Dahl and Krogh Reference Dahl and Krog2018), it is reasonable to expect our finding of ethnocentric responsiveness to generalize to other Western European societies with similar ethnic group constellations, although this of course remains an empirical question. It is less obvious whether we should expect the results to generalize to countries outside of Europe—Western or otherwise—that are characterized by other ethnic and racial group constellations, although the parallel results regarding racial disparities in responsiveness from the US and South Africa might indicate that our results are representative vis-à-vis “primary” out-groups more generally. This also prompts the issue of the specific immigrant groups in question. Given that the treatment in our experiment—putative Middle Eastern/North African background—pertains to a salient and politically contested subset of immigrants, we are likely to provide an upper-bound estimate of ethnocentric responsiveness both vis-à-vis the larger subset of non-Western immigrants and, in particular, immigrants as a whole. In future work, it would be interesting to examine—in Denmark and elsewhere—to which extent ethnocentric responsiveness occurs for other, less salient and contested immigrant groups, for example people of Eastern European descent—a large immigrant group in Denmark and other Western European countries.Footnote 28 This could also potentially lead to further insights into the underlying motivations—for example, perceived cultural distance—explaining biased responsiveness.
While we believe that we have made inroads in to our understanding of ethnocentric responsiveness and its possible solutions, much more work is to be done. Most fundamentally, while ethnocentrism in responsiveness is now well established, research on how to counter this is still in its nascent phase. We have proposed and tested two hypotheses in this regard, but further studies probing both of these, as well as other perspectives on how to obtain equal responsiveness, are clearly warranted. Given our results, exploring the candidate selection hypothesis further would be worthwhile. For example, one could scrutinize its viability in practice. As noted, relying on detailed assessments of individual candidates’ positions on specific policy issues may only be a viable strategy for a small share of the electorate who holds detailed knowledge about politicians’ policy positions. Exploring the extent to which voters are actually able to follow this strategy—for example, by examining the extent of voter knowledge about local candidates’ issue position—is therefore important for evaluating the effectiveness of the candidate selection perspective. We urge researchers to examine this and other perspectives on bias-reducing strategies in future work on legislator responsiveness.
Supplementary Materials
To view supplementary material for this article, please visit http://dx.doi.org/10.1017/S0003055420001070.
Replication materials (with limitations on data sharing explained) can be found on Dataverse at: https://doi.org/10.7910/DVN/GKVNDS.


 Open access
Comments
No Comments have been published for this article.