

Implications
The main obstacle to assessing dairy feed efficiency (FE) is an accurate individual animal feed intake measurement which direct recording is laborious and expensive. Therefore, indirect methods using digesta markers to estimate intake have been developed. In this study, we used a meta-analytical approach to develop models that could be used to predict feed intake and FE by means of markers. Overall, markers were not accurate in predicting dry matter intake (DMI). However, faecal dry matter output (FDMO) estimated by external markers can improve prediction of FE thereby eliminating the added burden of measuring intake directly.
Introduction
Feed efficiency is not a new concept. Although it gained popularity in the 1970s (Hooven et al., Reference Hooven, Miller and Smith1972), it is only in recent years research into this area has appeared consistently in the scientific literature. This is mainly due to the increased pressure facing the dairy industry to maintain profitability in an era of increasing feed costs and to reduce greenhouse gas production and nutrient losses to the environment. Feed efficiency has become a more common standard for monitoring the economic viability of milk production and it is already a primary marker for genetic improvement in dairy cattle breeding programs (Vallimont et al., Reference Vallimont, Dechow, Daubert, Dekleva, Blum, Barlieb, Liu, Varga, Heinrichs and Baumrucker2011; Pryce et al., Reference Pryce, Gonzalez-Recio, Nieuwhof, Wales, Coffey, Hayes and Goddard2015; Tempelman et al., Reference Tempelman, Spurlock, Coffey, Veerkamp, Armentano, Weigel, de Haas, Staples, Connor, Lu and VandeHaar2015). There are numerous definitions of FE, among which the most relevant definition for dairy production systems is still unclear (see review by Connor, Reference Connor2015).
Irrespective of definition, the greatest obstacle to assessing FE is the measurement of individual animal feed intakes. Feed intake is simply and directly measured as the difference between the feed offered and that which remains uneaten or by the use of automated feed monitoring systems. While direct measurements may be quite accurate (Coleman, Reference Coleman2005), their use in dairy cattle generally has been limited to smaller research herds due to the high cost of measurements (Connor, Reference Connor2015).
Moore (Reference Moore1996) suggested the marker technique as suitable for indirect estimates of individual animal intake by dividing FDMO by the indigestibility of the feed. Faecal output is estimated from an external marker while an internal marker (naturally occurring in feedstuffs) is used to estimate dry matter digestibility (DMD).
Several markers have been evaluated through the years in the search for a suitable marker (Huhtanen et al., Reference Huhtanen, Kaustell and Jaakkola1994; Ferret et al., Reference Ferret, Plaixats, Caja, Gasa and Prio1999) but a marker that satisfies all the requirements of the ideal marker (see review by Sales and Janssens, Reference Sales and Janssens2003), is yet to be established. Furthermore, simple, low cost but accurate and precise analytical techniques are required. The marker technique has been criticised for much preparation work (especially external markers) and practical inadequacies involved. As such, it has received little or no application in large herds. However, under practical conditions, they can produce important data for the advancement of research.
Therefore, the objective of the present study was to evaluate the performance of marker estimates against observed data using a large dataset from physiological digestion studies with a meta-analytical approach. Furthermore, equations were developed to assess the usefulness of marker estimates in predicting FE. A prediction equation for FE would curtail the added burden of measuring feed intake of individual cows.
Material and methods
Experimental data
The dataset comprised 416 individual cow-within period observations (after removing missing data) originating from 29 digestibility trials conducted in Denmark (5), Finland (18) and Norway (6) (Supplementary Table S1 and Supplementary Material S1). All trials were conducted as either Latin square or cyclic change-over designs using rumen-cannulated cows. The mean forage to concentrate ratio of the diets was 59 : 41 on a dry matter (DM) basis. In one trial, a total mixed ration (TMR) was offered ad libitum whereas in the rest forages were fed ad libitum and concentrates were offered on a flat rate basis with the exception of one treatment within one of the experiments where cows were offered only forage. Grass silage was the main forage component for all diets but in two trials, grass silage was partially replaced with red clover or whole-crop silages. Maize and fresh grass silages were used in two trials and hay was used in four trials. Concentrate supplements contained oats, barley, ground maize, fibrous by-products from the food industry, protein supplements, typically soya bean meal, rapeseed meal or rapeseed expeller and dried or ensiled field pea. All studies used a minimum of one external marker with or without an internal marker. Observed measurements included individual DMI, FDMO, apparent total tract DMD, energy-corrected milk (ECM), body weight (BW), and dietary and faecal marker concentrations. Daily DMIs were measured as the difference between feed offered the previous day and refusals in the morning before the first new meal. Measurements of FDMO and DMD for individual cows were made based on total faecal collection in all studies except in studies (62 cow-within period observations) from Denmark where faecal grab samples were used for measurements.
Marker estimations
Faecal DM outputs were estimated from the concentration of external marker in faeces and the daily dose using the following formula:
 $${\rm eFDMO}\left( {{\rm kg}\,/\,{\rm d}} \right){\equals}{{{\rm marker \;dose \,(g/d)}} \over {{\rm faecal \;marker \;concentration \;(g/kg \;DM)}}}$$
Some studies used more than one external marker. Thus, for one observed measurement, there was equal or multiple numbers of estimates. All external markers in all experiments were used for estimating FDMO. As such, the curated number of observations for estimated FDMO (eFDMO) was greater than that observed (924 v. 354). The external markers used for the determination were, large particle-phase marker (Cr-mordanted fibre), small particle-phase marker (Yb) and liquid-phase markers comprising Cr- and Co-ethylenediaminetetraacetic acid (EDTA) and polyethylene glycol (PEG). Apparent total tract DMD was also estimated (eDMD) from dietary and faecal concentrations of internal markers, using the following formula:
 $$\eqalign {{\rm \hskip-100pt eDMD}&\left( {{\rm g}\,/\,{\rm kg}\,{\rm DM}} \right){\equals}1000{\minus}1000 \cr &{\times}\left( {{{{\rm dietary}\,{\rm marker}\,{\rm concentration} {\rm (g\,/\,kg}\,{\rm DM)}} \over {{\rm faecal}\,{\rm marker}\,{\rm concentration (g\,/\,kg}\,{\rm DM)}}}} \right)$$
Some studies used more than one internal marker while others (three from Norway and two from Denmark) used none. All internal markers in all experiments were used for estimating eDMD. As such, the curated number of observations for estimated DMD was greater than that observed (409 v. 354). The internal markers used for the determination were indigestible NDF (iNDF) (determined on ash-free basis) and acid insoluble ash (AIA). Individual DMIs were also estimated by means of the simultaneous use of an internal marker to estimate eDMD and an external marker to estimate eFDMO using the following equation: eDMI =
 $${{{\rm 1000}{\times}{\rm eFDMO}} \over {{\rm 1000} - {\rm eDMD}}}$$
. Just as above, the curated number of observations for estimated DMI (eDMI) was greater than that observed (846 v. 416). Feed efficiency of individual animals were also estimated from both external and internal markers as eFE=g ECM/kg eDMI.
$${{{\rm 1000}{\times}{\rm eFDMO}} \over {{\rm 1000} - {\rm eDMD}}}$$
. Just as above, the curated number of observations for estimated DMI (eDMI) was greater than that observed (846 v. 416). Feed efficiency of individual animals were also estimated from both external and internal markers as eFE=g ECM/kg eDMI.
Statistical analysis
Variance components of observed and marker-based variables were estimated using the PROC MIXED procedure of SAS (version 9.4; SAS Institute Inc., Cary, NC, USA) with experiment (Exp), diet within experiment (Diet(Exp)), period within experiment (Period(Exp)) and cow within experiment (Cow(Exp)) as random factors. Covariance structure was specified using the TYPE=VC option in the RANDOM statement. From these estimates, repeatability values (Rep) for DMI, FDMO, DMD, eFDMO, eDMD and eDMI were calculated as Rep=
$${{\sigma _{{Cow}}^{2} } \over {\sigma _{{Cow}}^{2} {\plus}\sigma _{{Residual}}^{2} }}$$
, where σ
2
Cow and σ
2
Residual are Cow(Exp) and residual variances, respectively. For the observed data, repeatability values estimated the correlation between values from consecutive samples on the same cow, on the same diet and within the same period of the same experiment. Mixed regression models (Supplementary Figures S1 to S6) of observed against estimated values were developed for each marker separately (experiment was used as a random effect). They showed varying prediction errors, indicating differences among markers. Therefore, for marker estimated variables, the component marker within experiment (Marker(Exp)) was added. Repeatability values for marker-based variables estimated the correlation between values from consecutive samples of the same marker used on the same cow, on the same diet and within the same period of the same experiment. The standard deviation and CV for each factor were calculated as a percentage of the square root of the variance estimate and standard deviation divided by the corresponding mean value of each factor, respectively.
Relationships between observed variables (DMI, DMD, FDMO and FE) and their corresponding marker based estimates (eDMI, eDMD, eFDMO and eFE) were explored, then models for predicting FE (defined as g ECM/kg DMI) were developed by regression analysis within the MIXED procedure of SAS (Littell et al., Reference Littell, Milliken, Stroup, Wolfinger and Schabenberger2006) as follows:
 $$Y_{{ij}} {\equals}B_{0} {\plus}B_{1} X_{{1ij}} {\plus}b_{0} {\plus}b_{1} X_{{1ij}} {\plus}B_{2} X_{{2ij}} {\plus}B_{3} X_{{3ij}} {\plus}e_{{ij}} ,$$
where Y ij is the expected value for the dependent variable Y observed at level of j of the independent variable X in the study i; B 0 the overall intercept (fixed effect); b 0 the random effect of study i on the intercept (i=1, … , 29); bi the random effect of study i on the regression coefficient of Y on X 1 in study i (i=1, … , 29); B 1, … , B 3 are regression coefficients of Y on X 1, … , X 3 of Y across all studies (fixed effects); X 1ij , … , X 3ij . The value j of the continuous variable X 1, … , X 3 in the study i; and e ij the residual error.
The observed v. estimated regression models included one independent variable X
1 and one random statement: a random intercept and slope of X
1 with SUBJECT=Marker(Exp) using the TYPE =UN (unstructured covariance). To evaluate model accuracy, root mean square prediction error (RMSPE) was calculated as follows: RMSPE =
$$ \surd{\rm [\Sigma (Observed - Estimated })^{2} {\rm \,/\,n]},$$
where n is the number of pairs of observed and estimated values being compared. The error was expressed as a proportion of the observed mean to give an estimate of the relative prediction error (RPE). The mean square prediction error (MSPE) was decomposed into random error, error due to the deviation of regression slope from unity and error due to overall bias as described by Bibby and Toutenburg (Reference Bibby and Toutenburg1977). Residual analyses were conducted by regressing residuals (observed–estimated) on estimated values. Observed values were adjusted for random study effect. To make the slope and intercept estimates in the regression orthogonal and hence independent, estimated values were centred. This was done by subtracting the mean of all estimated values from each estimate as described by St-Pierre (Reference St-Pierre2003). Mean biases were evaluated by the deviation of regression intercepts from zero while the deviation of the slopes of the regression equations from unity was used to determine the presence of linear biases.
In the FE models, number of independent variables varied between two and three. A basal model was first developed using ECM and BW as independent variables, then each of the marker-based estimates (eDMI, eDMD and eFDMO) was added separately to the basal model to assess their influence on FE predictions. The models included 3 random statements: a random intercept and slope of X 1 with SUBJECT=Diet(Exp), a random intercept with SUBJECT=Period(Exp)and a random intercept with SUBJECT=Marker(Exp), using the TYPE=VC (variance components) covariance structure for all random statements. These random statements allowed the effects of study, diet, period and marker to be removed from the estimates. The method=ML (maximum likelihood) statement was used in the PROC MIXED model syntax. Only one random independent variable was used to avoid over-parameterised models and improve convergence (St-Pierre, Reference St-Pierre2001). The models were evaluated on the basis of residual variance (σ 2 Residual).
Results
Data description
Mean and ranges of marker recoveries and animal production data are shown in Table 1. Energy-corrected milk production displayed large variation across studies (CV= 20.7%) ranging from 15.1 to 40.6 kg/day. Body weight averaged 609 kg and covered the ranges (459 to 790 kg). Average eDMD (698 g/kg DM) was lower than observed DMD (740 g/kg DM). The means of observed DMI and FE were 18.5 kg/day and 1410 g ECM /kg of DMI, respectively. Estimated DMI averaged 17.5 kg/day and showed greater variation (CV=24.9%) than observed DMI (CV=14.6%). The overall mean of FDMO was 4.9 kg for total collection and 5.1 kg for marker-based estimate, respectively. Average recovery rates of markers were 0.86, 0.95, 0.80, 1.01, 0.99 and 0.94 g/g for iNDF, AIA, Cr-mordanted fibre, Ytterbium, Co-EDTA and Cr-EDTA, respectively. There was no recovery rate for PEG because it was used in studies where faecal grab samples were used for FDMO measurements.
Description of observed and estimated (intake, excretion, apparent total-tract digestibility) measures, milk production and marker recoveries for the dataset derived from 29 digestibility studies in lactating dairy cows

DMI=dry matter intake; ECM=energy-corrected milk.
1 DMI estimated from both external markers (Cr-mordanted fibre, Yb, polyethylene glycol (PEG), Cr-ethylenediaminetetraacetic acid (EDTA) and Co-EDTA) and internal markers (indigestible NDF (iNDF) and acid insoluble ash (AIA))
2 Feed efficiency (FE) calculated as gram of ECM/kg of dry matter (DM) intake.
3 Faecal DM output (FDMO) measured by total collection
4 Faecal DM output estimated (eFDMO) from external markers (Cr-mordanted fibre, Yb, Co-EDTA, Cr-EDTA and PEG).
5 Observed apparent total tract DM digestibility (DMD).
6 Apparent total tract DM digestibility estimated (eDMD) from internal markers (iNDF and AIA).
Variance components
The variance components for Exp, Diet(Exp), Period(Exp), Cow(Exp) and Residual to separate experimental, dietary, period and individual animal effects for observed and estimated variables are presented in Tables 2 and 3, respectively. In general, variation associated with the effect of Exp was the largest source of variation for all observed variables (Table 2). Except for DMD where Diet(Exp) variation was similar to Cow(Exp), the variation due to Cow(Exp) was higher than that due to Diet(Exp) for DMI and FDMO (CV=8.04% v. 5.12% and 10.3% v. 6.74%, respectively). Between-cow variability was higher for FDMO than for DMI and DMD while DMD exhibited the lowest between-cow variation (CV=1.69%). Repeatability values of observed variables were considerably high (Rep ⩾0.54).
Variance component and repeatability estimates of observed dry matter intake (DMI), apparent total tract dry matter digestibility (DMD) and faecal dry matter output (FDMO) developed using the dataset derived from 29 cross-over studies conducted in lactating dairy cows

Exp=experiment; Diet(Exp)=diet within experiment; Period(Exp)=period within experiment; Cow(Exp)=cow within experiment; DM=dry matter.
1 Probability of Z-value.
2 Calculated as the square root of the variance-component estimate.
3 Calculated as the percentage of SD divided by the respective mean value of the variable.
4
Repeatability
$${\equals} {{\sigma _{{Cow}}^{2} } \over {\sigma _{{Cow}}^{2} {\plus}\sigma _{{Residual}}^{2} }}$$
where σ
2
Cow and σ
2
Residual are Cow(Exp) and residual variances, respectively.
Variance component and repeatability estimates of marker estimated (eDMI, eFDMO and eDMD)Footnote 1 variables developed using the dataset derived from 29 cross-over studies conducted in lactating dairy cows

1 eFDMO= Faecal dry matter (DM) output estimated from external markers (Cr-mordanted fibre, Yb, Co-EDTA), Cr-EDTA and PEG); eDMD=apparent total tract DM digestibility estimated from internal markers (iNDF and AIA). Refer to Table 1 for marker abbreviations; eDMI=DMI estimated from a combination of external and internal markers above.
2 Exp=experiment; Diet(Exp)=diet within experiment; Period(Exp)=period within experiment; Cow(Exp)=cow within experiment; Marker(Exp)=marker within experiment.
3 Probability of Z-value.
4 Calculated as the square root of the variance-component estimate.
5 Calculated as the percentage of SD divided by the respective mean value of the variable.
6
Repeatability=
$${{\sigma _{{Cow}}^{2} } \over {\sigma _{{Cow}}^{2} {\plus}\sigma _{{Residual}}^{2} }}$$
where σ2
Cow and σ2
Residual are Cow(Exp) and residual variances, respectively.
For estimated variables, Marker(Exp) was included to separate the effect of marker (Table 3). The variation due to experiment was not significant (P=0.40) for eDMD but tended to have an influence on eDMI (P=0.10). As in the case of the observed variables, between-cow variation for eDMD was of lower magnitude than for eDMI and eFDMO (1.39% v. 9.07% and 9.14%, respectively). Overall, variation associated with the effect of marker was the largest source for the variables. However, it is worth noting that Marker(Exp) variation was similar to Exp only for eFDMO. Estimated FDMO showed the highest repeatability (Rep=0.51) value among marker-based estimates while eDMD recorded the lowest value (Rep=0.12). Observed variables relatively gave higher repeatability than their corresponding marker-based estimates.
Predictions of faecal dry matter output, apparent total tract dry matter digestibility and dry matter intake using markers
The relationship between FDMO and eFDMO for individual external markers are shown in Supplementary Figure S1 (Cr-mordanted fibre), Supplementary Figure S2 (Yb), Supplementary Figure S3 (Co-EDTA) and Supplementary Figure S4 (Cr-EDTA). Cr-mordanted fibre gave the poorest prediction (RMSPE=1.63 kg/day), about three times the error associated with predictions from the fluid-phase (Co-EDTA–0.49 kg/day and Cr-EDTA–0.53 kg/day) and small particle-phase markers (Yb–0.56 kg/day). Moreover, the relationship between DMD and eDMD for individual internal markers are shown in Supplementary Figure S5 (iNDF) and Supplementary Figure S6 (AIA). Indigestible NDF gave a worse prediction (RMSPE= 51.9 g/kg DM) which is four times the error associated with AIA (11.7 g/kg DM). Predictions from all individual markers were associated with errors. It is not the objective of the present meta-analysis to compare markers for performance. Therefore the discussion on individual markers will not be detailed.
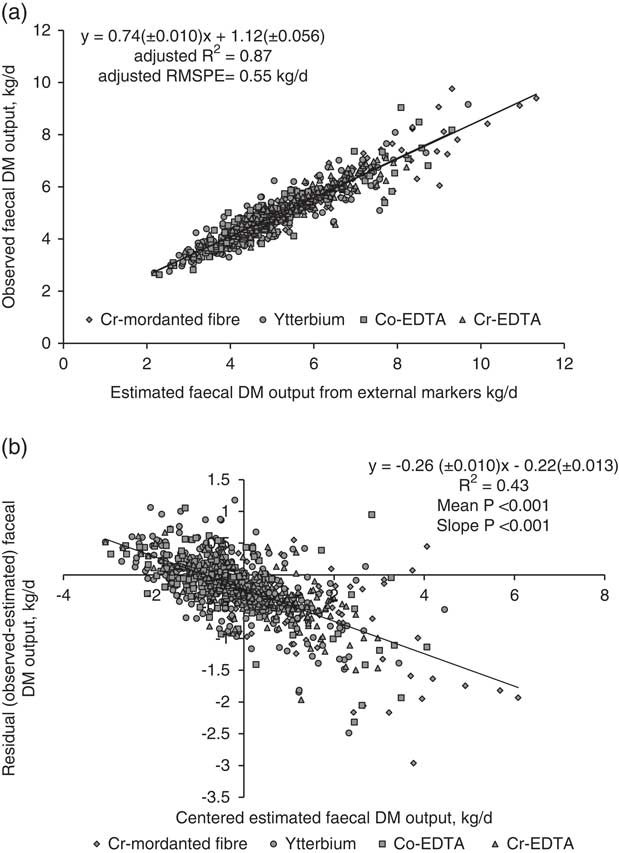
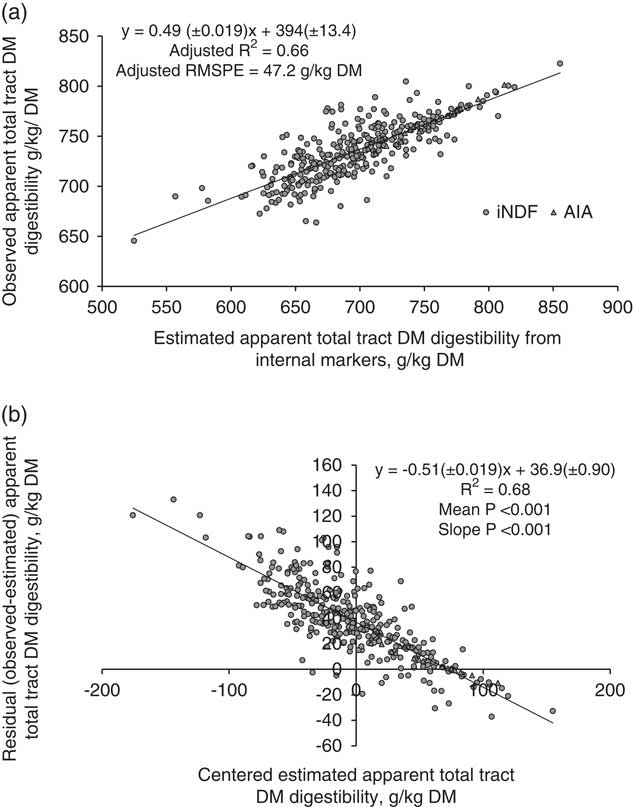
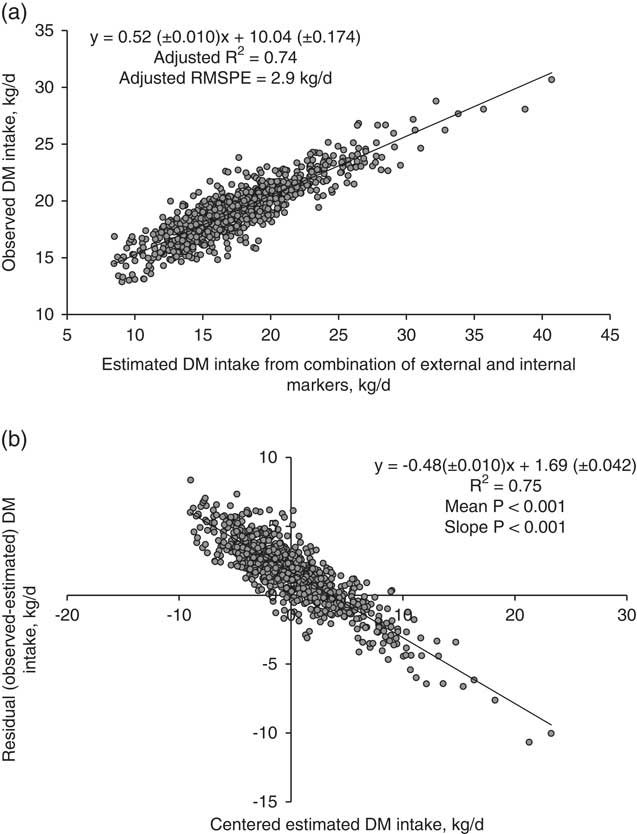
All markers were combined to develop regression equations. The relationship between FDMO and eFDMO (for all external markers combined) is shown in Figure 1a. The following linear relationship was developed with the mixed regression model: FDMO (kg/day)=0.74(±0.010)×eFDMO + 1.12(±0.056). The R 2 was 0.87 and RMSPE=0.55 kg/day (10.9% of the observed mean). External markers over-predicted FDMO by 0.22 kg/day (4.4%). The decomposition of MSPE to mean, slope and random error was 16.3%, 36.3% and 47.6%, respectively. In residual analysis, the mean (intercept=−0.22±0.013, P<0.001) and linear (slope=−0.26±0.010, P<0.001) biases were clearly significant as shown in Figure 1b. Figure 2a shows the relationship between DMD and eDMD (for both AIA and iNDF combined). The RMSPE was 47.2 g/kg, 6.4% of the observed mean. Internal markers underestimated DMD by 36.8 g/kg DMI (5% of observed mean). Results showed significant mean and linear biases (P<0.001, Figure 2b) and the contribution of mean, slope and random error of total MSPE was 61.1%, 26.3% and 12.6%, respectively. The relationship between DMI and eDMI is shown in Figure 3a. The R 2 was 0.74 and RMSPE=2.9 kg/day (15.4% of the observed mean). The simultaneous use of both external and internal markers underestimated DM intake by 8.8% (Figure 3b). This mean bias was clearly significant (intercept=1.69±0.042, P<0.001). There was also a presence of slope bias (slope=−0.48±0.010, P<0.001). The decomposition of MSPE to mean, slope and random error was 33.1%, 49.8% and 17.1%, respectively.
Relationship between estimated and observed faecal dry matter (DM) output (kg/day) in dairy cows with mixed model regression analysis (a), and between centred estimated values and residuals (observed–estimated) faecal DM output (kg/day), (b), n=802. Estimated values were obtained using the external markers, Cr-mordanted fibre, Yb, Co-EDTA and Cr-EDTA (refer to Table 1 for marker abbreviations). R 2 and root mean square prediction error (RMSPE) are adjusted for random external marker within experiment effect. Estimated values were centred by subtracting the mean of all estimated values from each estimated value.
Relationship between estimated and observed apparent total tract dry matter (DM) digestibility (g/kg DM) in dairy cows with mixed model regression analysis (a), and between centred estimated values and residuals (observed–estimated) apparent total tract DM digestibility (g/kg DM), (b), n=346. Estimated values were obtained using internal markers iNDF and AIA (refer to Table 1 for marker abbreviations). R 2 and root mean square prediction error (RMSPE) are adjusted for random internal marker within experiment effect. Estimated values were centred by subtracting the mean of all estimated values from each estimated value.
Relationship between estimated and observed dry matter (DM) intake (kg/day) in dairy cows with mixed model regression analysis (a), and between centred estimated values and residuals (observed–estimated) DM intake (kg/day), (b), n=841. Estimated values were obtained using the combinations of internal markers (iNDF and AIA) and external markers (Cr-mordanted fibre, Yb, Co-EDTA and Cr-EDTA). Refer to Table 1 for marker abbreviations. R 2 and root mean square prediction error (RMSPE) are adjusted for random external and internal marker combination within experiment effect. Estimated values were centred by subtracting the mean of all estimated values from each estimated value.
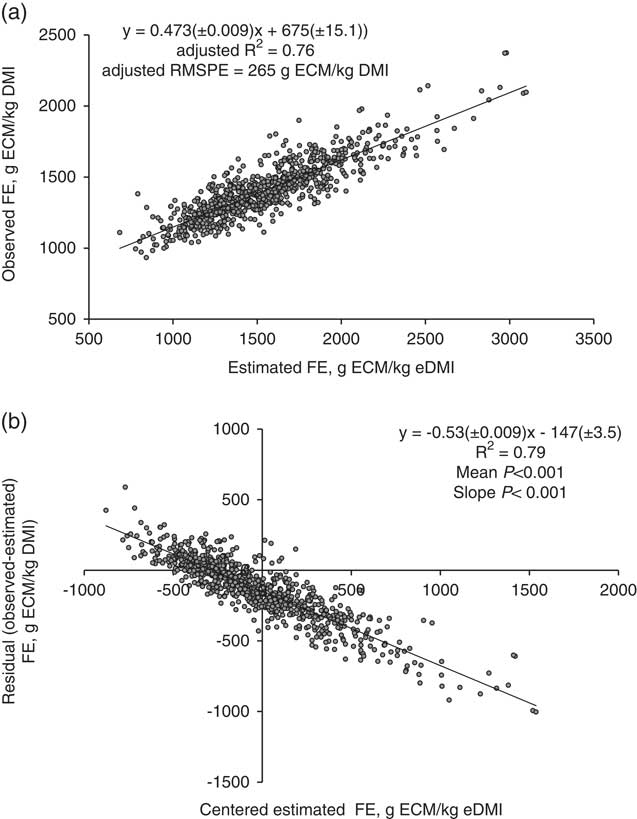
Feed efficiency models
The relationship between FE and eFE is shown in Figure 4a. The R 2 was 0.76 and RMSPE=265 g ECM/kg DMI (18.7% of the observed mean). Results showed significant mean and linear biases (P<0.001, Figure 4b) and the contribution of mean, slope and random error of total MSPE was 31.0%, 54.7% and 14.2%, respectively. In order to assess the utility of digesta markers in measuring FE, FE (g of ECM per kg of DMI) was modelled using different combinations of ECM and BW with marker estimated variables by mixed model regression (Table 4). Energy-corrected milk was positively related to FE (P<0.01) while increases in BW were linearly associated (P<0.01) with decreases in FE. Both eFDMO and eDMI were negatively associated with FE and their inclusion in the model resulted in lower residual variance. The best model for predicting FE developed from the dataset was FE (g/kg)=1179(±54.05)+38.2(±2.05)×ECM (kg/day)−0.64(±0.051)×BW (kg)−75.6(±4.39)×eFDMO (kg/day). Although eDMD was positively related to FE, its inclusion in the model only showed a tendency (P=0.05) to reduce the residual variance.
Relationship between estimated and observed feed efficiency (FE= kg ECM/kg DMI) in dairy cows with mixed model regression analysis (a), and between centred estimated values and residuals (observed–estimated) FE (b), n=816. ECM=energy-corrected milk; DMI=dry matter intake. Estimated values of DMI were obtained using the combinations of internal markers (iNDF and AIA) and external markers (Cr-mordanted fibre, Yb, Co-EDTA and Cr-EDTA). Refer to Table 1 for marker abbreviations. R 2 and root mean square prediction error (RMSPE) are adjusted for random external and internal marker combination within experiment effect. Estimated values were centred by subtracting the mean of all estimated values from each estimated value.
Mixed regression equations developed for predicting feed efficiency (FE=A+BX1+CX2+DX3) from ECM, BW and marker estimated variables using dataset derived from 29 digestibility studies in lactating dairy cows

ECM=energy-corrected milk; BW=Body weight; eFDMO=faecal dry matter (DM) output estimated from external markers (Cr-mordanted fibre, Yb, Co-ethylenediaminetetraacetic acid (EDTA) and Cr-EDTA); eDMD=apparent total tract DM digestibility estimated from internal markers (iNDF and AIA); eDMI=DM intake estimated from a combination of external (Cr-mordanted fibre, Yb, Co-EDTA, Cr-EDTA) and internal markers (iNDF and AIA). Refer to Table 1 for marker abbreviations; σ2 Residual=residual variance.
*P=0.05; **all P-values ⩽0.01.
Discussion
It should be noted that these results were derived from confined cows in Nordic European countries. Cows were offered diets based on mainly grass silage with a wide variety of concentrates. However, application of the present results especially of internal markers to grazing cows or cows offered diets based on non-grass silage should take account of the possible effects of geographic location, management, dietary factors and analytical laboratory procedures because they can alter the dietary and faecal internal marker concentrations. For instance, consumption of soil by grazing animals would undoubtedly nullify results from AIA.
Faecal dry matter output
Measurement of faecal output is among the most critical determinations necessary for the evaluation of the nutritional status of ruminants. Measurement approaches vary from direct methods (total collection) to indirect techniques using external markers. However, problems associated with marker methods result in variation in faecal marker recovery rates. In this dataset, the recovery of Cr as large particle phase-marker was rather low (0.80 g/g) compared to the small particle-phase (Yb−1.01 g/g) and liquid-phase markers (Co-EDTA−0.99 g/g and Cr-EDTA−0.94 g/g). This average Cr recovery is lower than 0.89 reported by Delagarde et al. (Reference Delagarde, Pérez-Ramírez and Peyraud2010). In our study, low recovery of Cr is surprising because Cr-mordanted straw was administered twice daily (12 h apart) following priming dose via the rumen cannula to facilitate rapid equilibration of the marker concentration in the digestive tract. According to Coates and Penning (Reference Coates and Penning2000), twice daily dosing of external markers is usually satisfactory and will reduce the diurnal fluctuations in faecal marker concentrations. Delagarde et al. (Reference Delagarde, Pérez-Ramírez and Peyraud2010) provided a number of reasons for the incomplete recovery of external markers. In this meta-analysis, the most likely reason for incomplete Cr recovery is related to laboratory analysis. Blank faeces were routinely used as a matrix but there are other critical steps that may have distorted the analysis (see Holt, Reference Holt1993).
One problem of liquid-phase external markers is their short retention time in the digestive tract as they cause larger diurnal variation in marker concentration unless markers are dosed several times in a day (Marais, Reference Marais2000). In the present meta-analysis, this problem was reduced because of continuous infusion of flow markers (Yb, Cr- and Co-EDTA) following priming doses through the rumen cannula. As such, their mean recovery rates were between 0.94 and 1 g/g.
The repeatability of FDMO was high for both total collection and marker-based estimate (0.62 and 0.57, respectively). Similarly, the coefficient of determination (R 2) for the prediction of FDMO from eFDMO was high (0.87). However, linear and mean biases were associated with the prediction pointing to the fact that high repeatability and high R 2 do not always translate to high accuracy. Since the same method (atomic absorption spectroscopy) was used to analyse marker concentrations in feed and faeces across studies, the errors cannot be due to differences in laboratory method. They, however, can be caused by the problems of marker recovery (especially Cr-mordanted fibre) and biases during analytical laboratory procedures. In general, fairly reliable (RPE=10.9%) estimates of FDMO can be made using external markers.
Apparent total tract dry matter digestibility
Apparent total tract DMD is the single most important measure to describe the nutritive value of diets. Because of existing between-cow variations in DMD, easy methods of determining DMD would be valuable to livestock researchers and producers. The use of internal markers for assessing digestibility is advantageous because the extra step of mixing them into the ration is avoided and if the TMR is mixed correctly, internal markers are well distributed. The between-cow variation in DMD was 1.69% (SD=12.6 g/kg) and this agrees with the 12.3 g/kg recorded in earlier studies by Mehtiö et al. (Reference Mehtiö, Rinne, Nyholm, Mäntysaari, Sairanen, Mäntysaari, Pitkänen and Lidauer2016) for between-cow variation in organic matter digestibility (OMD) determined using AIA as an internal marker. In our dataset, the eDMD from AIA was associated with a much smaller prediction error (RPE=1.50%). The recovery rate of AIA was also acceptable (0.95 g/g). Indigestible NDF, on the other hand, showed higher prediction error (RPE=7.0%) and a lower faecal recovery (0.86 g/g). The better performance of AIA than iNDF as a digestibility marker is expected because the cows within experiments were fed mainly grass silage-based diets. Huhtanen et al. (Reference Huhtanen, Kaustell and Jaakkola1994) found AIA to be the most suitable digestibility marker for grass silage or hay-based diets followed by iNDF. Similarly, Nousiainen et al. (Reference Nousiainen, Rinne and Huhtanen2009) found good relationship between observed and estimated OMD based on AIA. In spite of that, low concentrations of AIA may preclude its usefulness as a digestibility marker in maize silage and high grain diets (Lee and Hristov, Reference Lee and Hristov2013). Data from Lee and Hristov (Reference Lee and Hristov2013) showed iNDF to be a more reliable digestibility marker than AIA in dairy cows fed maize silage-based diets. As such, the type of diet should be taken into consideration when estimating DMD using internal markers.
Estimated DMD from both markers were combined to estimate the variance components and the repeatability was rather low (0.12) relative to observed DMD (0.54). The repeatability value is within the range reported by Mehtiö et al. (Reference Mehtiö, Rinne, Nyholm, Mäntysaari, Sairanen, Mäntysaari, Pitkänen and Lidauer2016) when using iNDF to estimate DMD from NIRS. The relationship between marker-based estimates and observed data showed an under-prediction of DMD by internal markers. A number of reasons could explain the biases especially originating from iNDF. These include analytical method used for estimating iNDF (in vitro v. ruminal in situ), different incubation time for ruminal in situ procedures, feed composition, particle grind size, nylon bag pore size and biases during analytical laboratory procedures (Krizsan and Huhtanen, Reference Krizsan and Huhtanen2013; Krizsan et al., Reference Krizsan, Rinne, Nyholm and Huhtanen2015). In our study, the bias cannot be attributed to incubation time, feed composition or analytical method used since the procedure (ruminal in situ incubation for 288 h) and feed composition (forage to concentrate ratio of 60 : 40) remained strictly similar across studies. A possible reason could be related to the particle size (<2.0 mm) and different pore sizes of the nylon bags (15, 17 and 36 µm in Finland, Norway and Denmark, respectively) used. There are consequences for particle losses, especially with faecal samples. Faecal particles are fragile after digestion, and milling can produce fine particles that are more likely to escape from bags than feed particles. Krizsan et al. (Reference Krizsan, Rinne, Nyholm and Huhtanen2015) recommended a grind size of 2.0 mm to be used in ruminal in situ determination of iNDF in order to avoid potential errors.
Dry matter intake
Direct methods for DMI measurements are costly and not applicable on commercial farms. The simultaneous use of external marker for FDMO and internal marker for DMD estimates has been employed for indirect measurement of DMI (Ferret et al., Reference Ferret, Plaixats, Caja, Gasa and Prio1999; Ahvenjärvi et al. Reference Ahvenjärvi, Nyholm, Nousiainen, Mäntysaari and Lidauer2018). In our study, several combinations of external and internal markers were used for DMI estimates. Repeatability estimates of DMI in different populations are lacking, but estimates in the present study (0.65 for DMI and 0.47 for eDMI) are consistent with the across lactation repeatability of 0.66 documented by Berry et al. (Reference Berry, Coffey, Pryce, De Haas, Løvendahl, Krattenmacher, Crowley, Wang, Spurlock and Weigel2014) from individual daily feed intake of Holstein-Friesian cows and heifers from nine countries. The high repeatability of eDMI indicates its potential to be used in estimating DMI for correct ranking of cows aimed at selection purposes.
Despite the high repeatability of eDMI, its prediction of observed DMI showed both mean and slope biases. In a recent study, Ahvenjärvi et al. (Reference Ahvenjärvi, Nyholm, Nousiainen, Mäntysaari and Lidauer2018) estimated eDMI from a combination of iNDF and PEG. In that study, using the same eDMD for a group of cows fed the same diet resulted in more accurate DMI prediction than using animal-specific eDMD. The authors established that to improve DMI predictions, cow-specific eDMD must be determined with high precision and accuracy over those based on group-specific eDMD. Inherently, the biases in predicting DMI in our study could be attributed to the problems enumerated above for DMD as well as FDMO estimates. Markers underestimated DMI at low measured feed intake and overestimated DMI at high measured DMI. Generally, our model under-predicted DMI with an RPE=15.4%. According to Fuentes-Pila et al. (Reference Fuentes-Pila, DeLorenzo, Beede, Staples and Holter1996), an RPE lower than 10% indicated a satisfactory prediction of DMI; RPE between 10% and 20% indicated relatively good or acceptable predictions, and RPE greater than 20% indicated unsatisfactory predictions. Even though the prediction may be inaccurate, it is precise (high R 2 and repeatability) and provides acceptable estimates of DMI. However, recognition of the inadequacies involved and caution is necessary for interpretation of data.
Feed efficiency models
Several measures exist for FE but no single measure can be applicable to all farms. Dry matter intake is a key component of all FE measures. However, the high cost of DMI measurements in large herds has limited its recording to only research herds. In the current study, the indirect method of estimating intake from digesta markers was used. Subsequently, the estimated DMI was used to estimate FE (eFE) in its simplest form, feed conversion efficiency (FCE) expressed as the ratio of ECM to DMI (Linn, Reference Linn2006). Marker-based estimate of FE (eFE) precisely (high R 2) predicted observed FE but was inaccurate due to the presence of both mean and slope biases. Although FCE is easy to measure and conceptually simple, it has been criticised for not estimating the metabolic efficiency of animals and for possible negative consequences it has on traits including energy balance, health and fertility (Connor, Reference Connor2015). One way to improve FCE measurement is to use a basal linear model with milk production and BW (mainly to account for the metabolic efficiency) as independent variables because they can easily be measured on-farm. They are also, known to greatly influence FE as they are important drivers of feed intake (VandeHaar, Reference VandeHaar2016). Furthermore, expressing FE as ECM/ eDMI still requires the use of both internal and external markers which necessitates higher analytical cost and intensive labour. Since the goal is to find simple, low cost but accurate and precise analytical techniques, we added each of the marker-based estimates to the basal model so as to assess the effectiveness of using single markers (either internal markers for eDMD or external markers for eFDMO) and double markers (combination of both internal and external markers for eDMI) in FE measurements.
In our study, ECM was positively associated with FE. At constant BW, 1 kg increase in ECM resulted in an increase of 27.9 g/kg in FE. Spurlock et al. (Reference Spurlock, Dekkers, Fernando, Koltes and Wolc2012) also reported a strong positive correlation (r=0.87) between FCE and milk yield. This implies that as milk yield increases among dairy herds, corresponding gains in FCE would be achieved. Selecting for FCE a trait based on the ratio of two component traits, however, can produce unpredictable results if done in early lactation. In early lactation, greater milk output increases the cow’s energy requirement which cannot be met solely by increased feed intake causing mobilisation of energy from her body tissue to support the increased energy demand for lactation (Connor, Reference Connor2015). This occurrence contributes to strong negative genetic correlations between FCE and body condition score (BCS) and energy balance (Vallimont et al., Reference Vallimont, Dechow, Daubert, Dekleva, Blum, Barlieb, Liu, Varga, Heinrichs and Baumrucker2011; Spurlock et al., Reference Spurlock, Dekkers, Fernando, Koltes and Wolc2012). Hence, improvements in FCE will lead to a simultaneous selection of cows that exhibit negative energy balance and lower BCS during early lactation. Greater losses in BCS and energy balance are linked with poor fertility performance and health (Roche et al., Reference Roche, Macdonald, Burke, Lee and Berry2007). The study of Spurlock et al. (Reference Spurlock, Dekkers, Fernando, Koltes and Wolc2012) further showed no correlation between FCE and energy balance when the evaluation was made in mid-lactation (75 to 150 days in milk). This suggests a possibility to select for improved FCE specifically during this period with a lower risk of metabolic imbalance (Hooven et al., Reference Hooven, Miller and Smith1972). The cows used for this study were in mid-lactation.
Feed conversion efficiency is also strongly and negatively correlated (r= −0.66) with BW (Vallimont et al., Reference Vallimont, Dechow, Daubert, Dekleva, Blum, Barlieb, Liu, Varga, Heinrichs and Baumrucker2011). In our study, the relationship between FE and BW was negative. One kilogram gain in BW resulted in 0.60 g/kg loss in FE. Linn et al. (Reference Linn, Raeth-Knight and Litherland2009) reported that animals of high BW (815 kg) had lower FE (1320 v. 1550 g/kg) on average compared with animals of low BW (545 kg). These findings demonstrate that heavy cows are less efficient than light cows. Freeman (Reference Freeman1975) stated that heavier weight is undesirable especially when it is negatively correlated with efficiency both phenotypically and genetically. This difference is likely the result of the greater requirement for maintenance as BW is one of the factors closely related to net energy for maintenance (Searle et al., Reference Searle, Graham and Donnelly1982). A bigger (or heavier weight) animal will partition more energy for maintenance and less to production than a smaller animal would at the same feeding level. Thus, one way to improve FE is to decrease maintenance requirement by selecting for cows that are smaller where significant gains in FE can be captured by extra dilution of maintenance. Furthermore, the use of BW alone in estimating maintenance requirement could be misleading due to variation in BCS. The degree of error that can occur in the calculation of maintenance requirements if the BCS of the cow is not taken into account is emphasised in the study of Birnie et al. (Reference Birnie, Agnew and Gordon2000). In the present studies, the BCS of cows was not taken into account in predicting FE because it was not measured. Moreover, measurements were made in mid-lactation, a period of minimal to no losses in BCS.
In our studies, a combination of both internal and external markers was used to estimate DMI. Despite the inaccuracy of both markers in estimating DMI, they were useful in predicting FE. Accounting for eDMI in the FE model reduced the residual variance by 57.5%. Marker estimated DMI was negatively related to FE. When BW and ECM are kept constant, 1 kg of DM consumed resulted in 16.3 g/kg reduction in FE. A field study of six commercial herds by Casper et al. (Reference Casper, Whitlock, Schauff, Jones, Spangler and Ayangbile2004) also demonstrated an inverse relationship between FE and DMI. This indicates that cows with lower DMI have the ability to use less dietary energy to achieve higher levels of milk production as a result of maximised digestibility (Varga et al., Reference Varga, Dechow and Eastridge2013).
The digestibility of the diet reduces as the ingestion of total DM is elevated, essentially due to increased cell wall passage rate and decreased ruminal retention time (Huhtanen et al., Reference Huhtanen, Rinne and Nousiainen2009). Gabel et al. (Reference Gabel, Pieper, Friedel, Radke, Hagemann, Voigt and Kuhla2003) observed that lactating cows fed the same diet, but at 1.4, 2.7 and 4.6 times their energy requirements for maintenance, showed a decrease in DMD (74.8%, 72.3% and 67.2%, respectively) only with an increase in dietary DMI. Similarly, other authors reported linear depression in digestibility with increased intake (Colucci et al., Reference Colucci, Macleod, Grovum, Cahill and McMillan1989; Huhtanen et al., Reference Huhtanen, Rinne and Nousiainen2009). Since DMI is the denominator of FE, a negative relationship between DMI and DMD suggests that increased digestibility would improve FE. For Casper et al. (Reference Casper, Whitlock, Schauff, Jones, Spangler and Ayangbile2004) FE of cows from six dairy farms fed TMR was positively and significantly related to the eDMD from AIA. In the current study, eDMD was also positively related to FE but only showed a tendency to increase FE. In a larger dataset from production studies, the effect was significant (P. Huhtanen, Swedish University of Agricultural Sciences, Umeå, Sweden, personal communication). In studies, with cannulated cows such as this one, there can be more random variability due to stress caused by excessive interaction between people and animals. The inclusion of eDMD in the FE model only reduced the residual variance by 3.7%. The lack of improvement in the model could be attributed to the low between-cow variation (though significant but small) in eDMD.
The implication from an environmental stance is that improving DMD would reduce FDMO. In this dataset, the relationship between eFDMO and FE was negative and the inclusion of eFDMO in the FE model gave the lowest residual variance. Increased FDMO leads to reduced FE, either as a result of greater DMI and/or reduced digestibility. Limiting DMI reduces the passage rate, which increases residence time in the digestive tract, thereby increasing DMD and lowering FDMO.
The between cow variation was highest for eFDMO amongst all marker estimated variables pointing to the suitability of external markers over internal markers in estimating the between animal differences in FE. In addition, using eDMD to predict DMI is sensitive to even small errors in DMD. For example, ±3% unit differences in DMD at 700 g/kg DMD represent about 10% errors in DMI and FE. Considering possible inaccuracies, labour intensiveness and analytical costs of the marker techniques, a more practical option to acquire reliable FE data for genetic evaluation in the future is to estimate only FDMO by external markers for FE models.
Conclusion
The present analysis showed higher repeatability for observed measurements than marker-based estimates. This suggests that direct measurement of FDMO, apparent total tract DMD and DMI is the method of choice particularly in confinement systems unless otherwise impossible due to facility limitations. Marker-based estimate of FDMO explained most of the variability in FE pointing to the potential of ranking cows for FE based on FDMO estimated from external markers. Measuring DMD with internal markers did not improve prediction of FE reflecting small between cow variation in DMD and random errors associated with measurements.
Acknowledgements
The authors gratefully acknowledge the contributions of colleagues from Agri-Food Research in Finland (currently Natural Resources Institute Finland–LUKE, Jokioinen, Finland), Aarhus University (Aarhus, Denmark) and Norwegian University of Life Sciences (Ås, Norway), for providing the data to complete the individual cow dataset. This study was supported financially by the Feed Utilisation in Nordic Cattle (FUNC) project.
Declaration of interest
The authors declare no conflicts of interest.
Ethics statement
The experiments contributing to the present meta-analysis complied with the guidelines of the respective national legislations on animal experimentation and care of animals under study.
Software and data repository resources
None of the data were deposited in an official repository.
Supplementary material
To view supplementary material for this article, please visit https://doi.org/10.1017/S1751731119000247


 Open access

