


Introduction
Knowledge of the processes driving parasite diversity is central to understanding infection dynamics in endemic populations and pathogen emergence in new hosts. In contrast to a historical focus on simple one-host, one-parasite systems, there is now greater appreciation that parasites exist within communities of other parasites, harboured by hosts that may vary in their responses to parasitism (Johnson et al., Reference Johnson, De Roode and Fenton2015). Yet it is not clear how well ecological theory developed for free-living, sexually reproducing organisms applies to communities of microorganisms (Sutherland et al., Reference Sutherland, Freckleton, Godfray, Beissinger, Benton, Cameron, Carmel, Coomes, Coulson, Emmerson, Hails, Hays, Hodgson, Hutchings, Johnson, Jones, Keeling, Kokko, Kunin, Lambin, Lewis, Malhi, Mieszkowska, Milner-Gulland, Norris, Phillimore, Purves, Reid, Reuman, Thompson, Travis, Turnbull, Wardle and Wiegand2013). This is especially true for parasites and symbionts due to the environmental feedbacks that exist from their dependence on hosts for survival and reproduction (Costello et al., Reference Costello, Stagaman, Dethlefsen, Bohannan and Relman2012; Fierer et al., Reference Fierer, Ferrenberg, Flores, González, Kueneman, Legg, Lynch, McDonald, Mihaljevic, O’Neill, Rhodes, Song and Walters2012; Miller et al., Reference Miller, Svanbäck and Bohannan2018; Brown et al., Reference Brown, Mihaljevic, Des Marteaux and Hrček2020; Skičková et al., Reference Skičková, Svobodová, Kratou, Corduneanu, Cano-Argüelles, Aželytė, Tonk-Rügen, Majláthová, Obregon, Piloto-Sardiñas, Palinauskas and Cabezas-Cruz2025; Speer et al., Reference Speer, Víquez-R, Frick, Ibarra, Simmons, Dittmar, Calderón, Preciado, Medellín, Tschapka, Sommer and Perkins2025). Additionally, parasite community dynamics within hosts may occur at differing timescales compared to transmission among hosts. Given these differences, experimental manipulations of natural parasite communities are needed to explore the generality of community theory across organisms.
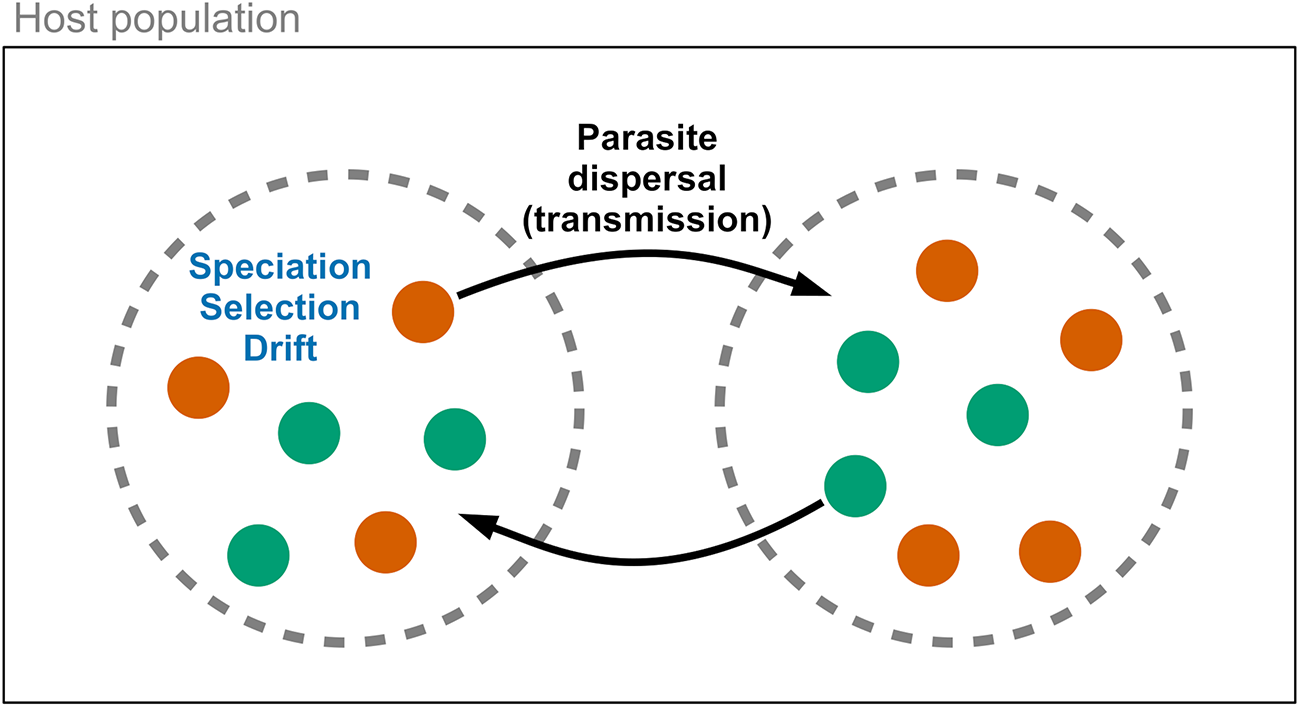
Metacommunities are a valuable framework for analysing parasite community dynamics within hosts (Leibold et al., Reference Leibold, Holyoak, Mouquet, Amarasekare, Chase, Hoopes, Holt, Shurin, Law, Tilman, Loreau and Gonzalez2004; Mihaljevic, Reference Mihaljevic2012). In this model, hosts act as discrete patches containing potentially interacting parasite species (Figure 1). Four forces may influence parasite community diversity: speciation, dispersal, ecological drift, and ecological selection (Vellend, Reference Vellend2010). The significance of these forces can vary at different scales (Seabloom et al., Reference Seabloom, Borer, Gross, Kendig, Lacroix, Mitchell, Mordecai and Power2015), i.e., within versus among hosts. Speciation generates parasite diversity but is generally slow and relies on dispersal for new diversity to spread across scales. Dispersal involves the movement of parasites within a host, among hosts, or among host populations. Within metacommunities, parasite species with equal competitive ability may vary in their production of new individuals, leading to changes in community composition (e.g., loss of rare species or increased beta diversity), similar to neutral theory predictions (Hubbell, Reference Hubbell2001). Drift occurs more rapidly in small communities with fewer individuals and limited dispersal. Ecological selection (or species sorting) operates within and among hosts due to variance in replication success influenced by host susceptibility. Parasite species may compete within a host via resource sharing or immune system interactions (Pedersen and Fenton, Reference Pedersen and Fenton2007; Telfer et al., Reference Telfer, Lambin, Birtles, Beldomenico, Burthe, Paterson and Begon2010). Species with better success can dominate, but this may be mitigated if fitness is influenced more by dispersal ability than competition, or through frequency-dependent selection by the host immune system. These four forces can independently affect parasite community diversity over time and may vary in their relative importance. However, since dispersal is the force that interacts with other processes across within-host and among-host scales (Vellend, Reference Vellend2010), it is an appealing target for experimental manipulation.
Conceptual diagram for parasite metacommunity dynamics. Parasites species (coloured dots) exist within host populations and disperse among hosts (dashed circles) via transmission. Ecological forces, including speciation, species selection (sorting), and drift, act on parasite communities within host individuals. These processes can be generalized to other ecological scales, such as between hosts and ectoparasitic vectors.

Figure 1 Long description
The diagram illustrates parasite metacommunity dynamics within host populations. Two dashed circles represent host populations, each containing colored dots symbolizing different parasite species. The left circle includes orange and green dots, with labels 'Speciation', 'Selection' and 'Drift' positioned near the orange dot. Arrows labeled 'Parasite dispersal (transmission)' connect the two circles, indicating movement of parasites between host populations. The right circle also contains orange and green dots, showing the interaction and transmission of parasite species between hosts.
Vector-borne infections are ideal systems for experimental study because the reduction of vector density limits dispersal of parasites between hosts, allowing for the analysis of other forces affecting the relative abundance of parasite species. Our focus in this study is on Bartonella bacterial communities in bats and their ectoparasitic flies. Bartonella spp. (Alphaproteobacteria: Hyphomicrobiales) are diverse intracellular bacteria that infect mammals and are transmitted by blood-feeding arthropods (Harms and Dehio, Reference Harms and Dehio2012). Numerous Bartonella species have been recognized as zoonotic pathogens in humans and can cause disease non-human animals (Breitschwerdt, Reference Breitschwerdt2014). Host species, including bats, frequently carry multiple distinct Bartonella genotypes or species that can vary in their relative abundance over time (Kosoy et al., Reference Kosoy, Mandel, Green, Marston, Jones and Childs2004a; Telfer et al., Reference Telfer, Clough, Birtles, Bennett, Carslake, Helyar and Begon2007; Becker et al., Reference Becker, Bergner, Bentz, Orton, Altizer and Streicker2018; Goodrich et al., Reference Goodrich, McKee and Kosoy2020; Fagre et al., Reference Fagre, Islam, Reeves, Kading, Plowright, Gurley and McKee2023). Previous studies have proposed that bat flies are vectors of Bartonella spp. in bats (Morse et al., Reference Morse, Olival, Kosoy, Billeter, Patterson, Dick and Dittmar2012; Brook et al., Reference Brook, Bai, Dobson, Osikowicz, Ranaivoson, Zhu, Kosoy and Dittmar2015; Moskaluk et al., Reference Moskaluk, Stuckey, Jaffe, Kasten, Aguilar-Setién, Olave-Leyva, Galvez-Romero, Obregón-Morales, Salas-Rojas, García-Flores, Aréchiga-Ceballos, García-Baltazar and Chomel2018), but no experimental studies have been performed to demonstrate their competence. Bat flies (Diptera: Streblidae, Nycteribiidae, Mystacinobiidae) are obligate ectoparasites of bat hosts that leave their hosts only briefly for mating and to deposit prepupae in the roost environment (Marshall, Reference Marshall1970; Dick and Patterson, Reference Dick, Patterson, Morand, Krasnov and Poulin2006; Dick and Dittmar, Reference Dick, Dittmar, Klimpel and Mehlhorn2014). Following these movements, bat flies may return to a new host individual, providing an opportunity for horizontal transmission of Bartonella between bats. In this study, we attempt to provide experimental evidence that bat flies are vectors of Bartonella by modifying bat fly population density and examining the changes in Bartonella prevalence and diversity in bat hosts over time.
Using a captive colony of straw-coloured fruit bats (Eidolon helvum) in Accra, Ghana (Figure 2A, B), the community dynamics of Bartonella bacteria were monitored in bats over 3 years (Figure 2C). During this experiment, the presumed vectors (bat flies) declined in density within the colony but were then restocked from a nearby wild source population of E. helvum (Figure 2B, C). The experiment thus controls parasite dispersal across 2 scales: the captive colony is closed to immigration (pups enter the colony uninfected), and transmission is manipulated via changes in the bat fly population size. By manipulating parasite dispersal, the effect of among-host dispersal is minimized and the effects of local, within-host effects (ecological drift and species sorting) on parasite dynamics and diversity can be observed. We hypothesized that Bartonella communities in the colony would respond to changes in among-host dispersal/transmission by bat flies. Specifically, we predicted that infection prevalence and diversity would at first decline concurrently with the bat fly population and then increase upon restocking of flies, thus providing experimental evidence that bat flies are vectors of Bartonella in bats. We hypothesized that limitation of parasite dispersal would result in stochastic losses of rare Bartonella species and increases in community beta diversity due to ecological drift and shifts in the rank abundance of Bartonella communities over time due to species sorting. Finally, we hypothesized that potential interactions among Bartonella species would be detectable based on coinfection frequencies, specifically evidence of competition and/or facilitation. This work expands our understanding of Bartonella dynamics in natural communities, particularly in bats and their ectoparasites. More broadly, this experiment deepens our understanding of the processes that affect parasite communities, patterns which may be compared with those seen in communities of free-living or mutualistic organisms.
Background information on the study system and experimental design. (A) Map of the geographic range of straw-coloured fruit bats (Eidolon helvum) in Sub-Saharan Africa. The study location in Ghana is highlighted with the black outline around the country border and the inset box showing the location in Accra. (B) The location of two sampling sites in Accra: the E. helvum captive colony (orange diamond) and the wild E. helvum population that sourced the bat flies restocked into the captive colony in January 2012. (C) Timeline of the study, including the 14 time points where blood was sampled from captive E. helvum, the sampling or transfer of bat flies, and a qualitative description of the bat fly population density over time.

Figure 2 Long description
The image contains three panels labeled A, B and C. Panel A is a map with the horizontal axis labeled Longitude, ranging from negative 20 to 60 and the vertical axis labeled Latitude, ranging from negative 40 to 40. The map shows a shaded geographic range across Sub-Saharan Africa. A small outlined region marks the location of Ghana on the map. Panel B is a detailed map of Accra with the horizontal axis labeled Longitude, ranging from approximately negative 0.30 to negative 0.10 and the vertical axis labeled Latitude, ranging from approximately 5.50 to 5.65. Two symbols are plotted: a diamond shape marking the captive colony site at approximately negative 0.20 longitude and 5.60 latitude and a triangle shape marking the wild population site at approximately negative 0.15 longitude and 5.55 latitude. Panel C is a timeline with the horizontal axis showing dates from 28 July 2009 to 14 May 2012. Two horizontal tracks are labeled Treatment and Timeline. The legend for bat fly sampling states: diamond shape means flies sampled from captive colony and triangle shape means flies transferred from wild bats to colony. The legend for status of bat flies states: a thin line means entered with cohorts, a medium line means low density and a thick line means restocked. On the Treatment track, a diamond shape appears at approximately February 2010 and a triangle shape appears at approximately February 2012. On the Timeline track, open circle markers appear at approximately 14 time points spanning from July 2009 to May 2012. The line along the Timeline track transitions between thin segments indicating entered with cohorts, a medium segment indicating low density and a thick segment indicating restocked, with the restocked segment appearing near the end of the timeline around January to May 2012.
Materials and methods
Study system and experimental design
Eidolon helvum (Chiroptera: Pteropodidae) is a long-lived, tree-roosting bat species distributed across Sub-Saharan Africa (Figure 2A) that can form enormous colonies during the local dry season (Hayman et al., Reference Hayman, McCrea, Restif, Suu-Ire, Fooks, Wood, Cunningham and Rowcliffe2012; Fahr et al., Reference Fahr, Abedi-Lartey, Esch, Machwitz, Suu-Ire, Wikelski and Dechmann2015). The bat flies (Cyclopodia greefi; Diptera: Nycteribiidae) hosted by this bat are wingless but can move among hosts within densely populated roosts. At least 6 distinct Bartonella species have been previously described in E. helvum (Kosoy et al., Reference Kosoy, Bai, Lynch, Kuzmin, Niezgoda, Franka, Agwanda, Breiman and Rupprecht2010; Bai et al., Reference Bai, Hayman, McKee and Kosoy2015) and the same species plus additional variants have been detected in C. greefi (Billeter et al., Reference Billeter, Hayman, Peel, Baker, Wood, Cunningham, Suu-Ire, Dittmar and Kosoy2012; Kamani et al., Reference Kamani, Baneth, Mitchell, Mumcuoglu, Gutiérrez and Harrus2014; McKee et al., Reference McKee, Peel, Hayman, Suu-Ire, Ntiamoa-Baidu, Cunningham, Wood, Webb and Kosoy2024).
Materials for this study come from a captive population of E. helvum bats (Figure 2B) in Accra, Ghana (Baker et al., Reference Baker, Suu‐Ire, Barr, Hayman, Broder, Horton, Durrant, Murcia, Cunningham and Wood2014). Briefly, the captive facility is a double-fenced hexagonal 27.5 m diameter and 3.5 m high structure; a solid metal roof and cladding at the base, along with the double-fenced walls, prevent contact with other animals. The captive population was founded by 3 cohorts (Supplementary Table S1) of mixed age and sex (n = 78) collected from a large seasonal colony in Accra (Hayman et al., Reference Hayman, McCrea, Restif, Suu-Ire, Fooks, Wood, Cunningham and Rowcliffe2012). The cohorts entered the colony in July 2009, November 2009 and January 2010; 2 additional cohorts were born in captivity in April 2010 (produced by mating between wild bats before they entered the colony) and 2011 (produced by mating in captivity). All 13 captive-born neonates were matched to the dam they were attached to at the first sampling point after birth. Ethics approval for bat capture and the fly restocking experiment was obtained from the Zoological Society of London Ethics Committee (WLE/0467), the Veterinary Services Directorate of Ghana, and the Wildlife Division of the Forestry Commission of Ghana.
Bats were assigned to age classes and sex upon entry to the colony and afterward according to approximate birth date and secondary sexual characteristics (Peel et al., Reference Peel, Baker, Hayman, Suu-Ire, Breed, Gembu, Lembo, Fernández-Loras, Sargan, Fooks, Cunningham and Wood2016): neonate, juvenile, sexually immature adult, and sexually mature adult. Passive-integrated transponder (PIT) tags were implanted in each bat either at entry or shortly after birth to uniquely identify each bat and adult bats additionally received necklaces with alphanumeric codes. Although 112 total bats entered the colony, 25 bats left the colony either through recorded mortality (n = 12) or presumed mortality after being recorded missing for ≥ 3 sampling points (n = 13). Furthermore, not all bats had complete sample histories throughout the experiment because they intermittently escaped capture for processing.
Blood samples were taken from the captive bats every 2 months in 2009 and 2010 and every 4 months in 2011 (Table S1; see Appendix 1 for sampling protocol). On 6 March 2010 (day 221), a sample of bat flies (C. greefi; n = 28) was removed from the colony for testing for the presence of Bartonella DNA (Figure 2C). The prevalence of bat flies on bats in the colony was 27% (6/22) in November 2009 and 46% (28/61) in March 2010. The ectoparasite prevalence in the source population for the colony bats was higher when sampled in January 2012, at 78% (39/50). This prevalence was also substantially lower than that observed in wild populations of E. helvum on islands in the Gulf of Guinea, where bat fly prevalence ranged from 60% to 92% (McKee et al., Reference McKee, Peel, Hayman, Suu-Ire, Ntiamoa-Baidu, Cunningham, Wood, Webb and Kosoy2024). From March 2010 onwards, bat flies were not observed on the colony bats nor were any other ectoparasites (fleas, ticks, mites) recorded, so it is assumed that little to no horizontal vector-borne transmission was occurring. The reason for the decline in bat flies during this period is unknown, but we suspect that the adult bat fly population present at the beginning of the study progressively died off since the estimated longevity of adult nycteribiids is only 3–5 months (Marshall, Reference Marshall1970). The conditions in the colony may have also prevented females from depositing prepupae on the concrete and metal surfaces of the colony housing, or the young flies failed to emerge under these conditions. Thus, the population was not replenished by new births. However, we cannot dismiss the possibility that other exogenous factors (temperature, humidity, or precipitation) may have also contributed to increased adult mortality or decreased births in the bat flies, which has been explored in recent studies (Andrianiaina et al., Reference Andrianiaina, Andry, Kettenburg, Ranaivoson, Lacoste, Dussart, Heraud, Laverty, Guth, Young, Andrianarimisa and Brook2025).
To test the effect of restoring transmission on Bartonella community dynamics and to provide evidence that bat flies are vectors, bat flies were experimentally added to the colony. On 17 January 2012 (day 903), a sample of adult bat flies (N = 91) was taken from the original wild source colony of bats (Figure 2C). From this total, 73 were randomly assigned to approximately half of the bats in the colony (N = 38 bats, 1–4 flies per bat). The remaining 18 bat flies and blood samples from bats in the wild source colony (N = 50) were used as comparison groups for the captive colony regarding Bartonella prevalence and diversity. Blood samples from captive bats were subsequently taken at 3 additional time points after the addition of flies: 31 January 2012, 14 February 2012 and 15 March 2012. In total, 910 blood samples were taken from the captive colony over 14 time points from 2009 to 2012 (a period of 961 days), of which 905 samples could be definitively assigned to an individual by PIT tag or necklace ID. An additional 50 blood samples and 18 flies were taken from wild bats on 17 January 2012.
Bacterial detection and gene sequencing
The focus of this study was on changes in Bartonella infection prevalence and the relative frequency of different Bartonella species in bats, so a molecular detection and sequencing approach capable of distinguishing coinfecting species was used. Bat blood and fly samples were tested for the presence of Bartonella DNA using a multi-locus PCR platform (Bai et al., Reference Bai, Gilbert, Fox, Osikowicz and Kosoy2016) targeting fragments of the 16S–23S ribosomal RNA intergenic spacer region (ITS), citrate synthase gene (gltA) and cell division protein gene (ftsZ). Each of these loci is capable of distinguishing among Bartonella species and subspecies (La Scola et al., Reference La Scola, Zeaiter, Khamis and Raoult2003), but may have amplification biases toward different Bartonella species in a sample (Kosoy et al., Reference Kosoy, McKee, Albayrak and Fofanov2018; Himsworth et al., Reference Himsworth, Byers, Fernando, Speerin, Lee and Hill2020). Thus, the purpose of this multi-locus approach was to confirm the detection of Bartonella DNA and to indicate across loci whether infections with multiple species were present. Further quantification of Bartonella infection load was performed using real-time PCR targeting the transfer-messenger RNA (ssrA). Sequences were verified as Bartonella spp. using the Basic Local Alignment Search Tool (BLAST; https://blast.ncbi.nlm.nih.gov/Blast.cgi). Samples were only considered positive if a significant match was observed, even if there was a positive real-time PCR result (cycle threshold value [Ct] < 40). Bartonella sequences with multiple peaks in the electropherogram were separated into 2 or more distinct sequences by comparison with previously obtained Bartonella sequences from E. helvum and C. greefi (Billeter et al., Reference Billeter, Hayman, Peel, Baker, Wood, Cunningham, Suu-Ire, Dittmar and Kosoy2012; Bai et al., Reference Bai, Hayman, McKee and Kosoy2015); this is possible due to the genetic dissimilarity of the Bartonella species found in these hosts and the distinct patterns of substitutions found in the sequenced markers (Bai et al., Reference Bai, Hayman, McKee and Kosoy2015; McKee et al., Reference McKee, Peel, Hayman, Suu-Ire, Ntiamoa-Baidu, Cunningham, Wood, Webb and Kosoy2024). Due to the frequency of multiple sequences obtained from these loci, conflicting sequences across genes were interpreted as evidence of coinfection rather than homologous recombination, and thus we report counts of sequences from distinct Bartonella species within a sample as recommended by Kosoy et al. (Reference Kosoy, McKee, Albayrak and Fofanov2018). All variants of Bartonella sequences sharing < 95% sequence similarity with previously identified Bartonella species were submitted to GenBank. PCR primers and protocols are listed in Tables S2 & S3. Additional details on bacterial detection and phylogenetic analysis are provided in Appendix 1.
Data recording and statistical analyses
Relevant measures of Bartonella infection prevalence, infection load, and diversity were recorded or calculated to assess changes that occurred during the experiment, including before and after the addition of bat flies to the captive colony. Bartonella infection prevalence within the captive bat colony, in sampled wild and captive flies, and from wild bats was reported based on the number of tested bats or flies that were positive at one or more loci (ITS, gltA, ftsZ, ssrA). Wilson scores were used to calculate 95% confidence intervals for single infection and coinfection prevalence. Bartonella alpha diversity was measured by Bartonella species richness and Shannon number, i.e., the effective number of species or the exponent of Shannon’s diversity index (Jost, Reference Jost2006); species richness within each sample based on the number of loci with positive sequences was also recorded. The frequency of Bartonella species detected in the colony was calculated from the presence/absence of each Bartonella species in the total number of sequences obtained across all loci for a given sample, including separate sequences obtained from the same locus. A custom bootstrapping procedure with 1000 samples from the observed multinomial distribution of Bartonella species frequencies was used to estimate 95% confidence intervals around measures of alpha diversity. Bartonella beta diversity was calculated across sampled bats and flies based on species presence/absence using the Jaccard index within the vegdist function in the R package vegan (Oksanen et al., Reference Oksanen, Simpson, Blanchet, Kindt, Legendre, Minchin, O’Hara, Solymos, Stevens, Szoecs, Wagner, Barbour, Bedward, Bolker, Borcard, Borman, Carvalho, Chirico, De Caceres, Durand, Evangelista, FitzJohn, Friendly, Furneaux, Hannigan, Hill, Lahti, McGlinn, Ouellette, Ribeiro Cunha, Smith, Stier, Ter Braak and Weedon2025; R Core Team, 2025). Infection load was recorded as the real-time PCR Ct value for each sample. Additionally, for each bat, the time until becoming infected after first entering the colony and the duration of infection for the most persistent Bartonella species were recorded. These measures help to track whether certain demographic groups are more affected by the addition of flies and compare changes in the relative frequency of Bartonella species over time, respectively. Change points in Bartonella prevalence, infection load, and diversity measures were detected with segmented regression using the R segmented package (Muggeo, Reference Muggeo2003, Reference Muggeo2024). Binomial generalized regression models (GLM) were fit to compare changes in infection status for bats that did or did not receive bat flies in January 2012, including age and sex as potential confounding variables. Mean infection durations for Bartonella species were estimated using a Bayesian approach by fitting lognormal distributions to the data with Stan using the rstanarm package (Carpenter et al., Reference Carpenter, Gelman, Hoffman, Lee, Goodrich, Betancourt, Brubaker, Guo, Li and Riddell2017; Gabry et al., Reference Gabry, Ali, Brilleman, Novik, Wood, R Core Development Team, Bates, Maechler, Bolker, Walker, Ripley, Venables, Burkner and Goodrich2025). Multinomial and binomial likelihood ratio (LR) tests adapted from Pepin et al. (Reference Pepin, Wang, Webb, Smith, Poss, Hudson, Hong, Zhu, Riley and Guan2013) were performed to find statistical associations between coinfecting Bartonella species and to detect changes in the relative frequency of Bartonella species during the study period. For additional details regarding regression analyses, Bayesian models, and likelihood ratio tests, see Appendix 1.
Results
Phylogenetic analysis of detected bacteria
Bartonella infections in bats and bat flies were identified as 6 previously characterized species based on ITS, gltA and ftsZ sequences: Bartonella spp. E1–E5 and Ew (Kosoy et al., Reference Kosoy, Bai, Lynch, Kuzmin, Niezgoda, Franka, Agwanda, Breiman and Rupprecht2010; Bai et al., Reference Bai, Hayman, McKee and Kosoy2015). Two additional genogroups identified by gltA sequences, Bartonella spp. Eh6 and Eh7 (Figure S1), were similar to sequences previously obtained from C. greefi collected from E. helvum in Ghana and islands in the Gulf of Guinea (Billeter et al., Reference Billeter, Hayman, Peel, Baker, Wood, Cunningham, Suu-Ire, Dittmar and Kosoy2012; McKee et al., Reference McKee, Peel, Hayman, Suu-Ire, Ntiamoa-Baidu, Cunningham, Wood, Webb and Kosoy2024). Sequences identified as Eh6 and Eh7 were also detected among ftsZ and ITS sequences (Figures S2 & S3). Phylogenetic analysis of concatenated ftsZ and gltA sequences distinguished Eh6 and Eh7 from other Bartonella species associated with E. helvum or other bat species (Figure S4). See Appendix 2 for more details on phylogenetic analysis.
Bartonella infection prevalence and effects of bat fly restocking
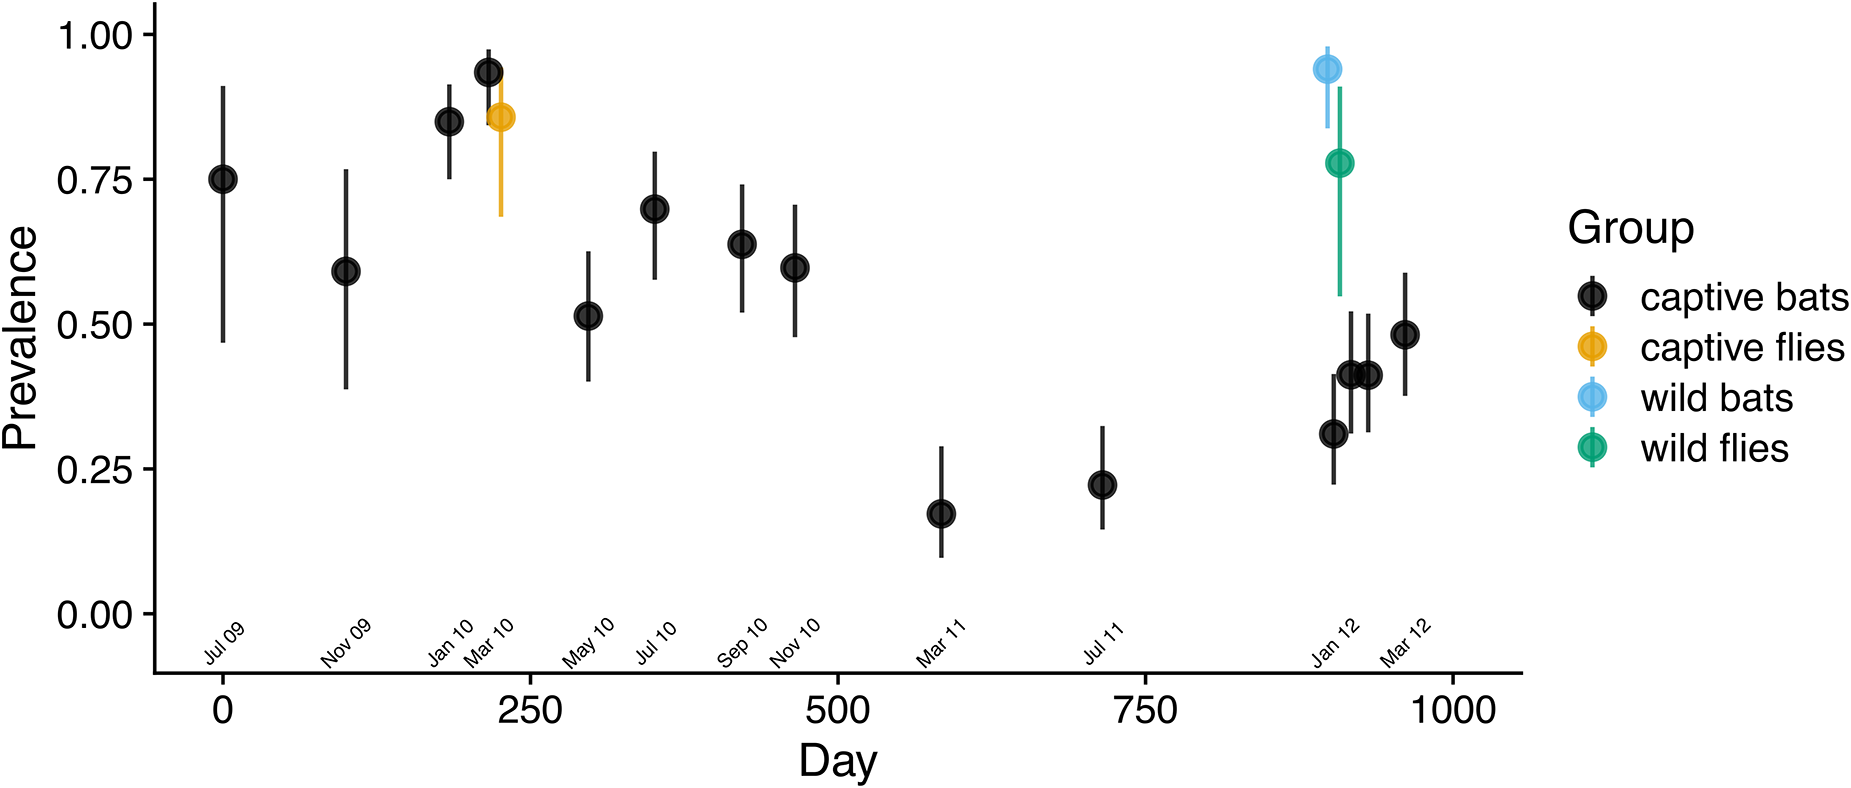
As predicted, Bartonella prevalence in the captive colony changed with the population density of bat flies. Bartonella prevalence in the first 3 cohorts was high at colony entry, then declined concurrently with the observed decline in the bat fly population (Figure 3). After flies were restocked, prevalence increased from 31% on day 903 to 48% on day 961. This change was reflected in the segmented regression analysis (Figure S6A; Table S7) with a shift from positive to negative slope near March 2010 (day 221) and a shift from negative to positive slope around January 2012 (day 903). The trend in Bartonella prevalence in the colony over time was similar if bats were considered positive for Bartonella with a threshold of at least 1, 2, 3, or all genetic markers being positive (Figure S7).
Bartonella infection prevalence in a captive colony of E. Helvum over time. Bats and bat flies were considered positive if a Bartonella sequence was obtained from one or more genetic markers. Wilson score 95% confidence intervals were drawn around prevalence estimates at each sampling time point.

Figure 3 Long description
A scatter plot with the vertical axis labeled Prevalence and tick labels 0.00, 0.25, 0.50, 0.75 and 1.00. The horizontal axis is labeled Day, with tick labels 0, 250, 500, 750 and 1000. A legend titled Group lists four categories: captive flies, captive bats, wild bats and wild flies. Points are plotted at multiple day values, with vertical error bars on each point. Several points appear between day 0 and day 500 at prevalence values around 0.50 to 0.90. Additional points appear between about day 600 and day 800 at prevalence values around 0.15 to 0.30. A cluster of points appears near day 950 to day 1000 at prevalence values around 0.30 to 0.50 and two higher points near the same day range appear around 0.80 and around 0.95.
The effect of bat fly restocking on Bartonella prevalence was more pronounced for some age classes of bats than others (Figure S8A). All sexually immature bats were infected at entry and by the end of the study, but there was an increase in the proportion of adult bats infected by the end of the study compared to the start, from 81% to 94%. Bats born into the colony in 2010 and 2011 were Bartonella-negative at their first sampling event. By the end of the experiment, 88% of these bats had become infected (Figure S8A). Using data from the 112 bats that were tested for Bartonella infection more than once during the captive study, a binomial GLM was fit to test the effects of age and sex on whether bats became Bartonella-positive during the experiment. The largest effect was observed in neonates/juveniles born into the colony (Table S4): compared to adults, neonates/juveniles were significantly more likely to become positive by the end of the study (log odds ratio = 3.9, z = 5.8, P < 0.001). There was no significant effect of sex on the change in Bartonella infection for any age class (Table S4).
To further examine the effect of restocking flies on 17 January 2012, we fit logistic GLMs for 2 additional outcomes: (1) whether bats were Bartonella-positive at any time point after flies were restocked on 17 January 2012, and (2) whether bats became positive or bats that were already positive changed Bartonella species after fly restocking. In both models, we used data on the 84 bats that were present in the colony on 17 January 2012 and subsequent time points. Both models included age class, sex, whether bats received flies on 17 January 2012, and infection status prior to 17 January 2012 as predictors. The first model identified a significant effect of age on Bartonella infection status showing that neonate/juvenile bats were significantly more likely to be Bartonella-positive after flies were restocked on 17 January 2012 compared to mature adults (log odds ratio = 1.69, z = 2.62, P = 0.024; Table S5A, B). There was no significant effect of prior infection or sex on this outcome (Table S5A), and while receiving flies did increase the likelihood of infection after 17 January 2012, this effect was also not statistically significant (z = 1.61, P = 0.11). Based on the second model, age class was also an important predictor of whether a bat became positive or changed Bartonella species after flies were restocked (Table S5C, D). Like the first model, the effects of sex and prior infection were not significant (Table S5C). However, the effect of flies was statistically significant in this model (z = 2.0, P = 0.045). This suggests that after adjusting for age class, sex, and prior infection status, bats that received flies on 17 January 2012 were more likely to become newly infected with Bartonella or change Bartonella species.
Bat fly restocking had similar effects on measures of infection load in the colony. Infection load in each sample, as measured by RT-PCR cycle threshold (Ct) values (Figure S5), reached a peak in March 2010, then declined before sharply increasing after the restocking of flies. This trend is reflected in the segmented regression of this measure, with a shift from positive to negative slope near day 221 and a shift from negative to positive slope near day 903 (Figure S6B; Table S7). Coinfection prevalence showed a peak near January 2010 (day 184) and declined until July 2011 (day 715) when it began to increase again (Figure S9). However, only the shift in slope for coinfection prevalence near July 2011 was statistically significant (Figure S6C; Table S7). These data show that multiple measures of Bartonella infection in the colony changed over time, particularly in response to the restocking of flies in January 2012. For additional details on prevalence and load in bat flies and wild bats collected in March 2010 and January 2012, see Appendix 2.
Patterns of Bartonella diversity
Similar to infection prevalence and load, Bartonella diversity measures changed in response to bat fly population density. Bartonella diversity was measured at 2 scales, at the colony level and at the individual host level. Bartonella species richness and evenness (Shannon index) measured colony-level alpha diversity. The number of Bartonella species in an individual sample and beta diversity (Jaccard index) measured individual-level diversity. Diversity measures showed qualitatively similar patterns during the early phase of the experiment (Figures S10 & S11): an initial increase with the entry of the first 3 cohorts into the colony, reaching a maximum in January 2010, followed by a decline. Diversity measures increased again until the restocking of flies in January 2012 and then declined slightly (or remained flat in the case of species richness). The observed trends were only partially reflected by segmented regression breakpoints. Segmented regression detected only one breakpoint each in the timelines for species richness, species evenness, and the number of Bartonella species in an individual sample (Table S7). A shift from positive to negative slope was detected in January 2010 for species richness (Figure S12A), whereas a change from negative to positive slope was detected for species evenness and the number of species in an individual sample between November 2010 and March 2011 (Figure S12B, C; Figure S13A). There were 2 significant breakpoints detected in the timeline of beta diversity, changing from negative to positive slope in May 2010 and from positive to negative slope in January 2012 (Figure S13B; Table S7). For details on diversity measures in bat flies and wild bats collected in March 2010 and January 2012, see Appendix 2.
Shift in Bartonella species frequencies
Bartonella species observed in the colony varied in their frequencies with an apparent shift in the dominant species during the study (Figure 4A). While rarer species E1, E2 and Eh7 were not observed at all time points, E1 and E2 were consistently observed over the duration of the study. In contrast, the rarest species Eh7 was not observed after July 2010, even after flies were added to the colony. Species Eh6 was also uncommonly observed during the study, went unobserved for 3 time points in 2012, but was observed again in March 2012.
Changes in the relative counts of Bartonella species in the captive colony over time (A–B) and between sampled bat flies and their respective bat populations (C–D). Relative counts (A) at each time point were estimated from the presence/absence of Bartonella species based on any positive sequence from ITS, gltA and ftsZ. For panels A and B, the month labelled in bold font on the x-axis shows when bat flies were added to the bat colony. Tests for differences in the relative counts of species were performed between bats in the captive colony before and after bat flies were restocked on 17 January 2012 (B); between bat flies sampled from the colony and the captive bat population in March 2010 (C); and between bat flies and wild bats sampled in January 2012 and the captive colony population after flies were added (D).

Figure 4 Long description
The image contains four stacked bar graphs. The first graph (A) shows relative counts of species over time, with days labeled approximately from 0 to 1000. Species E1 and E2 are prominent on most days, with notable shifts in species dominance. The second graph (B) compares relative counts before and after January 2012, showing a change in species composition with flies. The third graph (C) compares captive bats and captive flies, highlighting differences in species distribution, with E1 being more prevalent in captive flies. The fourth graph (D) compares captive bats, wild bats and wild flies after January 2012, showing variations in species presence, with E1 and E2 being dominant in wild flies. Each graph uses a vertical layout with stacked bars representing species E1, E2, E3, E4, Ew, Eh6 and Eh7. The y-axis for all graphs is labeled Relative counts, ranging from 0.00 to 1.00, indicating proportions of species presence.
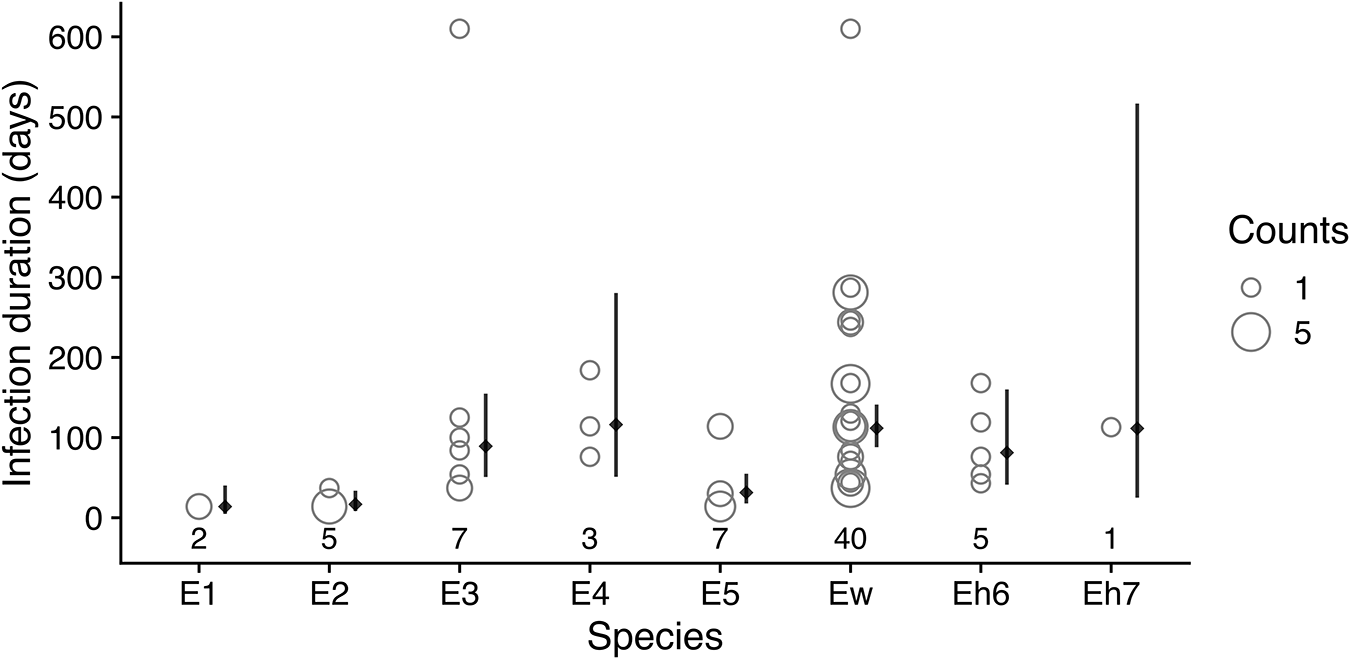
As noted above, beta diversity decreased after May 2010 when the bat fly population was decreasing, reached another maximum in January 2012, and then decreased again after flies were restocked (Figure S11). These decreases in beta diversity correspond with periods of expansion by some species within the colony that appear to homogenize beta diversity. During the period from January 2010 to July 2011, Ew became the most abundant species in the colony (Figure 4A). Another measure of this species’ dominance in the colony is the duration of its infections in individual bats. For each bat that was sampled more than once and was recorded as having the same Bartonella species for a sequential period, we tabulated which species was present for the most time points (Figure 5) and estimated the mean duration of infection using Bayesian regression (Table S6). Among Bartonella species, Ew was the longest-lasting infection in the highest number of bats (n = 40), with an estimated mean of 112 days (95% posterior interval: 88–141 days). Species E4 and Eh7 were similarly long-lasting infections but were observed in relatively fewer bats (N = 3 and 1, respectively; Table S6).
Duration of Bartonella species infections in serially infected individuals. For each Bartonella species, the numbers below the points are counts of individual bats that had the Bartonella species as their longest-lasting infection (i.e., the Bartonella species was present for the most sequential time points). The infection durations in days for all serially infected bats are plotted as open circles with the width proportional to the number of individuals with the same infection duration. Solid diamonds and lines to the right of points show the estimated mean duration and 95% posterior intervals using Bayesian lognormal regression.

Figure 5 Long description
The horizontal axis shows species categories labeled E1, E2, E3, E4, Ew, Eh6 and Eh7. The vertical axis label is Infection duration (days), with tick labels from 0 to 600. A size legend at the right is labeled Counts, with example open circles labeled 1 and 5. Open-circle points are plotted above each species label. Numbers printed below the species labels are 2 under E1, 4 under E2, 3 under E3, 4 under E4, 40 under Ew, 5 under Eh6 and 1 under Eh7. E1 has points near 0 and around 50. E2 has points near 0 and around 50. E3 has multiple points from near 0 up to around 150 and one point near 600. E4 has points around 100 to 200 and one point around 300. Ew has many points clustered between about 50 and 150, with additional points around 200 to 300. Eh6 has points around 50 to 150. Eh7 has a point around 100 and a vertical interval marker extending upward to around 500, with a diamond marker near 100.
Beginning around March 2011, the frequency of Ew began declining while species E1, E2, and E5 increased (Figure 4A). Dividing the study into 2 parts – before flies were restocked (July 2009 to July 2011) and after flies were added (January 2012 and after) – a clear difference in the relative frequency of Bartonella species was observed (Figure 4B). This shift in frequency after the addition of flies was significant according to a multinomial LR test (D = 183.3, df = 7, P < 0.001) and individual binomial LR tests for all species, except for E3 (Table S8). Significant differences were also observed in the frequencies between bat flies and sampled bat populations in March 2010 and January 2012 (Figure 4C, D; Table S9). These data, along with the changes in alpha and beta diversity measures, demonstrate that Bartonella communities shifted substantially over time, coinciding with the changes in the bat fly population density.
Interactions between Bartonella species
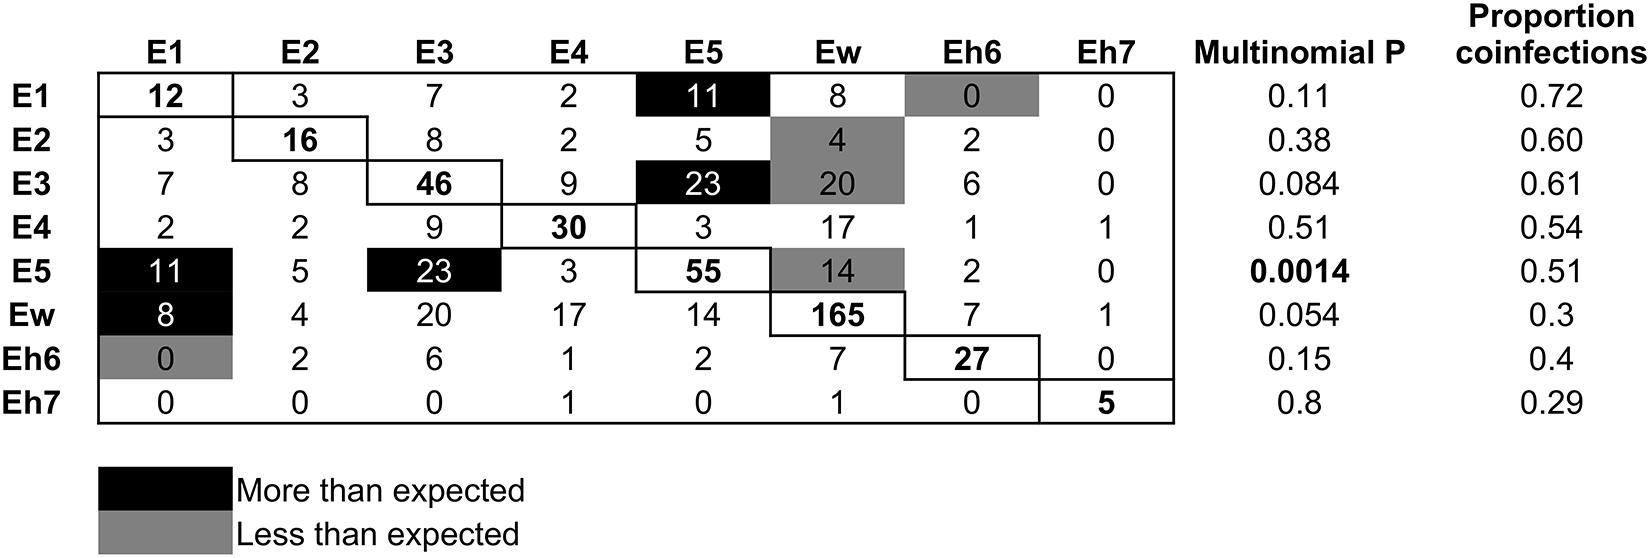
Using multinomial and binomial LR tests on coinfection frequencies, there was evidence of both negative and positive interactions between Bartonella species over the period of the experiment (Figure 6). Bats infected with Ew were significantly less likely to be coinfected with E2, E3 and E5; a reciprocal negative effect on Ew from these species was not detected. Related to this, the proportion of Ew infections that were also coinfections was low (30%), in contrast to its high frequency in the population over time (Figure 4A). Species E1 and Eh6 had a reciprocal negative effect on each other. Reciprocal positive effects (i.e., more coinfections than expected) were found between species E3 and E5 and between species E1 and E5. Also, bats were more likely to be coinfected with Ew if they were already infected with E1, but there was no significant reciprocal effect of Ew on E1 (Figure 6).
Patterns of Bartonella species coinfection. Rows are the focal species and columns are the partner infections. Numbers in the boxes are counts of coinfections between each pair of species; single infection counts for each species are on the diagonal. Black boxes show coinfections that occurred more frequently than expected, grey boxes show those that occurred less frequently than expected and white boxes show those with no significant pattern. Expected counts were based on the frequency of single and double infections of each Bartonella species, and significance was based on multinomial and binomial tests. The proportion of infections by each Bartonella species that were also coinfections is shown in the last column.

Figure 6 Long description
The table has columns: E1, E2, E3, E4, E5, Ew, Eh6, Eh7, Multinomial P, Proportion coinfections. Row 1: E1 12, 3, 7, 2, 11, 8, 0, 0, 0.11, 0.72. Row 2: E2 3, 16, 8, 3, 5, 2, 0, 0, 0.38, 0.58. Row 3: E3 7, 8, 46, 9, 23, 4, 0, 0, 0.084, 0.61. Row 4: E4 2, 3, 9, 30, 11, 3, 0, 0, 0.51, 0.54. Row 5: E5 11, 5, 23, 11, 55, 14, 1, 0, 0.0014, 0.51. Row 6: Ew 8, 2, 4, 3, 14, 165, 1, 0, 0.054, 0.3. Row 7: Eh6 0, 0, 0, 0, 1, 2, 27, 0, 0.15, 0.4. Row 8: Eh7 0, 0, 0, 0, 0, 0, 0, 5, 0.8, 0.29. Black boxes indicate more than expected coinfections, grey boxes indicate less than expected.
Discussion
Parasites do not infect hosts in isolation but instead form diverse communities within hosts that vary over time. However, it is unclear how the same forces that affect diversity in communities of free-living, sexually reproducing organisms act in the same way or with different strengths in parasite communities (Sutherland et al., Reference Sutherland, Freckleton, Godfray, Beissinger, Benton, Cameron, Carmel, Coomes, Coulson, Emmerson, Hails, Hays, Hodgson, Hutchings, Johnson, Jones, Keeling, Kokko, Kunin, Lambin, Lewis, Malhi, Mieszkowska, Milner-Gulland, Norris, Phillimore, Purves, Reid, Reuman, Thompson, Travis, Turnbull, Wardle and Wiegand2013). Furthermore, there are few studies that have tracked ecological communities of parasites over time to examine the forces shaping diversity (Vidal-Martínez and Poulin, Reference Vidal-Martínez and Poulin2003; Fallon et al., Reference Fallon, Ricklefs, Latta and Bermingham2004; Cohen et al., Reference Cohen, Einav and Hawlena2015; Budischak et al., Reference Budischak, Hoberg, Abrams, Jolles and Ezenwa2016; Moss et al., Reference Moss, McDevitt-Galles, Calhoun and Johnson2020). This study tested how well predictions of community ecology theory (Vellend, Reference Vellend2010) apply to host–vector–parasite systems through an approach that manipulated parasite dispersal among hosts within the population by capitalizing on a natural change in the population density of the putative vector. Restriction of parasite dispersal minimized the effect of among-host transmission on Bartonella communities within individual hosts, thereby allowing the possible effects of ecological drift and species sorting on parasite community diversity to be measured. At the same time, observed trends in the prevalence and diversity of Bartonella infections within the colony over the course of vector population decline and restocking indicate that bat flies are biological vectors of Bartonella in bats. Overall, the experiment shows that Bartonella communities are affected by dispersal, drift, and ecological selection in similar ways to free-living organisms, although numerous forms of ecological selection might be acting simultaneously.
We first hypothesized that Bartonella communities in the colony would respond to changes in among-host dispersal/transmission by bat flies. Specifically, we predicted that infection prevalence and diversity would decline concurrently with the bat fly population and then increase upon restocking of flies. The results indicate that Bartonella prevalence and infection load declined along with the bat fly population, then increased when flies were added in January 2012. This effect was seen across the whole population but had a stronger effect on young bats born in the colony, likely attributable to their lack of prior exposure to Bartonella while flies were in low density. Only a few vectors of Bartonella bacteria have been confirmed through controlled exposure of hosts to infected vectors (Tsai et al., Reference Tsai, Chang, Chuang and Chomel2011; Morick et al., Reference Morick, Krasnov, Khokhlova, Gottlieb and Harrus2013), and all of these have been in non-bat hosts. A previous study by Jardine et al. (Reference Jardine, Waldner, Wobeser and Leighton2006), demonstrated declines in Bartonella prevalence after an experimental insecticide treatment reduced flea densities on Richardson’s ground squirrels (Spermophilus richardsonii), indicating that fleas are important vectors of Bartonella. The role of bat flies as Bartonella vectors had been speculated in previous work on Bartonella dynamics in bats (Morse et al., Reference Morse, Olival, Kosoy, Billeter, Patterson, Dick and Dittmar2012; Brook et al., Reference Brook, Bai, Dobson, Osikowicz, Ranaivoson, Zhu, Kosoy and Dittmar2015; Stuckey et al., Reference Stuckey, Chomel, Galvez-Romero, Olave-Leyva, Obregón-Morales, Moreno-Sandoval, Aréchiga-Ceballos, Salas-Rojas and Aguilar-Setién2017; Sándor et al., Reference Sándor, Földvári, Krawczyk, Sprong, Corduneanu, Barti, Görföl, Estók, Kováts, Szekeres, László, Hornok and Földvári2018; Nabeshima et al., Reference Nabeshima, Sato, Kabeya, Komine, Nanashima, Takano, Shimoda, Maeda, Suzuki and Maruyama2020; Fagre et al., Reference Fagre, Islam, Reeves, Kading, Plowright, Gurley and McKee2023), but our experimental study provides conclusive support for nycteribiid transmission of Bartonella in bat hosts.
Multiple measures of Bartonella diversity decreased over the corresponding period when flies were at low density. This decline may be attributed to the stochastic loss of rare species and the increase in relative frequency of some species, specifically Ew, through persistent infection. Bartonellae are known to cause persistent infections in their reservoir hosts, with frequently relapsing bacteraemia that can occasionally go dormant and reactivate through the clonal expansion of antigenic or phase variants, or potentially coinfecting Bartonella species (Kosoy et al., Reference Kosoy, Mandel, Green, Marston and Childs2004b; a; Harms and Dehio, Reference Harms and Dehio2012; Pulliainen and Dehio, Reference Pulliainen and Dehio2012). Interestingly, all diversity measures increased before the restocking of flies, reaching a local peak in diversity in January 2012 before declining again. This second decline could be attributed to the decline of the dominant Ew, allowing potentially latent infections by other species (E1, E2, E3, E5) to emerge as the dominant species infecting the bat population. The dominance of these species in the colony continued after flies were restocked and among-host transmission was restored, thus causing a short decline in diversity measures. These patterns indicate that dispersal of infections by flies is not only key to maintaining infection prevalence, but also the long-term maintenance of Bartonella community diversity in bats.
We also hypothesized that limitation of parasite dispersal would result in stochastic losses of rare Bartonella species and changes in community beta diversity via ecological drift and shifts in the rank abundance of Bartonella communities due to species sorting. The rarest species in the community, Bartonella species Eh7, was lost during the study and was not restored, even when flies were restocked. This failure was likely due to a sampling effect, wherein flies carry only a subset of Bartonella species, therefore limiting opportunities for effective reintroduction of rare species. This is especially true for this experiment given the small number of flies (N = 73) added to the colony. As noted above, beta diversity did not exhibit the expected increase when the fly population declined. Instead, there was a decrease in beta diversity due to the dominance of species Ew. This dominance of Ew was the most conspicuous trend in the dynamics of the Bartonella community over most of the study, except for at the end of the experiment when there was a shift towards the next most abundant species, E5, and other lower-ranked species. This shift towards E5 and the decline in Ew occurred before the addition of flies and was independent of the effects of among-host dispersal (due to the low density of flies at this time). We speculate that this is an emergent pattern due to within-host selection against Ew by the host immune system. Specifically, as Ew came to dominate within the population and in individual bats, it may have become the primary target of host immune responses. As Ew was eliminated, this allowed for the emergence of other, latent infections within coinfected bats. Thus, without dispersal of Bartonella species by bat fly vectors, we hypothesize that ecological drift and species sorting by the host immune system cause observable changes in bacterial communities.
Finally, we hypothesized that interactions among Bartonella species would be detectable based on coinfection frequencies, providing evidence of competition or facilitation in pathogen communities. While most interactions were not significant, species Ew has negative effects on several species and is typically present with few coinfections. In contrast, positive effects were observed between species E1, E3 and E5, which show a much higher frequency of coinfection. These results indicate that parasitic bacteria like Bartonella do have measurable ecological interactions that are not uniformly competitive. These positive interactions could have played a role in the replacement of Ew with E5 and other species late in the study.
From just a single experiment, we can make several inferences about the ecology of Bartonella infections in bats. First, they can be persistent, lasting potentially hundreds of days. Other studies have alluded to the possibility of persistent Bartonella infection with periodic recrudescence in rodents (Kosoy et al., Reference Kosoy, Mandel, Green, Marston and Childs2004b; a; Bai et al., Reference Bai, Calisher, Kosoy, Root and Doty2011; Goodrich et al., Reference Goodrich, McKee and Kosoy2020) and bats (Becker et al., Reference Becker, Bergner, Bentz, Orton, Altizer and Streicker2018); however, these studies were conducted in open populations where reinfection by vectors was likely frequent. Although we cannot rule out that some reinfection occurred due to a small, remnant bat fly population in the colony, the decline in bat fly density to an undetectable level should have reduced reinfections relative to studies of wild populations. Second, Bartonella community diversity can be driven by dispersal, drift, and ecological selection (i.e., species sorting), as predicted by ecological theory (Vellend, Reference Vellend2010; Seabloom et al., Reference Seabloom, Borer, Gross, Kendig, Lacroix, Mitchell, Mordecai and Power2015). The current study has shown that when dispersal is limited, the effects of ecological drift and selection can be more apparent. Two types of ecological selection can occur in these parasite populations, either through interactions with the host immune system or through interspecific interactions. As noted above, the immune system may lead to periodic selection against the dominant infecting species, a negative frequency-dependent mechanism that might help maintain diverse parasite communities (Fallon et al., Reference Fallon, Ricklefs, Latta and Bermingham2004; Christie and McNickle, Reference Christie and McNickle2023).
Dominance appears to be a similar facet of the composition of pathogen communities (de Jong et al., Reference de Jong, Conlan, Han and Russell2025; Pinotti et al., Reference Pinotti, Fleury, Guillemot, Böelle and Poletto2019) as it is in free-living organisms (Smith and Knapp, Reference Smith and Knapp2003). The dominance of Ew may thus stem from multiple facets of its ecology. First, it appears to be persistent within bats (Figure 5), and second, it appears to be readily taken up by flies (Figure 4C, D). We note that Ew is also the most clonal, i.e., genetically homogenous, species in the community and might be a more recently evolved or introduced species in E. helvum (Bai et al., Reference Bai, Hayman, McKee and Kosoy2015). While there was no evidence that Ew caused higher infection loads (by Ct value), the resolution of our sampling protocol probably was not high enough to detect this.
This study has several limitations that could be addressed with additional studies of this system. Firstly, the decline and restocking of bat flies in the colony was not precisely controlled, nor replicated in multiple bat populations. While this natural experiment provides promising data identifying the role of bat flies as Bartonella vectors, additional field studies are needed to verify their competence while controlling for other environmental factors that may affect transmission. Such experiments might involve controlled exposure of Bartonella-negative bats and confirmation of the exposure route. Alternative routes might include bat fly bite, requiring tropism of the bacteria to the salivary glands, or contamination through bat fly faeces, requiring replication in the fly gut and persistent shedding of viable bacteria in faeces.
We also recognize that the molecular methods we used to detect Bartonella infections cannot give us a full picture of the microbial community dynamics occurring in this system. For instance, our PCR-based approach almost certainly underestimated the frequency of coinfections in bats. Multiplexed high-throughput sequencing on blood samples could detect coinfections with higher sensitivity and provide better measurements of the relative abundance of Bartonella species within the bat hosts (Power et al., Reference Power, Calvani, Nachum-Biala, Salant, Harrus and Šlapeta2021; Bai et al., Reference Bai, Osikowicz, Hojgaard and Eisen2023). Isolation of Bartonella cultures could provide opportunities to inspect growth curves throughout the infection cycle to see if some species have any growth advantages (Lynch et al., Reference Lynch, Iverson and Kosoy2011; Gutiérrez et al., Reference Gutiérrez, Vayssier-Taussat, Buffet and Harrus2017). Finally, whole-genome sequencing from blood or cultures could identify genetic changes in Bartonella in response to host immune selection (Rodríguez-Pastor et al., Reference Rodríguez-Pastor, Knossow, Shahar, Hasik, Deatherage, Gutiérrez, Harrus, Zaman, Lenski, Barrick and Hawlena2024). Additional studies could try other methods to examine immune function in bats (Boughton et al., Reference Boughton, Joop and Armitage2011) in response to Bartonella infection to confirm the existence of frequency-dependent selection against Bartonella species and to help determine the appropriate epidemiological models to explain Bartonella infection dynamics (Brook et al., Reference Brook, Bai, Yu, Ranaivoson, Shin, Dobson, Metcalf, Kosoy and Dittmar2017). Other forms of interference or resource competition must be explored further (Pedersen and Fenton, Reference Pedersen and Fenton2007), perhaps through controlled infection experiments.
In summary, this study has contributed to a more comprehensive understanding of the ecology of Bartonella species in bats and connects with broader community ecology theory developed in free-living and symbiotic organisms (Vellend, Reference Vellend2010; Costello et al., Reference Costello, Stagaman, Dethlefsen, Bohannan and Relman2012; Miller et al., Reference Miller, Svanbäck and Bohannan2018). In this experiment, limitation of dispersal led to declines in local Bartonella species diversity in individual bats, a pattern that fits well with predictions from patch dynamics or mass effects models of metacommunities (Leibold et al., Reference Leibold, Holyoak, Mouquet, Amarasekare, Chase, Hoopes, Holt, Shurin, Law, Tilman, Loreau and Gonzalez2004). The results also show that not all bacterial interactions are negative, even those that presumably share the same niche. This parallels the recognized importance of positive species interactions in plant communities (Bertness and Callaway, Reference Bertness and Callaway1994) and among bacterial taxa in animal microbiomes and aquatic habitats (Faust et al., Reference Faust, Sathirapongsasuti, Izard, Segata, Gevers, Raes and Huttenhower2012; Ju and Zhang, Reference Ju and Zhang2015; Hegde et al., Reference Hegde, Khanipov, Albayrak, Golovko, Pimenova, Saldaña, Rojas, Hornett, Motl, Fredregill, Dennett, Debboun, Fofanov and Hughes2018). A recent study by Gutiérrez et al. (Gutiérrez et al., Reference Gutiérrez, Cohen, Flatau, Marcos-Hadad, Garrido, Halle, Nachum-Biala, Covo, Hawlena and Harrus2018) on Bartonella infections in desert rodents showed a mixture of negative, neutral and positive interactions similar to the present study. Theoretical and experimental studies suggest that communities remain stable through a predominance of neutral or weak species interactions that can attenuate large competitive or facultative effects (McCann, Reference McCann2000; Aschehoug and Callaway, Reference Aschehoug and Callaway2015). Weak interactions, paired with the frequency-dependent selection discussed above, could provide a model for understanding how Bartonella species and other parasitic microorganisms coexist in communities within their hosts. Such mechanisms could allow bacteria to share a niche or split it temporally, which could lead to periodic shifts in the dominant species but maintain the community as a whole. Future work using this system and similar longitudinal studies on other pathogens in natural host populations could lead to additional insights into the nature of microbial communities and the broad ecological processes that act across taxonomic and spatial scales.
Supplementary material
The supplementary material for this article can be found at https://doi.org/10.1017/S0031182026101656.
Data availability statement
The data that support the findings of this study are available in the supplementary material of this article. Representative sequences for Bartonella genogroups Eh6 and Eh7 from E. helvum and C. greefi have been submitted to GenBank under the accession numbers MN249715–MN249720 and MN250730–MN250788. Phylogenetic trees, R code and additional data sheets are available on GitHub (https://github.com/clifmckee/eidolon_captive_bartonella).
Acknowledgements
We acknowledge the help of many people who assisted with maintenance of the bat colony and sampling during this study, including staff of the Accra Zoo (Wildlife Division of the Forestry Commission of Ghana) and other researchers who assisted with the work. We thank Ying Bai and Lynn Osikowicz for their contributions to the early lab work and comments on manuscript drafts. We also thank current and former members of the Webb Lab for their comments on early versions of the manuscript.
Author contributions
D.T.S.H., J.L.N.W., A.A.C., Y.N. and R.S. conceived and designed the study. C.D.M., M.Y.K., R.S. and D.T.S.H. conducted data gathering. C.D.M. analysed the data and performed statistical analyses; C.D.M., C.T.W. and D.T.S.H. wrote the article. All authors contributed to and approved the final version of the article.
Financial support
A.A.C. was supported by a Royal Society Wolfson Research Merit Award and Research England. J.L.N.W. is supported by the Alborada Trust. DTSH received funding from the Wellcome Trust, the Royal Society Te Apārangi (MAU1701) and the Massey Foundation Percival Carmine Chair in Epidemiology and Public Health.
Competing interests
The authors declare there are no conflicts of interest.
Ethical standards
Ethics approval for bat capture and the fly restocking experiment was obtained from the Zoological Society of London Ethics Committee (WLE/0467), the Veterinary Services Directorate of Ghana and the Wildlife Division of the Forestry Commission of Ghana.


 Open access