

The availability of dietary tryptophan (TRP) to the brain depends on its concentration relative to other large neutral amino acids (LNAA), which compete for a common transport mechanism across the blood–brain barrier(Reference Wurtman, Hefti and Melamed1). Increased consumption of carbohydrate (CHO) elicits a marked demand in insulin secretion, which enhances peripheral, skeletal muscle uptake of LNAA. However, TRP is largely albumin bound and therefore protected from this absorption(Reference McMenamy and Oncley2). Previous studies have shown that the postprandial concentration of TRP:LNAA increases between 20 and 50 % compared with baseline after predominately CHO-rich meals(Reference Lyons and Truswell3–Reference Lieberman, Caballero and Finer5). In one study, consumption of a sucrose-based food elicited a larger postprandial increase in TRP:LNAA compared with a raw starch-based food(Reference Lyons and Truswell3). Although the glycaemic index (GI) of the foods was not measured, these authors hypothesised that a high-GI CHO-based meal compared with a low-GI CHO-based meal would elicit a greater insulin release, and therefore a larger postprandial rise in plasma TRP:LNAA levels(Reference Lyons and Truswell3, Reference Fernstrom and Wurtman6, Reference Wurtman7).
The proportion of CHO relative to either protein or fat may similarly influence the TRP:LNAA response after mixed-macronutrient meals. Berry et al. (Reference Berry, Growdon and Wurtman8) suggested that a meal containing a CHO:protein ratio of approximately 5:1 would neither raise nor lower postprandial LNAA, given that the LNAA-lowering effect of the insulin demand would be offset by the contribution of LNAA provided by the protein source. Since TRP is the least abundant amino acid found in protein, a protein-rich, low-CHO meal lowers TRP:LNAA due to a greater contribution of LNAA relative to TRP in the meal(Reference Lyons and Truswell3). Conversely, the addition of fat to a meal retards gastric emptying(Reference Wells and Read9), and lowers the peak glycaemic and insulin response(Reference Ercan, Gannon and Nuttall10). Thus, increased fat content in a meal may attenuate the postprandial TRP:LNAA response after mixed-macronutrient meals when compared with a CHO-only meal.
Recently, the GI of a CHO-rich meal has been shown to significantly influence sleep initiation in healthy sleepers. Afaghi et al. (Reference Afaghi, O'Connor and Chow11) reported a 50 % reduction in the time required to fall asleep after a CHO-rich, high-GI meal compared with an isoenergetic low-GI meal when consumed 4 h before bedtime. This improvement in sleep initiation after a high-GI CHO meal was probably due to an increased plasma TRP:LNAA concentration and increased serotonin; however, biochemical data were not collected to support this claim.
Therefore, the purpose of the present study was to investigate the influence of the GI and glycaemic load (GL) on the TRP:LNAA response after a CHO-only high-GI (CHGI) meal compared with two isoenergetic, mixed-macronutrient high- and low-GI (MHGI and MLGI) meals. We hypothesise that the glycaemic and insulin response to the CHGI meal will be larger than the MHGI and MLGI meals, and the corresponding increase in TRP:LNAA will be proportional to the GL of the meals due to differences in insulin demand.
Methods and materials
Participants
Ten healthy mixed-ethnicity men (age 22·9 (sd 3·4) years) of normal weight (BMI 23·5 (sd 1·6) kg/m2) were recruited from a university student population. Exclusion criteria included a self-reported current or past history of medical, psychiatric or sleep disorder, current use of prescribed medication, recreational drug use, allergy related to the study meals or habitual use of a restrictive diet. The present study was conducted according to the guidelines laid down in the Declaration of Helsinki, and all procedures involving human subjects were approved by the Human Research Ethics Committee of the University of Sydney. Written informed consent was obtained from all subjects before participation.
Meals
The energy and macronutrient composition of the meals are summarised in Table 1. The CHGI meal, 3212 kJ, was replicated from a previous study(Reference Afaghi, O'Connor and Chow11) and consisted of a large portion of rice (Jasmine GI approximately 109; Riviana Foods, Sydney, NSW, Australia) served with a tomato-based vegetable purée. The mixed-macronutrient meals (MHGI and MLGI) were isoenergetic, approximately 1915 kJ, and consisted of rice (MHGI: Jasmine GI approximately 109; MLGI: Doongara GI approximately 46; Riviana Foods) served with a sachet of chicken with sun-dried tomato sauce (965 kJ; 7·9 g fat, 14·1 g protein and 24·7 g CHO;Lean Cuisine™; Nestlé Australia Limited, Rhodes, NSW, Australia). Meals were prepared in the University of Sydney Human Nutrition Unit kitchens. Uncooked rice (raw weight of CHGI, 200 g; MHGI, 64·7 g; MLGI, 64·5 g) was prepared using an electric rice cooker before the testing day, with a rice:water ratio of 1:1·5. Cooked rice was frozen ( − 20°C) in individual portions and reheated in a microwave before serving. Frozen Lean Cuisine™ sachets were heated in the microwave according to the manufacturer's recommendations and poured over the rice immediately before serving. All meals were presented to the participants with 250 ml of cool water and consumed within 15 min. Participants were required to consume the entire meal, which was assessed visually by a researcher (C. P. H. and K. S.) and by weighing the plate before and after eating.
Energy and macronutrient composition of the carbohydrate (CHO) high-glycaemic index (CHGI), mixed-macronutrient high-glycaemic index (MHGI) and mixed-macronutrient low-glycaemic index (MLGI) meals
GI, glycaemic index; GL, glycaemic load.
* GI was determined using the average glucose response (n 9) and the incremental area under the curve method(Reference Brouns, Bjorck and Frayn12)).
† GL was calculated by multiplying each meal GI by the available CHO (g).
‡ GI for the CHGI meal was approximate due to a larger CHO content of this test meal compared with the reference glucose drink providing 75 g CHO(Reference Brouns, Bjorck and Frayn12).
Procedure
Participants presented to the testing facility in the morning by at least 10.00 hours, having fasted overnight for a period of at least 8 h. Participants were required to avoid vigorous exercise and abstain from alcohol for at least 24 h before testing, and were instructed to avoid over- or under-eating. Smokers were instructed to abstain on the morning before testing. On the night before testing, participants were instructed to consume a high-CHO, low-fat evening meal devoid of legumes in order to avoid extreme hunger and variation in basal blood glucose concentration. Self-reported compliance with these instructions was evaluated by a researcher (C. P. H. and K. S.) each morning before testing.
Participants initially completed three independent reference glucose tests separated by at least 48 h apart. Each reference test used a standard glucose drink (77·1 g Glucodin™ powder, dissolved in 250 g of cold water), providing 75 g available CHO, in order to calculate the average glucose and insulin response. A glucose load of 75 g was required to appropriately determine the GI of the MHGI and MLGI meals(Reference Brouns, Bjorck and Frayn12); however, the GI of the CHGI meal would be approximate as it was considered unethical to use a glucose reference drink of 171·4 g CHO. All meals were administered in a randomised order at least 48 h apart. Participants were blinded to the GI of the MHGI and MLGI meals, which were identical in appearance. A questionnaire comprising multiple, 10 cm visual analogue scales was administered immediately after meal consumption to assess palatability (0, poor; 10, good), satiety (0, still hungry; 10, completely full) and participant sleepiness (0, alert; 10, sleepy). The validity of visual analogue scales to assess subjective ratings of palatability and mood states after meal consumption is well established(Reference Flint, Raben and Blundell13, Reference Rahemtulla, Baldwin and Spiro14).
Calculation of glycaemic index, insulin index and glycaemic load
GI and insulin index were calculated according to published guidelines using mean participant data and the following ratio: the 120 min incremental area under the curve of the test meal compared with the mean incremental area under the curve of the reference food, multiplied by 100(Reference Brouns, Bjorck and Frayn12). GL was calculated using the equation, GL = (GI/100) × g available CHO(Reference Brand-Miller, Thomas and Swan15). It can be highlighted again that despite identical macronutrient and energy composition, the MHGI and MLGI meals were designed to elicit differences in postprandial GL response. This was accomplished by the selection of either a 75 g portion of a high-GI (109) rice for the MHGI meal or a 75 g portion of a low-GI (49) rice for the MLGI meal (see meals above). Thus, the overall glycaemic response of these meals will reflect not only the amount and type of CHO, but also the relative contributions of the fat and protein components(Reference Wells and Read9). This meal design illustrates the importance of investigating the GI of an entire mixed-macronutrient meal(Reference Henry, Lightowler and Kendall16).
Biochemical analysis
Finger-prick blood samples were collected into separate heparin-coated eppendorf tubes at baseline (5 and 1 min before meal consumption) and after 15, 30, 45, 60, 90 and 120 min for the analysis of glucose (glucose hexokinase enzymatic assay, Hitachi 912 automatic analyser; Boehringer, Mannheim, Germany) and insulin (solid-phase antibody-coated tube RIA, ‘Coat-A-Count’ Insulin RIA kit; Diagnostic Products Corporation, Los Angeles, CA, USA). All samples were immediately centrifuged at 7900 rpm for 45 s, with plasma stored at − 20°C for the subsequent analysis.
After test meals but not after reference tests, additional (2 ml) blood samples were collected by venepuncture from a forearm vein into a Li-heparinised tube at 0 (baseline), 120, 180 and 240 min, and immediately centrifuged (2500 rpm for 15 min at 4°C) to separate plasma for subsequent analysis of amino acids: TRP and five LNAA (valine, leucine, isoleucine, phenylalanine and tyrosine) to calculate the TRP:LNAA ratio(Reference McMenamy and Oncley2). Plasma samples were collected into separate eppendorf tubes and stored at − 80°C until analysis of amino acids by reverse-phase HPLC (Shimadzu, Kyoto, Japan). All samples were analysed in duplicate following established methodology(Reference Huq, Thompson and Ruell17).
Statistics
Data are reported as means and standard deviations. All data were tested for normality of distribution, and statistical procedures were completed using SPSS for Windows (SPSS version 15.0, Inc.; Cary, NC, USA). Student's paired-sample t tests were used to identify differences between the meals in palatability, satiety, sleepiness (visual analogue scales), the GI, GL, insulin index and the incremental area under the curve of the TRP:LNAA response. A two-factor (meal × time), repeated-measures ANOVA was used to test for the postprandial effect of time, meal type and their interaction on TRP, LNAA and TRP:LNAA concentrations. In ANOVA, normality was satisfied using Mauchly's test of sphericity unless reported with the Greenhouse–Geisser value. Significance was set at P < 0·05.
Results
Palatability, satiety and sleepiness (visual analogue scales)
Palatability of the MHGI and MLGI meals was identical and indicated a ‘good taste’; both mean positive scores were 8·3 (sd 1·4) cm; P = 0·956. Both MHGI and MLGI meals were significantly more palatable than the CHGI meal (3·2 (sd 2·2) cm; both comparisons P < 0·001). Satiety was slightly and almost significantly (P = 0·05) higher after the MHGI meal (6·2 (sd 1·6) cm) compared with the MLGI meal (4·9 (sd 2·4) cm). Both these ratings were significantly lower than the CHGI meal (8·7 (sd 1·1) cm; P < 0·001). There were no significant differences between subjective ratings for sleepiness (CHGI 6·2 (sd 1·7) cm, MHGI 5·6 (sd 1·9) cm, MLGI 4·8 (sd 2·4) cm; P>0·05).
Glycaemic index, glycaemic load and insulin index
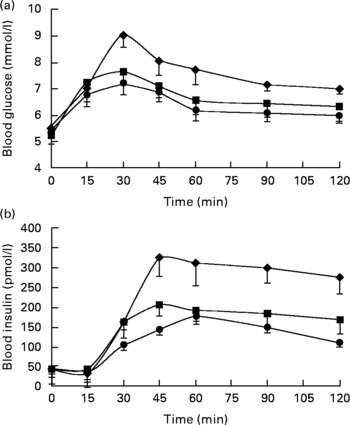
Postprandial concentrations for blood glucose and insulin are shown in Fig. 1. Data were omitted from one participant due to an abnormal fasting glucose concentration(Reference Brouns, Bjorck and Frayn12). The GI, GL and insulin index values were all significantly different between the meals (all P < 0·05). The estimated GI for the CHGI (116·6 (sd 30·1)) meal and exact value for the MHGI (78·6 (sd 17·8)) meal were in the high (GI ≥ 70) range, whereas the GI for the MLGI (50·8 (sd 20·4)) meal was in the low range (GI ≤ 55)(Reference Foster-Powell, Holt and Brand-Miller18). Calculated GL values were greatest after the CHGI (200) meal, followed by the MHGI (58·9) and MLGI (38·2) meals. Insulin index was greatest after the CHGI (158 (sd 59·9)) meal, followed by the MHGI (81·9 (sd 37·2)) and MLGI (55·7 (sd 25·6)) meals, respectively.
Postprandial (a) glucose and (b) insulin responses after the carbohydrate-only high-glycaemic index (CHGI), mixed-macronutrient high-glycaemic index (MHGI) and mixed-macronutrient low-glycaemic index (MLGI) meals in healthy participants. Postprandial glucose was maximal at 30 min in all meal conditions before steadily declining to concentrations slightly above baseline at 120 min. Postprandial insulin peaked at approximately 45 min after the CHGI and MHGI meals but at approximately 60 min after the MLGI meal followed by a gradual reduction. The incremental area under the curve data indicate that the glycaemic index (GI), glycaemic load and insulin index values were largest after the CHGI (117, 200, 158) meal, followed by the MHGI (79, 59, 82) and MLGI (51, 38, 56) meals, respectively. Values were significantly different (P < 0·05). ♦, CHGI; ■, MHGI; ●, MLGI.
Amino acid concentrations
Postprandial TRP and LNAA concentrations are presented in Table 2. Data were from seven participants; two participants failed to complete all venepuncture procedures. All basal amino acid concentrations were not statistically different between the meals.
(Mean values and standard deviations)

* LNAA: valine, isoleucine, leucine, phenylalanine and tyrosine.
† Incremental area under the curve was significantly greater after the CHGI meal compared with the MLGI meal (two-tailed t test, P = 0·054; one-tailed t test, P = 0·03).
‡ Mean values were statistically significant compared with baseline (P < 0·05).
TRP after the MHGI and MLGI meals was elevated compared with baseline at 120 (P = 0·02) and 180 min (P < 0·001), but declined to levels similar to baseline at 240 min. Conversely, there was a marginal postprandial decline in TRP after the CHGI meal (time; F(1·2, 7·4) = 7·2, P = 0·026 (Greenhouse–Geisser)); however, no significant change was observed from baseline (P>0·05).
After the MLGI meal, LNAA was initially increased at 120 min (P = 0·03) and then declined, whereas after both the MHGI and MLGI meals, there was a significant postprandial decline in LNAA (time; F(3, 18) = 43·2, P < 0·001). The rate of change was significantly different between the meals (meal × time; F(6, 36) = 8·7, P < 0·01); the decline in LNAA after the CHGI meal was more rapid than after the MLGI (P = 0·001) and MHGI (P = 0·004) meals. In addition, the total decline in LNAA after the CHGI meal was significantly greater than after the MLGI (P = 0·04) meal but not after the MHGI (P = 0·10) meal.
The postprandial TRP:LNAA response is shown in Fig. 2. Basal TRP:LNAA was not significantly different between the meals. TRP:LNAA increased with time after all meals (time; F(1·7, 10) = 17·3, P = 0·001 (Greenhouse–Geisser)); the corresponding percentage rise from baseline was approximately 23 % (CHGI), 17 % (MHGI) and 8 % (MLGI). The incremental area under the curve was greatest after the CHGI (4·4 (sd 2·6)) meal, followed by the MHGI (2·8 (sd 3·7)) and MLGI (1·4 (sd 1·4)) meals; these values were not statistically significant between the CHGI and MHGI meals (P = 0·38) meals or between the MHGI and MLGI meals (P = 0·43); however, there was a trend present between the CHGI and MLGI (P = 0·05) meals, and the one-tailed t test was significant (P = 0·03).
Effects of the carbohydrate-only high-glycaemic index (CHGI), mixed-macronutrient high-glycaemic index (MHGI) and mixed macronutrient low glycaemic index (MLGI) meals on postprandial tryptophan (TRP)/large neutral amino acid (LNAA) concentrations in healthy participants. There was a significant postprandial rise after each meal with a peak percentage increase between 180 and 240 min after meal consumption. The corresponding peak percentage rise was approximately 23, 17 and 8 % after the CHGI, MHGI and MLGI meals, respectively. The incremental area under the curve data indicate that TRP:LNAA levels after the CHGI meal were greater than after the MLGI meal (two-tailed t test, P = 0·054; one-tailed t test, P = 0·03). ♦, CHGI; ■, MHGI; ●, MLGI.

Discussion
The present study examined the influence of the GI and GL on the postprandial concentration of TRP:LNAA. The study results indicate that the MHGI and MLGI meals resulted in a lower glycaemic and insulin response compared with the CHGI meal. In addition, there was an initial increase in TRP after the MHGI and MLGI meals, whereas after the CHGI meal, changes in TRP were unremarkable. Conversely, the rate of decline in LNAA was markedly higher after the CHGI meal compared with the MHGI and MLGI meals. As a result, there was a substantial postprandial rise in TRP:LNAA after the CHGI meal, which was slightly attenuated after the MHGI meal, and relatively small after the MLGI meal.
The decrease in the glycaemic and insulin response of the MHGI and MLGI meals confirms our initial hypothesis and demonstrates substantial clinical improvement compared to the CHGI meal. The GL of the MHGI (GL 59) and MLGI (GL 38) was significantly lower than the CHGI meal (GL 200). Epidemiological studies have linked high-GI and -GL diets to increased risk of CVD and for the development of type 2 diabetes(Reference Pawlak, Ebbeling and Ludwig19, Reference Jenkins, Kendall and Axelsen20). A GL value of >120 over a single day is regarded as high(Reference Brand-Miller21). Hence, this study confirms that the GL of the CHGI meal was over 1·5 times greater than what is clinically recommended for an entire day(Reference Afaghi, O'Connor and Chow11). Conversely, given regular consumption of the MHGI or MLGI as an evening meal, the cumulative daily GL could be kept below high levels. In addition, the MHGI and MLGI meals were similar in taste, had higher palatability ratings and were approximately 50 % less in energy relative to the CHGI meal (Table 1). Moreover, the mixed-macronutrient profile of the MHGI and MLGI meals is consistent with Western dietary guidelines(Reference Services HaH, Agriculture22, Reference NHMRC23). Thus, it is likely that these meals would be easily accepted as part of a regular diet in future studies.
The biochemical results of the study suggest that a simple manipulation of the amount and type of CHO in a single meal can lead to a substantial change in postprandial amino acid concentration. Given that the macronutrient composition of the MHGI and MLGI meals was identical and each contained the same protein source (e.g. chicken breast sachet), it is likely that these meals contributed an identical amount of dietary TRP, and that this amount was greater than the CHGI meal, which comprised mainly rice and vegetables(Reference Harada, Hirotani and Maeda24). Indeed, there was a significant increase in TRP concentration at 120 and 180 min after the MHGI and MLGI meals but not after the CHGI meal (Table 2). Conversely, there was an overall decline from baseline in LNAA at the end of the study period after all meals (240 min; Table 2), and a higher rate of change in LNAA after the CHGI meal compared with the MHGI and MLGI meals. These findings together suggest that the postprandial decline in LNAA was largely dependent on the type (high-GI v. low-GI rice) and amount of CHO (75 g in the mixed-macronutrient meals v. 171 g in CHGI meal) in the meals (Table 1). Furthermore, the decline in LNAA presented after the MHGI and MLGI meals indicates that a CHO:protein ratio of approximately 4:1 results in a significant uptake of LNAA into skeletal muscle. Thus, the present study suggests that the postprandial change in LNAA is largely dependent on the meal GL and not on the ratio of CHO:protein, as suggested earlier to be responsible for the change in LNAA(Reference Berry, Growdon and Wurtman8).
The present data further indicate that the increase in postprandial TRP:LNAA was inversely proportional to the magnitude and rate of decline in LNAA. In fact, the TRP:LNAA response after the CHGI meal is in line with those from previous studies(Reference Lyons and Truswell3–Reference Lieberman, Caballero and Finer5). Importantly, the postprandial concentration of TRP:LNAA dictates the synthesis of central nervous system serotonin(Reference Spring25), a key neurotransmitter involved in the regulation of sleep(Reference Siegel26). In a separate study, the CHGI meal was previously shown to improve sleep initiation when provided 4 h before bedtime compared with an isoenergetic low-GI version(Reference Afaghi, O'Connor and Chow11). Furthermore, Blum et al. reported that the consumption of a similar-sized CHO breakfast meal resulted in a 461 % increase from baseline in the postprandial insulin response and a 3·5-fold increase in platelet poor plasma serotonin in healthy subjects(Reference Blum, Vered and Graff27). Thus, the peak percentage change from baseline in insulin after the CHGI meal (650 %) indicates that postprandial serotonin was probably increased, which may therefore explain the improvement in sleep initiation after the CHGI meal(Reference Afaghi, O'Connor and Chow11). In addition, given the peak insulin response to the MHGI meal (450 %), it remains a possibility that such a mixed-macronutrient meal may similarly improve sleep initiation(Reference Wurtman, Wurtman and Regan4, Reference Orosco and Gerozissis28). However, given the reduced TRP:LNAA response, we may speculate that this improvement would be present only when sleep propensity is high, such as in the post-lunch period or in the late evening(Reference Dijk and Cajochen29–Reference Wells, Read and Idzikowski31).
There are several limitations with the present study. It was difficult to estimate a priori the sample size required to identify meal difference in amino acid concentration due to a limited number of published data using mixed-macronutrient meals. Future studies should inflate sample size estimates, which will also help to account for common difficulties with venepuncture. Moreover, since the study was conducted in the morning and the room was abundant with natural light, postprandial serotonin was not measured due to the risk of platelet contamination(Reference Maria, Ribeiro and Tice32). Indeed, inadequate satiety and low levels of serotonin are linked to clinical disorders such as insomnia(Reference Bucci33), seasonal affective disorder or severe premenstrual syndrome(Reference Wurtman and Wurtman34). However, since the participants in the present study were all healthy, young, male adults, it is unknown how these results would generalise to such clinical groups, or women and older participants.
In summary, the present study demonstrates that the postprandial TRP:LNAA response to a mixed-macronutrient and a CHO-only meal was increased by higher CHO ingestion and higher GI. Therefore, the meal GL appears to be an important factor influencing the postprandial TRP:LNAA response. These findings may have clinical relevance for management of conditions where increased serotonin production is considered beneficial, primarily for promotion of sleep in patients with insomnia(Reference Hartmann and Elion35, Reference Lacey, Stanley and Hartmann36). Specific research would be required to assess the risk–benefit of using high-GI meals to promote sleep against current strategies for clinical management of insomnia.
Acknowledgements
The present study was supported by a generous supply of rice from Riviana Foods, and meal sachets from Gippsland Food Company, a division of Simplot Australia, Private Limited in cooperation with Nestle Australia. We would like to acknowledge Karola Stockmann from the Sydney University Glycemic Index Research Services group for assisting with the testing in the Human Nutrition Unit kitchens. No author had any financial or other conflicts of interest in the organisation supporting the present study. All authors contributed to the design of the study and test meals. C. P. H. and K. S. implemented the study protocol and completed the collection of data and statistical analysis. C. P. H., K. S., F. A. and P. R. performed the biochemical analysis. C. P. H. and K. S. wrote the manuscript, with C. M. C., H. O’. C. and J. B.-M. involved in data interpretation and editing.


