


For nutritional surveillance, a variety of methods to collect food consumption data are available. A common challenge for individual-based dietary assessment methods is related to portion size estimation. Besides asking participants to weigh their foods or describe portion sizes in terms of natural or commercial units, typical serving sizes or household measures, two- and three-dimensional portion size measurement aids are available. Of particular use are food photographs because, from a respondent's perspective, they are attractive and easy to use (I Huybrechts, A Geelen, J de vries, et al., unpublished results).
When using photographs as a portion size measurement aid, three psychological constructs must be addressed(Reference Nelson, Atkinson and Darbyshire1, Reference Nelson, Atkinson and Darbyshire2): perception; conceptualisation; memory. Perception is related to the ability of a person to correctly link an amount of food that is actually present (e.g. on a plate, in a cup, etc.) to a series of two-dimensional photographs depicting different portion sizes of the same food. Conceptualisation refers to the person's ability to link a mental construct of an amount of food that is not present in reality to an amount of the same food represented by a photograph. Since conceptualisation is associated with recalled intake of foods, memory will influence the precision of conceptualisation. In validation studies addressing errors related to portion size estimation by food photographs, the above-mentioned psychological constructs are studied.
Studies addressing the validity of food photographs in adults have shown that food photographs are useful aids for portion size assessment, although considerable under- and overestimation of portion sizes are reported(Reference Nelson, Atkinson and Darbyshire2–Reference Robinson, Morritz and McGuiness5). In the literature, many foods have been investigated. However, data on bread and margarine spread on bread are still scarce, and portion size estimation of beverages by photographs of household measures is not frequently investigated. As proposed by Slimani et al. (Reference Slimani, Deharveng and Charrondiere6), two-dimensional models of slices of bread indicating real thickness, shape and size should be used instead of photographs. This was supported by the findings from Ovaskainen et al. (Reference Ovaskainen, Paturi and Reinivuo3), which found poor estimates of portions of bread using photographs. Table 1 shows an overview of the literature indicating design, addressed psychological elements and characteristics of subjects under study. Foods and meals investigated in the past 15 years have been diverse.
Reference and study details of validation studies addressing portion size estimation using food photographs
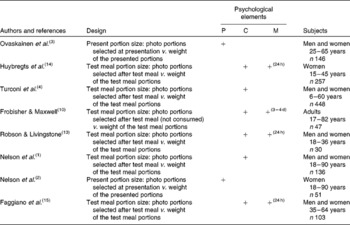
P, perception; C, conceptualisation; M, memory (time before recall).
During the food consumption survey in Belgium, the computerised 24 h diet recall method European Prospective Investigation into Cancer and Nutrition (EPIC)-SOFT was used(Reference De Vriese, Huybrechts and Moreau7). EPIC-SOFT is a computerised program suitable for standardised collection of dietary information in national food consumption surveys(Reference Slimani and Valsta8). Different portion size aids were made available for respondents (e.g. units, household measures and standard portions), including a selection of pictures and drawings from the EPIC-SOFT picture book(Reference van Kappel, Amoyel and Slimani9). Since bread and fat spreads on bread are frequently consumed in Belgium during breakfast and lunch or dinner, the impact of errors in portion size estimation on daily intakes of certain nutrients and energy intake can be considerable. Consumption data from Belgium show that in adults, bread is responsible for 28 and 16 % of the daily carbohydrate and total energy intake, respectively, and fat spreads on bread contribute to 21 % of the daily total fat intake.
The present study aims to investigate perception and conceptualisation skills of adults between 45 and 65 years of age in a nutritional surveillance context using two-dimensional models from the Belgian food consumption survey. Therefore, a breakfast was provided, and recalled portion size estimation using drawings of bread shapes, photographs of margarine on bread, coffee and water was compared with weighed intakes. In addition, real-time sessions were organised to test perception of bread and margarine on bread.
Methods
Subjects
A convenience sample of 111 adults between 45 and 65 years of age was recruited from family members, acquaintances and friends of students in nutrition and dietetics. Subjects were also recruited from a local social service department. Advertisement for a free breakfast was made. Potential participants were informed that the study focused on nutrient content of breakfast foods. The true nature of the study was not disclosed until the end of the study. Besides age, there were no other excluding criteria than being able to be contacted by telephone.
Overall study design
Participants were invited to visit the study centre in four groups due to capacity of infrastructure. On arrival, participants were asked to complete a short questionnaire comprising questions about sex, age, weight and height, and level of highest achieved degree in education. BMI was calculated from self-reported weight and height values; three BMI categories ( < 25, 25–29·9 and >30 kg/m2) were used to characterise participants. Educational level was classified into three levels (low, intermediate and high) and age was classified into two age groups (45–54 and 55–65 years). For the conception and memory study, participants were given a breakfast and allocated into two groups based on their availability during the next days to participate in a short telephone interview (no random allocation). Group ‘short term’ was interviewed about the foods and amounts consumed during the breakfast after 1 or 2 d, and group ‘long term’ after 4 d. Immediately after the breakfast, participants took part in the perception study. A dietetic trainee supervised all conceptualisation and perception sessions and also prepared and weighed the food servings presented.
The study was conducted according to the guidelines laid down in the Declaration of Helsinki, and all procedures involving human subjects were approved by the Regional Ethics Committee of Ghent University Hospital. Written informed consent was obtained from all subjects.
Portions size measurement aids tested
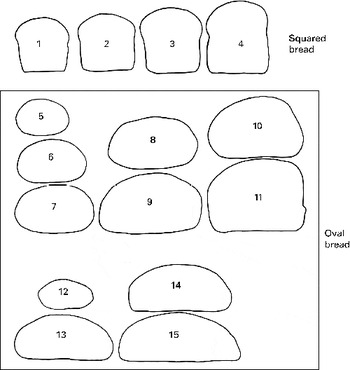
All two-dimensional models (drawings and photographs) used in the present study were taken from the Belgian food consumption survey. They either originate from the EPIC-SOFT picture book(Reference van Kappel, Amoyel and Slimani9) (margarine on bread, cups and glasses) or were developed for use in the Belgian food consumption survey from 2004 (drawings of bread). For bread, fifteen drawings were available, representing the actual shape and size of bread slices. Two different shapes, common on the Belgian market, were included: squared and oval. Four increasing sizes were available for the squared slices originating from small to big squared breads, and eleven different sizes were available for the oval slices according to the dimensions of the bread (small or big) and location of the slice in a bread (on a frontal plane, slices decrease in size from medial to lateral). The drawings of all bread slices provided are given in Appendix A. Different weights are assigned to the fifteen drawings, taking into account shape, size and density of the bread (white v. whole grain).
To estimate the amount of margarine spread on bread, a single A4 page containing six coloured photographs of a squared slice of bread with, respectively, 4, 8, 12, 16, 21 and 26 g of margarine was used. This page was extracted from the EPIC-SOFT picture book(Reference van Kappel, Amoyel and Slimani9). On the photographs, one squared slice of bread on a standard white plate is depicted (angled view). A fork and a knife are present as reference dimensions.
For coffee amount estimation, a single A4 page depicting four coloured photographs of different cups was available. Finally, for water amount estimation, another single A4 page depicting five coloured photographs of different types of glasses was available. The photographs of cups and glasses were in frontal view; all recipients were provided with five measures so that estimation of beverages was also possible using a fraction of the full recipient. The recipients actually provided to the participants during the breakfast were also depicted. Examples of the food photographs used are given in Appendix B.
Perception part of study
Perception error in portion size estimation was studied for bread drawings and margarine photographs. For bread, three slices (square slice A, 21 (sd 0·8) g; square slice B, 31 (sd 0·7) g; oval slice C, 26 (sd 0·5) g) were presented to the participants in real time. With the slices in sight, the participants were asked to identify the corresponding drawings from Appendix A. For practical reasons, it was decided to allow minor deviations in the weights of slices presented compared with the weights of the portions in the photographs (not more than 2 g).
For estimations of margarine spread on bread, three slices of bread identical to slice B were used and spread with margarine. The following portions were accurately weighed and spread on bread: 4, 12 and 21 g (portion margarine A, B and C). These amounts are present on three of the six photographs used. After the perception test, participants left the study centre, and no feedback on correctness of estimation during the perception test was given in order not to influence performance during the upcoming interview for the conceptualisation test.
Conceptualisation and memory part of the study
During the breakfast, every participant received six slices of bread (171 (sd 17·8) g), a small saucer with margarine (40 g), some sweet spreads, cold cuts, cheese, a fruit salad, coffee (266 (sd 14·2) g) and water (500 g). Only the bread, margarine, coffee and water were of interest and therefore pre-weighed. The bread was brown and squared; only one type of bread was used for the sake of logistic simplicity. Coffee was kept warm in individual thermoses; water was provided in a plastic bottle. Two recipients for beverages were also provided, a standard cup for coffee and a highball glass for water. The participants were asked to have their breakfast as they normally would (ad libitum within provided quantities). After the breakfast, a food photograph atlas of selected foods was provided to the participants concealed in a closed envelope, and instructions were given to open the envelope only when called by a dietetic trainee. All food leftovers were weighed by a calibrated scale (Metos, type MII-600; 600 × 0·1 g) in the absence of participants, so that consumed quantities of selected foods could be calculated.
Participants in the short-term group were interviewed by telephone for portion size estimation of consumed foods after 1 or 2 d, and those in the long-term group after 4 d. At the start of the telephone interview, participants were asked to open the provided envelope. Participants were asked to recall bread, margarine on bread, coffee and water consumption and to report the amounts consumed by using the provided drawings and photographs. For bread, the number of slices and the size and shape of the bread consumed had to be reported. EPIC-SOFT was used for data entry and the calculation of estimated amounts. For margarine on bread, participants were asked whether they consumed margarine and if they did, they were asked to select the thickness of the spread on their slice of bread from the six photographs. Also, the number of slices that was spread had to be reported. EPIC-SOFT calculates the total amount of estimated margarine based on the reported information. Estimation of bread and margarine on bread could be done either by entire portions or by fractions of the portions provided. Since estimation of portion size of bread can be erroneous on three individual or combined aspects (wrong size, wrong shape or wrong number of slices), errors in portion size estimation of bread for these three aspects result in errors in the estimation of margarine on bread. To correct for this error propagation, estimations for margarine on bread were also calculated using the actual consumed size, shape and slices of bread.
Data analysis
All statistical analyses were performed using IBM PASW Statistics program version 17.0.3 (SPSS, Inc., an IBM company, Chicago, IL, USA).
A χ2 test for independence of proportions in age category, educational level, BMI category and number of days before the recall across sex was used. The same was done for sex, age category, educational level and BMI category across the number of days before recall. Difference in age and BMI between men and women was tested using the Mann–Whitney U test.
For both conceptualisation and perception data, the difference between the estimated weight and actual weight of the consumed/presented food was calculated (estimated weight − consumed or presented weight). The resulting difference corresponds to the estimation error. A negative difference is considered to indicate underestimation of the consumed portion and vice versa. For all foods, mean estimated and consumed weights were calculated, and mean difference was presented both in g or ml and in percentage (relational difference) to remove the effect of differences in portion size of the foods. The results were presented for all participants and, in addition, tabulated for sex (subgroups women and men). In addition, the results for the conceptualisation study were also stratified by the number of days before recall (subgroups short term and long term). Differences between estimated and consumed quantities were tested by a paired Wilcoxon test. Differences between subgroups were tested by the Mann–Whitney U test. Both tests were two-sided; a P value of < 0·05 was considered to be significant.
A variable measuring both the correctness of the portion size estimation and the direction of the estimation error was calculated, so participants were categorised as correct estimator, underestimator and overestimator per food item. Correct estimations were defined as estimations within 10 % difference of the actual weight(Reference Frobisher and Maxwell10); χ2 tests were used to test any differences between groups.
Finally, Spearman's rank correlation coefficients were calculated to assess the relationship between the estimated and consumed weights of portion sizes.
Results
A total sample of 111 subjects participated in the conceptualisation part of the study; one man did not perform the perception part. Although equality in sex was pursued, more women than men participated in the study (sixty-two and forty-nine, respectively). Attention was paid to the inclusion of lower educated persons (Table 2). A significant difference between the observed and the expected number of men in the lowest education category was present (χ2 (2) = 9·809; P = 0·007). Also, a significant difference between the observed and expected number of participants in the ‘short-term’ group was present in the age category 55–65 years (χ2 (1) = 4·767; P = 0·029) (data not shown). The BMI of men was significantly higher compared with women (U = 1065; P = 0·007); however, the BMI of both sexes reflect national figures of the same age category. No other significant contrast between men and women or the short- and long-term groups was present.
(Mean values and standard deviations or percentages)
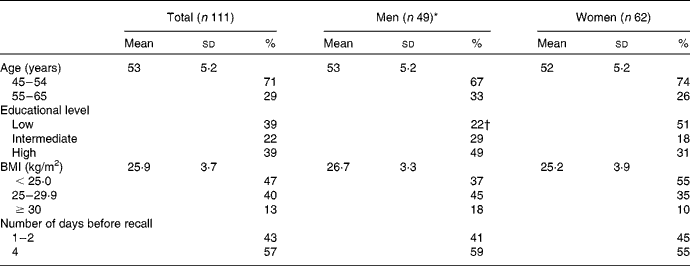
* For perception part of the study, data from one subject were not available (n 48).
† χ2 (2) = 9·809, P = 0·007 (significant difference between the observed and expected number of men in the lowest education category).
Table 3 presents the weights of the foods that were provided for consumption and presented during conceptualisation and perception. The variation of the amount of bread that was presented for perception was kept as small as possible; CV for slices A, B and C were 3·8, 2·3 and 1·9, respectively.
(Mean values and standard deviations)
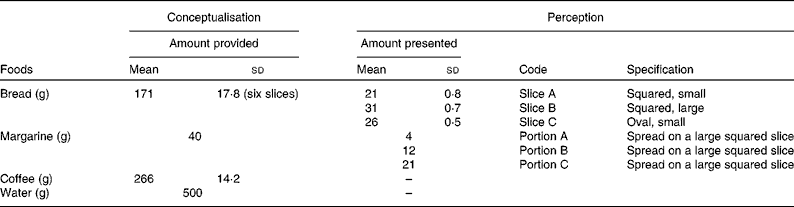
* Slices consumed during breakfast for conceptualisation correspond to slice B presented during perception.
Table 4 shows the mean estimated and consumed weights for each food, the mean difference between the estimated and consumed weights and the percentage difference. For bread, coffee and water, an underestimation of consumed portion size is observed in general. Margarine spread on bread is markedly overestimated. Since consumption of bread is underestimated, the amount of margarine spread on bread is also underestimated. Correcting the estimated amount of margarine for propagated errors in bread consumption estimation increased overestimation of margarine from 94·7 to 111·9 %. Comparatively speaking, the estimation error is largest for margarine (especially if corrected for bread estimation error) and lowest for both beverages, coffee and water. Significant differences between consumed and estimated portions were found for bread and margarine. No significant difference was present for bread in the long-term group. For both beverages, differences were also non-significant except within the long-term group where significant underestimation was present. When the relational differences were compared between men and women, and the short- and long-term groups, the only significant difference was found for water between the short- and long-term groups (U = 325; P < 0·001).
(Mean values and standard deviations)

* Difference (%) = ((mean estimated weight − mean consumed weight) × 100/mean consumed weight).
† P value of the Mann–Whitney U test on relational differences across subgroups, two-sided.
‡ P < 0·05 for the difference between the estimated and consumed weights by a paired Wilcoxon test.
§ Two subjects did not recall to have used margarine during the breakfast.
∥ Estimated amount of margarine corrected for error propagation from bread.
¶ One subject did not recall to have consumed water during the breakfast.
Table 5 summarises data from the perception part of the study. For bread and margarine, estimation error can be segregated from errors resulting from conceptualisation and memory aspects, since slice B corresponds to the slice that was used during the breakfast. Overall, the estimation error is more or less equal ( − 8·7 and − 9·6 %). For the small squared slice of bread (slice A), the estimation error is smaller ( − 2·9 %), and for the oval slice of bread (slice C), the estimation error is largest and, in addition, positive, indicating an overestimation of portion size. Margarine spread on bread is consistently overestimated, decreasing in magnitude with increasing presented portion size. Estimated portions were significantly different from presented portions for all foods except for bread slice A in men. When relational differences were tested across sex, a significant difference was found between men and women for the smallest portion of margarine (A), for which the overestimation of portion size was smaller for women compared with men (U = 1141; P = 0·026).
(Mean values and standard deviations)

* All (n 110), women (n 62), men (n 48).
† Difference (%) = ((mean estimated weight − mean consumed weight) × 100/mean consumed weight).
‡ P value of the Mann–Whitney U test on relational differences across sex, two-sided.
§ P < 0·05 for the difference between estimated and consumed weight by a paired Wilcoxon test.
Classification of participants as under-, over- or correct estimator for conceptualisation and perception data is shown in Table 6. First, for conceptualisation, correct estimation of consumed foods was highest for water (33 % of women and 26 % of men) and for bread (29 % of both sexes). Largest frequency of underestimation was found for coffee consumption with 66 % of women and 59 % of men. Largest overestimation of consumed portions was found for margarine after correction for bread error (82 % of women and 81 % of men). In general, highest proportions of underestimation were associated with bread, coffee and water estimations, and highest proportions of overestimation were seen in portion size estimation of margarine. No significant contrasts were present between men and women. When data were stratified by time before recall (short- and long term), a significant difference was found for water in the underestimation category. More precisely, the proportion of underestimators was lower in the short-term group (χ2 (2) = 7·606; P = 0·022). Second, for perception, for the squared slices (slices A and B), mainly underestimation of portion size was present; for the oval slice (slice C), proportions of correct estimators were highest but overestimation was nearly as high. For margarine spread on bread, again, overestimation of portion size is predominantly present. The amount of margarine spread on bread did not influence the proportions of classification. No significant contrasts were present between men and women for any food.
(Mean values and standard deviations)

* No significant contrasts between men and women (χ2 (2)), χ2 could only be performed for bread and water during conceptualisation and bread slice A during perception, all other foods had more than 20 % of cells with expected counts lower than 5.
† Corrected for error propagation from bread.
The association between consumed and estimated portions was variable with Spearman's correlations ranging from 0·42 to 0·75 (Table 7). Correcting margarine spread on bread for error propagation of bread improved the correlation coefficient between estimated and consumed weights from 0·62 to 0·68. Beverages had lowest correlation coefficients, respectively, 0·42 and 0·48 for coffee and water. Since presented portions during the perception part of the study were fixed, little distribution of estimation data was obtained, so calculating correlation coefficients between presented and estimated weights was not appropriate.
(Number of estimations and correlation coefficient values)
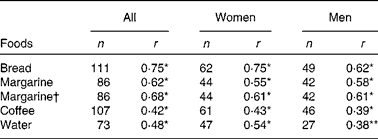
n, Number of estimations; r, Spearman's correlation coefficient.
*P < 0·01, **P < 0·05.
† Margarine corrected for total portion size estimation of bread.
Discussion
Findings
The present study aimed at identifying magnitude and direction of portion size estimation errors using food photographs and drawings. Foods under study were selected either based on the relatively small amount of data present in the literature or experiences during the Belgian food consumption survey(Reference De Vriese, Huybrechts and Moreau7). The results obtained showed tendency for underestimation for all foods except for margarine, which was highly overestimated, and oval slices of bread in both sexes and beverages in men.
Strengths of the study
During conceptualisation, participants were invited to a dining room where served food portions could be weighed covertly. While participants are taken away from their usual environment, this approach is preferable to allowing participants to weigh their own food at home, as this reveals the true nature of the study and the participants' awareness towards portion sizes could be increased(Reference Nelson and Haraldsdottir11).
The study design presented here addressed several psychological constructs necessary for portion size estimation. Nonetheless, separating these constructs to identify their related errors remains difficult. Ultimately, the objective of the present study was to imitate the actual context in which the food photographs are used and to describe the size of errors in portion size estimation, given that context. This relevant context for the Belgian food consumption survey is the recall of portion sizes after 1 d.
Sufficient participants were present in the study in order to have adequate power to demonstrate statistically significant differences between actual and estimated portion sizes. Also, factors such as sex and BMI were taken into account and reflected the population within which dietary surveys are performed in Belgium. It was decided to investigate a narrow age group (45–65 years) in order to control variation in age-related estimation errors.
Limitations of the study
Participants were provided with a closed envelope containing food photographs for use during the recall of consumed foods. Some participants might have opened the envelope earlier, so memory could be addressed before actual recall. Especially in the long-term group, this could have a major influence on participants' performance. More important, participants were asked for portion size estimation to test perception skills before the recall for conceptualisation skills was performed. This could also draw participants' attention to the portions consumed during the breakfast. Also, having breakfast in a non-usual environment, particularly when participating in a study, could also increase awareness of consumed quantities. Furthermore, results presented in the present study should be considered as a best-case scenario, since, in the real world (outside a study context), a larger variety of types of bread, cups and glasses will inevitably increase variance of portion size estimation errors. Due to the complex nature of the study design and the complexity of skills under study, the authors decided to keep the protocol as straightforward as possible.
Classification of participants as under-, over- or normal estimator using a margin of error of 10 % within actual consumed quantities has been performed elsewhere(Reference Frobisher and Maxwell10); nevertheless, it remains an arbitrary figure, which could be too strict or too broad depending on the food or targeted sample. In their study, Lucas et al. (Reference Lucas, Niravong and Villeminot12) considered estimations within 25 % of the weighed amounts to be accurate. Especially for margarine, where the difference between photographs is larger than 10 %, choosing one photograph smaller or larger than the actual photograph results in high under- or overestimation errors.
Comparison with other studies
Since some countries (e.g. in The Netherlands) also include recalls collected 48 h after consumption (during dietary surveys, no interviews are performed on Sundays, so Saturdays' intakes are recalled on Monday), a recall of 1 and 2 d is considered as short term in the present study. In the present study, a relational under-reporting error for bread of − 8·7 % was found during conceptualisation. Turconi et al. (Reference Turconi, Guarcello and Berzolari4) found a relational underestimation error for bread of − 2·7 %. In their study, however, influence of memory was not studied since portion size estimation took place within 10 min after consumption of foods. Because photographs were used in the study of Turconi et al. (Reference Turconi, Guarcello and Berzolari4), one cannot tell whether the differences are due to differences in drawings, time intervals or study populations. In the present study, two time frames between consumption and estimation were included; however, no significant difference in estimation error between the short- and long-term recalls was present.
For perception, estimation errors of the various bread slices were different in magnitude and direction. The squared slices were underestimated, while the oval slice was overestimated (+14·3 %). For the squared slice, estimation error for the small slice was much lower than the large slice ( − 2·9 v. − 9·6 %). Ovaskainen et al. (Reference Ovaskainen, Paturi and Reinivuo3) found a relational difference of about − 30 % for perception of bread in both sexes. The shape and type of bread studied by Ovaskainen et al. (Reference Ovaskainen, Paturi and Reinivuo3) differed from the present study. Also, in the studies from Turconi et al. (Reference Turconi, Guarcello and Berzolari4) and Ovaskainen et al. (Reference Ovaskainen, Paturi and Reinivuo3), photographs were used, whereas in the present study, drawings of bread slices representing the actual size of bread slices were used. It was indeed proposed by Slimani et al. (Reference Slimani, Deharveng and Charrondiere6) and, later, concluded by Ovaskainen et al. (Reference Ovaskainen, Paturi and Reinivuo3) that models representing the actual shape would be favourable over photographs of bread. Comparing the results of the models used in the present study with the previous findings with photographs is very difficult, since none of the studies mentioned have incorporated the factor memory (time) in their design.
For conceptualisation of margarine, a large overestimation of portion size was found (+104·1 % for women and +223·0 % for men; data corrected for propagated errors in bread consumption estimation). In their study, Frobisher & Maxwell(Reference Frobisher and Maxwell10) found estimation errors ranging from − 50 to 300 % in adults. Again, caution in comparing these findings is warranted, since the time before recall was 3–4 d and foods were not actually consumed. In contrary, Robson & Livingstone(Reference Robson and Livingstone13) found negative estimation errors for margarine of about 10–20 %. Although their study design was more close to the present study, it was not stated whether the margarine on the photographs was presented as spread on bread. In addition, quantification of portion sizes was done in terms of fractions or multiples of the amounts shown in one single photograph, not by different photographs with increasing quantities, again hampering comparison. Finally, Nelson et al. (Reference Nelson, Atkinson and Darbyshire1) also found a mean overestimation of margarine spread on bread of 107·6 %. In their study, however, memory influence was not included into the design.
During perception, margarine on bread was also overestimated in the present study, with increasing portions, and errors became smaller (+175,+54·2 and +20·5 %, respectively). Again, overestimation errors were larger for men compared with women for small portion sizes of margarine (P = 0·026), whereas for larger portion sizes, no differences between women and men were observed. Ovaskainen et al. (Reference Ovaskainen, Paturi and Reinivuo3) have also investigated perception skills of different portions of fat spread. For the smallest portion (5 g, portion A in the present study was 4 g), an underestimation of portion estimation was found ( − 14 % for men; − 18 % for women). When a larger portion (12 g; equal to portion B in the present study) was spread on a big slice, an overestimation of 25 % was found without any difference between sexes.
In the present study, conceptualisation skills and influence of memory on estimation errors of two beverages were also included. Women tended to underestimate both coffee and water, while men had overestimation errors. Since more women consumed coffee and water, their underestimation of beverages resulted in a generalised underestimation of beverages. Turconi et al. (Reference Turconi, Guarcello and Berzolari4) found overestimation of portion sizes of beverages (only glasses were included, no coffee cups). In their study, consumed portions were recalled within 5–10 min, so memory could not affect estimation.
The implications of the estimation errors presented are dependent on the context in which the portion size estimation aid is used, whether it will be in the context of nutritional surveillance or epidemiology. For nutritional surveillance, the absolute level of consumption for the population is relevant. Looking at the data for beverages presented here, this would mean a rather small underestimation of coffee and water of 1·7 and 3·4 %, respectively. For bread and margarine on bread, estimation errors were found to be higher. For epidemiological association studies, the ranking of participants rather than the absolute amount is important. If Spearman's rank correlations between consumed and estimated weights are examined, the opposite is found, suggesting a higher validity of the food photographs for bread and margarine on bread compared with coffee and water.
In practice, photographic atlases can be adopted from other countries, especially because developing and validating new food photographs are time and money consuming. If food photographs are adopted for use in another country or with a different target group, adaptations might be overlooked. Sound evaluation is recommended either to include relevant, country- or sample-specific food photographs or to change existing photographs according to local customs.
Conclusions
In spite of large individual errors, the results of the present study suggest that food portion photographs can be used as an instrument to estimate portion sizes of bread, coffee and water in the context of nutritional surveillance for adults. For margarine spread on bread, large overestimation was found for the current set of photographs. A study on the validity of photographs showing smaller amounts of margarine spread on bread is recommended.
Acknowledgements
All authors declare that they have no conflicts of interest. The present research received no specific grant from any funding agency in the public, commercial or not-for-profit sectors. The authors acknowledge the dietetic trainee Kim Decock for the organisation and leading of the breakfast sessions. W. D. K., M. D. M. and I. H. were responsible for the design of the study and analysis of the data. W. D. K. drafted the manuscript. All authors were involved in the interpretation of the data and reviewing of the manuscript.
Appendix A
Appendix B



