

Most species reared for aquaculture production require a high amount of protein in their diets (350–650 g/kg feed), but next to the quantitative requirements of dietary protein, the amino acid (AA) profile forms the protein quality and is thus the basis for maximum utilisation and growth in fish nutrition( Reference Wilson, Halver and Hardy 1 ). Dietary requirements of essential amino acids (EAA) in fish feed have received considerable attention, since deficiency of one of the EAA results in poor feed intake, decreased nutrient utilisation and reduced growth( Reference Lall and Anderson 2 , Reference Li, Mai and Trushenski 3 ). In most alternative protein sources (e.g. maize gluten and wheat gluten), lysine is the first-limiting AA, and supplementation with free AA is necessary to provide optimal growth( Reference Burel, Boujard and Kaushik 4 , Reference Helland and Grisdale-Helland 5 ).
Free AA are generally considered to be well utilised by fish, as reported previously in several studies( Reference Rodehutscord, Borchert and Gregus 6 – Reference Refstie, Førde-Skjærvik and Roselund 8 ). Most of these studies have incorporated free lysine into lysine-deficient diets in order to meet or exceed the dietary requirement of the species under study. Supplementation with free lysine has been shown to be widely successful in enhancing growth and nutrient utilisation in a variety of fish, including turbot( Reference Rodehutscord, Becker and Pack 9 – Reference Deng, Dominy and Ju 21 ).
A comparison between protein-bound and free lysine from a soyabean meal and l-lysine HCl, respectively, has only been reported for channel catfish (Ictalurus punctatus) in a dose–response study( Reference Zarate and Lovell 10 ). This study has shown that the efficiency of lysine utilisation was higher for protein-bound lysine than for free lysine, in terms of weight gain and protein gain. In pigs, the availability of free lysine has been shown to be equal to that of protein-bound lysine from fishmeal (FM), skimmed-milk powder and a soyabean meal, but found to be higher compared with a cottonseed meal and a meat meal( Reference Batterham, Murison and Lewis 22 ). More recent studies have evaluated the efficiency of utilisation by growth response criteria (feed conversion ratio (FCR)) rather than by lysine deposition( Reference Rodehutscord, Borchert and Gregus 6 , Reference Hauler and Carter 23 – Reference Encarnação, de Lange and Bureau 25 ). It is worth mentioning that in dose–response trials, feed is provided to satiation and feed intake per se might be affected by the limitation of the nutrient( Reference Hauler and Carter 23 , Reference D'Mello and D'Mello 24 ). Since feed intake affects growth, it has been considered important to evaluate lysine utilisation in terms of protein and lysine retention (g lysine deposited/g lysine intake) rather than relying only on growth measurements( Reference Hauler and Carter 23 , Reference Pfeffer, Al-Sabty and Haverkamp 26 ). Moreover, to determine the utilisation efficiency of a nutrient, the experimental design must be conducted under conditions of marginal supply of the nutrient to result in maximum utilisation( Reference Rodehutscord, Borchert and Gregus 6 ).
The present study elucidated the efficiency of lysine utilisation in its protein bound form (casein (Cas) and FM) or free form (l-lysine HCl) at marginal lysine intake in juvenile turbot. Additionally, the study examined the influence of these sources on the bioavailability of lysine.
Materials and methods
Diet preparation
For the present analysis, one basal and eight experimental diets were formulated with increasing amounts of either protein-bound lysine (Cas or FM) or free lysine (l-lysine HCl). Wheat gluten was chosen as the main dietary protein source due to its low lysine level (2·25 g lysine/100 g crude protein (CP); Table 1). The lysine concentration of the basal diet (Basal 2·3) was substantially lower than the recommended level (5·0 g lysine/100 g CP)( Reference Peres and Oliva-Teles 17 , Reference Kaushik 27 ). Cas, FM and l-lysine HCl were incorporated into the diet to increase dietary lysine concentrations. Cas was chosen as a reference source because of its high digestibility (92–100 %), high protein content and high lysine level. Fishmeal is generally considered as an optimal protein source in fish nutrition because of its high digestibility, well-balanced AA profile, lack of anti-nutritional factors and high palatability( Reference Li, Mai and Trushenski 3 , Reference Aksnes and Mundheim 28 ). l-Lysine HCl is well established as an available source of lysine, with >98 % apparent N digestibility for rainbow trout( Reference Rodehutscord, Borchert and Gregus 6 ).
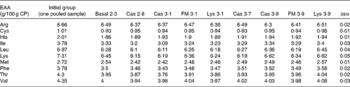
Formulation, proximate nutrient composition and amino acid composition of the experimental diets (casein (Cas), fishmeal (FM) and l-lysine HCl (Lys))

CP, crude protein.
* VF Cuxhaven, Germany.
† Cargill Deutschland GmbH, Krefeld, Germany.
‡ H. Kröner GmbH, Ibbenbüren, Germany.
§ Aller Aqua, Christiansfeld, Denmark.
∥ Evonik Industries, Hanau, Germany: crystalline amino acid mix of the basal diet (g/kg feed, the experimental diets were adjusted to meet nutrient requirements): l-arginine 0·86; l-histidine 0·37; l-methionine 0·29; l-cysteine HCl 0·25; l-valine 0·77; l-isoleucine 0·74; l-leucine 1·26; l-threonine 0·13; l-phenylalanine 0·71; l- tryptophan 0·18; l-glycine 2·76; l-tyrosine 0·55; l-alanine 1·18.
¶ Lehmann & Voss & Company, Hamburg, Germany.
** Calculated as follows: 1000 − (crude protein+crude fat+ash).
The diets were designated as Basal 2·3, Cas 2·8, Cas 3·1, Cas 3·7, Cas 3·9, FM 3·1, FM 3·9, Lys 3·1 and Lys 3·9 (Table 1), with each label corresponding to the source and average concentration of lysine in relation to CP (g lysine/100 g CP). Cas was incorporated to the test diets in doses of 31, 62, 93 and 124 g to achieve four dietary lysine concentrations (Cas 2·8, Cas 3·1, Cas 3·7 and Cas 3·9, respectively). Fishmeal was added to the diets at doses of 90 and 180 g to yield two lysine concentrations (FM 3·1 and FM 3·9, respectively). To obtain the same lysine concentrations (Lys 3·1 and Lys 3·9), l-lysine HCl was added at doses of 5·0 and 10·7 g, respectively, to the diets. All diets were formulated to be isoenergetic and isonitrogenous. To obtain similar N concentrations, a mixture of EAA and semi-EAA was prepared. This mix was formulated so that all diets would meet EAA requirements( Reference Peres and Oliva-Teles 17 , Reference Kaushik 27 ), except for lysine (Table 2), and was added to all the experimental diets. Feed ingredients were mixed, and pellets of 4 mm diameter were formed using a pellet press (L 14-175; Amandus Kahl).
Ratio of essential amino acids (EAA) to lysine according to the requirements of turbot( Reference Peres and Oliva-Teles 17 , Reference Kaushik 27 ) and the respective ratios in the experimental diets (casein (Cas), fishmeal (FM) and l-lysine HCl (Lys))

ND, not determined.
Experimental set-up
The experiments were conducted at the Gesellschaft für Marine Aquakultur in Büsum, Germany and juvenile turbot (Psetta maxima) were obtained from Maximus A/S (Denmark). For these trials, thirty rectangular tanks (bottom surface 0·15 m2, total water volume 50 litres) were arranged in a recirculating aquaculture system, and equipped with a mechanical and biological filter and a disinfection unit (UV filter). Water discharge was approximately 850 litres/kg feed, and the photoperiod was a 12 h light–12 h dark cycle. Water parameters were determined on a daily basis: temperature 16·3 (sd 0·3)°C; dissolved oxygen 8·1 (sd 0·2) mg/l (Handy Polaris; OxyGuard International A/S); salinity 24 (sd 1) g/l (digital refractometer HI 96822; Hanna Instruments); 0·6 (sd 0·1) mg NH4-N/l, 0·8 (sd 0·3) mg NO2-N/l (Microquant test kit; Merck KGaA).
Fish were randomly stocked in the experimental tanks. During the acclimatisation period of 14 d, fish were fed with a commercial dry feed (Aller Aqua 505, 4 mm in diameter). After this period, ten fish were killed with an overdose of the anaesthetic tricaine methanesulphonate (MS 222) and stored at − 20°C for further analysis. A total of 240 fish were weighed individually to the nearest of 0·1 g (initial weight 50·1 (sem 5·0) g), their total length was measured (initial length 14·0 (sem 0·5) cm), and were randomly restocked to the experimental tanks (eight individuals per tank). Fish were starved for 24 h before each weighing. The diets containing FM and Cas as supplemental lysine sources were fed to fish reared in triplicate groups. The basal diet and diets containing l-lysine HCl were fed to fish reared in quadruplicate groups. All fish were hand-fed once daily (09.00 hours) until apparent satiation over a period of 56 d. Uneaten pellets were recovered from each tank, counted and used to estimate the mass of uneaten feed, based on the average pellet mass. This feed estimate was subtracted from the mass of feed offered to calculate daily feed intake (DFI).
Chemical analysis
At the end of the feeding trial, fish weight and total length were measured individually. From each tank, three fish were killed and stored at − 20°C until further analysis. Fish were freeze-dried (for 120 h), homogenised and stored at − 20°C. The experimental diets were homogenised and stored at − 20°C. According to the protocol( Reference Naumann and Bassler 29 ), feed and fish were analysed for DM, crude ash, crude lipid and gross energy (adiabatic bomb calorimeter C200; IKA-Werke GmbH & Company KG). Crude lipid analysis was done with (diets) or without (fish) HCl hydrolysis using a Soxhlet system (R 106 S; Behr). Total N content was determined by the Dumas combustion principle (True Spec N; LECO Corporation). CP content was calculated by multiplying N content by 6·25. Dietary AA concentrations were analysed by Evonik Industries according to the Commission Directive guidelines( 30 ). Tryptophan was not analysed.
Statistical analysis
Data were analysed by an ANOVA (body composition) or ANCOVA (growth parameters) using SPSS 17.0 for Windows (IBM), after testing for homogeneity of variances by Levene's test and normal distribution by Kolmogorov–Smirnov test. A parametric post hoc test (Tukey's test) was used for the ANOVA. For ANCOVA, the dependent variable was intake of nutrients (above the basal group) and the covariate was lysine source. Differences between treatments were considered significant at a P value of < 0·05. The linear regression analysis was conducted using GraphPad Prism 5.0 (GraphPad Software). The slope-ratio approach( Reference Littell, Henry and Lewis 31 ) was used to determine the bioavailability of a single nutrient source. This ratio is determined by the reciprocal of the efficiency of lysine utilisation (k Lys) for the tested lysine sources (l-lysine HCl and FM) to Cas.
Results
Growth performance
During the experiment, there was no fish mortality. All fish accepted the experimental diets. Feed intake (DFI and feed intake based on metabolic body weight (FIMBW)) was significantly affected by dietary lysine concentration (DFI: P< 0·01; FIMBW: P< 0·01) but not by lysine source (DFI: P= 0·06; FIMBW: P= 0·54).
Growth performance of the fish increased with increasing dietary lysine concentrations (Table 3) . The FCR and specific growth rate (SGR) were significantly affected by dietary of lysine concentration (SGR: P< 0·01; FCR: P< 0·01) but not by lysine source (SGR: P= 0·09; FCR: P= 0·71).
Initial and final weight, feed intake and growth performance of juvenile turbot fed the basal diet or experimental diets (casein (Cas), fishmeal (FM) and l-lysine HCl (Lys)) over a period of 56 d (Mean values with their pooled standard errors)
DFI, daily feed intake; FIMBW, feed intake based on metabolic body weight; SGR, specific growth rate; FCR, feed conversion ratio.
* FIMBW= DM feed intake (g/MBW per d).
† SGR = 100 × (ln final weight − ln initial weight)/d.
‡ FCR = DM feed intake (g)/weight gain (g).
Body composition
There was no difference in energy or DM content between the treatments (Table 4), but CP, crude lipid and crude ash contents were affected by the dietary treatments (P< 0·05). The condition factor of the fish ranged between 1·55 and 1·69 and was unaffected by the dietary treatments (P>0·05). The hepatosomatic index varied between 2·20 and 3·14 % and was not significantly different between the treatments (P= 0·30). All EAA concentrations in the whole body decreased from the start to the end of the experiment, with no differences between the treatments (P>0·05; Table 5).
Proximate whole-body composition, gross energy content and biometrical parameters of turbot fed the basal and experimental diets (casein (Cas), fishmeal (FM) and l-lysine HCl (Lys)) over a period of 56 d* (Mean values with their pooled standard errors)
ND, not determined; HSI, hepatosomatic index.
a,bMean values within a row with unlike superscript letters were significantly different (P< 0·05).
* Additionally, whole-body composition of the initial group is given.
† Condition factor = body weight (g)/(total length, cm)3× 100.
‡ HSI = liver weight/body weight × 100.
Whole-body essential amino acid (EAA) composition (g/100 g crude protein (CP)) of turbot fed the basal and the experimental diets (casein (Cas), fishmeal (FM) and l-lysine HCl (Lys)) over a period of 56 d (Mean values with their pooled standard errors)
Nutrient utilisation efficiency
Nutrient retention efficiency increased with increasing feed intake (Table 6). The same observations were made for lysine retention efficiency, which was highest for the dietary treatments Cas 3·9 and Lys 3·9 (64·4 and 65·4 %, respectively).
Protein, lysine and energy intake and the respective retention in turbot fed the experimental diets (casein (Cas), fishmeal (FM) and l-lysine HCl (Lys)) over a period of 56 d (Mean values with their pooled standard errors)

* Nutrient intake (g/kg0·8 per d) = (daily feed intake × nutrient content of the diet)/metabolic body weight (MBW)/experimental days.
† Gross nutrient or gross energy gain (g/kg0·8 per d) = nutrient/energy gain in body tissue/MBW/experimental days.
‡ Gross nutrient or energy retention efficiency based on nutrient intake (% of gross nutrient/energy intake) = ((% of final body nutrient concentration × final weight) − (% of initial body nutrient concentration × initial weight))/nutrient intake × 100.
Lysine utilisation efficiency (k Lys) was calculated based on the linear regression (Fig. 1) of the slope-ratio approach, and was 0·684 in FM diets. For the diets supplemented with free lysine or Cas, the k Lys value was 0·857 and 0·833, respectively. Lysine retention was affected by dietary lysine concentration (P< 0·01) but not by lysine source (P= 0·41). Nutrient requirement for maintenance was in the range of 16·7–23·4 mg/kg0·8 per d (Table 7), and did not differ between the treatments. Linear regression slopes between lysine intake and protein retention (Fig. 2) were not significantly different between the diets (P= 0·36). Protein retention efficiency was highest by 45·2 % in fish fed the 3·9 % lysine diet (Table 6), and significantly affected by lysine concentration (P< 0·01) but not by lysine source (P= 0·38).
Lysine utilisation efficiency (k
Lys) of juvenile turbot fed increasing amounts of dietary lysine and its relationship to lysine retention (mg/kg0·8 per d) over a period of 56 d. ![]() , Basal diet;
, Basal diet; ![]() , casein;
, casein; ![]() , fishmeal;
, fishmeal; ![]() , l-lysine HCl. Casein: y= 0·833 ± 0·05x− 0·020 ± 0·004; r
2 0·94; l-lysine HCl: y= 0·857 ± 0·07x− 0·018 ± 0·01; r
2 0·94; fish meal: y= 0·684 ± 0·06x− 0·011 ± 0·01; r
2 0·95. The slopes were significantly different from zero (P< 0·01). The y-intercepts were not significantly different from zero (P= 0·3).
, l-lysine HCl. Casein: y= 0·833 ± 0·05x− 0·020 ± 0·004; r
2 0·94; l-lysine HCl: y= 0·857 ± 0·07x− 0·018 ± 0·01; r
2 0·94; fish meal: y= 0·684 ± 0·06x− 0·011 ± 0·01; r
2 0·95. The slopes were significantly different from zero (P< 0·01). The y-intercepts were not significantly different from zero (P= 0·3).

Regression coefficients* for lysine intake in turbot fed the experimental diets (casein (Cas), fishmeal (FM) and l-lysine HCl (Lys)) over a period of 56 d†(Regression coefficients with their standard errors)
* y = mx+b, describing the efficiency of lysine utilisation as a function of intake (g/kg0·8 per d).
† Slopes of regression were significantly different from zero (P< 0·01).
‡ The y-intercepts were not significantly different from zero (P= 0·3).
§ Significant at P< 0·05.
∥ Maintenance requirement (x-intercept, mg/kg0·8 per d) was calculated as: –b/m.
¶ Bioavailability of lysine from FM and Lys (relative to Cas) calculated as: (m test/m Cas) × 100.
Linear relationship between lysine intake and protein retention (mg/kg0·8 per d) of juvenile turbot fed increasing amounts of dietary lysine from three dietary sources (![]() , casein;
, casein; ![]() , fishmeal;
, fishmeal; ![]() , l-lysine HCl) and the basal diet (
, l-lysine HCl) and the basal diet (![]() ) over a period of 56 d. Casein: y= 11·7 ± 0·6x− 0·050 ± 0·04; r
2 0·96; l-lysine HCl: y= 12·2 ± 1·0x− 0·062 ± 0·07, r
2 0·94; FM: y= 10·7 ± 0·7x− 0·012 ± 0·05; r
2 0·97. The slopes were significantly different from zero (P< 0·01). The y-intercepts were not significantly different from zero (P= 0·3).
) over a period of 56 d. Casein: y= 11·7 ± 0·6x− 0·050 ± 0·04; r
2 0·96; l-lysine HCl: y= 12·2 ± 1·0x− 0·062 ± 0·07, r
2 0·94; FM: y= 10·7 ± 0·7x− 0·012 ± 0·05; r
2 0·97. The slopes were significantly different from zero (P< 0·01). The y-intercepts were not significantly different from zero (P= 0·3).

Bioavailability
Relative bioavailability of lysine in relation to the reference lysine source Cas (assumed to be 100 % bioavailable) was calculated. In accordance with the efficiency of lysine retention determined for FM (68·4 %) and k Lys for l-lysine HCl (85·7 %), the reciprocal of k Lys for Cas (83·3 %) was calculated. The availability of the lysine source, evaluated as a ratio to Cas (100 %), was 82·1 % for FM and 103 % for l-lysine HCl. There were no significant differences observed between the three lysine sources (P>0·05).
Discussion
The main protein source for all the experimental diets used in the present study was wheat gluten (335 g/kg feed; providing 1·71 g lysine/100 g CP). The inclusion of wheat gluten in diets for halibut and turbot has been evaluated previously, and it is known as an effective means to reduce dietary lysine content and, therefore, lysine intake( Reference Helland and Grisdale-Helland 5 , Reference Kroeckel, Dietz and Schulz 32 ). The basal diet used in the present feeding trial was designed to contain 50 % less lysine than the dietary lysine requirement for optimal growth( Reference Peres and Oliva-Teles 17 ). The highest dietary lysine concentration was 3·9 (SD 0·2) g/100 g CP, which was still below the previously reported requirements. When determining the efficiency of the utilisation of a certain AA, it must be ensured that it is the first-limiting AA( Reference Rodehutscord, Borchert and Gregus 6 , Reference Hauler and Carter 23 , Reference Susenbeth 33 , Reference Carter and Hauler 34 ). The ratio of each AA:lysine was, therefore, calculated from published EAA requirements for juvenile turbot( Reference Peres and Oliva-Teles 17 , Reference Kaushik 27 ) to ensure that lysine was the first-limiting AA in each of the experimental diets (Table 2).
The incorporation of free AA in fish diets is a common practice, but their efficiency has not been described clearly. In most studies, free lysine is incorporated into diets to avoid AA deficiencies resulting from the exchange of FM by protein sources containing low lysine levels such as wheat gluten. In this case, free AA are used to meet or exceed dietary AA requirements and the efficiency of the utilisation of an AA cannot be estimated clearly due to the diminishing effects above the marginal intake( Reference Susenbeth 33 , Reference Gahl, Crenshaw and Benevenga 35 , Reference Susenbeth, Dickel and Diekenhorst 36 ).
There is a linear relationship between intake and response (e.g. feed efficiency, AA retention) under limited conditions( Reference Hauler and Carter 23 , Reference Susenbeth 33 ), which can be used to determine maintenance requirements (x-intercept). The slopes of the regression represent the efficiency of the utilisation of an EAA (k EAA). At a higher concentration of an EAA (above the marginal requirement), this linear relationship will change to a non-response portion and reach an asymptote (plateau) above which no further performance improvements can be recorded( Reference Susenbeth, Dickel and Diekenhorst 36 ). The efficiency of the utilisation of an AA will, therefore, decrease at the point of transition or at a point where other nutrients or energy become the first-limiting nutrient. The present study had two lysine levels repeated for each lysine source (3·1 and 3·9 % of the diet). Due to slight differences in the lysine content and the feeding regimen (until apparent satiation), the ingested amount of lysine might have influenced growth parameters, as has been observed by other authors( Reference Hauler and Carter 23 , Reference Pfeffer, Al-Sabty and Haverkamp 26 ). Single AA deficiencies might lead to decreased feed intake, as has been shown in studies with European sea bass( Reference Tibaldi, Kaushik, Montero, Basurco, Nengas, Alexis and Izquierdo 37 ) and rainbow trout( Reference Fauconneau 38 ). Indeed, feed intake (DFI and FIMBW) was affected by dietary lysine concentration rather than by lysine source, which is in line with earlier findings. Likewise, growth parameters observed in the present study (SGR and FCR) were not significantly affected by dietary lysine source (P>0·05).
The growth performance of juvenile turbot is comparable to that reported in earlier studies( Reference Regost, Arzel and Kaushik 12 , Reference Kroeckel, Harjes and Roth 39 – Reference Nagel, von Danwitz and Schlachter 41 ) with juvenile turbot of the same weight class fed with FM-based diets supplemented with maize gluten, wheat gluten, rapeseed isolate or insect-based protein sources. In a dose–response study, lower growth performance was found to be lower in juvenile turbot (initial weight 18·1 g) fed graded levels of lysine at admittedly low protein content (480–491 g/kg feed)( Reference Peres and Oliva-Teles 17 ). As with other flatfish species, turbot require a high amount of CP in their diet depending on body weight, with requirements ranging between 698 g/kg feed for 10 g fish (initial weight) and 494 g/kg feed for 90 g fish (initial weight)( Reference Regost, Arzel and Kaushik 12 , Reference Caceres-Martinez, Cadena-Roal and Mgtailler 42 , Reference Lee, Cho and Park 43 ). Likewise, it has been reported that in trout, the efficiency of lysine utilisation was affected by dietary protein content, and lysine utilisation was higher at higher protein content( Reference Rodehutscord, Borchert and Gregus 44 ). At the marginal intake of one nutrient (e.g. lysine used in the present study), other nutrients must be provided in excess to ensure that the nutrient of interest is the first-limiting nutrient. In the present study, protein content of all diets was ≥ 550 g/kg feed and, therefore, did not affect growth performance or nutrient utilisation. Since lysine was the first-limiting nutrient, the response of lysine retention and protein retention can be exclusively attributed to lysine intake. Lysine and protein deposition rates were affected by the dietary amount of lysine rather than by lysine source. The linear regression of the dose–response study resulted in a similar efficiency of the utilisation of either free lysine or protein-bound lysine. However, feeding diets containing graded levels of FM resulted in a slightly lower k Lys (0·68) than those supplemented with l-lysine HCl (0·86) and Cas (0·83). This slight reduction in utilisation efficiency recorded for FM diets could be explained by the limitation in dietary energy content as reported earlier( Reference Encarnação, de Lange and Bureau 25 , Reference Encarnação, de Lange and Rodehutscord 45 ). Therefore, the ratio of dietary energy for lysine utilisation was calculated for each tank. Digestible energy contents of the experimental diets were calculated based on earlier findings( Reference Hillestad, Åsgård and Berge 46 , Reference Bailey and Alanärä 47 ). By calculating 20·9 kJ/g energy as protein, 35·1 kJ/g energy as fat and 11·0 kJ/g energy as carbohydrate( 48 ), the resulting digestible energy content of our experimental diets was 18·90 (sd 0·20) kJ/g feed, which was, therefore, above the known requirements for digestible energy in turbot feed( Reference Bailey and Alanärä 47 ). However, real digestibility between the diets might also differ due to the different feed ingredients used, which was not evaluated in the present study. Data expressed in the present study are based on metabolic body weight with the exponent of − 0·8. With this approach, data become independent of, for example, body weight and are comparable between fish species as well as within fish species( Reference Lupatsch, Kissil and Sklan 49 ), which has been applied earlier for another flatfish species( Reference Mas-Munoz, Komen and Schneider 50 ) and for turbot( Reference Kroeckel, Dietz and Schulz 32 ).
Maintenance requirements for lysine intake were calculated and ranged between 16·7 and 23·4 mg/kg0·8 per d (Table 7). Comparable values were found for Atlantic salmon of different age groups and weight classes (16–18·5 mg/kg0·8 per d, recalculated data)( Reference Helland, Hatlen and Grisdale-Helland 20 , Reference Hauler, Carter and Edwards 51 ). Maintenance requirement data for lysine based on intake and body weight at similar feeding strategies or diet composition are not available for turbot. Lower maintenance requirement values have been found (6·5 mg/kg0·8 per d) in one earlier study with the same species and comparable body weight when provided a restricted feeding regimen and dietary lysine supply above the requirements known for this species( Reference Kroeckel, Dietz and Schulz 32 ). A restricted feeding regimen might not be the optimal strategy to determine the requirements as long as the nutrient (e.g. lysine) is not marginal.
The findings of many studies and explanations for differences in growth rates in relation to free AA inclusion are subject to controversy. Incorporation of free AA has resulted in lower growth rates in fish, including juvenile turbot, and has been explained by leaching losses( Reference Zarate and Lovell 10 , Reference Peres and Oliva-Teles 52 ) or a faster absorption of free AA compared with protein-bound AA( Reference Murai, Akiyama and Ogata 53 , Reference Zarate, Lovell and Payne 54 ). However, several authors have demonstrated an efficient use of free AA in practical and semi-purified diets( Reference Rodehutscord, Borchert and Gregus 6 , Reference Mai, Zhang and Ai 7 , Reference Zhou, Wu and Chi 15 , Reference Rodehutscord, Borchert and Gregus 44 , Reference Rodehutscord, Mandel and Pack 55 – Reference Silva, Espe and Conceição 60 ). In the present study, a maximum amount of 142 g free AA/kg feed were incorporated into the feed, corresponding to a maximum 28 % of free AA in total CP content (Basal 2·3: 140 g free AA/kg feed; Lys 3·1: 140 g free AA/kg feed; Lys 3·9: 142 g free AA/kg feed). Leaching losses are unlikely to have had a significant influence on the present results, since growth performance and protein retention increased progressively in the treatments Basal 2·3, Lys 3·1 and Lys 3·9, although having the same inclusion level of total free AA (Table 1). This is in line with earlier observations, where the incorporation of 106 g free AA/kg feed into plant protein-based diets (representing 22 % of free AA in total CP content) resulted in the same growth performance and high utilisation efficiency compared with only protein-bound AA( Reference Espe, Lemme and Petri 61 ). Incorporation of 314 g free AA/kg feed (representing 78 % of free AA in total CP content) in diets of rainbow fry has recently been shown to have no impact on feed intake or growth rate, whereas protein deposition has already been shown to be significantly decreased at a free AA content of 209 g/kg (representing 52 % of free AA in total CP content)( Reference Bodin, Delfosse and Thu 62 ). The maximum percentage of free AA in total CP content was found to be 27 % in the present study and, therefore, lower compared with what has been observed to influence feed intake, growth rate and protein retention in rainbow trout juveniles( Reference Bodin, Delfosse and Thu 62 ). Moreover, some studies have determined that leaching losses of free AA are negligible and might, therefore, not affect efficiency( Reference Cheng, Hardy and Usry 13 , Reference Espe, Lemme and Petri 14 , Reference Zhou, Shao and Xu 16 ).
The estimation of the bioavailability of single nutrients( Reference Littell, Henry and Lewis 31 ) provides a method to rank AA sources according to their utilisation. In the present study, Cas was chosen as the reference lysine source, with four increasing concentrations, and the other lysine sources where tested in relation to Cas in a slope-ratio model. The reciprocal of k Lys of FM and l-lysine HCl to Cas, therefore, represents the bioavailability of lysine from its source and must not be influenced by any other parameter than the tested AA( Reference Littell, Henry and Lewis 31 , Reference Batterham 63 ). The advantage of the linear regression is its capacity to estimate a maintenance requirement for lysine intake. The advantage of using a slope-ratio design is the estimation of the bioavailability of a lysine source in relation to another one( Reference Lemme 64 ). In rainbow trout, the bioavailability of lysine from l-lysine HCl or l-lysine sulphate has been found to be 68 %( Reference Rodehutscord, Borchert and Gregus 44 ). In relation to the reference AA source (Cas used in the present study), the bioavailability of lysine from FM and l-lysine HCl was 82·1 and 103 %, respectively (Table 7). Such high values for the availability of free lysine from l-lysine HCl have already been reported in roosters( Reference Izquierdo, Parsons and Baker 65 ) and swine( Reference Batterham, Murison and Lewis 22 ). This underlines the effectiveness of this lysine source (l-lysine HCl) in turbot nutrition.
Conclusion
The application of the linear regression and the slope-ratio model provides for the first time data for the efficiency and bioavailability of different lysine sources in turbot nutrition. The results show that the incorporation of Cas, FM or free lysine increases lysine intake under marginal conditions and results in similar growth rates and retention efficiencies. It can be concluded that the efficiency of free lysine utilisation from l-lysine HCl at marginal lysine intake is similar to that of protein-bound lysine. The inclusion of a maximum 28 % of free AA in total CP content did not affect feed intake, growth performance or protein retention.
Acknowledgements
The authors thank A. Lemme and Evonik Industries, Hanau Germany for providing the AA and helping with the analysis. The authors also thank M. Hasler (University of Kiel, Germany) for statistical advice and G. Riesen and L. Nankervis (Skretting ARC, Stavanger, Norway) for statistical advice and inspiring discussion. The authors acknowledge the technical staff at the Gesellschaft für Marine Aquakultur, Büsum, Germany for their technical support.
The present study was funded by the Ministry of Science, Economic Affairs and Transport of Land Schleswig-Holstein (‘Zukunftprogramm Wirtschaft’, 2007–13, Projekt 2) and the European Union (European Regional Development Fund). Both funders had no role in the design and analysis of the study or in the writing of this article.
The authors' contributions are as follows: S. K., C. S. and A. S. designed the research; C. D. and S. K. formulated the experimental diets as well as conducted the feeding trial; S. K. performed the chemical analyses, interpreted the results and wrote the manuscript; A. S., C. S. and C. D. contributed to the interpretation and presentation of all the experimental data. All authors contributed to the writing of the manuscript.
The authors had no conflicts of interest.


