


Introduction
Gestures play a crucial role in human communication, with applications ranging from air traffic control to sign language. In modern smart environments, hand gesture recognition (HGR) systems enable touchless interaction in virtual reality [Reference Yang, Huang, Feng, Hong-An and Guo-Zhong1–Reference Singh, Ram and Vishwakarma3], medical applications to minimize pathogen transmission [Reference Mudawi, Ansar, Alazeb, Aljuaid, AlQahtani, Algarni, Jalal and Liu4], and automotive systems to reduce driver distraction [Reference Ohn-Bar and Trivedi5, Reference Geng and Yin6].
HGR systems are broadly categorized into contact-based and non-contact-based approaches. Contact-based methods, such as data gloves [Reference Huang, Wu, Liang, Sun and Dong7–Reference Dong, Liu and Yan9] and smart bands [Reference Ramalingame, Barioul, Li, Sanseverino, Krumm, Odenwald and Kanoun10], capture user gestures but are often inconvenient to wear and can pose hygiene risks [Reference Liu and Liu11]. In contrast, non-contact methods leverage sensing modalities such as cameras, WiFi, multimodal sensors, and radar to detect gestures without physical contact [Reference Abdelnasser, Harras and Youssef12–Reference Yan, Wang, Du, Chen, Fang and Wu16].
Among non-contact methods, vision-based HGR systems rely on cameras and image processing techniques [Reference Ding and Zheng17, Reference Breland, Dayal, Jha, Yalavarthy, Pandey and Cenkeramaddi18]. However, they are susceptible to lighting conditions, weather, dust, and smoke [Reference Tang, Wu and Li19], exhibit high power consumption, and raise privacy concerns [Reference Li, Gu and Mao15]. WiFi-based HGR systems offer improved privacy but suffer from lower resolution and reduced ability to capture fine-grained motion [Reference Yan, Wang, Du, Chen, Fang and Wu16]. Conversely, millimeter-wave (mmWave) radar-based solutions provide higher resolution, improved privacy, and robustness to environmental factors [Reference Wang, Zhao and Li20, Reference Wang, Liu, Wang, Chen, Amin and Cai21].
With the advent of compact, low-power radar-on-chip mmWave sensors, such as Google Soli [Reference Lien, Gillian, Karagozler, Amihood, Schwesig, Olson, Raja and Poupyrev22] and Infineon’s XENSIV™ BGT60LTR13C  $60\,$GHz Frequency-Modulated Continuous Wave (FMCW) radar [23], radar-based gesture recognition has gained increasing attention [Reference Yan, Wang, Du, Chen, Fang and Wu16, Reference Jin, Ma, Zhang, Lian and Wang24]. Deep learning approaches, particularly convolutional neural network (CNN) and recurrent neural network architectures [Reference Strobel, Schoenfeldt and Daugalas25], have been widely used for HGR due to their ability to automatically learn spatial and temporal features. Multi-channel CNNs have demonstrated robust performance for mmWave-based HGR [Reference Xia, Luomei, Zhou and Xu26], and hybrid CNN-long short-term memory (LSTM) architectures have been successful in traffic gesture recognition and multimodal fusion [Reference Liu and Liu11, Reference Yan, Wang, Du, Chen, Fang and Wu16, Reference Hazra and Santra27–Reference Sluÿters, Lambot, Vanderdonckt and Vatavu29].
However, despite their accuracy, deep learning models lack interpretability.
The recently introduced European Union’s Artificial Intelligence Act (EU AI Act)Footnote 1 mandates that AI systems be transparent, interpretable, and user-centered, particularly for high-risk applications. It classifies AI systems based on their risk level and enforces strict compliance measures, including penalties for non-compliance. These regulatory requirements underscore the necessity of explainable and interpretable HGR systems. A first step toward explainable HGR was introduced in [Reference Seifi, Sukianto, Strobel, Carbonelli, Servadei and Wille30], where the feature attribution method Shapley Additive Explanations [Reference Shapley31] was used to highlight feature importance, providing insights into how input features influence model predictions. Nevertheless, these models do not offer transparency in intermediate reasoning steps, which is crucial for user trust, especially in safety-critical domains.
To address this, we proposed MIRA (multi-class rule-based algorithm) in our earlier work, which was presented at the EUMW2024 conference and published in its proceedings [Reference Seifi, Sukianto, Carbonelli, Servadei and Wille32]. MIRA is a fully transparent, interpretable, rule-based HGR system. It constructs human-readable “if-then” rules, ensuring decision-making transparency while achieving high accuracy and adaptability to user-specific behavior.
In this work, we extend MIRA with the following advancements:
(i) Gesture Onset Detection: Instead of assuming predefined gesture frames, we extend MIRA using a signal-processing-based onset detection method that identifies the start of a gesture, bringing us closer to real-time applications.
(ii) Background Class Inclusion: Gesture onset detection enables the introduction of a Background class alongside the five existing gestures (SwipeRight, SwipeLeft, SwipeUp, SwipeDown, and Push), allowing the system to differentiate between gesture and non-gesture frames more effectively.
(iii) Expanded Open-Source Dataset and Experiments: MIRA is evaluated on a larger dataset with additional
 $4,000$ recordings and based on four users [Reference Seifi, Sukianto and Carbonelli33], improving robustness. This leads to a total of 12 users and 31,000 gestures.
(iv) Feature Diversity and Rule Generalization Analysis: The impact of feature diversity on generalization in MIRA by combining dataset-level interquartile range (IQR) analysis with a recursive feature ablation study.

To the best of our knowledge, this is the first HGR system that detects gesture onset within a gesture recording and subsequently classifies the gesture in a fully transparent and interpretable way, enabling fine-grained and interpretable gesture recognition.
The remainder of this paper is structured as follows. The next section describes radar system design, signal preprocessing, and feature extraction. This is followed by an explanation of the methodology for interpretable gesture onset detection and classification using MIRA. The subsequent section outlines the experimental setup, followed by an analysis and discussion of the results.
Radar system design and signal processing
This section presents the radar system’s design and signal processing pipeline for HGR. It first describes the hardware configuration of the FMCW radar. The next section details the signal preprocessing steps, which include range profile generation, target identification, Doppler profile extraction, and angle estimation. The feature extraction pipeline is then introduced, detailing the computation of key features such as radial distance, velocity, azimuth, elevation, and signal magnitude to effectively represent gestures. Additionally, the frame-based gesture labeling approach is discussed, ensuring precise gesture annotation by distinguishing active gesture frames from background noise.
Radar system design and configuration
As illustrated in Fig. 1 panel A, the radar system utilized in this work is the XENSIV™ BGT60TR13C  $60\,$GHz FMCW radar chipset developed by Infineon Technologies [23]. Operating within a frequency range of
  $58.5\,$GHz to
  $62.5\,$GHz, the radar achieves a range resolution of
  $37.5\,$mm and a maximum resolvable range of
  $1.2\,$m. Its velocity resolution is approximately
  $0.26\,$m/s, with a maximum measurable velocity of
  $4.17\,$m/s. The radar operates in a burst configuration, where each burst comprises
  $32$ chirps transmitted with a pulse repetition time of
  $300\,\mu$s, yielding a frame rate of
  $33\,$Hz. The transmitted chirps are linear frequency-modulated signals, generated by a phase-locked loop and voltage-controlled oscillator system. These chirps are emitted with a transmit power of approximately
  $5\,$dBm. Upon encountering a target, the back-scattered signal is received by the radar’s three receiving antennas, which are arranged in an L-shaped configuration to facilitate angle estimation for both azimuth and elevation.
Radar signal preprocessing. a) Using Infineon’s XENSIV™ BGT60TR13C  $60\,$GHz radar, the raw gesture data are collected in the format
  $[\text{frames} \times \text{receive channels} \times \text{chirps} \times \text{samples}]$ (depicted only for one frame). b) The range profile is generated, where a local peak search is performed to find the range bin of the hand (marked in blue). c) In total, five features are extracted, bringing the data into the format
 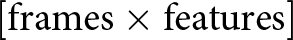 $[\text{frames} \times \text{features}]$ (depicted only for one frame). d) Frame-based labeling is performed, where the area around
  $F_{\text{gesture}}$, i.e., the bin with the closest distance to the radar, is labeled as the gesture. All remaining frames are labeled as Background.

On the receiver side, the captured signal undergoes a series of processing steps. It is amplified with a low-noise amplifier providing  $12\,$dB gain and then mixed with the transmitted signal to extract an intermediate frequency signal. High-pass filtering (cutoff:
  $100\,$kHz) and anti-aliasing filtering (cutoff:
  $600\,$kHz) are applied to refine the signal, resulting in a bandwidth-efficient intermediate frequency signal suitable for digitization. The signal is then sampled by an analog-to-digital converter at
  $2\,$MHz with
  $12\,$bit resolution.
The radar data is structured as a 4D array denoted by  $[F \times R \times C \times S]$, where
  $F$ represents the number of frames,
  $R$ the three receive channels,
  $C$ the slow time axis, and
  $S$ the fast time axis, corresponding to the time within a single chirp. The fast time axis captures range information through rapid frequency modulation, while the slow time axis, representing intervals between consecutive chirps, is used to extract Doppler information for velocity estimation. This configuration enables the system to simultaneously estimate the range, velocity, and angular information of targets.
Radar signal preprocessing and feature extraction
The radar preprocessing pipeline is based on [Reference Strobel, Schoenfeldt and Daugalas25] and is designed to isolate gesture-related reflections while mitigating the impact of static objects and background noise, ensuring clarity in gesture signals and minimizing computational requirements. It has been used in multiple research papers and is hence also applied in this work [Reference Seifi, Sukianto, Strobel, Carbonelli, Servadei and Wille30, Reference Seifi, Sukianto, Carbonelli, Servadei and Wille32, Reference Sukianto, Wagner, Seifi, Strobel and Carbonelli34].
Range profile generation
To generate the range profile, the radar data undergoes a series of preprocessing steps. The raw time-domain radar data is structured as a 4D array 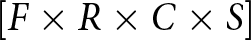 $ [F \times R \times C \times S] $, where
  $ F $ represents the number of frames,
  $ R $ the three receive channels,
  $ C $ the slow time axis, and
  $ S $ the fast time axis. The exact dimensions are
  $[100, 3, 32, 64]$.
The raw time-domain radar data undergoes an initial preprocessing step to address transmitter-receiver antenna leakage and eliminate static reflections. For this, the mean along the fast-time axis is subtracted:
 \begin{equation}
x_{\text{corr}}(f, r, c, s) = x(f, r, c, s) - \frac{1}{S} \sum_{s=0}^{S-1} x(f, r, c, s)
\end{equation}
\begin{equation}
x_{\text{corr}}(f, r, c, s) = x(f, r, c, s) - \frac{1}{S} \sum_{s=0}^{S-1} x(f, r, c, s)
\end{equation} where  $ x(f, r, c, s) $ is the received radar signal and
  $ S $ is the number of fast time samples.
A range fast Fourier transform (FFT) is applied along the chirps of the radar signal, converting the raw time-domain data into the frequency domain  $ X_r(f, r, c, k) $:
 \begin{equation}
X_r(f, r, c, k) = \sum_{s=0}^{S-1} x_{\text{corr}} e^{-j 2\pi ks/S}
\end{equation}
\begin{equation}
X_r(f, r, c, k) = \sum_{s=0}^{S-1} x_{\text{corr}} e^{-j 2\pi ks/S}
\end{equation} where  $ k $ is the frequency index. Following this, the symmetric part of the spectrum is discarded, resulting in complex range profiles that represent the signal’s intensity across the resolvable range.
As a next step, a moving target indication is applied [Reference Ash, Ritchie and Chetty35]. Static reflections from objects in the radar environment are suppressed by subtracting the mean along the slow-time axis, leaving only dynamic targets such as the moving hand:
 \begin{equation}
X_r^{\text{mti}}(f, r, c, k) = X_r(f, r, c, k) - \frac{1}{C} \sum_{c=0}^{C-1} X_r(f, r, c, k)
\end{equation}
\begin{equation}
X_r^{\text{mti}}(f, r, c, k) = X_r(f, r, c, k) - \frac{1}{C} \sum_{c=0}^{C-1} X_r(f, r, c, k)
\end{equation} where  $ X_r^{\text{mti}}(\cdot) $ is the mean-subtracted frequency-domain signal.
To enhance the signal-to-noise ratio, the magnitude of the complex range profile is computed and integrated across both the receive channels and chirps. This process yields a one-dimensional vector that effectively represents the distribution of reflected energy along the range axis, isolating dynamic elements such as the moving hand performing the gesture:
 \begin{equation}
X_{\text{final}}(f, k) = \sum_{r=0}^{R-1} \sum_{c=0}^{C-1} |X_r^{\text{mti}}(f, r, c, k)|.
\end{equation}
\begin{equation}
X_{\text{final}}(f, k) = \sum_{r=0}^{R-1} \sum_{c=0}^{C-1} |X_r^{\text{mti}}(f, r, c, k)|.
\end{equation}Target identification
A local peak search is performed on the range profile to identify the range bin of the closest moving target, corresponding to the hand performing the gesture. To improve reliability, Gaussian smoothing and thresholding are applied to suppress noise and insignificant local maxima. If no local maxima satisfy the threshold, the global maximum is selected as the closest target. This step retrieves the radial distance of the object. Figure 1 panel B illustrates this process.
Doppler profile and signal magnitude extraction
Once the range bin corresponding to the hand is identified, a Doppler FFT is applied only on the hand’s range bin across all receive channels:
 \begin{equation}
X_{\text{doppler}}(f, r, v) = \sum_{c=0}^{C-1} X_r^{\text{mti}}(f, r, c, k_{\text{hand}}) e^{-j 2\pi vc/C}
\end{equation}
\begin{equation}
X_{\text{doppler}}(f, r, v) = \sum_{c=0}^{C-1} X_r^{\text{mti}}(f, r, c, k_{\text{hand}}) e^{-j 2\pi vc/C}
\end{equation} where  $ X_{\text{doppler}}(\cdot) $ is the Doppler-transformed radar signal,
  $ v $ is the Doppler frequency index, and
  $k_{\text{hand}} $ is the detected hand range bin.
The absolute values of the mean along the antenna’s dimensions provide information about the hand’s radial velocity. The peak value of this Doppler profile is extracted as the signal magnitude, representing the strength of the gesture reflection.
Angle estimation
To determine the spatial orientation of the hand relative to the radar, the horizontal and vertical angles are estimated using the phase-comparison monopulse technique [Reference Sherman and Barton36]. By analyzing phase differences between the radar’s receive antennas, the azimuth and elevation angles of the hand are calculated for the Doppler bin corresponding to the detected hand.
The azimuth and elevation angles  $\theta$ and
  $\phi$ are defined as follows:
 \begin{equation}
\theta = \sin^{-1} \left(\frac{\lambda}{2\pi d} \arg\left(\frac{X_{\text{doppler}}(f, r_2, v)}{X_{\text{doppler}}(f, r_1, v)}\right)\right)
\end{equation}
\begin{equation}
\theta = \sin^{-1} \left(\frac{\lambda}{2\pi d} \arg\left(\frac{X_{\text{doppler}}(f, r_2, v)}{X_{\text{doppler}}(f, r_1, v)}\right)\right)
\end{equation} \begin{equation}
\phi = \sin^{-1} \left(\frac{\lambda}{2\pi h} \arg\left(\frac{X_{\text{doppler}}(f, r_3, v)}{X_{\text{doppler}}(f, r_1, v)}\right)\right),
\end{equation}
\begin{equation}
\phi = \sin^{-1} \left(\frac{\lambda}{2\pi h} \arg\left(\frac{X_{\text{doppler}}(f, r_3, v)}{X_{\text{doppler}}(f, r_1, v)}\right)\right),
\end{equation} where  $\lambda$ is the wavelength of the radar signal,
  $d$ is the distance between the two horizontally spaced receive antennas used for azimuth angle estimation, and
  $h$ is the distance between the two vertically spaced receive antennas used for elevation angle estimation.
Feature extraction summary
The preprocessing pipeline extracts the following features for gesture classification (Fig. 1 panel C):
• Radial Distance (Range): Representing the distance between the radar and the hand as the closest moving target.
• Radial Velocity (Doppler): Derived from the Doppler shift and indicating the hand’s motion toward or away from the radar.
• Horizontal Angle (Azimuth): The azimuth angle of the hand, determined using phase-comparison monopulse.
• Vertical Angle (Elevation): The elevation angle of the hand is also determined using phase-comparison monopulse.
• Signal Magnitude (Peak): Represents the strength of the reflected signal from the moving hand.
Frame-based gesture labeling for training
A common characteristic of the gestures is that, during execution, the hand reaches its closest distance to the radar at some point. Leveraging this property, the labeling framework introduced in [Reference Strobel, Schoenfeldt and Daugalas25] and applied in this work, designates the frame with the minimum radial distance to the radar as the gesture anchor point, denoted as  $F_{\text{gesture}}$ (Fig. 1 panel D). This frame serves as a reference to determine the surrounding window where the gesture occurs.
Once  $F_{\text{gesture}}$ is identified, a fixed-length labeling approach is applied:
• The six frames preceding and the three frames following
$F_{\text{gesture}}$ are labeled as the gesture.• All other frames are classified as background.

This ensures that only the precise duration of the gesture is labeled. To improve labeling robustness and reduce false detections, particularly at sequence boundaries where noise is prevalent, a signal amplitude threshold is applied before identifying the minimum radial distance. This threshold eliminates frames with insufficient signal strength, ensuring that the search for  $F_{\text{gesture}}$ is conducted only on frames containing meaningful signal information.
Once a frame surpasses this threshold, the frame with the minimal radial distance is selected as the gesture anchor. This frame generally corresponds to the midpoint of swipe gestures or the approximate endpoint of push gestures, reflecting the distinct kinematic profiles of these movements.
Following the method proposed in [Reference Strobel, Schoenfeldt and Daugalas25], a fixed-length label ( $L_{\text{gesture}}$), set to ten frames (matching the average gesture duration), is applied. All frames within this window are assigned to the gesture class, while all other frames remain in the background class.
This refined labeling process results in a dataset with dimensions  $[M \times F \times D]$, where:
•
$M$ is the number of gesture recordings,•
$F$ is the number of frames per recording, and•
$D$ is the number of extracted features.


It is important to note that this labeling step is solely for annotating recordings used in the training phase. This process is performed on preprocessed data and requires the entire recording to ensure accurate labeling.
Interpretable gesture onset detection and classification
Gesture recognition consists of two key tasks: (1) gesture onset detection, determining when a gesture occurs, and (2) gesture classification, identifying the performed gesture. While deep learning models have demonstrated strong performance in both areas [Reference Strobel, Schoenfeldt and Daugalas25], they often lack interpretability. To address this, we extend MIRA, a rule-based system (RBS), by incorporating an interpretable approach for gesture onset detection.
The first section provides an overview of MIRA and explains the concept of foundational and personalized rules. The proposed onset detection method is detailed in the second section. To evaluate its effectiveness, the third section introduces the dynamic gesture accuracy metric, which accounts for natural variations in human motion and sensor measurements.
Unlike our prior work [Reference Seifi, Sukianto, Carbonelli, Servadei and Wille32], which assumed gesture-aligned data and pre-segmented frames, this paper introduces a real-time gesture onset detection pipeline, a new background class, expanded evaluation across 12 users, and a dynamic evaluation metric. This establishes a framework for fine-grained and interpretable gesture recognition, improving both transparency and practical applicability.
Overview of MIRA: rule-based gesture classification
MIRA is a RBS designed for interpretable gesture classification based on radar signals. It employs a sequential covering rule induction method to iteratively construct a set of classification rules. Each rule consists of:
• A condition (if-statement) defining a feature-based threshold.
• A decision (then-statement) assigning a gesture label.
The algorithm selects rules based on their accuracy and generalizability, halting when either the predefined maximum number of rules is reached or an early stopping criterion is triggered, such as ensuring a rule covers at least a minimum number of samples in the training or validation dataset.
Weighted Silhouette for gesture identification
To identify the most compact gesture class for rule development, MIRA computes the Silhouette score (SC):
 \begin{equation}
SC_j = \frac{1}{N}\sum_{i=1}^{N}\frac{\text{b}(\textbf{x}_i)-\text{a}(\textbf{x}_i)}{\max\{\text{a}(\textbf{x}_i), \text{b}(\textbf{x}_i)\}}
\end{equation}
\begin{equation}
SC_j = \frac{1}{N}\sum_{i=1}^{N}\frac{\text{b}(\textbf{x}_i)-\text{a}(\textbf{x}_i)}{\max\{\text{a}(\textbf{x}_i), \text{b}(\textbf{x}_i)\}}
\end{equation} where  $ \text{a}(\textbf{x}_i) $ is the average intra-cluster distance, and
  $ \text{b}(\textbf{x}_i) $ is the average inter-cluster distance.
A weighted SC is introduced to prevent bias toward small clusters:
 \begin{equation}
SC_{\text{weighted}, j} = \lambda_1 \sqrt{\lambda_2 \frac{n_j}{N_{\text{left}}}} + \lambda_3 \cdot SC_j
\end{equation}
\begin{equation}
SC_{\text{weighted}, j} = \lambda_1 \sqrt{\lambda_2 \frac{n_j}{N_{\text{left}}}} + \lambda_3 \cdot SC_j
\end{equation} with  $\lambda_1 \in [0,1]$ weighting the overall transformed impact based on the cluster size and
  $\lambda_2 \in [0,\infty)$ directly weighting
  $n_j$, the number of samples in the current cluster
  $j$ relative to all not yet classified samples
  $N_{\text{left}}$ remaining in the training dataset.
  $\lambda_3 \in [0,1]$ adjusts the weight of
  $SC_j$.
Rule evaluation using the f-beta score
Rules are optimized using the F-Beta score, balancing precision and recall:
 \begin{equation}
\text{F-Beta} = (\beta^2 + 1)\frac{\text{Precision} \cdot \text{Recall}}{\beta^2\text{Precision} + \text{Recall}}
\end{equation}
\begin{equation}
\text{F-Beta} = (\beta^2 + 1)\frac{\text{Precision} \cdot \text{Recall}}{\beta^2\text{Precision} + \text{Recall}}
\end{equation} A low value of  $ \beta $ (set to 0.3) prioritizes precision over recall, minimizing false positives.
Foundational and personalized rules
Traditional RBS methods struggle to generalize across users due to variations in gesture execution [Reference Seifi, Sukianto, Carbonelli, Servadei and Wille32]. Existing rule-based approaches rely on a single, static set of rules, which fail to account for differences in user behavior, anatomical variations, and execution styles. To address these challenges, we introduced a novel framework that differentiates between foundational and personalized rules, enabling both generalizability and user adaptability.
Foundational Rules. We define foundational rules as a universal rule set that captures general gesture patterns applicable to a broad range of users. These rules are derived using the sequential covering algorithm on a diverse training dataset, ensuring they reflect a wide range of execution styles. Foundational rules serve as the baseline decision logic, establishing a robust initial model while preventing overfitting through early-stopping and validation-based constraints.
Personalized Rules. While foundational rules provide a strong starting point, they do not fully capture individual execution nuances. To enhance adaptability, we propose personalized rules, which refine the system based on user-specific calibration gestures. A user performs a limited number of gestures, and those not covered by the foundational rules are iteratively processed using our RBS algorithm. The newly generated personalized rules are then appended to the foundational rule set and take precedence when applicable, allowing the model to dynamically adapt to the user.
By introducing the distinction between foundational and personalized rules, we create a system that is both generalizable and adaptive, improving recognition accuracy while maintaining full interpretability. An illustrative example is given in Table 1.
Illustrative example of foundational and personalized rules. The default-else rule (crossed-out rule) is replaced with personalized rules

Extending MIRA with interpretable gesture onset detection
Previously, MIRA operated under the assumption that gesture-containing frames were predefined, meaning that background frames were excluded from consideration. This limitation restricted its applicability in real-world scenarios, where gestures naturally occur within continuous motion streams. To address this, we introduce a robust gesture onset detection method that enables MIRA to autonomously identify the precise moment a gesture begins before performing classification.
Once the gesture onset is detected, a 10-frame window following the onset is set as the gesture segment. These frames serve as input to MIRA, where its rule-based framework classifies the gesture based on extracted feature patterns. This enhancement ensures that MIRA remains interpretable while seamlessly integrating onset detection, significantly improving its usability in real-world applications.
To enhance interpretability, we extend MIRA with a structured, rule-based onset detection mechanism that:
• Detects the start of a gesture using the frame energy.
• Seamlessly integrates with MIRA’s classification pipeline for a unified, interpretable framework.
• Improves temporal localization while preserving MIRA’s transparency and rule-based decision-making.
Our choice of an energy-based gesture onset detection method is intentional and stems from the need to preserve interpretability and rule-based transparency in MIRA. Benchmarking against more complex probabilistic (e.g., hidden Markov models [Reference Eddy37]) or deep learning (e.g., LSTM [Reference Hochreiter and Schmidhuber38]) approaches would be inconsistent with our system’s goals, which are to provide transparent and deployable gesture recognition in safety-critical contexts. These alternatives, while powerful, introduce hidden states or nonlinear decision boundaries that limit inspectability and explainability. We thus demonstrate that a simple, explainable onset method, when combined with MIRA’s interpretable rule system, achieves strong performance while upholding full transparency.
The following section details the design and integration of our interpretable gesture onset detection method into MIRA.
Proposed method for gesture onset detection
For gesture onset detection, range-Doppler image (RDI) maps are utilized to accurately identify the beginning of a gesture. This approach is preferred over using high-level features, because it enables real-time inference without requiring access to the full gesture sequence. By analyzing each frame independently, the system can detect the onset of a gesture as soon as it occurs, ensuring low latency and adaptive detection in dynamic environments. This eliminates the need to accumulate multiple frames before flagging a gesture onset, significantly improving responsiveness.
The preprocessing pipeline for generating RDIs follows the same steps as outlined in Section Radar System Design and Signal Processing, up to the application of the Range FFT in Equation 2 and stationary clutter suppression using moving target indication in Equation 3. However, unlike the previously described feature extraction, where only the hand range bin is considered, RDI generation retains the full range dimension.
This results in the RDI:
 \begin{equation}
X_{\text{rdi}}(f, r, v, k) = \sum_{c=0}^{C-1} X_r^\text{{mti}}(f, r, c, k) e^{-j 2\pi vc/C}
\end{equation}
\begin{equation}
X_{\text{rdi}}(f, r, v, k) = \sum_{c=0}^{C-1} X_r^\text{{mti}}(f, r, c, k) e^{-j 2\pi vc/C}
\end{equation}Using the now computed RDI, the absolute value of the complex RDI is then computed:
 \begin{equation}
|X_{\text{rdi}}(\cdot)| = \sqrt{\operatorname{Re}(X_{\text{rdi}}(\cdot))^2 + \operatorname{Im}(X_{\text{rdi}}(\cdot))^2}
\end{equation}
\begin{equation}
|X_{\text{rdi}}(\cdot)| = \sqrt{\operatorname{Re}(X_{\text{rdi}}(\cdot))^2 + \operatorname{Im}(X_{\text{rdi}}(\cdot))^2}
\end{equation}The frame energy is then obtained by summing the squared magnitudes across all range, Doppler, and channel dimensions:
 \begin{equation}
E_f = \sum_{r,v,k} |X_{\text{rdi}}(f, r, v, k)|^2
\end{equation}
\begin{equation}
E_f = \sum_{r,v,k} |X_{\text{rdi}}(f, r, v, k)|^2
\end{equation} where  $ E_f $ denotes the total energy for a given frame.
To ensure consistency, the frame energy is standardized using the StandardScaler:
 \begin{equation}
E_{\text{norm}} = \frac{E_f - \mu}{\sigma}
\end{equation}
\begin{equation}
E_{\text{norm}} = \frac{E_f - \mu}{\sigma}
\end{equation} where  $ E_{\text{norm}} $ is the normalized frame energy,
  $ \mu $ represents the mean frame energy, and
  $ \sigma $ is the standard deviation of the frame energy.
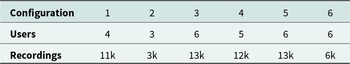
To remove low-energy peaks, we apply the Savitzky–Golay filtering method [Reference Savitzky and Golay39] and thresholding to retrieve  $E_{\text{smoothed}}$.
 \begin{equation}
E_{\text{smoothed}}(f) = \sum_{j=-w}^{w} w_j^{(p)} E_{\text{norm}}(f+j)
\end{equation}
\begin{equation}
E_{\text{smoothed}}(f) = \sum_{j=-w}^{w} w_j^{(p)} E_{\text{norm}}(f+j)
\end{equation} where  $ E_{\text{smoothed}}(f) $ represents the filtered energy of frame
  $ f $,
  $ w $ is the filter window size,
  $p$ is the polynomial order used for fitting the filter, and
  $ w_j^{(p)} $ is the Savitzky–Golay filter coefficient at position
  $j$.
$j$.
A peak is only considered valid if it exceeds a predefined threshold  $ E_{\text{thresh}} $, ensuring that minor fluctuations and noise do not trigger false detections.
The onset of the gesture is then identified by detecting the first local maximum, computed as the difference between adjacent frames:
 \begin{equation}
\Delta E(f) = E_{\text{smoothed}}(f) - E_{\text{smoothed}}(f-1)
\end{equation}
\begin{equation}
\Delta E(f) = E_{\text{smoothed}}(f) - E_{\text{smoothed}}(f-1)
\end{equation} where  $ \Delta E(f) $ represents the energy difference between consecutive frames. A peak is identified when the difference transitions from positive to negative, marking the start of the gesture.
In summary, the proposed gesture onset detection method leverages RDI analysis combined with an energy-based approach to achieve robust and real-time detection. The system distinguishes meaningful gestures from background noise and minor movements by applying Savitzky–Golay filtering and thresholding. This ensures that only significant motion triggers a gesture onset event, making the detection both efficient and reliable in dynamic environments.
Dynamic gesture accuracy
To assess the effectiveness of this technique, we employ the dynamic accuracy metric [Reference Seifi, Sukianto, Carbonelli, Servadei and Wille40, Reference Shaaban, Strobel, Furtner, Weigel and Lurz41], which evaluates gesture onset detection robustness by allowing slight variations without penalizing model performance significantly, as illustrated in Fig. 2. Given the natural variability in human motion and sensor measurements, we argue that a minor offset of up to 3-4 frames in predicting the gesture onset has negligible real-world implications, as such deviations do not meaningfully affect system performance or user experience. For each gesture sequence, dynamic gesture accuracy is determined solely by the correct identification of the gesture onset. The metric incorporates a tolerance window to account for natural variations in detecting the start of a gesture. A prediction is considered correct if the detected gesture onset falls within an acceptable range of the actual onset, ensuring robustness while maintaining practical applicability.
Visualization of the dynamic gesture accuracy metric for gesture classification. The blue box represents the true gesture, the green box denotes the tolerance window, and the red box indicates the predicted gesture. A correctly classified gesture falls within the tolerance window and satisfies the duration requirement, whereas a misclassified gesture does not. This metric accommodates slight offsets, providing a more practical evaluation of model performance.

The dynamic gesture accuracy is computed as:
 \begin{equation}
\text{dg\_acc}_m = \mathbb{I} \Big( s_m - 4 \leq \hat{s}_m \leq s_m + 4 \Big)
\end{equation}
\begin{equation}
\text{dg\_acc}_m = \mathbb{I} \Big( s_m - 4 \leq \hat{s}_m \leq s_m + 4 \Big)
\end{equation} where  $\mathbb{I(\cdot)}$ is the indicator function that returns 1 if the condition is met and 0 otherwise,
  $s_m$ is the ground truth gesture start frame, and
  $\hat{s}_m$ is the predicted gesture start frame.
The evaluation process consists of identifying the first local maximum as the gesture start. The classification is then compared with ground truth data, and detection is considered correct if the predicted gesture onset occurs within  $\pm 4$ frames of the ground truth.
This approach ensures that minor variations in gesture detection do not negatively impact practical model performance, thereby increasing robustness in real-world applications. For the remainder of this work, the dynamic gesture accuracy is referred to as accuracy.
Experimental setup
This section outlines the experimental setup used to evaluate both gesture onset detection and MIRA’s rule-based classification. Section gesture dataset acquisition describes the dataset acquisition process, detailing the radar system, gesture classes, and environmental settings. The data collection process accounts for user variability and different execution styles to create a robust dataset.
The second section explains the training and testing protocols, including parameter configurations for gesture onset detection and MIRA’s classification model.
To analyze how feature diversity influences generalization in RBSs like MIRA, we define various training dataset configurations with varying numbers of users and recordings in the last section. These configurations are constructed to systematically explore how differences in feature distribution affect the ability of MIRA’s foundational and personalized rules to generalize and adapt, particularly under the risk of early-stage misclassification.
By extending the dataset and optimizing onset detection, this section provides a foundation for evaluating the effectiveness of MIRA in real-world scenarios while ensuring interpretability and adaptability to diverse user behaviors.
Gesture dataset acquisition
The gesture data acquisition for this work was conducted using the  $60\,$GHz FMCW radar system described in section radar system design and configuration. The dataset was collected by asking twelve participants to perform five distinct gestures (SwipeLeft, SwipeRight, SwipeUp, SwipeDown, and Push) in six different indoor settings: a gym, library, kitchen, bedroom, shared office room, and meeting room. Additionally, a Background class was included to represent the absence of gestures. Gestures were performed within a field of view of
  $\pm 45^{\circ}$ and at a distance of one meter or less from the radar.
Each gesture recording spanned approximately  $3\,$s, equivalent to
  $100$ frames, with individual gestures lasting an average of
  $0.3\,$s or
  $10$ frames. Participants were instructed to fully extend their arms during gesture execution. To ensure a diverse dataset, the participant group included users with arm lengths ranging from
  $62\,$cm to
  $73\,$cm, and a mix of genders, with three participants being female (
 $\{\text{user}_i \mid i = 2, 3, 10\}$). Building upon a prior dataset, an additional four users were included in this work, each performing
  $1,000$ gestures, with
  $200$ gestures per class, bringing the total dataset to
  $31,000$ gestures.
The gesture data was stored as a four-dimensional NumPy array [Reference Harris, Millman, Van Der Walt, Gommers, Virtanen, Cournapeau, Wieser, Taylor, Berg and Smith42] with dimensions  $[100 \times 3 \times 32 \times 64]$. Here,
  $100$ represents the frame length of each gesture, while the other dimensions correspond to the three receive channels, the number of chirps, and the number of samples, respectively. Preprocessing details for the radar data are discussed in section radar signal preprocessing and feature extraction. The dataset is publicly accessible via IEEE Dataport [Reference Seifi, Sukianto and Carbonelli33].
Train and test protocols
This subsection details the parameter settings for both gesture onset detection and MIRA’s rule-based classification. The onset detection method was configured to ensure robust identification of gesture initiation, while MIRA retained its original hyperparameters for rule induction and classification.
Gesture onset detection parameters
The gesture onset detection method was configured as follows:
• Savitzky–Golay Filtering:
• Window size
$w$: 8• Polynomial order
$p$: 3• Mode: Interpolation
• Threshold
$E_{\text{tresh}}$: 1


This configuration ensures that gesture onset detection is seamlessly integrated with MIRA, making it adaptable to real-world continuous motion while maintaining rule-based interpretability.
MIRA classification parameters
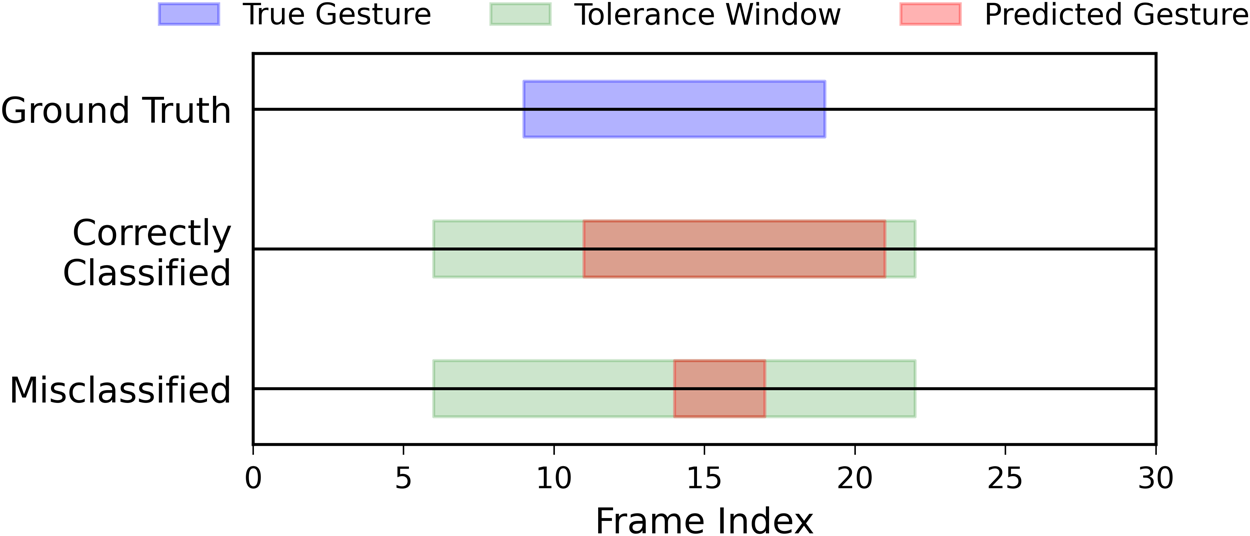
MIRA was configured using the same hyperparameters as in the prior work and is shown in Table 2.
MIRA classification parameters

Training dataset configurations
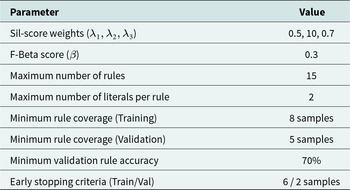
To investigate the role of feature diversity in rule-based generalization, we evaluated six training configurations, each composed of different combinations of users and recording counts. The configurations are intentionally designed to explore a range of diversity levels in the training data, measured using both the IQR and overall feature range.
• IQR: Represents the spread of the middle 50% of feature values (Q3–Q1). A higher IQR indicates greater variability in core data values, reducing the risk of overfitting.
• Overall range: The difference between the maximum and minimum values in the dataset. While a larger range suggests broad feature coverage, it may also indicate the presence of extreme outliers.
These metrics were selected to quantify dataset diversity and relate it to the generalization performance of MIRA, particularly in avoiding foundational rule failures.
Each configuration offers a different level of user diversity and gesture variation and is detailed in Table 3. This setup allows us to evaluate whether higher IQR values, even in smaller datasets, can lead to improved rule generalization and personalization performance. This is explored in detail in section feature diversity and generalization in MIRA.
Configuration of experimental settings

Results and discussion
This section presents the results and analysis of gesture onset detection and rule-based classification using MIRA. First, the effectiveness of the proposed signal processing techniques for gesture onset detection is evaluated.
Then, the role of feature diversity in supporting generalization in RBSs is investigated. We analyze multiple training configurations to understand how differences in feature variability affect the accuracy of MIRA’s foundational and personalized rule layers. A recursive feature ablation study further identifies which features are most critical for generalization.
The third section assesses the impact of dataset quality on user calibration efficiency. The minimum number of calibration samples required for optimal personalization is analyzed, comparing a well-distributed training configuration with a less diverse one.
Gesture onset detection using signal processing techniques
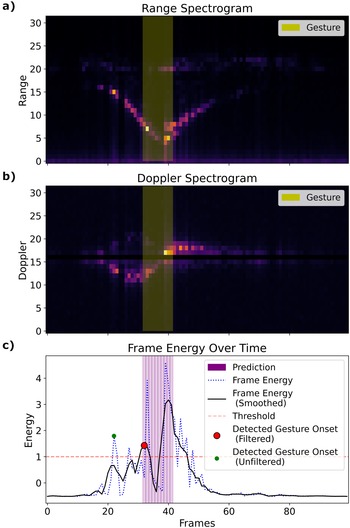
In Fig. 3, we present a comprehensive multi-modal analysis of our radar-based gesture detection method. Panels A and B display the range and Doppler spectrograms, respectively, with a yellow overlay highlighting the ten-frame interval during which the gesture is performed.
Gesture onset detection. (a) Range spectrogram and (b) Doppler spectrogram of a recording with a duration of 100 frames. The yellow overlay indicates the gesture duration. (c) Frame energy over time showing the energy (blue dotted line) and filtered (smoothed) energy (black solid line). The red marker denotes the detected gesture onset using the filtered signal, while peaks below the red-dashed threshold line are not considered. The green marker denotes a suboptimal onset detected in the unfiltered signal. The purple-shaded region represents the ten-frame interval predicted as a gesture based on the detected onset.

The bottom panel C illustrates the frame energy profile over time, comparing the unfiltered normalized energy  $E_{\text{norm}}$ (blue dotted line) with its smoothed counterpart
 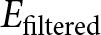 $E_{\text{filtered}}$ (black solid line). For the smoothed frame energy, all peaks with energy values below the specified threshold (red dashed line) are not considered. The first peak of the filtered energy signal (red marker) determines the predicted gesture start. From this point onward, a ten-frame interval is predicted as a gesture and used as input to MIRA to be classified.
In this example, the predicted onset correctly aligns with the actual gesture onset, as the purple-shaded window coincides with the yellow gesture window. In contrast, the unfiltered energy signal has its first peak before the actual gesture window, shown by a green marker. This comparison substantiates that the smoothing process enhances the clarity and reliability of gesture onset detection.
In our experiments, we evaluated the accuracy of gesture onset detection using both filtered (smoothed) and unfiltered frame energy signals across twelve different users. As shown in Table 4, the filtered approach achieved a significantly higher average dynamic gesture accuracy (90.13%) compared to the unfiltered method (59.94%). This result underscores the importance of applying signal processing techniques to enhance the clarity and reliability of onset detection, which is a crucial step toward interpretable HGR.
Dynamic gesture onset detection accuracy for filtered and unfiltered frame energy signals across twelve users

User-specific variations are evident from the table. For instance, while user $_{6}$ achieved near-perfect detection accuracy (99.90%) with the filtered signal, some users, such as user
 $_{3}$, recorded notably lower accuracy (81.50%) even after filtering.
Moreover, the unfiltered energy consistently underperformed, with accuracy values as low as 28.00% for user $_{3}$, highlighting the challenges of detecting gesture onset using the unfiltered and -smoothened energy signals alone. These discrepancies may arise due to inconsistent gesture execution, where variations in speed, amplitude, or force introduce irregular signal patterns. Additionally, differences in hand size and motion trajectory can affect radar reflections, leading to noisier signals for certain users. Background motion noise, such as subtle arm or torso movements, may further interfere with onset detection, especially in cases where users exhibit involuntary motion. Furthermore, the fixed thresholding approach may not generalize well across all users, particularly those with weaker energy signals, leading to less reliable onset detection in some cases.
Overall, these results substantiate the effectiveness of the filtering step in our gesture recognition pipeline. By improving the signal-to-noise ratio, the filtering technique enables more precise identification of gesture onset, which is crucial for applications requiring timely and accurate recognition. To further enhance robustness across users, future work could explore adaptive filtering methods that dynamically adjust smoothing parameters based on user-specific signal variability, thereby improving onset detection accuracy in diverse real-world conditions.
Feature diversity and generalization in MIRA
In rule-based interpretable systems like MIRA, feature diversity is not just beneficial; it is structurally necessary. Unlike probabilistic or deep learning models, MIRA’s architecture relies on a sequential execution of foundational rules. If early rules misclassify a sample, the remaining rules, including the personalization layer, are bypassed. This design introduces a unique failure mode: insufficient diversity during training can lead to early-stage misclassification that prevents correction.
Motivating case: user distribution mismatch
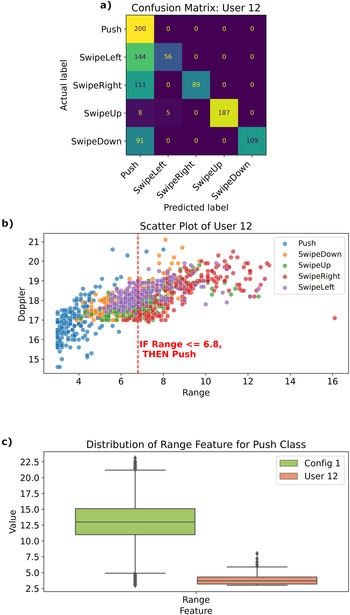
Figure 4 illustrates a real failure scenario using data from user $_{12}$. In configuration
 $_1$, most of user
 $_{12}$’s gestures were misclassified as Push, due to a shift in the range feature distribution compared to the training data. The first foundational rule in the model incorrectly absorbed all low-range samples into the Push class, blocking access to more specific downstream rules. This highlights how limited feature variability during training can propagate errors throughout the rule chain.
Impact of feature distribution mismatch on classification accuracy. (a) Confusion matrix for user $_{12}$ showing high misclassification as Push in configuration
 $_1$. (b) Range vs. Doppler plot showing misclassification region based on the first rule. (c) Range feature distribution comparison for Push class between training and user
 $_{12}$.

Dataset-level analysis: diversity vs. accuracy
To systematically assess the effect of feature diversity, we computed the IQR and average feature range across six training configurations. Table 5 summarizes the foundational and personalized accuracy achieved by each configuration.
Feature variability and classification accuracy across experimental configurations

Configurations with higher feature IQRs consistently achieved greater post-personalization accuracy improvements. For example, configuration $_2$ (IQR = 2.37) improved from 75.71% to 88.99%, while configuration
 $_1$ (IQR = 1.29), despite having more training samples, improved only by 4.2%. This suggests that an IQR
  $\geq 1.33$ may serve as a practical threshold for training data diversity in MIRA.
Feature-level contribution: ablation study
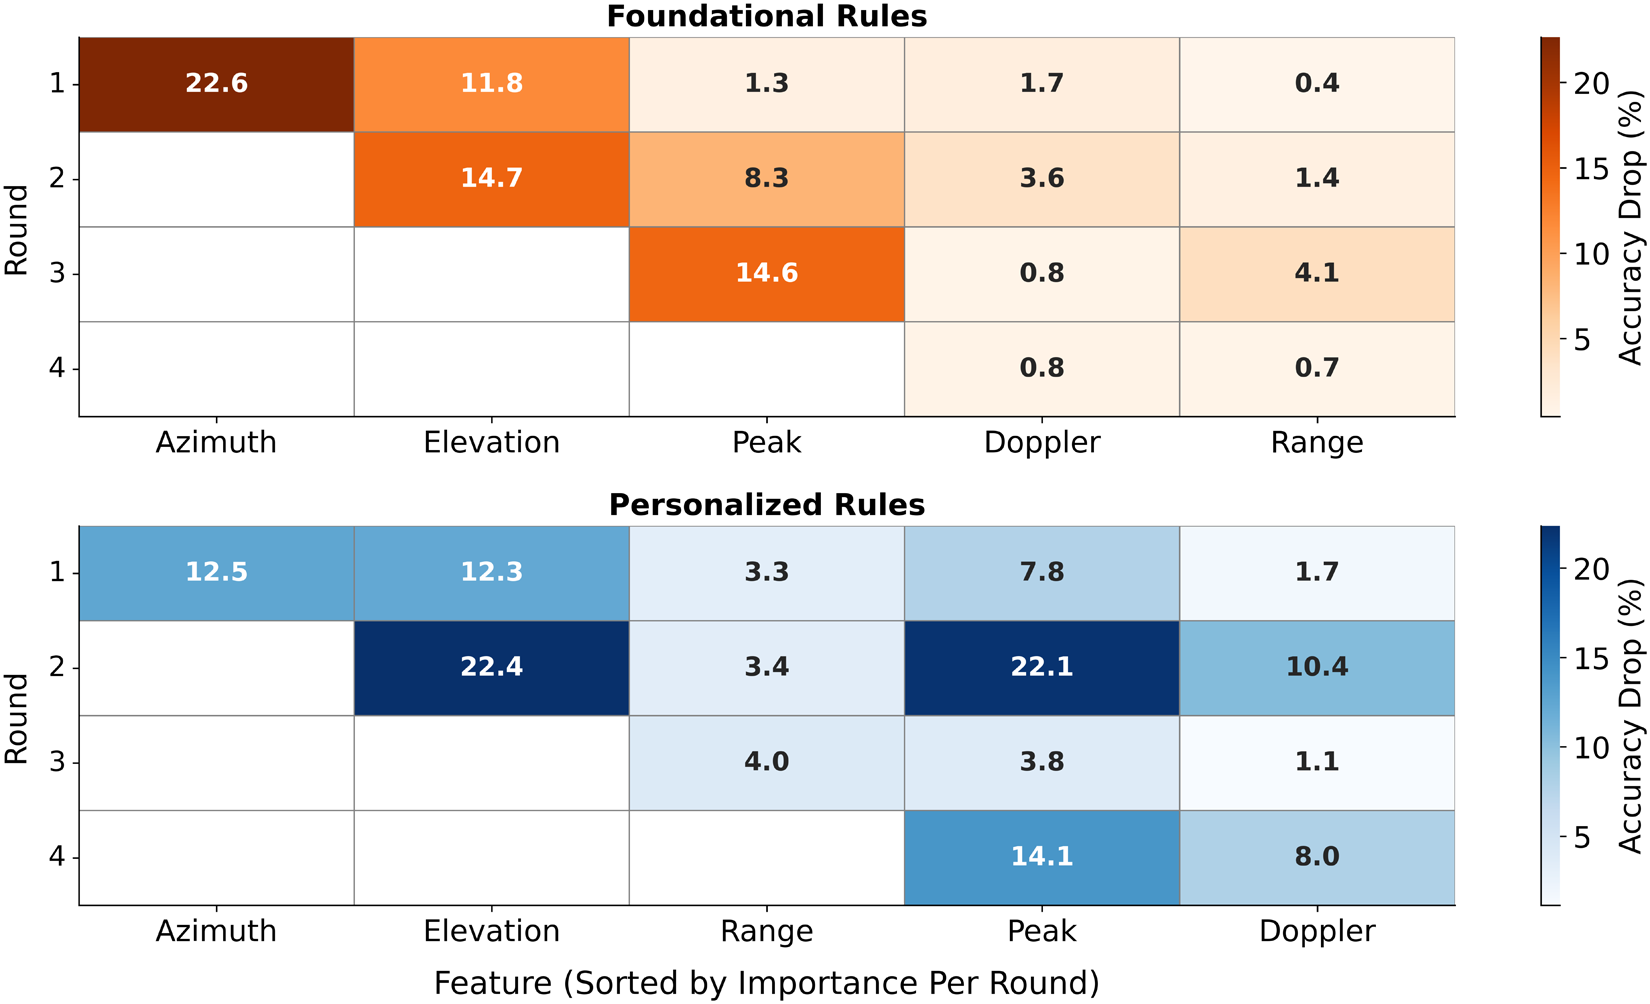
To further analyze generalization at the feature level, we conducted a recursive ablation study. Starting with the full feature set, we removed the most impactful feature at each step and relearned the rules. Figure 5 presents the resulting accuracy drop per feature and round.
Recursive ablation heatmap showing the accuracy drop per feature per round. Top: Foundational rules. Bottom: Personalized rules. White cells indicate removed features.

For foundational rules, removing Azimuth alone led to a 22.6% drop in accuracy. Removing Elevation and Peak in subsequent rounds caused further degradation, with accuracy dropping by 51.9% overall. In contrast, removing Doppler or Range produced a negligible impact ( $ { \lt }2\%$).
A similar pattern held for personalized rules, where removing Azimuth and Elevation caused a 34.9% drop. These results suggest that the angular features are critical for robust foundational rule creation, whereas the radial distance and signal magnitude are more useful in further model refinement.
This analysis demonstrates that in MIRA, feature diversity, particularly in spatial dimensions, is not only useful but structurally necessary. Without sufficient variation, foundational rules misclassify early, suppressing the corrective effect of personalization. Unlike black-box models, rule-based architectures depend on diverse training signals to activate their full rule cascade. Optimizing dataset diversity, measured by IQR, and prioritizing spatial features in training set design are essential for reliable rule-based gesture recognition.
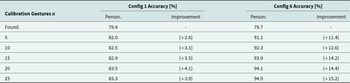
User calibration analysis: calibration performance across configurations
In line with our previous work, we aim to determine the minimum number of user-specific recordings required to achieve a well-calibrated model using our increased dataset. Since reducing user effort is a key priority, we adopt a fine-grained approach, evaluating smaller calibration sets (5, 10, 15, 20, and 25 recordings).
While all training configurations were examined, we focus on configuration $_1$ and configuration
 $_6$, as they exhibit contrasting feature distributions while maintaining similar foundational accuracy (as shown in Table 5).
Table 6 presents the foundational accuracy and the accuracy progression after personalization with increasing calibration samples.
Impact of calibration size on personalized accuracy for configuration $_1$ and configuration
 $_6$
$_6$

The difference in personalization effectiveness is further evident in how the models adapt over time. In configuration $_6$, accuracy increases sharply between 5 and 15 calibration samples, suggesting that the model quickly adapts to user-specific variations. Beyond 15 samples, the gains become more incremental, implying that the model has reached a well-calibrated state. Configuration
 $_1$, however, struggles to adapt, with accuracy plateauing early, showing minimal improvement beyond 10 recordings. This suggests that poor feature diversity limits the effectiveness of personalization.
The results also highlight the efficiency of calibration. In configuration $_6$, only 10–15 calibration samples are required to achieve near-maximal performance, making it a highly efficient setup. Conversely, in configuration
 $_1$, even with 25 recordings, the model fails to achieve significant improvements, reinforcing that poor feature distribution hinders the benefits of personalization.
These findings demonstrate that the personalization efficiency of MIRA is highly dependent on the diversity of the training dataset. In well-distributed datasets, even a small number of user recordings leads to substantial accuracy improvements, whereas in imbalanced datasets, personalization remains ineffective. This confirms that dataset selection plays a more significant role in calibration performance than simply increasing the number of user recordings. Ensuring a well-balanced training feature value distribution in data-driven methods like MIRA is crucial for achieving effective personalization with minimal user effort.
Conclusion
This work advances the field of interpretable radar-based gesture recognition by enhancing MIRA with gesture onset detection and feature distribution analysis. Unlike previous approaches that assumed predefined gesture frames, our method autonomously detects the start of a gesture using signal processing techniques, achieving 90.13% accuracy across users. This improvement enhances adaptability to real-world continuous motion scenarios while maintaining interpretability.
By incorporating a Background class, we enable robust differentiation between gestures and non-gesture frames, improving MIRA’s usability in real-world applications. Using the foundational and personalized rules, our method correctly classifies up to 94.9% of gestures, demonstrating the effectiveness of rule-based user adaptation. Beyond system-level improvements, we show that feature diversity, particularly in spatial dimensions, is essential for generalization in sequential rule systems. Low-diversity training sets can lead to early misclassifications by foundational rules, structurally preventing personalization. Through IQR analysis and feature ablation, we quantify this dependency and highlight the importance of training set design.
Overall, this study strengthens the interpretability and transparency of radar-based gesture recognition, positioning MIRA as a viable and interpretable alternative to deep learning-based methods.
Competing interests
The author(s) declare none.

Sarah Seifi received her B.Sc. and M.Sc. degrees in Electrical Engineering and Information Technology from the Technical University of Munich, Germany, in 2019 and 2022, respectively. In 2022, she started pursuing a Ph.D. degree in Trustworthy Artificial Intelligence at the Chair for Design Automation at the Technical University of Munich, collaborating with Infineon Technologies AG. Her primary research interests focus on developing explainable and interpretable artificial intelligence for consumer sensors.

Julius Ott received his B.Sc. degree in Electrical Engineering from the Technical University of Munich, Germany, in 2020. Then he received his M.Sc. degree in Electrical Engineering from the Technical University of Munich in 2022. He joined Infineon Technologies as a Ph.D. candidate in 2022 and collaborates with the Chair of Design Automation from the Technical University of Munich on latent space optimization for improved radar vision. In addition, his main research interests are sequence modeling and data sampling strategies.

Cecilia Carbonelli received a Laurea degree (cum laude) in Telecommunication Engineering and a Ph.D. degree in Information Engineering from the University of Pisa, Italy, in 2001 and 2004, respectively. She is a Senior Principal Engineer at Infineon Technologies. From 2003 to 2006, she was a Visiting Researcher and Postdoctoral Fellow at the University of Southern California, Los Angeles, CA. Cecilia served as a Visiting Professor at Qualcomm Inc., San Diego, in 2006, and later as a Senior Specialist in the Wireless System Engineering group at Infineon AG / Intel Mobile Communications GmbH, Munich, from 2007 to 2014. Since 2015, she has been a System and Algorithm Architect at Infineon Technologies, Munich. Cecilia holds more than 45 patents and patent applications in AI, sensors, power electronics, and telecommunications, as well as more than 50 peer-reviewed papers in international journals and conferences. Cecilia has been an IEEE Senior Member since 2014.

Lorenzo Servadei is the Head of AI for Chip Design and Manufacturing at Sony AI, leading three research teams applying machine learning to chip design and manufacturing. Previously, he was the Head of Machine Learning for Sensors at Infineon Technologies AG, where he earned his Ph.D. degree in computer science through a collaboration with Johannes Kepler University Linz. His research on AI-driven hardware-software co-design has been published in top conferences and journals, including DAC, DATE, and TCAD. During his Ph.D., he collaborated with Prof. Sepp Hochreiter’s team on machine learning for chip design optimization. In addition to his role at Sony AI, he is a Senior Lecturer and Group Leader in Machine Learning for Design Automation at the Technical University of Munich, where he is pursuing his Habilitation in machine learning for hardware design.

Robert Wille is a Full and Distinguished Professor at the Technical University of Munich, Germany, and Chief Scientific Officer at the Software Competence Center Hagenberg, Austria. He earned his Diploma and Dr.-Ing. degrees in Computer Science from the University of Bremen in 2006 and 2009, respectively. He has held positions at several institutions, including the University of Bremen, DFKI, University of Applied Science of Bremen, University of Potsdam, and Technical University Dresden. From 2015 to 2022, he was a Full Professor at Johannes Kepler University Linz, Austria. Wille’s research focuses on the design of circuits and systems for conventional and emerging technologies, with over 400 publications. He has served on editorial boards and program committees for journals and conferences like TCAD, ASP-DAC, DAC, DATE, and ICCAD. His accolades include Best Paper Awards, an ERC Consolidator Grant, and a Google Research Award.


 Open access