Overweight and obesity affects two-thirds of the Australian adult population and one in four Australian children(1). Poor diet quality is one of the key modifiable risk factors leading to excessive energy intake and weight gain. Data from the latest National Nutrition and Physical Activity Survey suggest that <5 % of the population meets the fruit and vegetable recommendations and 35–41 % of total energy intake is coming from discretionary foods and beverages (defined hereafter as ‘discretionary foods’)(1,Reference Louie and Rangan2) . This pattern of eating contrasts with the advice provided by the Australian Dietary Guidelines (ADG) which promotes a wide variety of nutritious foods and encourages Australians to limit their consumption of discretionary foods. Discretionary foods are high in saturated fat, salt, added sugar and/or alcohol and include items such as cakes, pastries, sweet breads and biscuits; confectionary and chocolate; commercially fried foods; salty snack foods; sugar-sweetened drinks; and alcoholic beverages. They are not considered an essential part of a healthy diet but are allowed in small amounts for variety and enjoyment(3). Given compliance with dietary guidelines is so poor(Reference Hendrie, Baird and Golley4), it is imperative to find ways to shift the population’s food choices to improve overall diet quality.
In Australia, data about the population’s food and nutrient intakes are published with the release of each National survey. These data help public health and nutrition researchers to understand average daily intakes and the gap between current daily intake and recommendations. Total daily food group intake is made up of all the relevant foods consumed at each eating occasion throughout the day – be that main meals or snacks. However, data on the distribution of food or food group intake across the day in eating occasions are not routinely published. It has been suggested that nutrition advice and strategies need to be more specific and actionable to change behaviour(Reference Holmbäck, Ericson and Gullberg5), and one approach to this is to provide meal-based advice. The 2015–2020 Dietary Guidelines for Americans included meal-based advice, as well as the MyPlate symbol which demonstrates to individuals how to build a healthy meal and make healthier choices(6). The ADG do not currently include meal-based guidance; however, this might be considered for future iterations. Therefore, it is important to gain a deeper understanding of food group consumption patterns in meals and snacks throughout the day to develop more targeted strategies to improve diet quality.
Previous studies of eating patterns have provided some insight into the timing of intakes of certain food group or combinations of foods that are typically consumed together as meals. For example, breakfast is a key contributor to total daily grain and dairy consumption in Australia(Reference Riley, Baird and Hendrie7), whereas dinner is the main contributing meal to total meat and vegetable intakes(Reference Sui, Raubenheimer and Rangan8). Lunch and dinner have also been shown to provide almost half of Australian adults’ total discretionary food intake(Reference Fayet-Moore, McConnell and Cassettari9). Similar findings have been reported in countries such as the USA and Norway(Reference Myhre, Løken and Wandel10). In summary, previous analysis of food group intake patterns has tended to focus on single meals, specific food groups or specific subgroups of the population(Reference Riley, Baird and Hendrie7,Reference O’Neil, Nicklas and Fulgoni11) . A greater understanding of how food groups are consumed across different eating occasions throughout the day in the population and within population subgroups is needed. This will help to inform the development of more specific and targeted advice which may assist individuals to better action nutrition messages and shift their intake, and subsequently the intake of the population, towards a dietary pattern that is more in line with guidelines.
The aim of this paper was to examine, in a nationally representative sample of Australians, the distribution of food group intake across meals and snacks throughout the day, and the contribution of each eating occasion to total daily food group intake in different age and gender population subgroups. Further to this, we wanted to understand the typical food group composition of meals and snacks to provide a starting point from which meal-based advice could be developed for Australians.
Methods
Survey methodology
The Australian Health Survey was conducted by the Australian Bureau of Statistics (ABS) in 2011–2012, reaching 32 000 people (25 000 households). This secondary analysis utilised data collected from the 12 153 respondents completing the National Nutrition and Physical Activity Survey. A detailed description of the sampling framework and data collection methods of the survey is available elsewhere(12). Briefly, data collection was conducted using a stratified multistage area sample of private dwellings. The area-based selection ensured that all sections of the population living in private dwellings within the geographic scope of the survey were represented by the sample. The survey is nationally representative, and furthermore, weighting these data prior to analysis meant the estimates better reflect the demographic structure of the Australian population to infer results for the population. A detailed summary of the demographic characteristics of the Australian population and the survey sample are available online(12).
Assessment of dietary intake
Trained interviewers conducted face-to-face 24-h recalls using an Automated Multiple-Pass Method adapted from the National Health and Nutrition Examination Survey (NHANES) conducted by the United States Department of Agriculture(Reference Bliss13). Respondents were asked to recall the previous 24-h intake of food and beverages, using a food model booklet to aid in portion size estimation(14). A second dietary recall was attempted with all respondents at least 8 d later via a telephone interview (with a 64 % response rate). For children aged <15 years, the interview was conducted primarily with a parent or guardian. Nutrient intake data were derived from the Foods Standards Australia and New Zealand nutrient composition database (AUSNUT 2011–2013)(15) developed for the survey.
Definition of food groups and eating occasions
The five core food groups and discretionary food described in the ADG were used to categorise foods(16). Core food groups are fruit (including dried fruit and fruit juice); vegetables and legumes; dairy foods including milk, yoghurt, cheese and/or other alternatives; meat and alternatives including lean meats and poultry, fish, eggs, tofu, nuts, seeds; and grains and cereals including bread, breakfast cereal, rice, pasta and other grain products(17). Unsaturated fats were not described in these results as the focus was on the core food groups with recommended daily targets provided in the ADG and the implications for meal-based dietary advice. Servings of food groups consumed were calculated using the ABS National Nutrition and Physical Activity Survey 2011–2012 confidentialised unit record files Food Level Data(18). Food and beverages are disaggregated into their ADG core food group components, and the number of servings of each food group per portion consumed is provided. Discretionary foods were defined using the ABS Australian Health Survey Discretionary Food List(19). This category included foods such as sweet breads (cakes, muffins and pastries), sweet biscuits, pastries, frozen milk products (ice cream and frozen yoghurt), potato products (potato chips and wedges), chocolate and other confectionary (lollies and chewing gum), sugar-sweetened beverages (soft drink and fruit drink) and alcoholic beverages. Servings of discretionary foods were calculated as 600 kJ portions.
Eating occasions were self-reported in the survey and included breakfast, morning tea, lunch, afternoon tea, dinner, supper, brunch, snack, beverage/drink, extended consumption, other and infant feeding. For this analysis, the three main meals were analysed as assigned by participants. Additional eating occasions were collapsed – brunch was recoded as breakfast; and other eating occasions and beverages were coded as between-meal snacks. Between-meal eating occasions were coded based on the reported time of consumption as ‘morning tea/snack’ if consumed between midnight and midday, ‘afternoon tea/snack’ if consumed between and midday and 6 pm and as ‘evening snack/supper’ if consumed between 6 pm and midnight. Multiple consumption of foods at the same eating occasion was combined. The number of servings of each food group consumed per eating occasion per person was calculated and reported with the recommended servings for each age and gender groups provided in the Australian Guide to Healthy Eating(3). Where there was a range of recommended servings, the maximum was used as the comparison.
Statistical analysis
Statistical analysis were performed using the IBM SPSS statistical package version 24 (SPSS Inc.). Age categories were defined using age groups provided in the ADG and the Food Standards Australia and New Zealand Nutrient Reference Values (2–3, 4–8, 9–11, 12–13, 14–18, 19–30, 31–50, 51–70 and 71+). When age and gender groups were combined, sixteen age and gender subgroups were created for analysis. For child and adult comparisons, adults were defined as aged 19 years and over.
Analyses were conducted using the first day of dietary recall which allowed for inclusion of data from the entire sample of respondents. The second day was completed by only two-thirds of respondents (n 7735), reducing the sample size. There was also a 474 kJ difference (P < 0·001) in mean energy intake reported between day 1 (M = 8522 (se 46·7) kJ) and day 2 of the survey (M = 8048 (se 54·7) kJ), suggesting day 2 data may be subject to additional mis- or under-reporting.
Summary estimates were weighted to reflect the demographic structure of the Australian population using weights based on age, gender and residential area, from the ABS data set. An additional weighting factor was applied to correct for the day of the week of the survey. The percentage of subjects reporting their intake for Saturday (3·5 %) and to a lesser extent Friday (11·4 %) was under represented compared with the expected percentage of 14·3 %. Therefore, the data presented were weighted using the ABS population weighting and the day of the week weighting.
Data processing
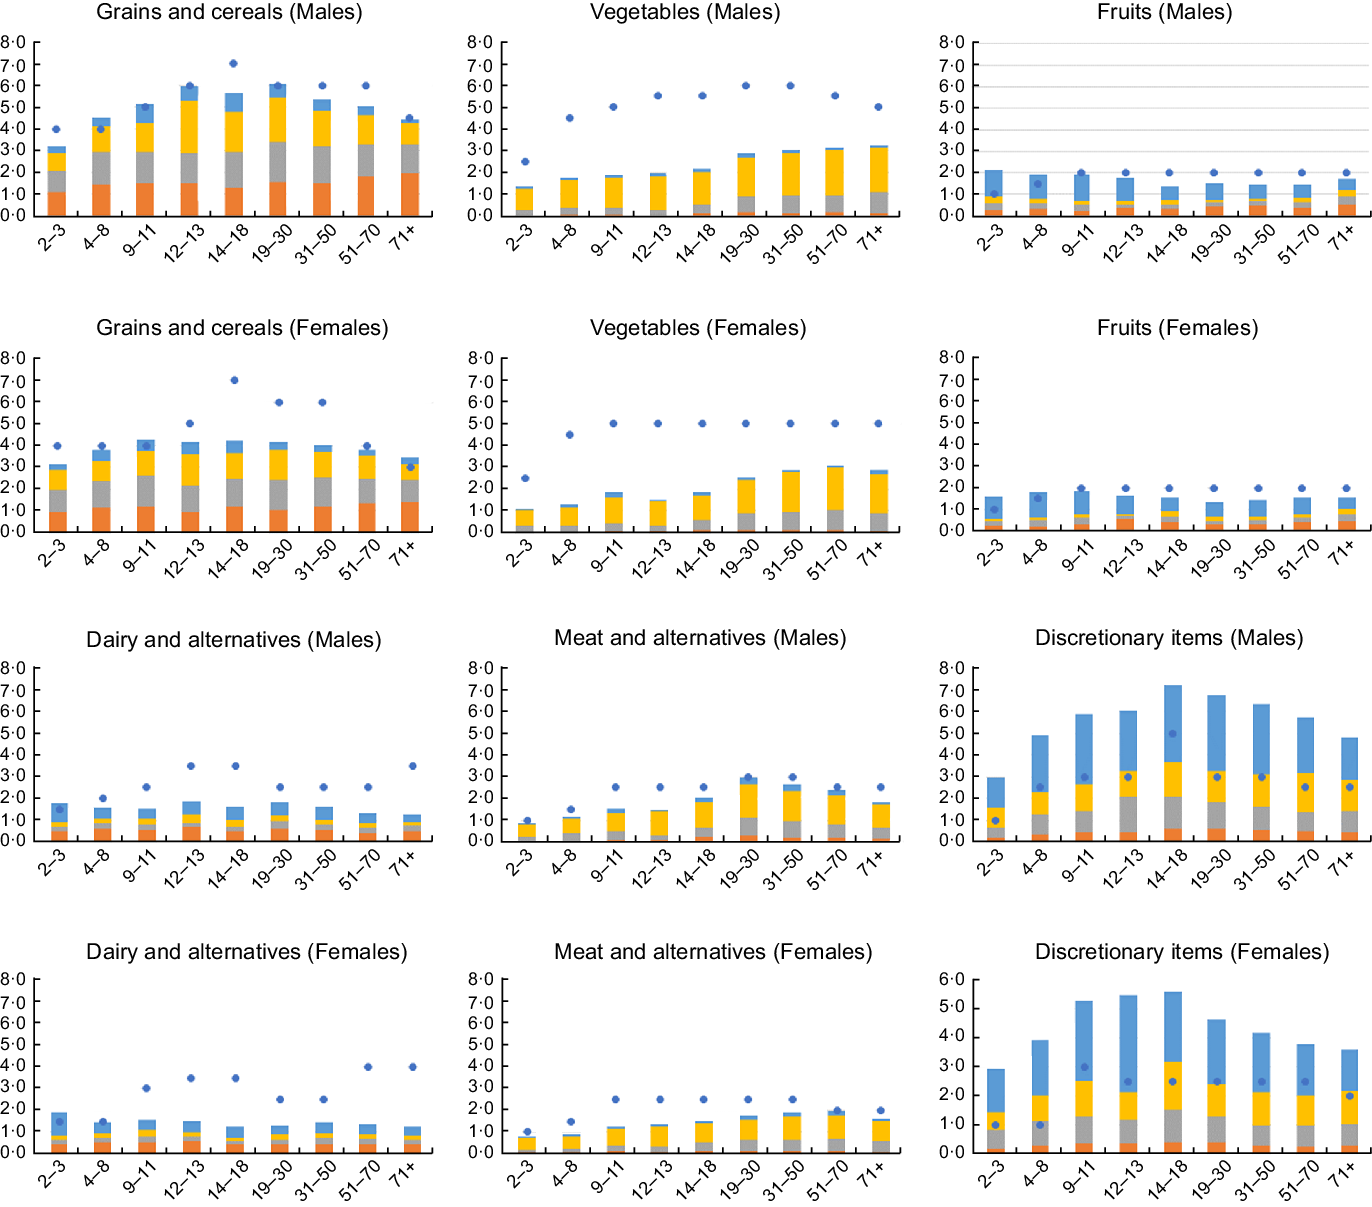
The average number and standard deviation of servings of each food group consumed at each eating occasion for all age and gender subgroups included the total population (i.e. it included people who did not consume anything at that eating occasion) and were reported with the age group and gender-specific targets provided in the ADG (Fig. 1, see online supplementary material, Supplementary Table 1). The average percentage contribution of each eating occasion to the total daily servings consumed was calculated for each food group, and the percentage of the daily target consumed at each eating occasion was calculated on an individual basis, and the average percentage of the target met per eating occasion reported for each population subgroup. Finally, because discretionary foods contribute a significant percentage of total energy for all Australians and are made up of a variety of different foods and beverages, we further examined the specific types of discretionary foods consumed at each eating occasion. Consumption of categories of discretionary foods was ranked based on the frequency of consumption within each population subgroup and the mean servings of discretionary food categories consumed at each eating occasion.
Number of servings of each food group consumed per eating occasion (coloured elements of bar charts) for each age and gender subgroup relative to the daily targets provided in the ADG (shown by dots). ![]() , Breakfast;
, Breakfast; ![]() , lunch;
, lunch; ![]() , dinner;
, dinner; ![]() , snacks;
, snacks; ![]() , recommended servings
, recommended servings

Results
Population characteristics
The sample used for this analysis was 12 153 Australians aged over 2 years. The sample was 5702 males (46·9 %) and comprised 2812 (23·1 %) children and 9341 (76·9 %) adults (Table 1).
Summary of selected demographic characteristics of the sample

Accumulative daily average food group servings consumed
The difference between the average daily food group intake and total daily recommendations varied by food groups and by age and gender subgroup (Fig. 1). For example, among the five core food groups, fruit intake was closest to recommendations across all age and gender groups, whereas vegetable intake was well below recommendations for all age and gender groups. For meat and alternatives, the average number of servings consumed was closer to recommendations for males than females and closer to recommendations in the youngest and oldest age groups of the population. The average servings of dairy foods consumed was below recommendations for all age groups 4 years and above. The difference between intake and recommendations was particularly evident in the adolescent and older adult age groups (12–13, 14–18 and 71+ years) (additional data available in Supplementary Table 1).
Adolescent boys and young men had the highest average grain intake per d, and this tended to follow the recommendations, except for 14–18-year-old males where the average intake was less than the recommendations (7 servings/d). Across all female age groups, the variation in grain intake was small, ranging from 3·1 servings in 2–3-year-old females to 4·3 servings in 9–11-year-olds and 4·2 servings in 14–18-year-olds. For grains, the difference between average intake and recommendations was greatest for females aged 14–18 years where the average intake was 2·8 servings below recommendation (Fig. 1).
Discretionary food consumption exceeded the maximum recommended amounts in all age and gender groups, and in many subgroups, the average amount consumed was twice the recommended target. For example, in young females aged 2–3 years and 4–8 years, the number of servings of discretionary foods consumed at breakfast and lunch was equal to total daily recommendations, without including discretionary foods consumed at dinner and the three between-meal eating occasions. In fact, for most age and gender groups (with the exception of 14–18-year-old males), the servings of discretionary foods consumed within main meals were approximately equal to the total daily recommendations and the discretionary foods consumed at between-meal eating occasions contributed additional servings over and above the recommendations (shown by the size of the yellow bars largely being above the dots, Fig. 1).
Percentage contribution of meals to total daily food group consumption
Table 2 shows the distribution of food group consumption across eating occasions as an average percentage of total daily intake. Overall, there were significant differences in contribution of meals to total daily intake across age groups. Across all age and gender subgroups, 48·6–63·6 % of total vegetable intake was consumed at dinner. For adults, an additional 23·8–30·7 % of daily intake was consumed at lunch, and for 2–3-year-old children, 16·2–21·6 % was consumed at lunch. Dinner was also the main meal for meat consumption within the Australian diet, with 44·6–66·9 % of total meat consumption at dinner, and lunch contributed 22·8–28·5 % in adults, and 14·4–20·2 % in 2–3-year-old children. For older children, meat consumed at lunch contributed 10·3–23·8 % of total intake.
Average percentage contribution* of each eating occasion to the total food group consumption across the day, by gender and age group

* Results shown using weighted data.
† ANOVA with Welch tests and Tukey Post hoc Analysis.
Breakfast was the largest contributor to total dairy consumption (approximately 27·0–43·4 %) in all age and gender subgroups except 2–3-year-old children, where between-meal eating occasions contributed 42·6–48·4 % of total dairy intake. Between-meal eating occasions were also a primary contributor to total fruit intake for children, and in particular younger children (all age groups up to 13 years) where 50·5–59·3 % of total fruit intake was consumed between main meals. Proportionally, adults consumed less of their fruit between meals and more at breakfast (Table 2).
As a proportion of daily intake, consumption of grains was relatively consistent across the three main meals for all age and gender subgroups. Breakfast provided between 24·3 and 46·2 % of total grain intake, lunch between 24·7 and 34·7 % and dinner between 18·4 and 35·7 % of total daily intake. Core grain-based foods only made a small contribution to between-meal eating occasions.
Across all age and gender groups, 39·8–56·1 % of total discretionary foods was consumed at between-meal eating occasions. The percentage of discretionary foods consumed between meals decreased as age increased. For children aged 2–3 years, approximately 50 % of their discretionary foods was consumed between meals, whereas for the oldest age group, 40 % was consumed between meals – meaning for the oldest adults, about 60 % of total discretionary foods was consumed as part of a main meal (Table 2).
Percentage of daily food group target consumed at meals and snacks
Table 3 shows the average percentage of the daily food group target consumed at each eating occasion across the day. On average, breakfast contributed between 18·6 % towards the daily grains target for 14–18-year-old males through to 47·0 % for females aged 71 years and older. Breakfast also contributed 11·2?–29·3 % towards the recommended intake for fruit and 10·2–35·3 % towards the recommended intake for dairy foods. The discretionary food target is a maximum limit, and breakfast contributed 10·2–29·1 % towards this upper limit.
Percentage* of the Australian Dietary Guidelines daily target achieved for each food group consumed at each meal occasion, by gender and age group

* Results shown using weighted data.
Foods consumed at lunch meals contributed 17·9–38·2 % towards the recommended intake target for grains, depending on gender and age group. Lunch contributed 12·0 % or less towards children’s daily intakes for vegetables, whereas for adults, lunch contributed 12·4–19·4 % towards daily recommended intakes. Across most age and gender groups, lunch contributed 27·5–53·4 % towards the discretionary daily upper limit, but for 2–3 and 4–8-year-old girls’ lunch contributed 65·8 % and 82·4 % of the upper limit, respectively.
Similar to breakfast and lunch, the dinner meal contributed 17·4–39·4 % towards the daily grain recommended intake targets. Vegetables consumed at dinner contributed 18·5–40·8 % towards daily vegetable targets, meat and alternatives consumed at dinner 30·7–56·5 % towards daily targets and fruit consumed at dinner 4·3–29·5 % towards daily targets. Discretionary food intake at dinner equated to 32·1–92·2 % of the daily upper limit.
Between-meal eating occasions contributed most to the daily intakes of discretionary foods. The afternoon snack occasion contributed 30·6–96·7 % towards the daily upper limit, morning snack 16·9–55·6 % and evening snack 14·3–41·5 % of the upper limit depending on age group and gender. Between-meal eating occasions also contributed towards the daily target of some core food groups, with the morning snack providing up to 60·2 % of the recommended fruit intake and up to 34·3 % of the daily dairy intake target for 2–3-year-olds. The afternoon snack also contributed to approximately 50 % of daily target for fruit and the afternoon and evening snacks 17·3–21·3 % towards daily food intake target.
Types of discretionary foods at eating occasions
The top five discretionary foods or beverages categories consumed at each eating occasion ranked by frequency of consumption, by gender, are shown for children (Table 4) and adults (Table 5). Some categories of discretionary foods were in the top five for children and adults. For example, sugar, honey and syrups; yeast extract spreads; and butters featured in the top three most commonly consumed discretionary foods at breakfast across all subgroups. The consumption of sweet biscuits was common at morning and afternoon tea, in all subgroups.
Number of servings* (mean) of discretionary foods consumed by children at each eating occasion, by gender and age group. The five categories with the highest number of consumers are shown for each occasion

* Results shown using weighted data.
† Data not shown where cell size are n 10 or less.
Number of servings* (mean) of discretionary foods consumed by adult at each eating occasion, by gender and age group. The five categories with the highest number of consumers are shown for each occasion

* Results shown using weighted data.
† Data not shown where cell size are n 10 or less.
Processed meat was the most popular discretionary food subgroup consumed at lunch among children and adults, with an average portion size ranging from 0·04 to 0·16 servings among children and 0·06 to 0·13 servings in adults. Processed meats were also among the top five discretionary foods consumed at dinner, with a larger average portion size of up to 0·22 servings in males aged 12–13 years and up to 0·19 in males aged 31–50 and 71+ years. Gravies and savoury sauces, as well as soft drinks and flavoured mineral waters, were also in the top five at lunch and dinner meals in subgroups of children and adults. Wine was the second most commonly consumed discretionary category consumed by adults at dinner, with the average portion size highest in 51–70-year-old males (0·35 servings) and females (0·30 servings).
Discretionary foods consumed at supper were predominantly ‘sweet’ foods such as chocolate, ice cream, sweet biscuits, other confectionary and soft drink in all subgroups, except for wine for adults. Some discretionary foods with the highest average portion size included fried potato products and processed meat for children at dinner; sweet biscuits for female children at afternoon tea and savoury snacks for male children at afternoon tea. For adults, wine and processed meats at dinner; and beer for male adults at afternoon tea were consumed in the highest average portions.
Discussion
Poor dietary habits in countries like Australia, the USA and UK are often evidenced by data showing inadequate consumption of fruit and vegetables(Reference Sui, Raubenheimer and Rangan8,20) and overconsumption of discretionary foods leading to excessive intakes of saturated fat, sodium, added sugars and alcohol – all of which are associated with increased health risk(3). Despite efforts to support healthy eating, compliance with dietary guidelines remains low and rates of overweight and obesity are persistently high. In fact, the increases in overweight and obesity observed in recent decades are projected to reach levels of 75–83 % in men and women by 2025(Reference Haby, Markwick and Peeters21). There is consensus, and a sense of urgency, to find new ways to frame nutrition messages and advice to more successfully shift population food choices and improve diet quality.
To our knowledge, this is the first Australian study to examine the intake of core food groups and discretionary foods across all eating occasions throughout the day and explore the variation in consumption patterns by age and gender. As part of the Australian dietary pattern, all age and gender subgroups consumed grains in equal proportions across eating occasions throughout the day, whereas for the other food groups, certain meals or snacks made a significant contribution towards total intake. For example, up to three quarters of adults’ total daily vegetable and meat intake was consumed at dinner, and for children, two-thirds of fruit intake was consumed at breakfast. While these meals in isolation are an important source of core foods, total intake across the day is not achieving dietary recommendations. Supporting published research in other countries(Reference Smith, Zhu and Vanage22), results of this study showed, regardless of gender and age, Australians are furthest from the recommended intakes for vegetables (an issue of under-consumption) and discretionary foods (an issue of overconsumption). Compliance with dietary guidelines for other food groups such as grains, meat and dairy showed more variation by gender and age group. Interventions designed to improve intakes should try to consider these differences in eating patterns when developing nutrition messages.
It is well documented that overconsumption of discretionary foods is a major concern impacting on diet quality. Australian and international nutrient-based dietary analyses have shown the disproportionate contribution of discretionary foods to energy and nutrient intakes(Reference Louie and Rangan2,Reference Fayet-Moore, McConnell and Cassettari9,Reference Aburto, Pedraza and Sánchez-Pimienta23,Reference Sui, Wong and Louie24) . Discretionary foods are commonly conceived to be ‘snack foods’, and indeed we found that up to half of all discretionary foods were consumed at eating occasions between the three main meals of the day. Higher frequency of between-meal eating occasions has been associated with greater discretionary food intake(Reference Murakami and Livingstone25), but higher frequency of meals was associated with higher diet quality(Reference Leech, Livingstone and Worsley26,Reference Murakami and Livingstone27) . While differences in the methods used to analyse eating occasions and definitions of snacking occasions or snack food make it difficult to directly compare results internationally(Reference Leech, Worsley and Timperio28), the available data indicate consistent findings – the quality of foods consumed outside of main meals is poor. The NHANES from the USA reports 22 % of total energy is attributed to snack-type foods, which have a higher energy density and carbohydrate content than foods consumed during main meals(Reference Kant29). In Canada, the added sugar content of food items consumed between main meals has been shown to be higher than foods consumed as main meals(Reference Nishi, Jessri and L’Abbé30). Likewise, findings from Australia showed nearly half the daily added sugars are consumed at non-main meal eating occasions(Reference Louie and Rangan2), and half of all eating occasions contain discretionary foods(Reference Fayet-Moore, McConnell and Cassettari9).
The factors that influence food choice are complex and multidimensional(Reference Nestle, Wing and Birch31). Although not well understood, they are thought to include individual factors and many other factors from within the social and environmental contexts in which people eat. Food industry reports have suggested consumers identify enjoyment as a key reason for consuming snacks as well as a possibility that consumers do not hold snacks to the same nutritional standards as main meals, increasing the likelihood that they are poorer quality or discretionary in nature(32). Food choice is also driven by convenience(Reference Monsivais, Aggarwal and Drewnowski33), and this is inherent in the foods we choose as between-meal snacks. There are barriers to consuming some core foods as snacks, such as vegetables where time taken to prepare these foods is often cited as a barrier to consumption(Reference Kearney and McElhone34,Reference Mc Morrow, Ludbrook and Macdiarmid35) . However, with advances in food manufacturing and product development, there are opportunities to promote conveniently packaged vegetables as a snack option(Reference Rekhy and McConchie36), subject to consumers being willing to consume such foods around snack times. Dairy foods and fruit were the most common core foods consumed between meals, possibly because convenient ‘ready to eat’ portions make them a quick and easy snack. In the context of overall low compliance with dietary guidelines, between-meal eating occasions appear to be an opportunity to reduce overall discretionary food intake among the population. Nutrition messages around replacing discretionary foods with core foods have been shown to be effective in reducing saturated fat, sodium and sugar intakes(Reference Grieger, Johnson and Wycherley37), but doing so with core foods of similar taste profiles or convenience to minimise the impact on enjoyment and ease is one strategy that could be explored in future research.
Eating styles differ across the life course(Reference Leech, Worsley and Timperio38) and so do preferences for various options within the discretionary food category. Australian children tended to include fried potato products, ice cream, sausages/frankfurts and soft drink at dinner, whereas older Australians consumed alcoholic beverages, pastries and pre-prepared salad dressings, as well as soft drink and fried potato products. About half of all discretionary foods were consumed as part of main meals. These included items which may not be obviously perceived as discretionary foods, such as ham, sauces and yeast-based spreads; adults frequently consumed foods from the sugar, honey and syrups group at almost every eating occasion, such as sugar added to tea or coffee. A consumer survey found that two-thirds of respondents perceived muesli bars, frozen yoghurt and coconut oil to be ‘healthy’, whereas most dietary guidelines would classify these foods as discretionary(39,40) . The discretionary category is a large and diverse group of foods and beverages making it complex to navigate. Providing recommendations for ‘swaps’ from discretionary to core options has been shown to be effective(Reference Grieger, Johnson and Wycherley37) and might be relatively straight forward within a main meal compared with between meals without having a major impact on the composition of the meal. For example, swapping a sausage for a piece of lean meat within a meal maybe be perceived as less of a change than replacing a chocolate with a piece of fruit. Therefore, food switches from discretionary to core food within main meals could be one strategy to subtly nudge people towards healthier choices.
Implications of our findings
Positioning dietary advice within the parameters of usual food group intake across the day may facilitate more targeted behaviour change and shift dietary patterns to be more in line with guidelines. Current population level advice for healthy eating tends to be general and uses phrases like ‘reduce’, ‘limit’ and ‘replace’ foods high in saturated fat, salt and sugar. On the back of this type of advice, it has been difficult to shift our preferences for nutrient-poor, energy-dense foods and has proven hard to break dietary habits. However, providing additional context to these messages around what foods and beverages are preferred and when they are commonly consumed might result in more tangible messages for individuals or groups of individuals. For example, while nutrition advice around swapping discretionary foods for core foods at snack times is beneficial to everyone, it may be particularly relevant to teenage boys who consume the highest proportion of discretionary foods between meals. Older adults who consume a greater proportion of their discretionary foods within main meals may benefit from a message focused on swapping discretionary for core choices at lunch or dinner. Further to this, providing consumers with more education and clear criteria around what constitutes a discretionary food might help them to make more informed food choices and may help individuals to change their behaviour, as knowledge is an important first step in behaviour change(Reference Prochaska, DiClemente and Norcross41).
Detailed knowledge about meals and meal patterns is important for those designing and delivering these nutrition messages(Reference Smitasiri and Uauy42). As nutrition advice moves towards a more tailored approach, providing individuals with greater context around what is consumed, in terms of the how and when, might lead to more successful intervention(Reference Kant29,Reference Smethers and Rolls43–Reference Guan, Probst and Neale46) . The Canadian and American Dietary Guidelines have started to include more about the where, when, why and how of eating, rather than just ‘what’ should be consumed(6,47) .
Limitations
The food group and eating occasions analysis presented here was based on the latest national dietary intake survey data in Australia. There are known limitations to 24-h dietary recall methodology(Reference Salvador Castell, Serra-Majem and Ribas-Barba48), which may impact on the results. The multiple pass methodology used in the survey attempted to minimise these limitations. This analysis used only the first day of dietary intake from the survey, due to reduced response rate and potential misreporting in the second day of dietary recall. With a lower average energy intake reported for the second day of recall, we assumed that underreporting was more of an issue in the telephone-conducted interview compared with the face-to-face interview. However, this might not be the case, and in fact, participants might have overestimated their intake on the first recall. A greater understanding of how misreporting impacts of the reported intake of different foods at different meals is needed. Utilising the second day of recall in the analysis might provide a more accurate estimate of usual intake(Reference Tooze, Kipnis and Buckman49,Reference Tooze, Midthune and Dodd50) , particularly for foods that are consumed episodically on one day but not the other, which might impact some eating occasions such as snacks or dinner more than others such as breakfast where food intake might be more routine. Across the sample, there were a mix of weekdays and weekend days, with weekends underrepresented. Further weighting of the data to account for uneven representation of days was important as food intake habits differ across days of the week(Reference An51–Reference Grimes, Riddell and Nowson53). The diets of American adults have been shown to be less healthy on the weekend compared with weekdays, with more energy coming from discretionary foods, alcohol and sugar-sweetened beverages(Reference An51). Australian adults consume more alcohol on Friday, Saturday and Sunday(Reference Wymond, Dickinson and Riley54), and it is likely that the food consumption of meals also varies by day of the week. Daily variations in dietary intake have implications for overall diet quality and greater awareness, and promotion of healthy eating every day is warranted.
This analysis compared population food group intakes with the recommendations provided in the ADG. For most food groups, the recommended amount is an aspirational target to promote health and well-being. For the discretionary category, the recommended amount is an upper limit of discretionary foods or an allowance for additional core foods for individuals who are taller or more physically active(3). Most Australian adults are overweight or obese(1), and not highly active(55); therefore, these additional servings of food are not essential to meet energy requirements, and possibly the lower limit may be a more appropriate benchmark to use for most people. While the benchmarks were tailored to age and gender subgroups, future analysis may further tailor these to body weight status and physical activity levels.
This paper focused on the five core food groups, as well as the discretionary food category, to provide a comprehensive understanding of food consumption across meals and snacks among all age and gender subgroups of the population. Equally, conducting this analysis at a finer scale within food groups would also be interesting. For example, separating out the grains group into wholegrain and refined grains, or vegetables into starchy and other vegetables, would reveal more about the meal and snack composition of Australian diets. There is little consensus for the definition of snacks or ‘snacking’ in the literature(Reference Louie and Rangan2,Reference Leech, Worsley and Timperio28,Reference Leech, Worsley and Timperio44,Reference Potter, Vlassopoulos and Lehmann56) . Some definitions describe eating occasions by the time of the day, time without ingesting kilojoules, type or amount of food consumed, energy content, self-ascribed labels or a combination(Reference Potter, Vlassopoulos and Lehmann56–Reference Hess, Jonnalagadda and Slavin58). This dietary survey used a combination of self-ascribed eating occasion and time of consumption to define between-meal eating occasions. While the focus of this paper was on meals and foods consumed at various eating occasions, we did not focus on the absence of an eating occasion – for example, the impact of skipping meals – on overall intake and diet quality. Also, we did not examine the associations between the composition of eating occasions and health status; however, this is worthy of further investigation.
Conclusion
In summary, this analysis has sought to determine the pattern of food group consumption at mealtimes throughout the day in a nationally representative sample of Australians. Some food groups such as grains were consumed in equal proportions throughout the day across all age and gender subgroups, while the other core food groups were unequally distributed, featuring more prominently at specific eating occasions. For discretionary foods, children consumed more of their discretionary intake at mid-meals, while adults consumed a greater proportion as part of a main meal. The deeper understanding of when and in what combinations food groups are consumed may be useful in formulating more specific public health nutrition messages that are contextually relevant to diets of Australians, and subgroups of the Australian population.
Acknowledgements
Acknowledgements: The Australian Bureau of Statistics conducted the National Nutrition and Physical Activity Survey 2011–2012 and made the data available for this secondary analysis. The staff who conducted the survey and the survey participants are gratefully acknowledged. Financial support: This research received no specific grant from any funding agency, commercial or not-for-profit sectors. Conflict of interest: None. Authorship: G.A.H., G.W. and G.J.M. conceptualised the study. G.A.H. and M.A.R. designed the study and conducted data analysis. All authors interpreted the results and contributed to the writing of the article. All authors have reviewed the article and approved the final version for publication. Ethics of human subject participation: The interview components of National Nutrition and Physical Activity Survey were conducted under the Census and Statistics Act (CSA) 1905. Informed consent was sought from adults and from parents/legal guardians of children through completion of a consent form. Permission to access the survey database and to conduct this secondary analysis was obtained from the ABS prior to commencing the work.
Supplementary material
For supplementary material accompanying this paper visit https://doi.org/10.1017/S1368980020001585