





Non-technical Summary
Ecological factors like climate change, long-term evolution in isolation, and changes in predator pressure, among others, may cause shifts in life-history traits. Here we studied two extinct, Middle Pleistocene ruminants of Java (Indonesia), the deer Axis lydekkeri and the antelope Duboisia santeng. These two species belong to the Stegodon-Homo erectus faunal stage. We constructed mortality profiles and survivorship curves based on dental remains of the two species. Their individual age was calculated using the Quadratic Crown Height Method, which uses the rate of tooth wear as an indirect way to estimate individual age. The mortality profiles of both species were L-shaped, with prominent juvenile mortality but also substantial survival after senescence, with maximum survivability around 70–80% of their hypothetical maximum life spans. We also discuss the differences between the two profiles in light of the presence of Homo erectus hunter-gatherers.
Introduction
Life history is defined as the quantification of key processes in an organism’s life, such as longevity, growth, and reproduction in relation to body mass and ancestry, and is used to understand ecological and evolutionary processes (Oli and Coulson Reference Oli, Coulson and Kliman2016). The most notable life-history traits are growth rate, age at first reproduction, maximum life span, number of offspring, age at maturity, and adult body mass. These traits profoundly affect population dynamics and thus play a key role in ecology and evolution. Life-history theory provides possible explanations for the nature of biodiversity and how natural selection operates (Alonzo and Kindsvater Reference Alonzo, Kindsvater, Jørgensen and Fath2008; Oli and Coulson Reference Oli, Coulson and Kliman2016) and is an extension of r/K selection theory in ecology (MacArthur and Wilson Reference MacArthur and Wilson1967; Pianka Reference Pianka2000). According to Pianka’s (Reference Pianka2000) model, species in unstable environments adapt evolutionarily by developing rapid body growth, early sexual maturity, a large number of offspring, and a short life span (“r-selected” strategists), in contrast to species in stable environments and populations that are maintained near their carrying capacity (“K-strategists”). These latter evolve opposite life-history traits such as slow body growth, late sexual maturity, a small number of offspring, and a prolonged life span (Hayashi et al. Reference Hayashi, Kubo, Sánchez-Villagra, Taruno, Izawa, Shiroma, Nakano and Fujita2023).
Large mammals are generally characterized by high resource requirements and growth rates, which may pose a challenge when faced with restricted or changing supply of resources during climatic oscillations, in islands in general but also with increasing competition pressure. Regarding the insular situation, the fossil record provides us with abundant cases that demonstrate that large mammals were dominant faunal elements of many islands, with deer, elephants, hippos, and bovids being the most predominant ones. Insular mammals share several biological characteristics, with body-mass shifts being the most apparent one, in accordance with predictions by the island rule or Foster’s rule (Foster Reference Foster1964; Van Valen Reference Van Valen1973; Lomolino Reference Lomolino1985; Lomolino et al. Reference Lomolino, van der Geer, Lyras, Palombo, Sax and Rozzi2013). Insularity in ungulates leads primarily to the evolution of dwarfism, and life-history theory provides a framework to explain the trend toward this often-extreme body-mass decrease. Under limited resource availability and decreased predation pressure, changes in an organism’s life-history traits can be advantageous, resulting in body-size changes. Low extrinsic mortality and limited resources trigger both a genetic response and a phenotypically plastic response, meaning adjustments occur between certain hereditary and environmental limits (Palkovacs Reference Palkovacs2003). In this case, resource and space limitations have the opposite effect on body-size alteration compared with low extrinsic mortality. This model predicts that when the first category predominates, body size decreases, while if the absence of predators affects populations more, then body size increases (Geist Reference Geist1998; Köhler and Moyà-Solà Reference Köhler and Moyà-Solà2009).
What happens in an intermediate situation is, however, unknown. The middle Pleistocene of Java, with its Stegodon-Homo erectus fauna (ranging between roughly 1.5 Ma and 128 ka) (van den Bergh et al. Reference van den Bergh, de Vos and Sondaar2001), provides such a case. This fauna is impoverished when compared with mainland faunas of the same period and region, but not exactly unbalanced, as larger mammalian carnivores are present (tigers, hyenas, and canids), yet it has a high level of endemism (de Vos, Reference de Vos1983; van den Bergh et al. Reference van den Bergh, de Vos and Sondaar2001; van der Geer et al. Reference van der Geer, Lyras and Volmer2018, Reference van der Geer, Lyras and de Vos2021). It was previously thought that Java was connected to the mainland and formed a peninsula on the edge of the continent only during glacial stages, but during interglacials, it was an island. New research (Husson et al. Reference Husson, Boucher, Sarr, Sepulchre and Cahyarini2020; Sarr et al. Reference Sarr, Husson, Sepulchre, Pastier, Pedoja, Elliot, Arias-Ruiz, Solihuddin, Aribowo and Susilohadi2019) has shown, however, that continental land connections were more permanent and only started to vanish periodically after the mid-middle Pleistocene or middle Chibanian (400 ka). As a result, before that period, Java not only had a large enough diversity of competitors and predators, but also a wide variety of resources to sustain them.
This study aims to build mortality profiles and survivorship curves of two endemic Javanese ruminants, the deer Axis lydekkeri (Martin Reference Martin1888) and Duboisia santeng (Stremme Reference Stremme, Selenka and Blankenhorn1911), by collecting individual age at death data to reconstruct their life-history traits. These two species are survivors from the earlier, insular stage of Java (early Pleistocene–early middle Pleistocene, or Gelasian–early Calabrian), so they may potentially have retained traits that evolved under the previous insular conditions. Our results will then be interpreted and compared with published life-history data of other endemic as well as continental ungulate species obtained with the same or comparable methods. This will help us to interpret life-history traits and strategies that these endemic ungulates may have developed in response to their environment with an impoverished fauna that was increasingly connected to the mainland.
The two fossil species of this study belong to the two most diverse families of the Ruminantia suborder, namely Bovidae for D. santeng and Cervidae for A. lydekkeri. Duboisia santeng and A. lydekkeri are both found in the Ci Saat, Trinil H.K., and Kedung Brubus faunal units (van den Bergh et al. Reference van den Bergh, de Vos and Sondaar2001; van der Geer et al. Reference van der Geer, Lyras and de Vos2021; Rozzi et al. Reference Rozzi, Lomolino, van der Geer, Silvestro, Lyons, Bover and Alcover2023). These faunal units are late early to middle Pleistocene in age and absolute dated to around 1.3–0.9 Ma for Ci Saat (Matsu’ura et al. Reference Matsu’ura, Kondo, Danhara, Sakata, Iwano, Hirata and Kurniawan2020) or a minimum age of 1.53 ± 0.08 Ma (van den Bergh et al. Reference van den Bergh, Wibowo, Setiabudi, Kurniawan, Storey, Suharyogi and Puspaningrum2019); 830–430 ka for Trinil H.K. (Hilgen et al. Reference Hilgen, Pop, Adhityatama, Veldkamp, Berghuis, Sutisna and Yurnaldi2023); and unresolved for Kedung Brubus, but older than the subsequent Ngandong faunal unit, which has been dated to at most 138 ka (Rizal et al. Reference Rizal, Westaway, Zaim, van den Bergh, Bettis, Morwood and Huffman2019). Only the Ci Saat and Trinil H.K. faunas represent insular conditions, after which the region remained connected to the mainland through the exposed Sunda Shelf until the mid-Chibanian, when the region was periodically connected, but especially until the Holocene, when rising sea levels disconnected the area once again (Sarr et al. Reference Sarr, Husson, Sepulchre, Pastier, Pedoja, Elliot, Arias-Ruiz, Solihuddin, Aribowo and Susilohadi2019; van den Bergh et al. Reference van den Bergh, Wibowo, Setiabudi, Kurniawan, Storey, Suharyogi and Puspaningrum2019; Husson et al. Reference Husson, Boucher, Sarr, Sepulchre and Cahyarini2020; Berghuis et al. Reference Berghuis, van den Bergh, van Kolfschoten, Wibowo, Kurniawan, Adhityatama and Sutisna2025). The two species under consideration thus had an insular origin and coexisted with newcomers, including competitors and predators, for a few hundred thousands of years before going extinct.
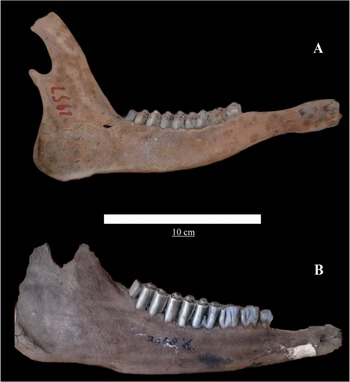
Duboisia santeng (Fig. 1B), with its short and keeled horns, is related to the living boselaphines of India, namely Boselaphus tragocamelus and Tetracerus quadricornis. Isolated molars have been described by Stremme (Reference Stremme, Selenka and Blankenhorn1911: p. 120), who was the first to point out similarities in morphology between Duboisia and Boselaphus, including degree of hypsodonty, enamel smoothness, and premolar shape. Duboisia santeng’s lower molars mostly lack basal pillars and are more hypsodont than those of Boselaphus, which follows the trend of increase in hypsodonty in island endemics (van der Geer Reference van der Geer2014). In the current research, crown height for isolated third molars of D. santeng is about 30 mm for unworn specimens. Rozzi et al. (Reference Rozzi, Winkler, de Vos, Schulz and Palombo2013) applied mesowear and dental areal surface texture analysis to determine the feeding habits and paleohabitat preference of D. santeng, and contrary to their expectation, they found a typical signature of a forest dweller, with predominantly browsing feeding habits. They also showed that it had some unique characteristics in postcranial bones and underwent size reduction suitable for a forest species. Wibowo (Reference Wibowo2020) modeled the paleohabitat of D. santeng by combining mathematical functions (geographically explicit suitability scores) with occurrence data and environmental factors and arrived at the conclusion that the east Java environment of today is comparable to that in the Pleistocene, while central Java was dominated by savanna.
Right mandibles (p2–m3) of the deer Axis lydekkeri (A) and the bovid Duboisia santeng (B), specimens RGM.DUB.1957 and RGM.DUB.2068d, respectively from the Dubois Collection. Scale bar, 10 cm.

Axis lydekkeri (Fig. 1A) is generally smaller than the extant chital (A. axis) but similar in size to Indian hog deer (A. (Hyelaphus) porcinus), and based on skull morphology and craniometrics, it is indeed closer to the subgenus Hyelaphus (Meijaard and Groves Reference Meijaard and Groves2004). The lower dentition of A. lydekkeri is similar to that of its extant Axis relatives. The enamel of its mandibular molars is very rough with a prominent prism. There is also a considerable size difference between the lower premolars and molars, with the third lower molar being the tallest tooth in the toothrow. The maximum crown height of the third lower unworn molars (isolated specimens) is 22 mm. If Lydekker’s deer was anything like its living relative, the Indian hog deer, then it should have preferred grass jungles with moderate-sized bushes, while it is not expected to have formed large groups or herds, because hog deer are not sociable by nature and seldom form pairs, even in mating season (Lydekker Reference Lydekker1898).
To address questions of species longevity and demographics, the study unit is the population or, in the case of fossil species, the metapopulation. In fossil assemblage studies, the individuals often do not belong to a single population from a specific place and time, but rather they form a metapopulation, composed of animals from different time periods and different herds (Klein and Cruz-Uribe Reference Klein and Cruz-Uribe1983). Put simply, a metapopulation is “a population of populations,” spatially structured over a large geographic frame and over time, that are linked through dispersal movements (Van Nouhuys Reference Van Nouhuys2016; Lin Reference Lin2022). Metapopulation processes play a key role in population dynamics and have been repeatedly used in life-history and macroevolution studies, as a metapopulation does not have a limited life span (Hanski and Simberloff Reference Hanski, Simberloff, Hanski and Gilpin1997; Januario et al. Reference Januario, Pinsky and Rabosky2025). This gives paleontologists the advantage of studying the life history of a fossil species over an extended period of time, minimizing fluctuations a single population could have thanks to environmental changes and other factors. Life-history research depends on the knowledge of the age of all individuals of the population; based on this, conclusions can be drawn about mortality, survivability, reproduction rate, slow versus fast life, and so on, as reflected in life tables (Caughley Reference Caughley1966). In the context of metapopulations, though, the age of the specimen is by default the age at death, and so life tables of fossil species typically comprise age (x), mortality (dx), and survivability (lx) (Caughley Reference Caughley1966; Oli and Coulson Reference Oli, Coulson and Kliman2016).
Because our specimens derive from a limited number of different sites in East Java (Solo riverbanks and the Kendeng Hills; see de Vos Reference de Vos2004; Albers Reference Albers2024: fig. 2), the profiles produced should be averaged over space and time. The only locality with a substantial number of specimens was Sangiran, so naturally, we provided mortality profiles based exclusively on specimens marked from there. Unfortunately, we cannot provide a more concise time frame other than that all specimens belong to the same faunal stage, which is the Stegodon-Homo erectus Biozone, dated to between 1.49 Ma and 138 ka. Similarities between the profiles of the deer and the bovid are to be expected based on their relative phylogenetic relationship and because they most likely occupied similar habitats. At the same time, their mortality profiles might also differ, based on differences in lifestyle (such as small or large herds or solitary) and niche preferences (such as open grass vs. closed forest). Furthermore, mortality profiles in ungulates are generally affected by age- and sex-related differences in survival tactics, presence or absence of predators, and vegetation density and distribution (Klein and Cruz-Uribe Reference Klein and Cruz-Uribe1983).
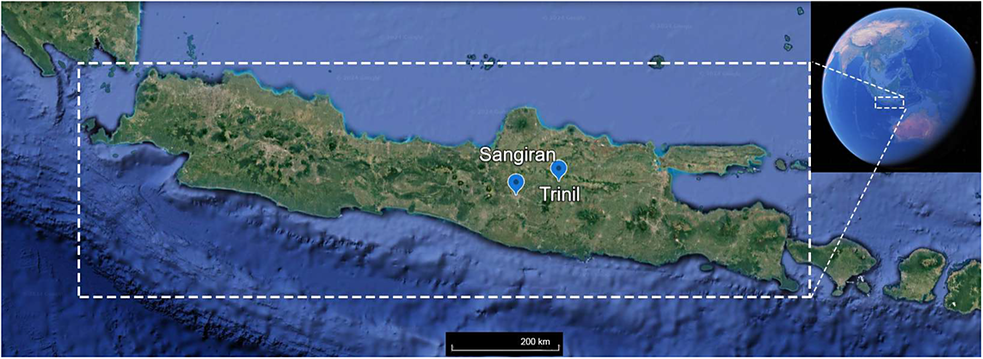
The island of Java (Indonesia) showing the fossil localities of Trinil and Sangiran (blue points) where most of the specimens used in this study were excavated. Image from Google Maps.
Material and Methods
All fossil material included here is part of the historical Dubois Collection as well as the Von Koenigswald Collection, currently housed at Naturalis Biodiversity Center, Leiden, the Netherlands. We used a total of 72 mandibles and 108 isolated molars of Duboisia santeng (Bovidae: Boselaphini) and 204 mandibles and 94 isolated molars of Axis lydekkeri (Cervidae: Cervini) to estimate individual ages (see Supplementary Material for specimen details). Teeth are most abundant in the fossil record thanks to their resilience in taphonomic processes. Individual age estimates for adult and older individuals were based on tooth crown height decrease through wear during life (Fig. 3), while for juvenile and subadult individuals, dental eruption stage was used (Wing et al. Reference Wing, Klein, Cruz-Uribe, Butzer and Freeman1987). These sequences are specific to each genus, species, or even population (Hillson Reference Hillson2005; Veitschegger and Sánchez-Villagra Reference Veitschegger and Sánchez-Villagra2016). For fossil species, dental eruption stages are generally inferred based on their extant relatives (Twiss Reference Twiss2008; Kohut Reference Kohut2022). We here used the tooth eruption sequences of Capra hircus and Cervus elaphus for D. santeng and A. lydekkeri, respectively. We restrict our analysis to the lower dentition, as is commonly the case in ruminant tooth wear age estimation studies. A critical assessment of these methods is then indispensable, because such methods are known to under- or overestimate ages depending on species or the molar of choice or both.
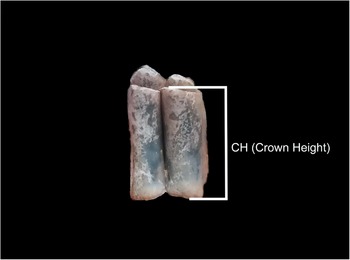
First or second isolated lower molar specimen of Duboisia santeng showing how the crown height measurement is taken. The measurement process is the same for Axis lydekkeri.

Dental wear is mainly related to the type of food and amount of grit an animal chews over the span of its lifetime and thus is only indirectly related to the number of years the individual has lived in total (Hillson Reference Hillson2005; Kohut Reference Kohut2022). The first molar erupts and comes into wear much earlier than the third molar and so generally, the former will show a much higher age estimation than the latter. Further variation in tooth wear is related to the individual’s age, because the teeth of a younger animal have sharper cusps and consequently are being worn faster. As a result, the relationship between wear rate and age is not linear (Klein and Cruz-Uribe Reference Klein and Cruz-Uribe1983), and that is why we chose to use the Quadratic Crown Height Method (QCHM) in this research and not its simpler predecessor, the Crown Height Method (CHM). Additionally, the way we structured the mortalities and the survivorships we produced was exactly to account for such anomalies and discrepancies. Furthermore, especially in ruminants, differences between the sexes can also be observed, because males are physically larger and thus must eat more, resulting in a faster tooth wear rate. Also, individuals can develop chewing side preferences, thus affecting the outcome of the estimation, if based on only one side (Kohut Reference Kohut2022; Twiss Reference Twiss2008). On a final note, osteophagia in wild ruminants is a common practice, where the individuals chew on bones or antlers to balance their calcium–phosphorus ratio, which often causes extreme cases of dental wear.
The crown height age estimation method relies on mathematical models to estimate individual age based on teeth (Klein and Cruz-Uribe Reference Klein and Cruz-Uribe1983; Wing et al. Reference Wing, Klein, Cruz-Uribe, Butzer and Freeman1987; Gifford-Gonzalez Reference Gifford-Gonzalez1991). Spinage (Reference Spinage1973) was the first to correlate an animal’s age with the crown height of its molars. Later, others expanded upon this idea (Klein et al. Reference Klein1981–1982; Levine Reference Levine1982; Klein and Cruz-Uribe Reference Klein and Cruz-Uribe1983; Gifford-Gonzalez Reference Gifford-Gonzalez1991; Pike-Tay et al. Reference Pike-Tay, Morcomb and O’Farrell2000; Steele Reference Steele and Ruscillo2006), leading to the QCHM. For this method, crown height (CH) is measured from the enamel–cementum junction to the top of the mesial cusp (or in the case of teeth still embedded in the mandible, from the visible point closer to it), on the buccal side of a tooth buccal crest. Other variables include
$ {\mathrm{Age}}_{\mathrm{pel}} $
 , which stands for potential ecological longevity or, put simply, the maximum expected life span of the animal.
$ {\mathrm{Age}}_{\mathrm{e}} $
, which stands for potential ecological longevity or, put simply, the maximum expected life span of the animal.
$ {\mathrm{Age}}_{\mathrm{e}} $
 is the age at which the molar comes into wear (age of eruption) and finally,
$ {\mathrm{CH}}_{\mathrm{o}} $
is the age at which the molar comes into wear (age of eruption) and finally,
$ {\mathrm{CH}}_{\mathrm{o}} $
 is the initial molar crown height before the onset of occlusal wear or, in practice, the highest molar crown measurement of the specific dataset. The formula developed by Klein et al. (Reference Klein1981–1982, Reference Klein and Cruz-Uribe1983) and used here is as follows:

For extinct species, potential ecological longevity and ages of the eruption of molars are estimated from living relatives for which such data are easily accessible and widely used. Standardization allows for taxon-wide comparisons among fossil species, so reference points are crucial. We here use RDY (Red Deer Years based on C. elaphus ) for the extinct deer and GY (Goat Years based on C. hircus ) for the extinct bovid. It needs to be noted that this creates by default on its own a systematic error in the age estimations produced by the QCHM. The following constants are then used: For A. lydekkeri , the age at molar eruption is 0.5 years (6 months, first molar), 0.9 years (almost 11 months, second molar), and 1.5 years (18 months, third molar), and the potential ecological longevity is 16 years. For D. santeng , these ages are 0.25 years (3 months, first molar), 1 year (second molar), and 2 years (third molar), and potential ecological longevity is 18 years. Furthermore, it needs to be noted that to successfully analyze crown height measurements there are a couple of assumptions that need to be fulfilled: First, individual variation within a population (or meta-population) that stems from dietary and chewing habits and from sexual dimorphism should not significantly affect eruption sequences and wear patterns. Second, within the (meta-)population, the rate of wear of a specific tooth type should be relatively consistent in all individuals of all age classes (Twiss Reference Twiss2008).
In both the cases of isolated teeth and of those still incorporated in the mandible, the crown height was measured from the distal-most cusp of the molar but for the third molar, the second cusp. Several researchers (Morrison and Whitridge Reference Morrison and Whitridge1997; Ruscillo Reference Ruscillo2006; Kohut Reference Kohut2022) suggest taking the average of all crown height measurements of the tooth’s individual cusps, but in this research, this was deemed unnecessary, because the difference in the resulting age estimations is inconsequential for the mortality profiles. For the isolated molars, crown height is measured from the enamel–dentine junction, where the crown and root meet, to the tip of the buccal crests. Also, because it is not possible to reliably differentiate between isolated first and second molars, it is useful to sometimes use the formula twice and produce two age estimations, one assuming that the molar is the first and another one assuming it is the second, and then take the average of the two age estimations. The difference in the estimations produced stems solely from the difference in the age of eruption. For A. lydekkeri, this difference was considered irrelevant, because in C. elaphus, the second molar erupts only about 5 months later than the first, and this marginally affects the outcome. In the case of D. santeng, though, there is a substantial time gap between the two eruption stages in goats (9 months), and so the final age estimation for each specimen was calculated as the average of two estimates. Finally, for teeth still incorporated in the mandible, an age estimation was calculated for each molar, and then an average was produced as a final estimate of the specimen/individual
Age estimation based on the stages of eruption method is more straightforward, because deciduous teeth erupt from anterior to posterior. Also, deciduous teeth often grow larger toward the posterior end, for example, the last deciduous premolar (dp4) can grow to be as large as the first molar in adults (m1), which is the next tooth to erupt (Hillson Reference Hillson2005). In addition, in ruminants, dp4 is often molarized and looks similar to m3. In this research, the categorization between juvenile individuals and subadult ones was based on the presence or absence of deciduous dentition. If a deciduous premolar was present in the mandible, the individual was deemed juvenile and 1 year of age at the most, even if the first molar had fully erupted. On the other hand, if the first two molars had erupted but the third molar was still in the process of eruption, then the specimen was categorized as subadult and ascribed the age of roughly 1.5 years. The unit of our estimations is years, not months, not only because the QCHM method uses years, but also because in the mortality profiles, all the individuals in the first 2 years of their life are binned into a single category.
In fossil populations, the age profile is always a mortality profile (dx) if there are attritional factors involved in the death of the individuals. Accidents, predation, disease, and other common factors are considered attritional and have their largest impact on very young and very old individuals, and as such, the mortality profile is usually U-shaped. By contrast, if a fossil population died due to a catastrophic event such as a flood or a volcanic eruption, then the age profile represents the original living structure of a population, resulting in an L-shaped mortality profile (Klein and Cruz-Uribe Reference Klein and Cruz-Uribe1983). Thus, the shape of the mortality indicates whether a profile is catastrophic or attritional for species in which the females have a maximum of one offspring per year. In catastrophic L-shaped profiles, most individuals are prime adults, while in attritional U-shaped mortality profiles, most of the individuals are either juveniles or old. There are exceptions of course, or cases, where one cannot differentiate between the two (Caughley Reference Caughley1966; Klein and Cruz-Uribe Reference Klein and Cruz-Uribe1983; Stiner Reference Stiner1994; Gaillard et al. Reference Gaillard, Festa-Bianchet and Yoccoz1998; Kubo et al. Reference Kubo, Fujita, Matsu’ura, Kondo and Suwa2011). In our case, because the specimens are derived from different localities in Java, no matter the shape of the resulting profiles, they cannot be catastrophic. So, it is worth mentioning here that even L-shaped profiles can be attritional, thanks to demographic and population characteristics, and are often linked to the cumulative effect of predation (Stiner Reference Stiner1994; Discamps and Costamagno Reference Discamps and Costamagno2015).
Another way in which life tables can yield information is in the form a survivorship curve. Survivability (lx) describes the probability of an individual surviving to a particular age. The ages of the individuals are placed in the y-axis and can be grouped into cohorts of two, while on the x-axis, the number of survivors is usually expressed on a logarithmic scale (Caughley Reference Caughley1966). The y-axis can also be described as a percentage of an animal’s maximum life span. Pianka (Reference Pianka2000) describes the three general types of survivorship curves: type I survivorship, which is a result of low mortality up until a certain age after which mortality increases; type II survivorship, which is generally described as having relatively constant death rates throughout the population’s life span; and type III survivorship, which is described as having very low juvenile survivability and low mortality afterward.
Results
For the linear measurements, the age estimations, the mortality rates, and survivability curves, see Supplementary Material.
Axis lydekkeri Mortality Profiles and Mortality Curve
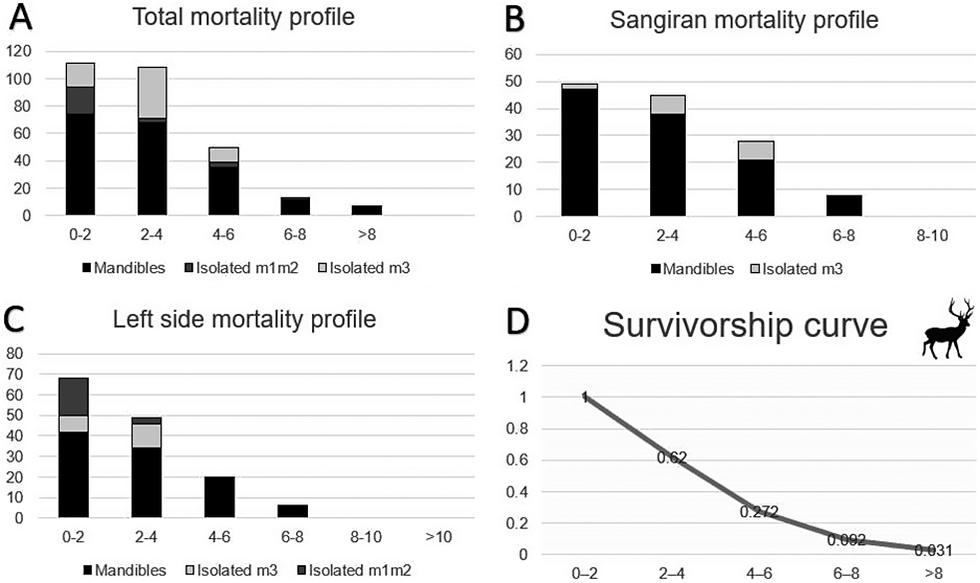
Results from the age estimations are grouped in cohorts as follows: Group I: ages 0–2 years; Group II: ages 2–4 years; Group III: ages 4–6 years; Group IV: ages 6–8 years; Group V: ages older than 8 years. These groupings differentiate between young, adult, mature, and older individuals. The five age groups from young (ages 0–2 years) to senile (over 8 years of age), with age expressed as Cervus elaphus years, are represented on the x-axis, while the number of individuals that died at a certain age is given on the y-axis (Figs. 4, 5).
Stacked bar charts of mortality profiles: A, total mandibles and isolated molars; B, mandibles and isolated third molars from Sangiran; and C, left-side mandibles and isolated molars); and D, the survivorship curve of Axis lydekkeri showing an L-shaped, attritional mortality pattern, with one peak dominating for the first two age groups. On the x-axis are the age groups counted in RDY (Red Deer Years) and on the y-axis is the number of individuals.

Figure 4. Long description
The figure consists of four panels labeled A through D.
Panel A, Total mortality profile, is a stacked bar chart. The y-axis represents the number of individuals from 0 to 120. The x-axis shows age groups 0-2, 2-4, 4-6, 6-8, and greater than 8 R D Y. The bars are composed of Mandibles (black), Isolated m 1 m 2 (dark gray), and Isolated m 3 (light gray). The highest frequency is in the 0-2 and 2-4 age groups, both exceeding 100 individuals, with a sharp decline in older groups.
Panel B, Sangiran mortality profile, uses a y-axis from 0 to 60. It includes Mandibles and Isolated m 3. The 0-2 group is the highest at approximately 50 individuals, followed by a steady decrease across 2-4, 4-6, and 6-8 groups, with zero individuals in the 8-10 group.
Panel C, Left side mortality profile, uses a y-axis from 0 to 80. It includes Mandibles, Isolated m 3, and Isolated m 1 m 2. The 0-2 group peaks at nearly 70 individuals. The frequency decreases through the 2-4, 4-6, and 6-8 groups, reaching zero by the 8-10 and greater than 10 groups.
Panel D, Survivorship curve, is a line graph with a y-axis from 0 to 1.2 and an x-axis of age groups. The curve starts at 1 for the 0-2 group and drops to 0.62 for 2-4, 0.272 for 4-6, 0.092 for 6-8, and 0.031 for the greater than 8 group, illustrating an L-shaped attritional pattern. A silhouette of a deer is positioned in the top right corner.
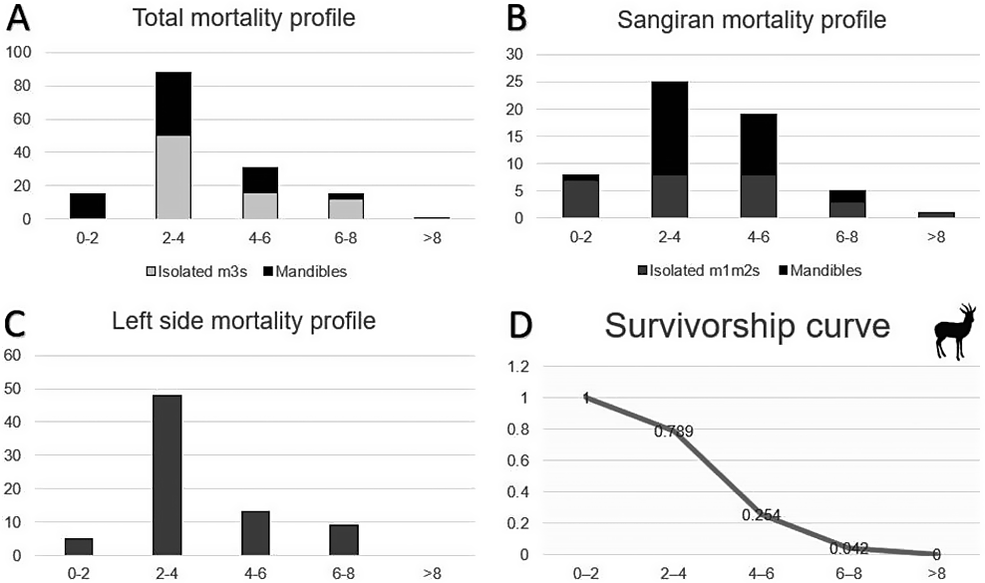
Stacked bar charts of the mortality profiles: A, total mandibles and isolated third molars; B, mandibles and isolated first and/or second molars from Sangiran; and C, left-side mandibles and isolated third molars; and D, survivorship curve of Duboisia santeng from the Pleistocene of Java. Age groups are counted in GY (Goat Years) on the x-axis, with the number of individuals on the y-axis. All the mortalities show a peak in the second age class (2–4 GY, prime adults).

Figure 5. Long description
The image consists of four panels labeled A through D. All panels share an x-axis representing age groups in G Y (Goat Years) with intervals 0-2, 2-4, 4-6, 6-8, and greater than 8.
Panel A, Total mortality profile: A stacked bar chart with a y-axis from 0 to 100. It compares Isolated m 3s (light gray) and Mandibles (black). The 2-4 G Y group shows the highest peak with approximately 50 isolated m 3s and 40 mandibles, totaling nearly 90 individuals. Other age groups show significantly lower counts.
Panel B, Sangiran mortality profile: A stacked bar chart with a y-axis from 0 to 30. It compares Isolated m 1 m 2s (dark gray) and Mandibles (black). The peak is at 2-4 G Y with 25 individuals, followed by 4-6 G Y with nearly 20 individuals.
Panel C, Left side mortality profile: A single-color bar chart with a y-axis from 0 to 60. The 2-4 G Y age group dominates with nearly 50 individuals, while other groups remain below 15.
Panel D, Survivorship curve: A line graph with a y-axis from 0 to 1.2. The curve starts at 1 for the 0-2 G Y group, drops to 0.789 at 2-4 G Y, falls sharply to 0.254 at 4-6 G Y, reaches 0.042 at 6-8 G Y, and ends at 0 for the greater than 8 group. A silhouette of a horned ungulate is in the top right corner.
Mortality profiles were calculated using age estimations based on hemi-mandibles and isolated molars. In total, eight mortality profiles were reconstructed to test for possible discrepancies: for mandibles only, for isolated first and/or second molars, for isolated third molars, for mandibles and isolated third molars from the locality of Sangiran (both separate and combined), and finally, for left-side hemi-mandibles and isolated molar specimens combined. Later, these profiles were combined as stacked bar charts, with different shades of gray representing different mortality profiles. The mortality profile made solely by mandibles is based on a total of 195 individuals and is L-shaped (black color of the stacked bar chart, Fig. 4). More than 70 specimens belong to the youngest age group (Group I) and fewer than 10 specimens to the oldest age group (Group V). Axis lydekkeri shows high death rates in the first 4 years, after which mortality drops significantly for years 4 to 6 and continues to decrease up until 8 or more years. Within the first age group, 15 mandibles belong to juvenile or subadult individuals, while the rest were classified as adults based on tooth eruption pattern, yet still produced a young age estimation based on crown height.
Duboisia santeng Mortality Profiles and Mortality Curve
For Duboisia santeng, a total of eight mortality profiles were calculated, as in the case of A. lydekkeri: one based on age estimations from hemi-mandibles, one for isolated first and/or second molars, two for isolated third molars (unspecified locality and Sangiran exclusive), and several for mandibles and isolated third molars from the locality of Sangiran and for left-side specimens exclusively (see Supplementary Material). The results are slightly different this time. Out of the total of 71 individuals, the majority (38 individuals) fall in the second age cohort, with 38 individuals (black color of the stacked bar chart, Fig. 5). The age group with the lowest mortality is Group IV (ages 6–8 years), while past that age, there are no individuals. The mortality profile is attritional, as in A. lydekkeri, but not as clearly as L-shaped, although it falls under that category.
However, there is again, as with the deer, a slight difference in the mortality profiles calculated by isolated third molar age estimations (indicated with light gray color on the stacked bar chart, Fig. 5), as 50 out of the 79 isolated third molars belong to the second age group (ages 2–4 years). As before this is probably due to the late eruption of m3. Third molars in goats ( Capra hircus ) erupt around 2 years of age and the tooth is already in wear before being fully erupted, hence the absence of the first age group when only taking into account the isolated third molars. The mortality profile for D. santeng here is L-shaped, with a continuous decrease in mortality and with one specimen producing an estimated age above 8 GY. On the other hand, the mortality profile based on age estimations of the first and second molar (see Supplementary Material), shows a more constant state of mortality, not being L-shaped like the rest of the profiles, but this might be due to the small sample size. Despite the reduced reliability of age estimations based on isolated molars, they were necessary here to increase the sample size for life-history data. The mortality profiles resulting from the combined profiles based on mandible and isolated molars show a less pronounced L-shaped pattern (Fig. 5).
Discussion
Regarding the age estimations following the QCHM, there are a couple of issues that need to be addressed. First, the QCHM produces various age estimations for the same specimen. For example, out of the 22 mandibles of Duboisia santeng with both m2 and m3 preserved, for 12 of them, the age estimation based on m3 was higher than the one based on m2. This is against expectations, because m2 erupts earlier and should thus be more worn. In parallel, in only 10 out of the 27 mandibles of D. santeng with both m1 and m2 still preserved, m1 resulted in the older age estimation, which means that m2 produces the older age estimation with relative consistency. This was clearly the case with the deer as well, with 42 out of the 62 mandibles with both molars present; the m3 produced a younger age estimation than the m2 did for the same specimen. Comparing the first and the second molar age estimations of the same specimen, m2 proved again to give the older age in 67 mandibles out of a total of 82. Crown height thus influences the result of the formula much more than the age of eruption, and as such, the worn crown height/unworn crown height ratio is the most powerful component of the QCHM formula. In addition, m2 repeatedly produces the older age estimation, an observation that puts in question results being supported solely by age estimations of isolated molars.
There are also other known issues with the age estimations of the QCHM. More specifically, the formula may need adjustments and modifications, especially so for bovids and when using third molars (Klein and Cruz-Uribe Reference Klein and Cruz-Uribe1983; Gifford-Gonzalez Reference Gifford-Gonzalez1991; Ruscillo Reference Ruscillo2006; Steele and Weaver Reference Steele and Weaver2012; Gaastra Reference Gaastra2016). Τhe QCHM is less reliable in small bovids than in cervids, and the third molar appears not to follow a quadratic rate of age-related wear (Steele and Weaver Reference Steele and Weaver2012; Gaastra Reference Gaastra2016). This is also the case here, where the QCHM both underestimates and overestimates the age of the specimens in both species. In short, the less worn a tooth is, the more the formula underestimates the age, while conversely, the more worn the molar is, the more the formula overestimates the individual’s age. This observation reinforces the idea of using an average based on each molar of the mandible as a final age estimation, even more so because this procedure reduces the error caused by differences in age of eruption, rate of wear, and the formula itself. Steele and Weaver (Reference Steele and Weaver2012) updated the formula and changed the exponent of QCHM for each molariform tooth using power law curve fit. For D. santeng and Axis lydekkeri, these adjustments seem to not work, as they either gave ages below zero as results or an extreme overabundance of young, subadult individuals. A different method, the Linear Crown Height Method (LCHM) developed by Ducos (Reference Ducos1988, Reference Ducos2000), uses the crown height as measured on the lingual side of the tooth from the bifurcation of the roots to the highest point of the anterior cusp. The LCHM is better suited for isolated teeth of younger individuals specifically, as it fails to produce reliable results (or no results at all) for prime and older individuals, making it unsuitable for this research. Therefore, the classic QCHM was preferred here, even though it has the tendency to overestimate the age of older individuals.
Potential ecological longevity is another important factor of the QCHM, but maximum life span is nigh impossible to calculate on fossil species, so we must infer such information from close living relatives. In relation to A. lydekkeri, Cervus elaphus can live up to 25 years in captivity and 20 years in the wild (Grzimek Reference Grzimek1990), while the average life span of Axis porcinus, which is approximately the same size as A. lydekkeri and is closely related, is 10 years under both conditions (Michelin Reference Michelin2002). Therefore, theoretically, Lydekker’s deer may have lived up to 10 or 13 years, with faster tooth eruption, as indicated by the age estimations produced by the QCHM, or a lower wear rate (more durable teeth or softer food), but a more precise method of aging (other than the QCHM) is needed to differentiate between the two scenarios. The same applies to D. santeng, for whose closest similarly sized living relative is Tetracerus quadricornis, which has an average life span of 10 years. This differs 2 years from the maximum life span of Capra hircus, which is 8 years and is used in the QCHM for D. santeng. Taking that fact into account, the maximum life span of 8 C. hircus years produced by the QCHM for Duboisia seems more logical.
Overestimating individual age might not necessarily be a methodological artifact, because a prolonged life span is to be expected for island dwellers, which our focal species were before Java became connected to the mainland during the early Chabanian. Specifically in ruminants, higher crown height is directly related to an increase in potential ecological longevity. Tooth wear is, after all, a major cause of death in herbivores due to severe malnutrition or starvation. This is supported by the findings of Jordana et al. (Reference Jordana, Marín-Moratalla, DeMiguel, Kaiser and Köhler2012) regarding the extremely hypsodont and long-living insular dwarf bovid Myotragus balearicus of Late Pleistocene–Holocene Mallorca (Spain). This is also in line with the life-history theory, which predicts that under conditions with low extrinsic mortality and limited resource availability (as is the case in typical insular environments), populations switch from novelty to efficiency and opt into a maintenance phenotype to minimize costs (Geist Reference Geist1998).
Regardless of the type of isolated molar, the resulting mortality profiles of A. lydekkeri, combining data from both mandibles and isolated teeth (Figs. 4, 5), show a clear L-shaped pattern, representing a living population, although as established before, the profiles cannot be considered catastrophic. The resulting graph of survivorship based on the mandible mortality profile is considered a mixed situation between type II and type III survivorship curves, not atypical of ungulates subjected to environmental stress with possible anthropogenic pressures and predation. Compared with the profiles obtained for the dwarf deer (Candiacervus ropalophorus and Candiacervus sp. II) of Late Pleistocene Crete, Greece (van der Geer et al. Reference van der Geer, Lyras, MacPhee, Lomolino and Drinia2014) and for sika deer (Cervus nippon) of Kinkazan Island, Japan (Minami et al. Reference Minami, Ohnishi, Higuchi and Takatsuki2009), the similarity in juvenile mortality is obvious, while there are also similarities when comparing the survivorships of A. lydekkeri and the extant sika deer of Hokkaido, Japan (Hayashi et al. Reference Hayashi, Kubo, Sánchez-Villagra, Taruno, Izawa, Shiroma, Nakano and Fujita2023). The main difference between the aforementioned mortality patterns of island deer populations on the one side, and those of mainland ungulate populations of South Africa as presented by Klein and Cruz-Uribe (Reference Klein and Cruz-Uribe1983) on the other, is that a second peak is absent in the mainland ungulate populations. The profiles presented here therefore have closer similarities with the mainland ungulate mortalities, which is not unexpected, because Java had several larger mammalian predators during the middle Pleistocene, including tigers, hyenas, and canids (van der Geer et al. Reference van der Geer, Lyras and Volmer2018). While there is a high rate of juvenile mortality in all these ungulate populations, even if the younger age classes are underrepresented, as in the South African and Javanese populations, there is a clear pattern of the number of older individuals decreasing progressively. All of these profiles are attritional, albeit separated by both time and space, so some cautionary conclusions can be drawn about life-history traits of endemic deer species.
The L-shaped signal is repeated in all reconstructed A. lydekkeri mortality profiles, with one exception: the mortalities based on isolated third molars. This profile has an attritional signature, with more than 50 of the 65 specimens belonging to the two youngest age groups (indicated with light gray color on the stacked bar chart, Fig. 4). What is noteworthy here is that, first, the peak is in the second age group, and second, there is an absence of individuals past the age of 6 RDY. The first point is an artifact, because third molars are the last teeth to erupt, and so the youngest age is always missing when provided with data of third molars only. As for the second point, there are two explanations: one is that the QCHM fails to produce reliable age estimations for older individuals based on isolated third molars only (e.g., due to delayed eruption or reduced abrasion), or alternatively, isolated senile third molars were undersampled (e.g., due to fragmentation).
Juveniles are expected to be underrepresented in the fossil record because their teeth and bones are more fragile and weather faster than those of adults, especially with carnivore activity. In their study, Klein and Cruz-Uribe (Reference Klein and Cruz-Uribe1983) mention that lions prey mainly on very young zebras, buffalos, and chamois, which they devour wholly and quickly without leaving any remains. However, juvenile mortality is as high in insular ruminants as in continental relatives, which might indicate that predation plays a more modest role in ruminant juvenile mortality than generally thought and that other factors such as malnutrition, diseases, and accidents are sufficient to explain such high mortality (van der Geer et al. Reference van der Geer2014). As stated by Caughley (Reference Caughley1966), Klein (Reference Klein1981–1982), Minami et al. (Reference Minami, Ohnishi, Higuchi and Takatsuki2009), and van der Geer et al. (Reference van der Geer2014), despite the absence of predators, juvenile deaths remain frequent, even when being underrepresented in burials. Instead, for most of the ungulate fawns and calves, the main causes of death are starvation, accidents, diseases, and low neonatal body weight, the last of which can be more pronounced in island dwarf populations, meaning it is difficult to come to any reliable conclusion in regard to possible cause of death by studying mortality profiles alone. What can be said, though, is that once the individual makes it into maturity, its survival rate increases. By contrast, when there is human hunting activity on an ungulate population, there is oftentimes, but not necessarily, an increase in mortality for the middle-aged classes, because younger individuals are targeted less, as they provide fewer resources, and they also make for poor trophies, resulting in a more catastrophic-looking profile, with high mortality of prime-age classes. Inter alia, this is also why human activity accelerates extinction rates, as reproductively active age classes are responsible for the birth rates of a population, and without them, population numbers are in decline (Stiner Reference Stiner1994). Finally, in attritional profiles, the second peak might be absent due to sampling bias.
The survivorship curve for A. lydekkeri (Fig. 4) shows that the lowest death rates appear after the animal reaches its sixth year and onward (in RDY), meaning that there is a survival advantage for older individuals, potentially indicating a tendency toward a slow life. The survivorship curve is similar to the one for the sika deer populations of Hokkaido Island (Japan) provided by Hayashi et al. (Reference Hayashi, Kubo, Sánchez-Villagra, Taruno, Izawa, Shiroma, Nakano and Fujita2023), but different from the other survivorships they provided. Hayashi et al. (Reference Hayashi, Kubo, Sánchez-Villagra, Taruno, Izawa, Shiroma, Nakano and Fujita2023) state that based on life-history traits, the populations of sika deer of Hokkaido and Honshu display a more gradual shift toward maintenance strategy, rather than an extreme one; this is because, although the Japanese Archipelago consists of islands in the biogeographic sense, the Japanese deer populations may not be under strong insular influence. So, although endemic, Lydekker’s deer seem to possibly also be displaying a more gradual shift toward a maintenance strategy, which was never truly realized, because the Sunda Shelf, which Java was part of, maintained a landmass that was constantly above sea level until the mid-Chabanian and, after that, during glacial periods (Sarr et al. Reference Sarr, Husson, Sepulchre, Pastier, Pedoja, Elliot, Arias-Ruiz, Solihuddin, Aribowo and Susilohadi2019; Husson et al. Reference Husson, Boucher, Sarr, Sepulchre and Cahyarini2020; Berghuis et al. Reference Berghuis, van den Bergh, van Kolfschoten, Wibowo, Kurniawan, Adhityatama and Sutisna2025). This suggests that late sexual maturity and increased survivability of older individuals in combination with predominant death rates of juveniles are at least some of the characteristics of endemic, slow life in insular ungulates. That is a common survival tactic of endemic herbivores, whereby a combination of a fast reproductive rate with a slow life can keep extinction rates low (van der Geer et al. Reference van der Geer2014; Hayashi et al. Reference Hayashi, Kubo, Sánchez-Villagra, Taruno, Izawa, Shiroma, Nakano and Fujita2023). Theoretically, the somewhat slower life in A. lydekkeri may be a trait retained from its insular past (early Pleistocene or Gelasian); also, it may eventually have increased its extinction risk when competing with new arrivals with a faster life.
For the mortality profile of D. santeng, there are some notable similarities with the ones published by Klein (Reference Klein1981–1982) and Klein and Cruz-Uribe (Reference Klein and Cruz-Uribe1983) for African ungulates under predation pressures and Koike and Ohtaishi (Reference Koike and Ohtaishi1987) for Japanese sika deer affected by hunting. Duboisia santeng’s mortality resembles the attritional profiles of Pelorovis from Elandsfontein of South Africa from Klein (Reference Klein1981–1982; original data by Singer and Wymer Reference Singer and Wymer1968), and that of Raphicerus sp. of the same locality. What all these profiles have in common is that they represent L-shaped attritional mortality profiles of free-ranging herbivores that are predominantly grazers that form small groups and are preyed upon by predators and hominin hunters. Other mortality profiles that bear similarity with those of Java’s Duboisia are those of sika deer from 14 archaeological sites of prehistoric Japan (Koike and Ohtaishi Reference Koike and Ohtaishi1987), showing the influence of human hunting on deer mortality. Interestingly, it seems that hunting by humans results in constant, high mortalities in individuals of middle-aged classes, while predation results in more pronounced death rates of juvenile and young adults.
In contrast to what we have seen for of A. lydekkeri, there is a rise in mortality of young adult individuals (ages 2–4) for D. santeng, while the number of deaths for the prime-age individuals (ages 4–6) are the same as for the young ones (aged 0–2). In the profiles that are based on hemi-mandible age estimations in particular, the mortality rate does not clearly reduce with an increase in age. Mortality increases from the first age group to the second in D. santeng, before being reduced again from age 4 onward. And while nearly every mortality profile of A. lydekkeri shows a steady decrease in mortality the older the animal gets, D. santeng’s mortality seems to be constant throughout ages 4 to 8. Middle-aged individuals are generally targeted preferentially by human hunting activity, and Koike and Ohtaishi (Reference Koike and Ohtaishi1987) illustrate this by comparing the two survivorship curves of hunted versus non-hunted populations of deer in Hokkaido (Japan). In our case, this is indicated by a steeper slope in the survivorship curve for the bovid, when compared with that of the deer. This could suggest that D. santeng was a potential target of Homo erectus hunting activity, as hunting pressure is usually aimed at the young and prime adults. The expectation would be for both profiles to have the same mortality pattern, because they are both endemic ruminants, but this seems not to be the case. We can only speculate here about the social behavior of our focal species, but in general, bovids usually form larger herds than deer do, while deer often form smaller groups with family members (Stiner Reference Stiner1994). Another difference that may explain part of the differences in mortality patterns between the bovid and the deer is the feeding habits of these animals. Most bovids are grazers or mixed feeders of open spaces, while deer are browsers or mixed feeders in a more closed environment (Wilson and Reeder Reference Wilson and Reeder1993). But again, our data are insufficient to show if this was the case here as well. If so, then this could be an additional reason why D. santeng more easily fell victim to the many predators of Java during the middle Pleistocene, including tigers, hyenas, sabertoothed cats, and canids (Volmer et al. Reference Volmer, Hertler and van der Geer2016, Reference Volmer, van der Geer, Cabera, Wibowo and Kumiawan2019; van der Geer et al. Reference van der Geer, Lyras and Volmer2018; Qigao et al. Reference Qigao, van der Geer, Volmer, Hertler, Li, Guo, Wang and Deng2025).
On the other hand, Rozzi et al. (Reference Rozzi, Winkler, de Vos, Schulz and Palombo2013) provided evidence from mesowear analyses as well as morphological comparisons of D. santeng’s locomotion that point toward it being probably more suited to be a forest dweller. However, when different species share the same dietary preference and habitat, they rarely share the same ecological niches in order to avoid competition. Therefore, Lydekker’s deer may have inhabited a deeper part of the rainforest, with D. santeng living more at the edge of the forest canopy, which made it more vulnerable to Java’s predators and human hunters. But again, this is speculative at the moment; to confirm this scenario, further study is needed, such as stable isotope analysis to investigate diet, migration pattern, and water sources.
Conclusions
This is, to our knowledge, the first study on aspects of the life history of the deer Axis lydekkeri and the bovid Duboisia santeng from the middle Pleistocene of Java. Life-history studies of endemic species are important to understand their life strategies and ecology. Here we investigated mortality profiles based on individual age estimations from tooth wear rate (applying the Quadratic Crown Height Method) and from tooth eruption patterns.
The second lower molar produced higher age estimations with relative consistency. The mortality profiles for both species are attritional and L-shaped, with high juvenile mortality, while the mortality curves show an increase in survivability as age increases. The profiles produced by the current datasets show at most a weak insular influence on life history, indicated as a mild adaptation toward a slower life, which is a characteristic of several insular species, because resource limitation under reduced predation pressure lead to maintenance life-history strategies. On the contrary, both fossil species seem to share more similarities concerning life-history strategies with their mainland counterparts of comparable size, which is to be expected, because the flooding of the Sunda Shelf only started to occur during the Chibanian.
The most important difference in the mortality profiles of the two ruminants is that D. santeng’s profile maintained a rather constant mortality throughout all the age groups, with the exception of the rise in mortality of the second age group, while that of A. lydekkeri shows a gradual decrease in mortality from one age group to the next. We hypothesize that the bovid was probably targeted more by predators and human hunters than the deer was, because of its assumed higher gregariousness, but also in relation to its habitat and ecology. Late-early and middle Pleistocene Java was covered by forests fragmented by grasslands, and although both species appear to have been forest dwellers (based on dietary ecology), the bovid may have preferred a more open environment, such as forest edges, than the deer, making it more susceptible to becoming prey. Our results agree with those of others that show some endemic ungulate populations undergo only marginal insularity effects as far as life-history traits are concerned and instead showcase more pronounced similarities with continental counterparts. The indication of a mild change toward a slower life may theoretically be a remnant trait from the early Pleistocene, when Java still was an island, and the fauna highly impoverished. This in turn may have accelerated their eventual demise when competing with new arrivals.
Acknowledgments
This research was supported by Naturalis Biodiversity Center and the Aristotle University of Thessaloniki. The authors are grateful to Natasja den Ouden for providing access to the specimens and E.T. thanks M. Rücklin for hosting him at his research group. We would also like to thank professors G. Lyras of the National and Kapodistrian University of Athens and D. S. Kostopoulos of the Aristotle University of Thessaloniki for their valuable consultation and advice they provided. We are thankful for the discussions with P. Skandalos and L. W. van den Hoek Ostende regarding the age estimation methods. Finally, we thank the three anonymous reviewers and the editor for their valuable comments and suggestions.
Competing Interests
The authors declare no competing interests.
Data Availability Statement
Data available from the Dryad Digital Repository: https://doi.org/10.5061/dryad.m0cfxppk3.

 Open access

