


1. Introduction
The conceptually simple process of a ball rolling down an inclined plane in a fluid has relevance to applications in industry (e.g. particle technology and separation processes), natural phenomena (e.g. sediment transport) and even sports. Several fundamental questions concerning this problem remain open in the literature. It is still not entirely clear which physical mechanisms allow the sphere to even move in the first place, and which parameters and interactions determine the limiting rolling speed, since lubrication theory predicts an infinite drag force for a vanishing gap between the ball and the wall. In this paper, the dynamics of the wake and the fluid–structure interaction of a sphere rolling without slipping down an inclined plane are explored through direct numerical simulations and experiments, and some of these issues will be addressed.
At low Reynolds numbers  $Re =Ud/\nu$, where $U$ is the translation velocity of the sphere relative to the fluid, $d$ is its diameter, and $\nu$ is the kinematic viscosity of the fluid, the flow around a stationary sphere placed in an unbounded domain remains steady and attached up to $Re\approx 20$ (Masliyah & Epstein Reference Masliyah and Epstein1970; Pruppacher, Le Clair & Hamielec Reference Pruppacher, Le Clair and Hamielec1970; Dennis & Walker Reference Dennis and Walker1971). After separation occurs, the recirculation zone in the wake has the form of an axisymmetric vortex ring, and its length grows as the logarithm of the Reynolds number (Taneda Reference Taneda1956). At $Re\approx 210$, the flow loses its axisymmetry and undergoes a supercritical transition to another steady state of planar symmetry, characterised by the development of a two-threaded wake consisting of counter-rotating streamwise vortices (Magarvey & Bishop Reference Magarvey and Bishop1961a; Tomboulides, Orszag & Karniadakis Reference Tomboulides, Orszag and Karniadakis1993; Johnson & Patel Reference Johnson and Patel1999; Tomboulides & Orszag Reference Tomboulides and Orszag2000; Thompson, Leweke & Provansal Reference Thompson, Leweke and Provansal2001a). At $Re\approx 270$, a periodic undulation in the asymmetric wake is observed, indicating the onset to unsteady flow via a supercritical Hopf bifurcation (Taneda Reference Taneda1956; Magarvey & Bishop Reference Magarvey and Bishop1961a; Sakamoto & Haniu Reference Sakamoto and Haniu1995; Thompson et al. Reference Thompson, Leweke and Provansal2001a; Schouveiler & Provansal Reference Schouveiler and Provansal2002). As $Re$ increases further, fully formed vortices that take the form of hairpins are shed periodically into the wake. Simulations by Mittal (Reference Mittal1999) predicted a second transition in the range $350< Re<425$, where the planar symmetry is broken and the hairpin vortices are shed with varying orientations. In experiments by Sakamoto & Haniu (Reference Sakamoto and Haniu1990), this transition does not appear until $Re=420$. Mittal (Reference Mittal1999) explained that this may be due to the fact that the variations in the azimuthal angle of vortex formation from cycle to cycle are relatively small close to the critical $Re$ and can be overlooked in smoke or dye visualisations.
In addition to flows associated with fixed spheres, there are many studies that have considered the fluid–structure interaction of free, elastically mounted or tethered spheres. In the former category, early studies by Magarvey & Bishop (Reference Magarvey and Bishop1961a,Reference Magarvey and Bishopb) examined sphere wake transitions in a liquid–liquid system, producing beautiful wake visualisations. Since then, there have been many detailed experimental and numerical investigations of solid, liquid or gas spheres rising or falling in a fluid medium. These include the studies of Jenny, Bouchet & Dusek (Reference Jenny, Bouchet and Dusek2003, Reference Jenny, Bouchet and Dusek2005), Veldhuis et al. (Reference Veldhuis, Biesheuvel, van Wijngaarden and Lohse2005), Veldhuis & Biesheuvel (Reference Veldhuis and Biesheuvel2007), Veldhuis, Biesheuvel & Lohse (Reference Veldhuis, Biesheuvel and Lohse2009), Horowitz & Williamson (Reference Horowitz and Williamson2010a,Reference Horowitz and Williamsonb) and Auguste & Magnaudet (Reference Auguste and Magnaudet2018), amongst many others. These document the sphere trajectory, wake structure and fluid forces, with the behaviour determined by the Galileo number and mass ratio. In terms of vortex-induced vibration of tethered or elastically mounted spheres, the studies of Govardhan & Williamson (Reference Govardhan and Williamson1997, Reference Govardhan and Williamson2005) and Jauvtis, Govardhan & Williamson (Reference Jauvtis, Govardhan and Williamson2001) have documented comprehensively the vortex-induced vibration (VIV) of 1 degree-of-freedom or tethered spheres of various mass ratios. More recently, Behara, Borazjani & Sotiropoulos (Reference Behara, Borazjani and Sotiropoulos2011) examined VIV of a 3 degrees-of-freedom elastically mounted sphere, numerically finding non-uniqueness in the vibration mode as a function of reduced velocity. Lee, Hourigan & Thompson (Reference Lee, Hourigan and Thompson2013) examined neutrally buoyant tethered spheres, showing that as the Reynolds number is increased above 800, sphere motion becomes circular, leading to a spiral wake. The effect of imposed sphere rotation for elastically mounted spheres was examined in a number of studies by Sareen et al. (Reference Sareen, Zhao, Sheridan, Hourigan and Thompson2018a,Reference Sareen, Zhao, Lo Jacono, Sheridan, Hourigan and Thompsonb) and Rajamuni, Thompson & Hourigan (Reference Rajamuni, Thompson and Hourigan2018), showing that constant rotation leads to reduced vibration, unlike the response seen for a circular cylinder.
Amongst the studies conducted on spheres moving near boundaries are the works of Cherukat & McLaughlin (Reference Cherukat and McLaughlin1994), restricted to the Stokes regime, and Zeng, Balachandar & Fischer (Reference Zeng, Balachandar and Fischer2005), who considered a sphere translating along a wall at a distance of 0.25 sphere diameters or greater. The transition to unsteadiness was found to occur earlier than for an isolated sphere, and the critical  $Re$ decreases as the distance to the wall is reduced, with a sudden increase at $0.25d$. The unsteady flow again takes the form of hairpin vortices and loops in the wake. Zeng et al. (Reference Zeng, Balachandar and Fischer2005) find that the wall has two opposing effects on the flow stability: the first is a viscous one acting to delay the transition to unsteady flow, and the second tends to destabilise the flow and is due to the asymmetry in the wake. When the sphere is free to rotate, the torque induced by the presence of the wall leads in general to a rotation in the prograde direction, which has little effect on the lift and drag forces.
Giacobello, Ooi & Balachandar (Reference Giacobello, Ooi and Balachandar2009) conducted a numerical study of a transversely rotating sphere in a free stream (i.e. far from a wall), for non-dimensional rotation rates  $\alpha =\omega d/(2U)$ (where $\omega$ is the angular velocity of the sphere) in the range $0\le \alpha \le 1$. They showed that the transition to the steady double-threaded wake occurred at $Re=100$, and the transition to unsteady vortex shedding at $Re=250$, for $\alpha \ge 0.08$. Additionally, they found that the shedding was suppressed for $\alpha \ge 0.50$ at $Re=300$.
More recent studies (Zeng et al. Reference Zeng, Najjar, Balachandar and Fischer2009; Stewart et al. Reference Stewart, Thompson, Leweke and Hourigan2010b; Rao et al. Reference Rao, Passaggia, Bolnot, Thompson, Leweke and Hourigan2012) have considered the stability of the wake and the dynamics of the flow around spheres translating and rotating very close to a wall (gap size  $0.005d$) at moderate Reynolds numbers, in the range 10–1000, covering both steady and unsteady regimes. These studies show that the wall and the imposed body rotation have a great impact on the wake structures and instabilities. For $\alpha >0$, a compact zone of recirculating fluid is created and the unsteady flow is marked by the shedding of hairpin vortices. For $\alpha <0$, a streamwise vortex pair appears in the wake, and as $Re$ is increased, the wake undergoes a transition to an antisymmetric mode.
For the forward-rolling sphere with  $\alpha =1$, Stewart et al. (Reference Stewart, Thompson, Leweke and Hourigan2010b) showed experimentally that the wake remains attached and steady for $Re<125$, and has a structure similar to that of an isolated sphere, with a double-threaded wake of counter-rotating vortices. The transition to unsteady, periodic flow, still with planar symmetry, occurred between $Re=125$ and $Re=150$. Through direct numerical simulations, Rao et al. (Reference Rao, Passaggia, Bolnot, Thompson, Leweke and Hourigan2012) determined the critical Reynolds number for the unsteady transition to be $Re_c=139$, and identified a second transition at $Re=192$ to asymmetric unsteady flow, where the wake exhibits oscillations in the lateral directions. Both transitions were classified as supercritical. An overview of the wake structures and transitions of a sphere moving near a wall is given by Thompson, Leweke & Hourigan (Reference Thompson, Leweke and Hourigan2021).
Using a coupled lattice-Boltzmann/detached eddy technique, Zhang et al. (Reference Zhang, Soga, Kumar, Sun and Jin2017) showed that the presence of the wall generates a net lift force on the sphere, which is determined primarily by the vortex structures in the wake, and that enhanced rolling destabilises these vortices and causes the sphere to exhibit an oscillatory behaviour in the translational direction. In their study, the fluid viscosity and slope angles were varied, whereas the diameter of the sphere and the densities of the fluid and the sphere were constant.
Analytical works concerning the flow around a sphere near a wall and the associated fluid forces include the studies of Dean & O'Neill (Reference Dean and O'Neill1963) and O'Neill (Reference O'Neill1964), who solved the Stokes equations for a sphere rotating around an axis parallel to the wall, and a sphere translating along a wall without rotation, respectively. Goldman, Cox & Brenner (Reference Goldman, Cox and Brenner1967) later validated these results, after having made some corrections to the numerical procedure of Dean & O'Neill (Reference Dean and O'Neill1963). Since the numerical results converged poorly for very small gap sizes  $G$ (less than 0.002 $d$), they developed asymptotic solutions for the limiting case of vanishing gap, showing that the local flow can be described accurately by lubrication theory. This theory predicts that the drag on a sphere rolling along a wall, both with perfectly smooth surfaces, in an incompressible Newtonian fluid diverges like $\ln (d/G)$ as the gap size approaches zero, due to the generation of a pressure peak increasing towards positive infinity in front of the body, and another peak decreasing towards negative infinity behind it. This implies that a sphere in contact with a solid surface would be impossible to move along this surface, which is contrary to common observation, and that any rolling or sliding motion along the wall would therefore involve a liquid film of finite thickness between the two, i.e. the absence of solid-to-solid contact. Since the predicted film thickness that would produce drag results compatible with experimental measurements (Carty Reference Carty1957) is of atomic dimensions, i.e. outside the range of validity of the flow model, Goldman et al. (Reference Goldman, Cox and Brenner1967) concluded that this model, based on lubrication flow of a fluid with constant properties between two smooth bodies, is insufficient to account for the data obtained in experiments on rolling spheres. Among the list of possible explanations for this discrepancy are non-Newtonian and compressibility effects, as well as cavitation, which may occur in a liquid when the pressure drops below the vapour pressure. Cavitation bubbles have indeed been found experimentally in the gap region of a rolling sphere in Stokes flow by Ashmore, del Pino & Mullin (Reference Ashmore, del Pino and Mullin2005). Surface roughness may also play a role in this problem, since it may lead to contact between the two solids, while at the same time providing an effective finite gap. This effect was discarded by Goldman et al. (Reference Goldman, Cox and Brenner1967), since the experimental data of Carty (Reference Carty1957) appeared to show no dependency on the roughness of the sphere. Further experimental measurements of the drag coefficient for spheres rolling down an incline were provided by Garde & Sethuraman (Reference Garde and Sethuraman1969), Jan & Shen (Reference Jan and Shen1995) and Wardhaugh & Williams (Reference Wardhaugh and Williams2014), which also revealed no evidence of a roughness effect. We will reconsider this aspect in the present paper.
In this study, we investigate numerically and experimentally the fluid–structure interactions that occur when a sphere rolls under gravity on an inclined plane. The next section describes the problem set-up and the governing equations and parameters for the fluid flow and sphere motion. The numerical and experimental methodologies employed are explained in § 3. The results are presented in detail in § 4, including flow structures from simulations and experiments, transitions between steady and unsteady states, and force coefficients, as well the characteristics of the flow-induced sphere oscillations in the unsteady regime. A discussion of the effects of surface roughness and gap size found in our study is also included. Conclusions are given in § 5.
2. Problem definition
We consider the configuration shown schematically in figure 1. A sphere of mass  $m_s$ and diameter $d$ is rolling (without slip) along a solid plane surface inclined by an angle $\theta$ with respect to the horizontal, driven by gravity (acceleration $g$), in a fluid of density $\rho$ at rest with respect to the wall. In the numerical simulations, the coordinate system $(x,y,z)$ moves with the sphere, its origin being at the sphere centre. The sphere can translate in the $x$- and $y$-directions with velocities $u_s$ and $v_s$. In the absence of slip, this leads to the angular velocities $\omega _y=(2/d)u_s$ and $\omega _x=-(2/d)v_s$. Assuming that the sphere stays in contact with the wall, its velocity in the $z$-direction is zero. The forces acting on the sphere include the fluid forces (drag $D_x$ and $D_y$, lift $L$, torques $T_x$, $T_y$, $T_z$), the mechanical reaction forces from the wall (normal force $N$, tangential forces $R_x$ and $R_y$) and gravity/buoyancy. The magnitude of the latter is $|m_s-m_f|\,g$, where $m_f=(1/6){\rm \pi} d^3\rho$ is the displaced fluid mass. When the mass (or density) ratio $\beta =m_s/m_f$ is greater than 1, the configuration represents the ‘standard’ situation of a sphere rolling down an inclined wall. When $\beta <1$, the problem corresponds to a positively buoyant sphere rolling up an inclined wall from underneath (see figure 1).

Figure 1. (a) Schematic of a sphere rolling along an inclined wall under gravity, including the various forces and torques acting on the body in the  $x$–
$x$– $z$ plane shown (see text). In addition, there are equivalent forces ( $R_y$, $D_y$) and viscous torques ( $T_x$, $T_z$) in the other two planes. Note that there is no restriction on the rotation about any axis, with the angular velocity vector given by ${\boldsymbol {\varOmega }} = (\omega _x, \omega _y, \omega _z)$. (b) The physical configurations for negatively and positively buoyant spheres.
2.1. Governing equations
The evolution equations for this problem are the continuity and Navier–Stokes equations for the motion of the fluid, along with the Newtonian laws of motion for the acceleration of the body. If  $\boldsymbol {u}$ is the velocity of the fluid, then the continuity equation for an incompressible flow is
 \begin{equation} \boldsymbol{\nabla}\boldsymbol{\cdot}\boldsymbol{u}=0, \end{equation}
and the Navier–Stokes equations in the (non-inertial) frame of reference attached to the sphere becomes
 \begin{equation} \frac{\partial\boldsymbol{u}}{\partial t} + \boldsymbol{u}\boldsymbol{\cdot}\boldsymbol{\nabla}\boldsymbol{u}=-\frac{1}{\rho}\,\boldsymbol{\nabla} p+\nu\,\nabla^2\boldsymbol{u}-\frac{\text{d} \boldsymbol{u}_s}{\text{d} t}, \end{equation}
where  $p$ is the pressure, and $\boldsymbol {u}_s=(u_s,v_s,0)$ is the sphere velocity.
The centre-of-mass sphere velocity and angular velocity vector are obtained by applying linear and angular momentum balance to provide the governing equations of motion for the sphere (see e.g. Baruh Reference Baruh1999):
 \begin{gather} m_s\,\frac{\text{d} \boldsymbol{u}_s}{\text{d} t} = \sum \boldsymbol{F}, \end{gather}
 \begin{gather} \boldsymbol{\mathsf{I}}_{\boldsymbol{\mathsf{G}}}\boldsymbol{\cdot}\frac{\text{d} {\boldsymbol{\varOmega}}}{\text{d} t} + {\boldsymbol{\varOmega}} \times (\boldsymbol{\mathsf{I}}_{\boldsymbol{\mathsf{G}}} \boldsymbol{\cdot} {\boldsymbol{\varOmega}}) = \sum \boldsymbol{M}_{{/}G}, \end{gather}
where  $\sum \boldsymbol {F}$ and $\sum \boldsymbol {M}_{/G}$ are the sums of all forces and moments plus torques about the centre of gravity, $G$, exerted on the sphere. Here, ${\boldsymbol {\varOmega }} = (\omega _x, \omega _y, \omega _z)$ is the angular velocity vector describing the rotation of the sphere about the three Cartesian coordinate axes, and $\boldsymbol{\mathsf{I}}_{\boldsymbol{\mathsf{G}}} $ is the moment of inertia tensor for a sphere about the centre of gravity, which is given by
 \begin{equation} \boldsymbol{\mathsf{I}}_{\boldsymbol{\mathsf{G}}} = \left[ \begin{array}{@{}ccc@{}} \dfrac{2}{5}\,m_s\left(\dfrac{d}{2}\right)^2 & 0 & 0 \\ 0 & \dfrac{2}{5}\,m_s\left(\dfrac{d}{2}\right)^2 & 0 \\ 0 & 0 & \dfrac{2}{5}\,m_s\left(\dfrac{d}{2}\right)^2 \end{array} \right]. \end{equation}
By considering the various forces and their moments together with the viscous torques sketched in figure 1, and using the fact that the sphere is rolling without slip to give
 \begin{equation} (u_s, v_s) = (\omega_y d/2, -\omega_x d/2) \end{equation}
(which also allows eliminating the wall reaction forces  $R_x$ and $R_y$), one obtains the following equations for the $x$- and $y$-components of the sphere acceleration:
 \begin{gather} \frac{\text{d} u_s}{\text{d} t}=\dfrac{5}{7m_s}\left[m_s\left(1-\dfrac{1}{\beta}\right)g\sin\theta -D_x+\dfrac{2}{d}\,T_y\right], \end{gather}
 \begin{gather} \dfrac{\text{d} v_s}{\text{d} t}=\dfrac{5}{7m_s}\left(D_y-\dfrac{2}{d}\,T_x\right). \end{gather}
In addition to its translation, the sphere can rotate around the  $z$-axis. Directly from (2.4), the corresponding component of the angular velocity, $\omega _z$, evolves according to
 \begin{equation} \dfrac{\text{d} \omega_z}{\text{d} t}=\dfrac{10}{m_sd^2}\,T_z. \end{equation}
2.2. Non-dimensional equations
Non-dimensionalisation of the above evolution equations is achieved in a way similar to that for the problem of a freely rolling cylinder studied by Houdroge et al. (Reference Houdroge, Leweke, Hourigan and Thompson2020). The specificity of these configurations is the absence of a prescribed velocity scale. The other problem parameters nevertheless allow the definition of a characteristic velocity, which can be used for normalisation. We first consider the acceleration scale  $a=|\beta -1|\,g\sin \theta$ relevant for this problem. One can then derive a velocity scale $V=\sqrt {(d/2)a}$ and a time scale $\tau =d/V$.
Using  $d$,
$d$,  $\tau$, $V$ and $\rho V^2$ as units of length, time, velocity and pressure, respectively, the continuity and Navier–Stokes equations can be rewritten in non-dimensional variables, denoted by an asterisk ( $^*$):
 $$\begin{gather} \boldsymbol{\nabla}^*\boldsymbol{\cdot} \boldsymbol{u}^*=0, \end{gather}$$
 $$\begin{gather}\dfrac{\partial\boldsymbol{u}^*}{\partial t^*}+\boldsymbol{u}^*\boldsymbol{\cdot}\boldsymbol{\nabla} ^*\boldsymbol{u}^*=-\boldsymbol{\nabla} ^*p^*+\dfrac{1}{Re^*}\,\boldsymbol{\nabla} ^{*2}\boldsymbol{u}^*-\dfrac{{\rm d}\boldsymbol{u}^*_s}{{\rm d}t^*}, \end{gather}$$
with the newly defined Reynolds number
 \begin{equation} Re^*=\dfrac{dV}{\nu}=\dfrac{1}{\nu}\,\sqrt{\dfrac{d^3}{2}\,|\beta-1|\,g\sin\theta}. \end{equation}
The non-dimensional forms of (2.7)–(2.9) for the motion of the sphere become
 \begin{gather} \frac{\text{d} u_s^*}{\text{d} t^*}= \dfrac{10}{7\beta}\left[1-\dfrac{3}{8}\,u_s^{*2}\left(C_{D,x}-C_{T,y}\right)\right], \end{gather}
 \begin{gather} \frac{\text{d} v_s^*}{\text{d} t^*}= \dfrac{15}{28}\,\dfrac{u_s^{*2}}{\beta}\left(C_{D,y}-C_{T,x}\right), \end{gather}
 \begin{gather} \frac{\text{d} \omega_z^*}{\text{d} t^*}= \dfrac{15}{4}\,\dfrac{u_s^{*2}}{\beta}\,C_{T,z}. \end{gather}
In this set of equations,  $C_D$ and $C_T$ are the non-dimensional drag and torque coefficients, defined as
 \begin{equation} C_D = D/\left[\frac{1}{2}\,{\rm \pi}\left(\frac{d}{2}\right)^2\rho u_s^2\right]\quad {\rm and} \quad C_T = T/\left[\frac{1}{2}\,{\rm \pi}\left(\frac{d}{2}\right)^3\rho u_s^2\right]. \end{equation}
The lift coefficient  $C_L$, which will also be discussed, is defined similarly to the drag coefficient.
The dynamics of the rolling sphere problem in the configuration considered here, governed by (2.10)–(2.15), depends on two parameters: the modified Reynolds number  $Re^*$, and the density ratio $\beta$. For comparison with cases where the sphere rolls with a fixed velocity, a Reynolds number based on the mean asymptotic velocity $\bar {u}_s$ is also used in the following: $\overline {Re}=\bar {u}_sd/\nu$.
The non-dimensional asymptotic sphere velocity is a function of the drag and torque coefficients, as can be seen by setting  $\text {d} u_s^*/\text {d} t^*=0$ in (2.13), and by considering time-averaged values:
 \begin{equation} \bar{u}_s^* = \left(\frac{8/3}{\bar{C}_{D,x}-\bar{C}_{T,y}}\right)^{1/2}. \end{equation}
The (squared) dimensional version of (2.17) leads to an expression for the effective mean drag coefficient  $\bar {C}'_D$, which includes the torque:
 \begin{equation} \bar{C}'_D = \bar{C}_{D,x}-\bar{C}_{T,y} = \frac{8}{3}\,\frac{1}{\bar{u}_s^2}\left[\frac{1}{\dfrac{d}{2}\,(\beta-1)g\sin \theta}\right]. \end{equation}
In both of these expressions, the overbars indicate time means once the system reaches its asymptotic state. This effective drag can be determined experimentally, from the measured mean velocity ( $\bar {u}_s$) of a sphere rolling down a plane, and the parameters of the given set-up ( $d$,
$d$,  $\beta$, $\theta$).
3. Methodology
3.1. Numerical scheme
The solver employed for the numerical simulations is based on code that has been tested and used extensively for studies of flows around bluff bodies, such as cylinders (Thompson, Leweke & Williamson Reference Thompson, Leweke and Williamson2001b; Ryan, Thompson & Hourigan Reference Ryan, Thompson and Hourigan2005, Reference Ryan, Thompson and Hourigan2007; Rao et al. Reference Rao, Stewart, Thompson, Leweke and Hourigan2011; Houdroge et al. Reference Houdroge, Leweke, Hourigan and Thompson2020) and spheres (Thompson et al. Reference Thompson, Leweke and Provansal2001a, Reference Thompson, Hourigan, Cheung and Leweke2006; Rao et al. Reference Rao, Passaggia, Bolnot, Thompson, Leweke and Hourigan2012; Lee et al. Reference Lee, Hourigan and Thompson2013), also including flow–structure interactions.
In summary, the time-dependent incompressible Navier–Stokes equations for the fluid are solved in a cylindrical domain, whose axis is perpendicular to the wall and passes through the sphere centre. A spectral-element approach is used in an azimuthal plane of the domain, together with a Fourier expansion in the azimuthal direction. The spectral-element method is a formulation of a finite-element method that uses high-order Lagrangian interpolants, together with an efficient Gauss–Legendre–Lobatto quadrature, to evaluate the integrals needed to approximate the solutions of the partial differential equations. It has the advantage of converging much faster than a typical fixed-order finite-element method, where the grid is refined to improve resolution, considering that the error decreases exponentially with the order of the approximating polynomial. It nevertheless retains some of the flexibility for modelling complex geometries that finite-element methods provide. The (nodal) approach adopted is described in detail in Karniadakis, Israeli & Orszag (Reference Karniadakis, Israeli and Orszag1991) and Thompson et al. (Reference Thompson, Hourigan, Cheung and Leweke2006). The spatially discretised equations are integrated forward in time using a three-step time-splitting approach, where the advection and solid-movement terms, the pressure and the diffusive terms are treated separately and sequentially, thus uncoupling the velocity and pressure terms in the Navier–Stokes equation and treating the problem as the solution of successive steps. When the body is rolling freely, its motion needs to be calculated simultaneously. This is best done in a fully coupled way, i.e. time stepping is iterative, in order to increase the stability (and accuracy) of the coupled solver, which is most important for small mass ratios.
More details about the numerical scheme and its implementation can be found in the literature cited above.
3.2. Boundary conditions
As indicated, the simulations are conducted in an accelerating frame of reference with its origin at the sphere centre of mass. The sphere is allowed to translate in the  $x$- and $y$-directions, with the $z$ (vertical) position fixed, and it is allowed to rotate about each of the moving-frame Cartesian axes. At the outer boundaries, including the top boundary and bottom rolling surface, the velocity vector is given by
 \begin{equation} (u, v, w) =- (u_s, v_s, 0). \end{equation}
Since the outer cylindrical boundary is situated  $150d$ from the cylinder centre, and the top boundary is positioned at $100d$, the imposition of Dirichlet velocity conditions should have a minimal effect on the wake flow near the sphere. On the sphere itself, the velocity is determined by the angular velocity vector defining the rotation of the sphere. Thus
 \begin{equation} (u, v, w) = (\omega_x, \omega_y, \omega_z) \times (x, y, z) \end{equation}
at each point on the surface. For all boundaries, higher-order Neumann pressure boundary conditions are used, as described in Karniadakis et al. (Reference Karniadakis, Israeli and Orszag1991) and Karniadakis & Sherwin (Reference Karniadakis and Sherwin1999), to maintain the formal temporal accuracy of the time-splitting scheme.
3.3. Mesh and resolution study
The cylindrical mesh used in the numerical study is illustrated in figure 2. It consists of macro-elements in the azimuthal plane ( $r$–
$r$– $z$), each with $N\times N$ internal nodes, and uses Fourier planes to represent the variation in the azimuthal direction ( $\varphi$) (Tomboulides & Orszag Reference Tomboulides and Orszag2000; Stewart et al. Reference Stewart, Thompson, Leweke and Hourigan2010a). It has increased resolution in the vicinity of the sphere and near the wall. In order to avoid a singularity in the mesh, a small gap is introduced at the contact point between the sphere and the wall, similar to the gap height considered by Stewart et al. (Reference Stewart, Thompson, Leweke and Hourigan2010a) and Rao et al. (Reference Rao, Passaggia, Bolnot, Thompson, Leweke and Hourigan2012). As shown in these studies, for gaps below 1 % of the diameter, the wake structure and transition behaviour are rather insensitive to the size of the gap. This is not true for the drag and viscous torque exerted on the sphere, which are known to be sensitive to the gap, as discussed above. Most of the numerical results presented in the following were obtained using gap size $G=0.005d$. This parameter was varied when analysing the comparison of experimental and numerical results concerning the drag force.

Figure 2. Schematic of the cylindrical mesh used in the simulations. On the left is a close-up view of the macro-elements near the sphere in the azimuthal plane.
A spatial and temporal resolution study was carried out by varying the number of nodes in each macro-element of the azimuthal plane, the number of Fourier planes in the azimuthal direction, and the time step. The Reynolds number was fixed at  $Re^*=241$, which corresponds to a Reynolds number based on the mean asymptotic rolling velocity of $\overline {Re}\approx 347$, and corresponds to the upper Reynolds number for which detailed comparisons with experiments were made. The range up to this value covers the first transitions found for a sphere rolling in a straight line, at $Re=139$ (steady $\rightarrow$ periodic) and at $Re=192$ (loss of planar symmetry) (Rao et al. Reference Rao, Passaggia, Bolnot, Thompson, Leweke and Hourigan2012). At $Re^*=241$, the wake evolves towards a chaotic state, hence the resolution study is conducted only over the first 30 time units, before small perturbations are amplified, which affects the further flow evolution. The parameter $\beta$ was chosen as $\beta =2.2$, in line with many of the runs in the experimental study. The reference mesh consisted of 1365 $4 \times 4$ macro-elements in the cross-azimuthal plane, and 144 Fourier planes. The reference time step was $\Delta t^* = 0.0064$.
Table 1 shows the results from the resolution study, where the maximum absolute differences in the rolling velocity, drag and torque relative to cases with finer spatial ( $r$–
$r$– $z$), azimuthal or temporal resolution are given at $t^* =10$. This comparison time was chosen so that the effect of weak chaos would not be a significant factor in the time histories deviating. In addition, figure 3 shows time traces of the sphere velocity, lift, drag and torque coefficients starting from rest, for different spatial and temporal resolutions.
Table 1. Results of the resolution study. The configuration is a sphere starting to roll from rest, for  $Re^*=241$ and $\beta =2.2$. The last three columns show the moduli of the differences in sphere velocity, and drag and torque coefficients at $t^* = 10$, with respect to the comparative finest resolution cases shown. This indicates that the temporal and spatial resolution chosen for the bulk of the simulations provides accuracy of considerably better than 1 %, for both velocities and force coefficients.


Figure 3. Sphere downslope velocity, drag and lift coefficient, and torque coefficient, as functions of time, starting from rest, for  $Re^* = 241$ and $\beta =2.2$. Variation with (a) nodes ( $N \times N$) within each macro-element, and number of Fourier planes ( $N_\varphi$), and (b) time step.
These results indicate that increasing the resolution, with respect to the reference case, leads to only minor modifications in the simulation predictions. For example, the maximum difference in the velocity, drag or torque between the finest resolution cases and the reference case is 0.1 %, indicating that the flow and fluid–structure interaction is well resolved. Therefore, the reference mesh and time step were used for the majority of the simulations. In some cases, a larger number of Fourier planes (up to 288) was used to obtain a better-resolved wake structure far downstream, since the azimuthal resolution deteriorates with increasing distance from the sphere in the polar grid. For most of the subsequent simulations described in the results sections, the velocity field after the first time step was perturbed using a white noise perturbation at a level of  $10^{-4}$ to accelerate the coupled fluid–structure evolution as the initially stationary sphere begins rolling down the slope.
3.4. Experiments
Experiments were conducted in two water tank facilities of similar dimensions. Figure 4(a) shows a schematic of the first set-up, located at IRPHE Marseille, which was used primarily for trajectory measurements and visualisations of the sphere wake. The tank has dimensions  $150 \times 38 \times 50$ cm $^3$ (length $\times$ width $\times$ height). The surface for the rolling sphere was provided by a Plexiglas plate measuring $100 \times 35 \times 2$ cm $^3$ (length $\times$ width $\times$ thickness) mounted on a sturdy aluminium frame. Its inclination angle could be varied by inserting spacers of different heights underneath one of the two cylindrical bearings supporting the frame. A vertical tube allowed placing the spheres in a small holding cup at the top of the slope, which could be tilted for the release. Trajectories were recorded from below, through the transparent tank wall and Plexiglas plate, using a Nikon digital video camera with resolution
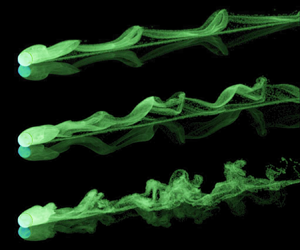
  $1920 \times 1080$ pixels and frame rate 25 Hz. Spatial scaling was obtained by placing a rule on the plate in the field of view. The recorded video sequences were processed using image-tracking software (Brown Reference Brown2020) to determine the position and velocity of the sphere as a function of time. In order to visualise the wake of the sphere, a solution of Fluorescein, slightly denser than the water in the tank, was introduced with a thin metal cannula on the upper part of the plate, which generated a thin layer of dye there. When the sphere rolled through this layer, the dye was trapped in the wake and carried along with the sphere, revealing the vortical structures developing behind it. The dye was illuminated with the light from an Argon laser, which made it fluoresce.

Figure 4. (a) Schematic of the first experimental set-up, used for trajectory measurements and wake visualisations. (b) Photo of the sphere holder/release mechanism in the second set-up, used for drag measurements.
A second set-up, located in Monash University's FLAIR laboratory, was used to determine the effective drag coefficient. A higher precision is needed for these measurements, in particular concerning the inclination angle  $\theta$ of the surface. The water tank has dimensions $160 \times 30 \times 35$ cm $^3$ (length $\times$ width $\times$ height). The slope surface panel, consisting of an acrylic plate with dimensions $100 \times 28 \times 1$ cm $^3$ (length $\times$ width $\times$ thickness), had one end hinged to a second bottom plate ( $110 \times 28 \times 2$ cm $^3$) using precision ball bearings, with the other end being free for the slope angle adjustment. A waterproof digital inclinometer (model DWL 280 by Digi-Pas) was used to measure and adjust the angle along the length and width of the slope surface, with accuracy $0.05^{\circ }$. The spheres were initially held at the top end of the sloping panel by a curvature holder mounted on a straight stainless steel rod (see figure 4b). After waiting at least 2 min for the residual water motion to calm down, the spheres were released by gently lifting the holding rod. A Nikon digital camera with resolution $1920 \times 1200$ pixels and a 60 Hz frame rate was used to record the sphere motion for analysis. After the sphere reached a stable rolling velocity (typically at $\sim$10 cm from the release position), a stopwatch was used to measure the travel time between two preset points separated by 20 cm, in order to calculate the mean velocity. The water temperature was measured using a digital thermometer to allow for the viscosity and density to be calculated according to Huber et al. (Reference Huber, Perkins, Laesecke, Friend, Sengers, Assael, Metaxa, Vogel, Mareš and Miyagawa2009). For each sphere and slope angle combination, 10 test runs were conducted, and the measurements were averaged to obtain the final result.
Table 2 shows the properties of spheres that were used in the experiments. They were made from different materials, including acrylic, Teflon and steel, to achieve different density ratios and Reynolds number ranges. Their diameter was measured using a slide calliper with accuracy  $\pm 0.05$ mm.
Table 2. Properties of the spheres used in the experiments.

In all experiments, the inclination angle of the wall was smaller than 6 $^\circ$, which is well below the limit where the sphere motion starts to deviate from pure rolling, and above which a combination of rolling and sliding is observed (Wardhaugh & Williams Reference Wardhaugh and Williams2014).
4. Results
In the following, we first present results concerning the wake properties and sphere motion for low and intermediate Reynolds numbers up to  $Re^*\approx 250$, where a sequence of asymptotic states is observed, characterised by steady, periodic and quasi-periodic flow, and different symmetry properties. Most of the quantitative results were obtained from numerical simulations, where a constant gap ratio $G/d=0.005$ was used. They are complemented by experimental observations for similar Reynolds numbers and density ratios, but with an unknown (effective) gap ratio, i.e. the average gap between the sphere and rolling surfaces due to the presence and interaction of surface elements on both surfaces. We then analyse in more detail the gap (or roughness) dependency of the effective mean drag coefficient, using both numerical and experimental results.
4.1. Mean sphere velocities and fluid forces
Figure 5(a) shows the variation of the non-dimensional asymptotic mean velocity  $\bar {u}_s^*$ of the sphere, as a function of the modified Reynolds number $Re^*$ and for various density ratios. The values are located around 1, which means that the velocity scale used for the non-dimensionalisation is indeed of the order of the terminal sphere velocity. The line passing through the data corresponds to the speed obtained from (2.17) using force and torque coefficients from the uniform rolling case. Clearly, $\bar {u}_s^*$ increases with $Re^*$, which according to (2.17) and (2.18) corresponds to a decrease of the effective drag coefficient. The Reynolds number based on the asymptotic velocity ( $\overline {Re}$) is shown in figure 5(b). It varies almost linearly with $Re^*$, and the two are approximately equal for $Re^*\approx 100$. The density ratio $\beta$, which was varied over two orders of magnitude, has a negligible effect on the mean sphere velocity in the asymptotic state for $\beta > 1$. However, for lower mass ratios, there is some deviation as cross-slope motion becomes more substantial. Approximate quadratic fits relating $\overline {Re}$ and $Re^*$ are
 \begin{equation} \overline{Re} \approx -27.37 + 1.197\,Re^* + 0.001458\,({Re^*})^2 \end{equation}
and
 \begin{equation} Re^* \approx 23.31 + 0.7553\,\overline{Re} - 0.0003783\, (\overline{Re})^2. \end{equation}
While these relationships are for gap ratio  $G/d = 0.005$, (2.17), (4.6), (4.7) and (4.8) can be used to extend them to any gap ratio. For example, figures 5(a,b) show predictions for gap ratio $G/d = 5 \times 10^{-6}$, for $\bar {u}^*_s$ and $\overline {Re}$ against $Re^*$, which approximately match the experimental variations.

Figure 5. Dependence of (a) the mean asymptotic sphere velocity  $\bar {u}_s^*$ and (b) the corresponding Reynolds number $\overline {Re}$ on $Re^*$, as determined from numerical simulations with gap ratio $G/d=0.005$. The grey symbols represent experimental measurements. The discrepancy with the numerical results is discussed in § 4.5. On this point, the dotted lines correspond to predictions based on (2.17), (4.2), (4.6), (4.7) and (4.8) for gap ratio $G/d=5\times 10^{-6}$, showing an approximate match to the experimental data.
Figure 5(a) also contains the results obtained in the experimental study, using different spheres. In addition to a noticeable scatter of the data, the experiments yield significantly lower sphere velocities throughout the considered Reynolds number range. This difference is due to a higher effective drag coefficient measured in the experiments, which is likely related to differences in the (effective) size of the gap between the sphere and the wall. This point is analysed further in § 4.5.
The predicted mean drag, lift and torque coefficients are shown in figure 6, as functions of the Reynolds number  $\overline {Re}$, which makes it possible to compare the present results for a freely rolling sphere to those for a sphere translating at constant speed in a straight line, i.e. without flow-induced unsteady motion. The force coefficients are almost identical for the two cases. This is expected for low $\overline {Re}$, where the flow is steady and the sphere velocity is constant. It is, however, also the case at higher $\overline {Re}$ ( $\gtrsim 130\unicode{x2013}150$), for which unsteady flow and sphere motion is found (see below). As for the mean sphere velocity, the dependence on the density ratio is weak. However, for very light spheres, there is measurable deviation as significant cross-slope oscillations develop. Again, this is discussed in more detail in §§ 4.3 and 4.4.

Figure 6. Predicted mean drag and lift coefficients of the freely rolling sphere, as functions of mean Reynolds number  $\overline {Re}$ for $G/d=0.005$. The solid lines represent the results for uniform rolling, i.e. rolling in a straight line at constant speed.
It should be noted that the mean lift force is negative, i.e. directed towards the wall, which is different from that observed for a rolling circular cylinder (Houdroge et al. Reference Houdroge, Leweke, Hourigan and Thompson2020). For these two cases, the flows in the gap region and their wakes are qualitatively different so the change of sign is not necessarily surprising. Perhaps a useful reference point for the expected force on a sphere is the negative lift experienced by a translating, rotating sphere such as a table tennis ball subject to top-spin. This is consistent with the predicted negative lift of a rolling sphere.
Interestingly, by considering an expansion including just linear terms in  $Re$, Krishnan & Leighton (Reference Krishnan and Leighton1995) derived the asymptotic result (i.e. $G/d \rightarrow 0$) for small Reynolds number that $C_L(G/d \rightarrow 0) = 0.167$. While the drag coefficient is a strong function of gap ratio, this is not the case for the lift coefficient, which, at least for small gaps, is only weakly dependent on the gap ratio. Figure 7 shows the predicted variation of the lift coefficient for Reynolds numbers down to 0.1 for the uniform rolling case. Again, the gap ratio is $G/d=0.005$. Note that a similar variation was predicted by Lee & Balachandar (Reference Lee and Balachandar2010), who extended the work of Zeng et al. (Reference Zeng, Najjar, Balachandar and Fischer2009), although their Reynolds number resolution was lower and they restricted their predictions to the steady regime ( $Re \leq 100$). Indeed, for Reynolds numbers below approximately 2.5, the lift coefficient does become positive in line with the theoretical prediction. The numerical prediction at $Re=0.1$ of $C_L = 0.173$ is only a few per cent different to that predicted analytically (0.167) by Krishnan & Leighton (Reference Krishnan and Leighton1995). The extension of the lift coefficient variation to higher Reynolds numbers may be important for particle scouring and surface cleaning applications, as discussed by Krishnan & Leighton (Reference Krishnan and Leighton1995).

Figure 7. Predicted lift coefficient as a function of Reynolds number,  $\overline {Re}$, for $G/d=0.005$ for the uniform rolling case. The dashed line shows an empirical fit for the steady Reynolds number range provided by Lee & Balachandar (Reference Lee and Balachandar2010, equation (3.15)).
Particle paths in the neighbourhood of the sphere are shown in figure 8 for  $Re=1$, 10 and 100. These images show the effect of Reynolds number on the outer flow in the steady regime. The main effects of increasing Reynolds number are to decrease the boundary layer thickness at the surface of the sphere, and to break the forward–backward symmetry associated with the development of the wake, especially for $Re> 10$. The local flow in the vicinity of the gap is invariant, as will be examined in more detail in § 4.5.

Figure 8. Particle paths in the centre plane in the neighbourhood of the cylinder as a function of Reynolds number in the steady regime. Panels (a–c) show paths for  $Re = 1$, 10 and 100, respectively. The sphere is rolling to the left.
4.2. Transition to unsteady flow
Rao et al. (Reference Rao, Passaggia, Bolnot, Thompson, Leweke and Hourigan2012) investigated numerically the wake of a uniformly forward-rolling sphere and predicted that the transition from steady to unsteady, periodic flow occurs at  $Re_c=139$, and that a second, mirror-symmetry-breaking transition occurs at $Re=192$. In the configuration investigated here of a sphere rolling freely under gravity, the asymptotic sphere motion and wake structure are also steady at low Reynolds number. On increasing the Reynolds number, a supercritical transition to an unsteady periodic regime is again found, with the threshold depending on the density ratio $\beta$. The critical Reynolds number can be determined from the evolution of the amplitude of a fluctuating quantity. According to the Stuart–Landau model for supercritical bifurcations (see e.g. Provansal, Mathis & Boyer Reference Provansal, Mathis and Boyer1987; Thompson & Le Gal Reference Thompson and Le Gal2004), the square of the amplitude should be proportional to the Reynolds number increment above the critical value. This value can therefore be found by extrapolating the amplitude squared to zero.
Figure 9 shows the square of the amplitude of the unsteady component of the drag coefficient,  $C_D^o$, as a function of the Reynolds number $Re^*$ for various density ratios. The determination of the critical value for the uniform rolling case ( $Re = 140.6$) for the current set-up is also shown in figure 9(a). This is slightly larger than but close to the value found by Rao et al. (Reference Rao, Passaggia, Bolnot, Thompson, Leweke and Hourigan2012), with the difference likely resulting from increased grid resolution around the gap. Note that for mass ratios below unity, zero cross-stream movement is enforced because otherwise the development of significant cross-stream motion affects the saturated drag coefficient values. Effectively, this allows the initial centre-plane mirror-symmetric transition to be studied in isolation. However, it does indicate that breaking of mirror symmetry occurs well below the prediction of $Re= 192$ for the uniform rolling case.

Figure 9. Variation of the square of the amplitude of the drag fluctuation with Reynolds number, for various density ratios. Linear fits are used to determine the critical value for the onset of the unsteady regime.
Figure 10 collects the resulting critical Reynolds numbers as a function of a convenient plotting parameter  $1/\sqrt {\beta }$ – chosen to spread the points so that a smooth curve joining the data points could be constructed. The onset of unsteady flow (and sphere motion) occurs at lower Reynolds numbers for lighter spheres, which is behaviour opposite to that found for a freely rolling circular cylinder (Houdroge et al. Reference Houdroge, Leweke, Hourigan and Thompson2020). This is not particularly surprising given the differences in body geometry and different flow near the gap region. For heavier spheres, e.g. $\beta =3$, the predicted transition value is slightly above that for the uniform rolling case. In the limit of very heavy spheres ( $\beta \rightarrow \infty$), the threshold approaches the critical Reynolds number for uniform rolling ( $Re_c=140.6$). This is expected because, as the sphere's weight is increased, it should respond increasingly less to the variation in unsteady fluid forcing as it rolls.

Figure 10. Transition Reynolds number:  $\overline {Re}_c$ as function of the inverse of the square root of the density ratio.
Insight into the effect of allowing the cylinder to oscillate on the onset of wake unsteadiness is provided by the following analysis. Taking the incompressible Navier–Stokes equations (2.2) and expanding the velocity into a time mean plus an unsteady perturbation component,  $\boldsymbol {u} = \bar {\boldsymbol {u}} + \boldsymbol {u}'$, and taking the time average, gives
 \begin{equation} \bar{\boldsymbol{u}}\boldsymbol{\cdot}\boldsymbol{\nabla}\bar{\boldsymbol{u}} + \overline{\boldsymbol{u}'\boldsymbol{\cdot}\boldsymbol{\nabla} \boldsymbol{u}'} =-\frac{1}{\rho}\,\boldsymbol{\nabla} \bar{p}+\nu\,\nabla^2\bar{\boldsymbol{u}}. \end{equation}
This assumes that we are close to the steady–unsteady transition so that the perturbations are purely sinusoidal.
Subtracting this from the Navier–Stokes equations with the velocity and pressure expansions gives
 \begin{equation} \frac{\partial \boldsymbol{u}'}{\partial t} + \bar{\boldsymbol{u}}\boldsymbol{\cdot}\boldsymbol{\nabla} {\boldsymbol{u}'} + {\boldsymbol{u}'}\boldsymbol{\cdot}\boldsymbol{\nabla} \bar{\boldsymbol{u}} + {\boldsymbol{u}'}\boldsymbol{\cdot}\boldsymbol{\nabla} {\boldsymbol{u}'} - \overline{\boldsymbol{u}'\boldsymbol{\cdot}\boldsymbol{\nabla} \boldsymbol{u}'} =-\frac{1}{\rho}\,\boldsymbol{\nabla} {p}' +\nu\,\nabla^2 {\boldsymbol{u}'} - \frac{{\rm d}\boldsymbol{u}_s}{{\rm d}t}. \end{equation}
Then taking the dot product with the perturbation field, rearranging and integrating over the fluid domain ( ${\mathcal {V}}$) and an oscillation period ( $T$) gives
 $$\begin{align}
\int_t^{t+T}\iiint_{\mathcal{V}} \frac{\partial
\frac{1}{2}(\boldsymbol{u}' \boldsymbol{\cdot}
\boldsymbol{u}' )}{\partial t} \,{\rm d}V\,{\rm d}t &=\int_t^{t+T}\iiint_{\mathcal{V}}
\boldsymbol{u}' \boldsymbol{\cdot} \left[\vphantom{\left. +\,
\overline{\boldsymbol{u}'\boldsymbol{\cdot}\boldsymbol{\nabla}
\boldsymbol{u}'} -\frac{1}{\rho}\,\boldsymbol{\nabla} {p}'
+\nu\,\nabla^2 {\boldsymbol{u}'}\right]}-
\bar{\boldsymbol{u}}\boldsymbol{\cdot}\boldsymbol{\nabla}
{\boldsymbol{u}'} -
{\boldsymbol{u}'}\boldsymbol{\cdot}\boldsymbol{\nabla}
\bar{\boldsymbol{u}} -
{\boldsymbol{u}'}\boldsymbol{\cdot}\boldsymbol{\nabla}
{\boldsymbol{u}'}\right.\nonumber\\ &\quad\left. +\,
\overline{\boldsymbol{u}'\boldsymbol{\cdot}\boldsymbol{\nabla}
\boldsymbol{u}'} -\frac{1}{\rho}\,\boldsymbol{\nabla} {p}'
+\nu\,\nabla^2 {\boldsymbol{u}'}\right] {\rm
d}V\,{\rm d}t\nonumber\\ &\quad -
\int_t^{t+T}\iiint_{\mathcal{V}} \boldsymbol{u}'
\boldsymbol{\cdot} \frac{{\rm d}\boldsymbol{u}_s}{{\rm d}t}
\,{\rm d}V\,{\rm d}t.
\end{align}$$
$$\begin{align}
\int_t^{t+T}\iiint_{\mathcal{V}} \frac{\partial
\frac{1}{2}(\boldsymbol{u}' \boldsymbol{\cdot}
\boldsymbol{u}' )}{\partial t} \,{\rm d}V\,{\rm d}t &=\int_t^{t+T}\iiint_{\mathcal{V}}
\boldsymbol{u}' \boldsymbol{\cdot} \left[\vphantom{\left. +\,
\overline{\boldsymbol{u}'\boldsymbol{\cdot}\boldsymbol{\nabla}
\boldsymbol{u}'} -\frac{1}{\rho}\,\boldsymbol{\nabla} {p}'
+\nu\,\nabla^2 {\boldsymbol{u}'}\right]}-
\bar{\boldsymbol{u}}\boldsymbol{\cdot}\boldsymbol{\nabla}
{\boldsymbol{u}'} -
{\boldsymbol{u}'}\boldsymbol{\cdot}\boldsymbol{\nabla}
\bar{\boldsymbol{u}} -
{\boldsymbol{u}'}\boldsymbol{\cdot}\boldsymbol{\nabla}
{\boldsymbol{u}'}\right.\nonumber\\ &\quad\left. +\,
\overline{\boldsymbol{u}'\boldsymbol{\cdot}\boldsymbol{\nabla}
\boldsymbol{u}'} -\frac{1}{\rho}\,\boldsymbol{\nabla} {p}'
+\nu\,\nabla^2 {\boldsymbol{u}'}\right] {\rm
d}V\,{\rm d}t\nonumber\\ &\quad -
\int_t^{t+T}\iiint_{\mathcal{V}} \boldsymbol{u}'
\boldsymbol{\cdot} \frac{{\rm d}\boldsymbol{u}_s}{{\rm d}t}
\,{\rm d}V\,{\rm d}t.
\end{align}$$ The integral on the left-hand side is the change in the perturbation energy per unit mass over an oscillation cycle. At saturation, this will be zero, but nevertheless the terms on the right-hand side contribute to the energy exchange, feeding or removing energy from the unsteady perturbation field. The final term on the right-hand side represents the mean energy transfer to the fluid from sphere oscillations. To examine a particular case, figure 9 indicates that for  $\beta =0.8$, unconstraining the sphere causes lowering of the transition Reynolds number relative to the uniform rolling case. Non-negligible sphere oscillations are observed to occur at $Re^* = 122$, corresponding to $\overline {Re} \approx 140.4$, which is slightly below the uniform rolling transition of $\overline {Re} = 140.6$. For this particular case, the last term on the right-hand side of (4.5) was evaluated and found to be positive, i.e. the effect of allowing sphere oscillations causes energy transfer to the unsteady perturbation field, leading to earlier transition, consistent with the previous analysis based on the direct simulations and the Stuart–Landau model.
This equation shows that it is the phase relationship between sphere acceleration and the perturbation field that effects transition. This phase difference must be a function of mass ratio, although it is not clear how it can be determined prior to undertaking the simulations or experiments.
4.3. Asymptotic wake states
At low Reynolds numbers, before the transition to unsteadiness, the sphere rolls asymptotically at constant velocity down the inclined plane. Its wake is steady and exhibits two counter-rotating threads of streamwise vorticity emerging from the recirculation zone behind the sphere, similar to the case of a uniform rolling sphere. In the following, we illustrate the different asymptotic wake stages as the Reynolds number is increased beyond the threshold of unsteadiness, for density ratio  $\beta =2.2$, which is the value used in the visualisation experiments. For Reynolds numbers above the critical value, the wake bifurcates to a new asymptotic state characterised by the periodic shedding of hairpin vortices that are symmetric with respect to the sphere's vertical centre plane. These vortex loops are convected downstream, close to the wall near $Re^*_c$, and further away as the Reynolds number increases. The wake structure in this regime is illustrated in figure 11, which shows simultaneous plan and side view visualisations of the flow at $Re^*=130>Re^*_c$ over one shedding cycle, obtained by using tracer particles in the numerical simulations.

Figure 11. Periodic wake of the freely rolling sphere for  $Re^*=130$ and $\beta =2.2$ just above the critical Reynolds number for shedding. Visualisations from numerical simulation using tracer particles, covering one shedding cycle. (ai,bi,ci) View from above; (aii,bii,cii) simultaneous view from the side. The sphere is moving right to left.
On increasing the Reynolds number, both planar symmetry and strict periodicity are quickly lost. As seen in figure 12(b) for  $Re^*=153$, vortex loops are shed at quasi-periodic intervals, but the planar mirror symmetry about the vertical centre plane has completely disappeared.

Figure 12. Characteristic plan views of wake vortex structures for (a)  $Re^*=136$, (b) $Re^*=153$ and (c) $Re^*=241$ for $\beta =2.2$. Visualisations from numerical simulations using the $Q$-criterion ( $Q=0.01$; Hunt, Wray & Moin Reference Hunt, Wray and Moin1988). The sphere is rolling right to left.
At even higher  $Re^*$, e.g. at $Re^*= 241$ shown in figure 12(c), the wake becomes more chaotic, with vortex loops becoming stronger and less symmetric about the centreline. Periodicity is also further reduced. Overall, vortices resembling hairpins continue to be shed in an irregular quasi-periodic manner with substantial sideways movement. This behaviour is similar to that found for a sphere rolling at constant speed at Reynolds numbers above the second transition ( $Re>192$; Rao et al. Reference Rao, Passaggia, Bolnot, Thompson, Leweke and Hourigan2012) and also for a non-rotating sphere in a free stream without a wall ( $Re>650$; Mittal & Najjar Reference Mittal and Najjar1999).
These stages are further illustrated by the series of snapshot visualisations from the numerical simulations in figure 13, showing plan and side views of the wake using passive tracer particles to highlight the vortex structures. These images correspond to the Reynolds number sequence  $Re^* = 136$, 153, 241. Recall that the critical Reynolds number for shedding is approximately $Re^* = 123$ for $\beta =2.2$. By $Re^*=136$ ( $\overline {Re} \sim 163$), although the saturated state is mirror-symmetric and periodic, cross-slope oscillations are almost neutrally stable. This can be seen in figure 14, which shows the cross-slope velocity as a function of time. The initial non-zero cross-slope velocity at small times is due to perturbing the flow after the first time step to accelerate transitions, as explained in the methodology section. Thus cross-slope oscillations should develop at only slightly higher Reynolds numbers. The tracer visualisations at $Re^*=153$ and $241$ indicate clearly how cross-slope oscillations dominate the wake state at higher Reynolds numbers.

Figure 13. Numerical passive tracer visualisations of the wakes of freely rolling spheres for (a)  $Re^*=136$, (b) $Re^*=153$ and (c) $Re^*=241$, matching the Reynolds numbers of the experimental dye visualisations shown in figure 15. Each panel shows the view from above (top) and the view from the side (bottom). In each case, $\beta =2.2$.

Figure 14. Cross-slope velocity evolution for  $Re^*=136$ and $\beta =2.2$. This shows that cross-stream oscillations are only very weakly damped for this Reynolds number.
Since the sphere motion parallel to the wall is not restricted, the unsteady wake oscillations above the first transition threshold are accompanied by variations of the sphere velocity. As long as the wake remains symmetric, the sphere moves only in the  $x$-direction down the slope, with a fluctuating velocity magnitude. When the symmetry is lost, lateral forces appear and make the sphere also move sideways. The flow-induced vibrations of the sphere are presented in more detail in the next subsection.
The wake states described here occur for spheres with a moderate density ratio ( $\beta =2.2$). For much lighter spheres, in particular positively buoyant ones with $\beta <1$, the force and velocity traces indicate that the first bifurcation from steady flow immediately leads to an asymmetric wake accompanied by lateral sphere vibrations (see figure 17). Indeed, long-time simulations at Reynolds numbers below the onset of the steady–unsteady transition found for spheres restricted to downslope motion only, already show growing cross-slope oscillations. Again, this is discussed further in § 4.4.
The experimental observation of the mirror-symmetric wake mode identified in the numerical simulations proved to be extremely difficult, or even impossible. The experimental counterparts of the numerical wake structures in figures 11–13 are shown in figure 15. At the lowest Reynolds number,  $Re^*=136$, unlike the behaviour observed in the numerical simulations, the wake is always found to be asymmetric with respect to the centre plane, and the sphere always exhibited irregular motion in the lateral direction. A likely explanation involves imperfections of the experimental configuration, such as irregularities of the sphere geometry or a non-perfect flatness of the Plexiglas plate, and in particular the presence of dust particles on the slope surface. With the extremely small forces driving the sphere motion at low $Re^*$, encountering the tiniest speck of dust may deviate the sphere trajectory temporarily sideways, before the pull of gravity redirects it again down the slope. As discussed above, the numerical simulations show that cross-slope oscillations are almost neutrally stable at this Reynolds number, so this behaviour is not all that surprising. The large-scale shape of the dyed sphere wake in figure 15(a) may simply be the result of the imperfection-induced sphere motion. However, it is also possible that the onset of sphere oscillations occurs at lower Reynolds numbers for smaller gaps, noting that the drag and side force coefficients are indeed strongly gap-dependent.

Figure 15. Experimental dye visualisations of the wake of freely rolling spheres for (a)  $Re^*=136$, (b) $Re^*=153$ and (c) $Re^*=241$. Views from above, $\beta =2.2$ in all cases.
At higher Reynolds numbers, the match between the experimental and numerical simulations is much better. The experimental dye (figure 15) and numerical tracer (figure 13) visualisations for  $Re^*=153$ and 241 show similar wake structures, structure sizes, sideways motion, wavelengths and complexity. Relative to the uniform rolling case, the onset of cross-slope motion and loss of periodicity occur at considerably lower Reynolds numbers. The shedding of vortex loops persists up to higher $Re^*$, as seen in the dye visualisation example of figure 16.

Figure 16. (a) Oblique side view of an experimental dye visualisation of vortex loops in the rolling sphere wake at  $Re^*=412$ and $\beta =2.2$. (b) Similar views of passive tracer visualisations from simulations for $\beta =2.2$. Top to bottom: $Re=136$, 153 and 412. Note that the reflection from the plane surface has also been mimicked in these images. Animations of these visualisations are also available as supplementary movies 1–4, available at https://doi.org/10.1017/jfm.2023.250.
4.4. Unsteady forces and sphere vibrations
In this subsection, the time-dependent force coefficients and fluid velocities predicted by the numerical simulations are presented for various Reynolds numbers ( $100\le Re^*\le 200$) and density ratios ( $0.8\le \beta \le 10$), again for the single gap ratio $G/d=0.005$. The effect of the gap size is addressed in the next subsection.
Figure 17 shows the numerically determined time evolution of the drag, lift and side force coefficients, and of the downslope and lateral velocity component of the sphere, which is initially at rest. In these plots, the velocity scale used to non-dimensionalise the force coefficients is the instantaneous speed, i.e.  $\sqrt {(v^*)^2 + (u^*)^2}$, noting that substantial cross-slope velocities are induced for higher Reynolds number and low mass ratios. The asymptotic state can take some time to be reached, depending on the Reynolds number and mass ratio. For $Re^*=100$ and $\beta =0.8$, the final asymptotic state has not been reached even after $t^*=300$, which corresponds to a downslope distance of approximately $300d$ from the initial position! The initial transient is shorter for the lighter, less inert spheres, as expected, similar to case of the freely rolling circular cylinder (Houdroge et al. Reference Houdroge, Leweke, Hourigan and Thompson2020).

Figure 17. Time evolution (from rest) of the force coefficients and sphere velocity components for different Reynolds numbers and density ratios.
At  $Re^*=100$, except for the lowest mass ratio case, the force coefficients reach a constant value as the flow attains a steady state. For $\beta =0.8$, as discussed, the fluid–structure system is unstable to cross-slope oscillations. Hence the onset of cross-slope oscillations depends on the mass ratio of the sphere with positively buoyant spheres developing such oscillations prior to the downslope unsteady transition. At $Re=150$, above the transition to unsteady downslope flow, the asymptotic state is strongly dependent on mass ratio. For $\beta =10$, the final state appears to be quasi-periodic but without cross-slope oscillations. Decreasing the mass ratio to $\beta =3$ results in the development of cross-slope oscillations and an increasingly chaotic asymptotic flow state. For the positively buoyant case $\beta =0.8$, the wake does not even transition through a near-periodic symmetrical shedding state with large cross-slope oscillations developing rapidly. The final state is very irregular with maximum cross-slope velocities almost 50 % of the downslope component. Because of this, the final average downslope velocity is well below that seen in the two heavier sphere cases. Strongly irregular fluctuations and lateral forces are observed for all density ratios at $Re^*=200$.
It may be noted that when irregular lateral forces appear, the running mean of the corresponding coefficient  $C_{D,y}$ is not zero, which can result in a sideways drift of the sphere (see below).
The two components of the sphere velocity are presented in figures 17(m–o). As expected, the cross-slope velocity  $v_s^*$ is zero when the flow is steady ( $Re^*=100$) and plane-symmetric ( $Re^*=150$ and $\beta =10$), since the sphere rolls in a straight line down the slope in these cases. In the more irregular asymmetric states at $Re^*=200$ (and for $\beta =0.8, 3$ at $Re^*=150$), the lateral sphere velocity oscillates around zero, most of the time with a small non-zero mean. The evolution of the $x$-velocity down the slope depends on both $Re^*$ (asymptotic mean value) and $\beta$ (i.e. the duration of start-up transient and the amplitude of the oscillations in the unsteady states).
Figure 18 shows the position of the sphere along and across the slope as function of time, and figure 19 gives the approximately adjusted coordinates, representing the deviations from the mean trajectory. The sphere rolls in a straight line at constant speed when the flow is steady, and exhibits vortex-induced vibrations when the flow is unsteady. Even close to the transition at  $Re^*=150$, the oscillations are irregular. As $Re^*$ is increased to 200, the flow becomes more chaotic. Particularly noticeable for $\beta =3$ at both $Re^*=150$ and $200$, the frequency of the lateral vibration is only about half that of the inline oscillation (see also figure 23). Such a low frequency is also present in the evolution of the lateral force coefficient for a uniform rolling sphere, in the regime just above the onset of asymmetric wake flow (Rao et al. Reference Rao, Passaggia, Bolnot, Thompson, Leweke and Hourigan2012).

Figure 18. Position of the sphere (a–c) along and (d–f) across the slope, from the numerical simulations.

Figure 19. Fluctuating position of the sphere (a–c) along and (d–f) across the slope, obtained by subtracting the values of the mean trajectory. The time interval shown represents the asymptotic state after the initial transient.
The time traces of the adjusted sphere position can be used to obtain the oscillation amplitude of the sphere in the unsteady regime, although well above the transition to unsteady flow, the amplitude variation becomes chaotic. Figure 20 shows that the inline vibration amplitude ( $A_x^*$) increases with the Reynolds number $Re^*$ and decreases with the density ratio $\beta$.

Figure 20. Amplitude of oscillation, scaled by the sphere diameter in the direction of the slope. Symbols correspond to different density ratios, as before.
So far, only results from the numerical simulations at constant gap size between the sphere and the wall have been shown. In the experiments, it is likely that an effective gap (of unknown size) existed, due to the surface roughness of the sphere and/or wall and the presence of impurities. Keeping this in mind, it is nevertheless possible to make a few comparisons between numerical and experimental results concerning the flow-induced sphere vibrations. The next subsection will take a closer look at the influence of gap size and roughness on the effective drag forces, which can be deduced from the observed sphere velocity.
For the comparison with the simulations, an experimental case at moderately high Reynolds number ( $Re^*=241$) is chosen, for which the effect of impurities such as dust particles generating spurious lateral sphere motions are expected to be weak (see § 4.3, figure 15). Figure 21 illustrates how the trajectory of the sphere rolling down the transparent inclined plate in the water tank is determined, by tracking the sphere in the corresponding video sequence. From this, the absolute and adjusted inline and lateral positions of the sphere as functions of time are calculated. The results in figures 22(c,d), which have been filtered to reduce high-frequency noise, are very similar to the numerical predictions for the same case shown in figures 22(e,f). The non-dimensional mean velocity of the sphere, given by the slope in figure 22(a), is approximately 25 % lower than in the simulations. According to (2.17) and (2.18), this implies a higher effective drag coefficient, which is likely to be related to the effective gap size. Despite this difference, the amplitudes and frequencies of the inline and lateral sphere vibrations in figures 22(c,d) are very similar to the numerically predicted ones, suggesting that these frequencies are dependent on the outer flow and not on the gap flow.

Figure 21. Experimental trajectory of the sphere as it rolls through the field of view (from left to right). The image is stretched in the vertical direction by a factor 10, in order to emphasise the lateral sphere motion. Here,  $Re^*=241$ and $\beta =2.2$.

Figure 22. Sphere coordinates obtained from the visualisation illustrated in figure 21 for  $Re^*=241$ ( $\overline {Re}=270$) and $\beta =2.2$: (a,b) non-dimensional positions along and across the slope; (c,d) adjusted positions (deviations from the mean trajectory); (e,f) similar adjusted positions from the numerical simulation at the same Reynolds number.
Figure 23 shows a collection of numerically and experimentally determined frequencies of the sphere vibrations for a moderately buoyant case. The frequencies ( $\,f$) are expressed in the form of a non-dimensional Strouhal number, defined as $St=fd/\bar {u}_s$. They are given as function of the Reynolds number $\overline {Re}$ based on $\bar {u}_s$, in order to allow a comparison with the results for a uniform rolling sphere. The vibration frequencies of the freely rolling sphere are very close to the wake frequencies for uniform rolling, for both the inline motion and the lateral displacement.

Figure 23. Strouhal numbers of the sphere motion compared to the wake frequencies of the uniform rolling sphere (Rao et al. Reference Rao, Passaggia, Bolnot, Thompson, Leweke and Hourigan2012). The upper and lower branches correspond to fluctuations in the inline and lateral directions, respectively.
4.5. Effects of roughness and gap size
When comparing the predictions from numerical simulation and experimental measurements of a freely rolling sphere driven by gravity, a significant discrepancy was found concerning the non-dimensional asymptotic rolling velocity (figure 5). Since this velocity is determined mainly by the drag coefficient (2.17), which in turn depends on the size of the gap between the sphere and the surface (see figure 24), it is reasonable to assume that part of the observed difference between the results may be due to a difference in the effective gap size. Whereas this size was fixed and constant in the simulations, it was uncontrolled and unknown in the experiments. As mentioned in the Introduction, surface roughness had been considered in the past as a possible source for causing an effective gap between the two solids. However, this idea was discarded by Goldman et al. (Reference Goldman, Cox and Brenner1967), and more recently again by Wardhaugh & Williams (Reference Wardhaugh and Williams2014), since various experimental studies on freely rolling spheres did not show evidence of a dependency of the drag on roughness.

Figure 24. Predicted evolution of the mean effective drag coefficient with the gap ratio at two Reynolds numbers, for a uniform rolling sphere.
Figure 25 shows a collection of experimental results concerning the effective drag coefficient  $\bar {C}'_D$ (see (2.18)) of a sphere rolling down an incline under gravity, including the present measurements, which are in good agreement with previous work. They are presented as functions of the Reynolds number $\overline {Re}$, based on the mean velocity, in the usual log–log scaling. This representation, in combination with the relatively large scatter, in particular in the intermediate Reynolds number range, hardly allows the identification of small differences associated with variations in the surface roughness.

Figure 25. Mean effective drag coefficient as a function of Reynolds number, determined in various experimental studies. The present results cover the range  $15<\overline {Re}<900$.
In the present study, we have carried out a series of measurements with spheres made of the same material rolling down the same inclined surface, where the asymptotic rolling velocities were determined with high accuracy. The difference between the spheres was their diameter and therefore, assuming a similar surface structure, their relative roughness. The results from these experiments are shown in figure 26.

Figure 26. Close-up of the  $\overline {Re}$– $\bar {C}'_D$ relation for spheres of the same material (acrylic), but of different diameters, compared to the values obtained from numerical simulations using different gap ratios.
A discussion is now presented to address the observed discrepancy between the results of the direct numerical simulations and the experiments. At the gap ratio  $G/d=0.005$ imposed throughout the numerical study, the computed drag coefficient was significantly lower than the drag calculated from the experimental runs at equivalent Reynolds numbers, as shown in figure 26, which focuses on the experiments with the acrylic spheres in the range $15\le \overline {Re}\le 250$ and the numerical predictions for $30\le \overline {Re}\le 125$ and $0.0002\le G/d\le 0.01$. Additionally, figure 24 gives the detailed variation of the computed $\bar {C}_D'$ versus the gap ratio for $\overline {Re}=50$ and 100. It is clear from these figures that the effective drag is particularly sensitive to the imposed gap and tends to increase as the latter decreases. Extrapolating the curves of figure 24 towards an equivalent gap at which the computed drag coefficient matches the experiments, we find that the numerical simulations would have to be carried out with a gap ratio of the order of $10^{-4}$– $10^{-5}$, suggesting an effective gap (and equivalent surface roughness) of order $10^{-6}$– $10^{-7}$ m. This would require an increased resolution in the gap region and a reduced time step, thus very large computational costs, beyond the scope of the present study. It is important to note that while the drag is sensitive to the imposed gap, the large-scale flow field remains practically independent of it (see Stewart et al. Reference Stewart, Thompson, Leweke and Hourigan2010a).
Another significant observation from figure 26 is that the drag coefficients of the acrylic spheres of different diameters follow the same trend, but are translated upwards in the direction of the  $y$-axis as the diameter is increased. This trend is consistent with each sphere having a similar absolute surface roughness, leading to a smaller effective gap ratio for larger spheres.
As described in the Introduction, the problem of a sphere moving along a wall at a fixed height was solved by Goldman et al. (Reference Goldman, Cox and Brenner1967) and O'Neill & Stewartson (Reference O'Neill and Stewartson1967) using the Stokes approximation. When there is contact between the particle and the wall, their solutions suggest that the fluid exerts an infinite resistance force opposing the movement of the sphere, thus inhibiting its motion. In addition, the lift force is predicted to be zero, while as the sphere is moved closer to the wall, the rotational to translational velocity approaches  $1/4$. The idealised mathematical model used to describe this flow problem is therefore insufficient to provide a complete understanding of the physics behind the rolling of the sphere.
Since those studies, others have extended the theoretical analysis to consider finite Reynolds number effects (Krishnan & Leighton Reference Krishnan and Leighton1995; Cherukat & McLaughlin Reference Cherukat and McLaughlin1994; Zeng et al. Reference Zeng, Najjar, Balachandar and Fischer2009; Lee & Balachandar Reference Lee and Balachandar2010) and the likely effect of surface roughness (Krishnan & Leighton Reference Krishnan and Leighton1995; Prokunin Reference Prokunin2003). These further studies still indicate that the drag force remains infinite for surfaces in contact; however, the effect of surface roughness is to maintain an effective gap between the surfaces, while the interaction between surface roughness elements can provide a retarding frictional force to enable effective rolling without slip (Krishnan & Leighton Reference Krishnan and Leighton1995), which is observed in practice, at least for small slope angles (Wardhaugh & Williams Reference Wardhaugh and Williams2014). Thus although Goldman et al. (Reference Goldman, Cox and Brenner1967) noted that the Carty (Reference Carty1957) data lie on a single curve for  $\overline {Re}<60$ and therefore eliminated the effect of surface roughness, the present investigation shows that the data can actually follow different curves within this range. This can be attributed to the fact that the current experiments resulted in more data points and a more detailed examination of the outcome than in Carty (Reference Carty1957).
The Stokes flow analysis of Goldman et al. (Reference Goldman, Cox and Brenner1967) provides a prediction of the drag on a rolling sphere in the limit of zero Reynolds number. The solution can be constructed from the combination of expansions for translational and rotational motion. Assuming that the sphere rolls so that the rotational and translational speeds are the same, which is the case here, the effective drag is predicted to be
 \begin{equation} \bar{C}_{D0}' = \frac{1}{\overline{Re}} \left[-44.2 \log_{10} (G/d) + 34.0 \right], \end{equation}
again combining the drag and torque contributions as in (2.18). This is obtained directly from expressions for the drag and viscous torque provided in Goldman et al. (Reference Goldman, Cox and Brenner1967), with the coefficients evaluated explicitly for the more convenient  $\log _{10}$ based expression given here. For small gaps, one could expect that the total effective drag can be expressed as the sum of a gap drag, given by the above expression, and what one might call the wake drag, $\bar {C}'_{D,wake}$, i.e.
 \begin{equation} \bar{C}_D' \approx \bar{C}_{D0}' (\overline{Re},G/d) + \bar{C}_{D,wake}' (\overline{Re}). \end{equation}
Here, it is assumed that the wake drag varies with Reynolds number, but has little dependence on the gap ratio for small gaps. Figure 27 shows the wake drag variation for  $G/d=0.005$ and Reynolds numbers up to 300. Also shown in this figure are values calculated from the numerical data shown in figure 26, covering gap ratios $0.0002 \leq G/d \leq 0.01$, showing a good collapse of the results according to the assumed variation given by (4.7). For $1 \leq \overline {Re} \leq 300$, $\bar {C}_{D,wake}'$ varies only over the relatively modest range 1–1.5, with an approximate quadratic fit for $\overline {Re} > 5$ given by
 \begin{equation} \bar{C}'_{D,wake} = 1.70 - 0.136 (\log_{10}\overline{Re}) - 0.0716 (\log_{10}\overline{Re})^2, \end{equation}
as shown by the solid line in figure 27.

Figure 27. Predicted wake drag ( $C_{D,wake}'$) as a function of Reynolds number (square symbols) for $G/D=0.005$. Overlaid are wake drag predictions (blue circles) using all the numerical data from figure 26, covering gap ratios $0.0002 \leq G/d \leq 0.01$. An approximate quadratic fit over $5 \leq \overline {Re} \leq 300$ is shown by the solid curve.
Note that the wake drag should approach zero as the Reynolds number and gap approach zero, given that the simulated flow (drag force) should approach the Goldman solution given by (4.6). It is expected that this behaviour would be seen at small Reynolds numbers ( $Re \lesssim O(1)$) as the gap size is reduced further so that the Goldman approximation becomes more accurate. In any case, for $Re \leq 1$ and $G/d=0.005$, the wake drag contribution is order 1 % or less than the overall drag. It is only at significantly higher Reynolds numbers that it becomes an important contribution. By $\overline {Re}=100$, there is approximately an even split between the gap and wake drag components.
For  $\overline {Re}=100$, figure 26 shows that the maximum effective drag from experiments occurs for the largest sphere ( $d=7.9$ mm). Using (4.7) to estimate the corresponding effective gap gives an estimate $G \approx 2 \times 10^{-8}$ m. While indeed very small, this is not necessarily beyond the bounds of expected surface roughness for polished acrylic surfaces (see e.g. Al Rifaiy Reference Al Rifaiy2010).
5. Conclusions
In this study, various aspects of a sphere rolling down an incline under the effect of gravity were examined using theory, direct numerical simulations and experiments.
Amongst the most interesting findings is the role the density ratio  $\beta$ plays in the flow transition. Considering the transition from steady to periodic flow, the critical Reynolds number $\overline {Re}_{c}$ is not constant, but instead varies with the density ratio. More specifically, moving from heavy to light spheres, $\overline {Re}_{c}$ initially increases slightly from the predicted value for uniform rolling $\overline {Re}_{c} = 141.6$, before decreasing to significantly smaller values, e.g. to $\overline {Re}_{c} = 134.5$ at density ratio $\beta =0.2$. The transition to unsteady flow is considerably more complex than for the uniform rolling case. For positively buoyant spheres ( $\beta < 1$), increasing cross-slope oscillations occur prior to the onset of the downslope steady-to-unsteady transition. For heavier spheres, e.g. for $\beta =2.2$, cross-slope oscillations develop soon after the unsteady transition, leading to a chaotic flow state at much lower Reynolds numbers than for the uniform rolling case. Indeed, in the experiments, it was not possible to observe the mirror-symmetric flow state, possibly due to the almost neutral stability of cross-slope oscillations, so that any small perturbations, such as the presence of small dust particles or surface irregularities perturbing the sphere motion, can lead to the loss of mirror symmetry.
The scaling adopted in the theoretical development, combined with the direct numerical simulations, allowed for a classification of the results as function of two non-dimensional parameters: a newly defined Reynolds number  $Re^*$, based on a characteristic velocity scale, that mostly governs the asymptotic state of the flow, and the density ratio $\beta$, which influences the initial transient and the magnitude of the sphere oscillations. The inline and lateral displacement amplitudes extracted from the computations both increase with Reynolds number, as the flow becomes increasingly unstable, with significantly larger lateral than inline oscillations. Increasing the density ratio leads to smaller sphere oscillations.
The experimental study was able to bridge the gap in the literature concerning the effective drag coefficient of a rolling sphere, by broadly validating the results published by Carty (Reference Carty1957). The results show distinct variations of drag coefficient versus Reynolds number for spheres of different sizes. If the roughness of each sphere is assumed similar, then one interpretation is that the effective gap ratio caused by a constant absolute surface roughness decreases for larger-diameter spheres, leading to higher drag. Significant differences were found between the drag measurements in the experiments (where the effective gap size was unknown) and predictions from numerical simulation for a gap  $G/d = 0.005$, which highlights the strong sensitivity of the drag force to the distance between the sphere and the wall. Numerical simulations using much smaller gaps show that the predictions approach the drag variation seen in experiments, and highlight the dominance of the gap-induced drag over the wake-induced drag. Further work is required to develop a deeper understanding of the details of the rolling mechanism.
Supplementary movies
Supplementary movies are available at https://doi.org/10.1017/jfm.2023.250.
Funding
This research was supported under the Australian Research Council Discovery Project funding scheme (DP130100822, DP150102879, DP200100704) and through an Australian Research Council Discovery Early Career Research Award (DE200101650). We also acknowledge computing time support through National Computing Infrastructure projects d71 and n67.
Declaration of interests
The authors report no conflict of interest.


 Open access