


Zinc is an essential nutrient for humans and animals due to its involvement in structural, catalytic and regulatory processes(Reference López-Alonso1–Reference Richards, Zhao and Harrell3). To fulfill the biological Zn requirements, humans and animals need to consume a certain level of bioavailable Zn with their diet. The amount of absorbable Zn, consisting of free and loosely bound Zn2+ ions, is the result of efficient digestion as well as the interaction with other dietary components (i.e. phytic acid, Ca)(Reference Goff4–Reference Suttle6). Zn deficiency is prevalent in developing regions, especially in countries in which cereals and legumes are a large fraction of the diet(Reference Hambidge and Krebs7,Reference Prasad8) . It has been estimated that Zn deficiency contributes to 800 000 excess deaths or 28 million daily adjusted life years annually among children under 5 years(Reference Caulfield, de Onis and Blössner9). Most of the documented Zn deficiency is considered relatively mild, with no clinical signs. The same accounts to pigs and especially weaned piglets. The fact that most pig diets are usually generously supplied with Zn salts and phytase makes the occurrence of clinical events of Zn deficiency rather rare(10). However, short-term fluctuations in dietary Zn intake, e.g. within the first days post-weaning, have been associated with SZD, which presumably occurs regularly under practical rearing conditions(Reference Davin, Manzanilla and Klasing11).
Chelators such as EDTA increase the bioavailability of minerals from both human and animal diets(Reference Hurrell12–Reference Vohra and Kratzer15). Chelators are organic molecules with a high affinity to form highly stable complexes with a transition metal or metalloid. In this way, the complex sustains the solubility of the metal alongside the upper gastrointestinal tract, by minimising the formation of insoluble complexes of the associated metal with for example phytic acid(Reference Vohra and Kratzer15–Reference Wreesmann, Reichwein and Van Doorn18). This sustained solubility results in the chelator complex delivering the mineral to the site of uptake within the gastrointestinal tract, where metal transporters, having a higher chelation strength than the chelator, are then able to absorb the mineral(Reference Boerboom19,20) . A novel dietary chelator, l-glutamic acid, N,N-diacetic acid (GLDA) has been shown to increase the nutritional availability of Zn in broilers and can be used as a dietary ingredient to improve the availability of Zn in the gastrointestinal tract, similarly to EDTA(Reference Boerboom, Busink and Smits21,Reference Boerboom, Busink and Smits22) . The benefits of GLDA compared to EDTA are its higher biodegradability and its relatively lower stability constant (10·0 for GLDA v. 16·5 for EDTA)(Reference Kołodyńska23,Reference Kołodyńska24) . Metal-binding proteins such as metallothionein have a stability constant around 11–13, indicating that EDTA, with a stability constant of 16·5, can influence the release of Zn(Reference Kimura and Kambe25,Reference Kochańczyk, Drozd and Krężel26) . This was also observed in studies performed in turkeys(Reference Vohra and Kratzer15). Broilers, however, are capable of dealing with native phosphorus due to the intrinsic phytase activity, making them not the most ideal species for translational research for humans(Reference Zeller, Schollenberger and Witzig27,Reference Sommerfeld, Van Kessel and Classen28) .
Weaned piglets are susceptible to dietary Zn deficiency and like humans, they have the inability to deal with dietary phytate levels(Reference Hurrell12,Reference Hurrell, Reddy and Burri13,Reference Lopez, Leenhardt and Coudray29) . During its transfer through the gastrointestinal tract, dietary phytate from cereal-based diets dissociates under the acidic conditions in the stomach. Subsequently, under the neutral conditions in the small intestinal lumen, phytic acid chelates divalent cations forming insoluble and at times almost crystalline complexes. These precipitated forms are not digestible by swine or human endogenous phosphatases(Reference Humer, Schwarz and Schedle30). Brugger et al. (Reference Brugger, Buffler and Windisch31) have recently developed an experimental model of subclinical Zn deficiency (SZD) in weaned piglets to facilitate basic and applied research in this very relevant phenotype of Zn malnutrition in humans and animals. The model is based on a classic dose–response setup, in which weaned piglets with adequate full body Zn stores are subject to eight days of varying dietary Zn supply, spanning the range from deficient dosages to mild oversupply of a corn-soybean-based diet with an average native phytic acid concentration of 9 g/kg (soybean extract, maize and wheat bran as the main source of phytic acid). We demonstrated the model induces no visual signs of Zn deficiency but, at the same time, promotes changes on the metabolic and subcellular level (e.g. decreased pancreatic digestive capacity, reduced cardiac redox capacity and redistribution of Zn pools within the organism)(Reference Brugger and Windisch32–Reference Brugger and Windisch34). Therefore, this approach provides a dietary phenotype suitable to investigate the efficacy of dietary intervention for the mitigation of the effects of SZD in monogastric mammals. We applied the model of Brugger et al.(Reference Brugger, Buffler and Windisch31) to precisely dissect the effects of GLDA on the Zn status of weaned piglets challenged with finely graded differences in dietary Zn supply.
The present study tested the hypothesis that GLDA is able to increase the Zn retention from phytate-rich diets, thereby compensating the reduced Zn status under SZD and, consequently, allowing a reduction of the necessary supplementation with Zn to complete feeds. Given the high similarity of pigs and humans concerning their nutritional physiology, the present data set aims to generate information applicable to both species.
Methods
This animal study was reviewed and approved by the responsible animal welfare officer of the TUM School of Life Sciences, Technical University of Munich, as well as registered and approved by the responsible animal welfare authorities (District Government of Upper Bavaria, Federal State of Bavaria (Germany) (case number. 55·22–1–54–2532·3–63–11)). The study was conducted at the experimental metabolic pig unit of the Chair of Animal Nutrition, TUM School of Life Sciences, Technical University of Munich.
Animals and diets
The experimental approach of the present study is an adaption of the subclinical Zn deficiency model originally suggested by Brugger et al.(Reference Brugger, Buffler and Windisch31). Ninety-six weaned piglets (hybrids of (German Large White × German Landrace) × Piétrain) from 12 litters (50 % male-castrated, 50 % female, initial average body weight 7·96 ± 1·06 kg, 4 weeks of age) were purchased from a commercial pig operation (Christian Hilgers, Freising (Germany)). All animals were housed in individual pens (equipped with individual feeders and nipple drinkers) during the complete study period and had access to drinking water (tap water) ad libitum. The water supply was regularly checked for the Zn concentration to ensure constant negligible background levels. At d1 of the acclimatization phase, room temperature was set to 30°C and gradually decreased by 1°C per week until the end of the experimental phase. The humidity fluctuated between 45 and 55 %. Room temperature and humidity were screened in real-time applying a thermohygrograph drum recorder (Type 252; Lamprecht Meterological Instruments). The light cycle consisted of 12 h daylight and 12 h crepuscular light during night-time. Since the piglet stable provided space for only half of the experimental animals, the study was conducted in two identical subsequent runs (forty-eight piglets per run). Within each experimental run, all sixteen dietary treatments were represented in three blocks. Within each block, the treatments were randomly distributed over pens. Within and between experimental runs and blocks, animals were allocated according to a balanced distribution of live weight, littermates and sex.
In our present study, all animals were fed at the highest applied Zn dose during the 14 d acclimatization period after which, dietary Zn levels were gradually reduced for the different feeding groups(Reference Brugger, Buffler and Windisch31). In the beginning of each individual run, all animals were fed a basal diet ad libitum, consisting mainly of corn and soybean meal with an adequate dietary Zn supplementation level. Zn was added as ZnSO4·H2O (analytical grade, 96 495, Sigma-Aldrich; added amount of dietary Zn: 75 mg/kg, analysed final concentration of total dietary Zn: 103 mg/kg) during the two-week acclimatization phase, to ensure full body Zn stores at d1 of the experimental phase. During this phase, the diet also contained 200 mg hydrated silica/kg diet, which was the carrier substrate for the test substance (GLDA) and served as a placebo in the control diets during the experimental phase. Subsequently, animals were assigned to the sixteen diets according to the above described complete randomised block design. During a total experimental period of 8 d, all piglets were fed restrictively (450 g/d) the same basal diet as during the acclimatisation phase. These feeds contained varying supplementation levels of ZnSO4·H2O (added amount of diet Zn: 0, 5, 10, 15, 20, 25, 45, 75 mg/kg; resulting in analysed final concentrations of dietary Zn: 30·9, 35·7, 40·5, 45·3, 50·8, 55·6, 74·2, 103 mg/kg). These Zn levels were combined with the addition of 200 mg GLDA/kg or 200 mg hydrated silica/kg diet as placebo, respectively, resulting in average analysed final concentrations of GLDA in GLDA supplemented and non-supplemented diets of 198 ± 3·16 mg/kg and < 1 mg/kg, respectively. All feeds were fed in pelleted form and pelleting occurred at 70°C with steam to inactivate native phytase activity.
The highest Zn supplied group (103 mg Zn/kg) without additional GLDA served as positive control because it represented the initial feeding situation for all animals during acclimatisation from which the variations of Zn and GLDA levels of all other groups were changed during the 8 d experimental phase. The basal diet contained all nutrients according to published feeding recommendations for piglets except for Zn (Table 1)(10) including TiO2 (3 g/kg diet) as indigestible marker to measure apparent total tract absorption of diet Zn. All experimental diets were isoenergetic and isonitrogenous and differed only in their total concentrations of Zn, GLDA and hydrated silica, respectively (Table 1 & online Supplementary Table 1). Piglets were monitored daily on general health parameters.
Composition, metabolisable energy and crude nutrient contents of the basal diet

* Premix composition (ppm/feed): 140 ppm MgO; 4 ppm CuSO4 · 5H2O; 100 ppm FeSO4 · 7H2O; 10 ppm MnSO4 · H2O; 0.1 ppm Na2SeO3·5 · H2O; 0.1 ppm KI; 2.5 ppm retinyl propionate; 0.35 ppm cholecalciferol; 10 ppm all-rac-α-tocopherol; 0.1 ppm menadione; 0.5 ppm thiamin; 1.5 ppm riboflavin; 5 ppm nicotinic acid; 1 ppm pantothenic acid; 1 ppm pyridoxine; 7.5 ppm hydroxocobalamin; 1.5 ppm biotin; 0.1 ppm folic acid; 335 ppm choline.
† The contents of metabolisable energy and essential amino acids were estimated according to feed table information (http://datenbank.futtermittel.net/). Vitamin and trace element contents (except Zn) met the requirements according to NRC(10). The corn meal content mixed into the premix as a carrier was a fraction of the 42.3 % total corn meal in the basal diet.
Sampling conditions
Each experimental diet was sampled in triplicate, and samples were stored in air-tight polyethylene bottles at −20°C and milled through a 0·5 mm screen prior to chemical analysis. Animal individual faecal grab samples were pooled from the last three experimental days, freeze-dried and stored at −20°C. All animals were killed by bleeding under anaesthesia (combination of Azaperone and Ketamine) without fasting after eight experimental days, and blood in Li-Heparin monovettes, as well as liver (Lobus hepatis sinister lateralis) and bone (left femoral head) samples were taken. Blood plasma was collected by centrifugation at 1100 g for 10 min at 4°C and stored at −20°C until further usage. Liver samples for gene expression analysis were incubated in RNAlater® according to manufacturer instructions (Thermo Scientific) and subsequently stored at −80°C. Bone samples were ashed (470°C) overnight prior to Zn analysis.
Analyses of dry matter, crude nutrients, total zinc in diets, faeces, bone, blood plasma and liver tissue
We directly followed the workflow and methods applied by Brugger et al.(Reference Brugger, Buffler and Windisch31), regarding the chemical analyses of diets, faeces, bone, blood plasma and liver tissue. Dietary parameters included dry matter, nutrients, Zn and TiO2. Faecal parameters comprised DM, Zn and TiO2. Bone, blood plasma and liver were subject to the analyses of total Zn. Analyses of DM and crude nutrients followed the standard procedures of the Association of German Agricultural Analytic and Research Institutes (Methods 3·1, 4·1·1, 5·1, 6·1·1, 8·1;(Reference Brugger, Buffler and Windisch31)). Titanium dioxide was analysed according to Brandt and Allam(Reference Brandt and Allam35). All Zn concentrations were measured by atomic absorption spectrometry (NovAA 350, Analytik Jena AG) after microwave wet digestion (Ethos 1, MLS GmbH).
Analyses of alkaline phosphatase activity and zinc-binding capacity in blood plasma
Alkaline phosphatase activity in blood plasma was assessed by a commercial kit according to manufacturer instructions (AP 307, Randox Laboraties Ltd.). The percentage Zn-binding capacity, which represents the percentage free Zn binding sites in blood plasma, was assessed according to Roth and Kirchgessner(Reference Roth and Kirchgessner36).
Gene expression analysis
Quantitative PCR assay quality control and chemical procedures (total RNA extraction, RT) were performed according to literature(Reference Brugger, Buffler and Windisch31). Quantity and purity of the extracts from wet liver tissue were measured on the NanoDrop 2000 (Thermo Scientific) (total RNA quantity: 1436 ± 574 ng/µl, ratio of optical density (OD): OD260 nm/OD280 nm: 2·04 ± 0·05). Total RNA integrity was assayed by automated capillary gel electrophoresis (Experion, Biorad) (RNA quality index: 6·44 ± 0·7). Primer pairs (supplier: Eurofins Scientific) were designed for the potential reference transcripts glyceraldehyde-3-phosphate dehydrogenase (GAPDH), beta-glucuronidase (GUSB), beta-actin (ACTB), β 2 microglobulin (B2M), histone H3 (H3), hypoxanthine-guanine phosphoribosyltransferase (HPRT1), lactate dehydrogenase A (LDHA), transferrin receptor protein 1 (TFRC), and ubiquitin C (UBC) as well as the target transcript metallothionein 1A (MT1A), using published porcine sequence information with Primer Blast(Reference O’Leary, Wright and Brister37,Reference Ye, Coulouris and Zaretskaya38) . All oligonucleotides bind to homologous regions of respective transcripts to amplify potential transcript variants (online Supplementary Table 2). We applied the whole Ct data set (target and potential reference gene measurements) to the online tool RefFinder(Reference Xie, Xiao and Chen39), which uses geNorm, Normfinder, BestKeeper and the comparative Delta-Ct method to compare and rank the tested genes. In this way, we identified GUSB and HPRT1 as suitable reference genes for data normalization. The 2–ΔΔCt method(Reference Livak and Schmittgen40) was used to normalise the gene expression data because determination of the amplification efficiency revealed comparable values between 95 and 100 % of applied RT-qPCR assays. See Brugger et al. (Reference Brugger, Buffler and Windisch31) for details on the amplification efficiency estimation and a comparison between results obtained with and without correction for amplification efficiencies.
Statistical analyses and calculations
Concentrations of Zn and TiO2 in feed and faeces were used to calculate the apparent total tract digestibility of diet Zn by applying the subsequent formula. The apparent Zn digestibility was used to calculate the mg amount of diet Zn apparently absorbed per kg feed intake.
 $${Apparent\,Zn\,digestibility\,(\% ) = 100 - \left( {{{\% Ti{O_2}\,in\,feed} \over {\% \,Ti{O_2}\,in\,faeces}} \cdot {{\% Zn\,in\,faeces} \over {\% \,Zn\,in\,feed}} \cdot 100} \right)}$$
Data were analysed using SAS 9.4 (SAS Institute Inc.). Zootechnical data were analysed with the procedure GLM by multifactorial ANOVA (Zn, GLDA, block, Zn*GLDA) and subsequent Student-Newman-Keul’s test to identify significantly different means between groups of animals receiving different concentrations of Zn and GLDA in the diet, respectively. Linear broken-line regression models were calculated using the procedure NLMIXED for blood, bone and liver Zn status parameters. The broken-line regression approach represents an iterative procedure to estimate a potential dietary threshold (breakpoint) within non-linear data sets above and below which, respectively, a significant difference in the response behaviour of a certain parameter to the dietary treatment is evident(Reference Robbins, Saxton and Southern41). Testing non-linear broken line models instead yielded no significant increase in the goodness-of-fit, when applying the workflow of McDonald(Reference McDonald42). If no significant broken-line model could be fitted to a respective data set, a linear regression model was tested instead (procedure REG, y = a + bx; this comprised all blood and bone Zn status parameters). The fitting of regression models was carried out independently for GLDA supplemented and non-supplemented animals. Curve parameters (intercepts, slopes) of respective broken-line and linear regression models of GLDA and non-GLDA supplemented animals were statistically compared by two-sided t tests. Only significant regression models were used for data presentation and interpretation. A threshold of P ≤ 0·05 was considered to be significant for all statistical procedures.
The necessary minimum amount of animals to identify diet Zn effects under the present experimental conditions was based on estimation of effect size and statistical power by applying SAS procedure POWER to the data set of Brugger et al.(Reference Brugger, Buffler and Windisch31). The goal was to reach a minimum power of 1 – β = 0·8 as suggested by McDonald(Reference McDonald42). The present data sets exceeded in any case the minimum statistical power of 0·8. This was confirmed retrospectively by analysing achieved powers of data analysis by broken-line and linear regression models to compare the response of respective Zn status parameters to different concentrations of diet Zn. The underlying effect sizes of presented models as well as t tests (within the procedures REG and NLMIXED) on the significance of certain statistical measures within and between respective models (slopes, breakpoints, intercepts) exceeded in any case the necessary minimum threshold to reach the anticipated minimum power.
Results
Quality of experimental diets
Online Supplemental Fig. 1 highlights the results of statistical analyses on diet quality with respect to the supplementation of Zn and GLDA. Linear regression of supplemented amounts of dietary Zn against average analysed dietary Zn concentrations indicated a high degree of homogeneity of the final feed mixtures as expressed by a significant slope (P < 0·0001) of 0·97 (R2 = 1·0), which points towards high analytical recovery close to 100 %. Finally, linear regression of Zn contents in batches without vs. with addition of GLDA indicated a highly significant (P < 0·0001) slope of 1·01 (R2 = 1·0). This highlights that Zn loads at respective Zn dose levels were identical between the batches containing or missing the test substance, respectively. Online supplementary Table 1 shows the average analysed GLDA concentrations within the sixteen batches of experimental diets. GLDA-supplemented dietary batches showed an average concentration of 198 ± 3·16 mg/kg, which represents an analytical recovery rate of 99 % with respect to the supplemented level of 200 mg/kg diet.
Animal health and zootechnical performance
No animals were excluded from the analysis. No animals showed signs of clinical Zn deficiency (e.g. growth depression, anorexia, impaired organ development, tissue necrosis, etc.(Reference Tucker and Salmon43)) or any other signs of pathological events throughout the whole feeding trial, based on continuous veterinary surveillance. No significant differences were observed between feeding groups regarding their average daily weight gain, average daily feed intake or feed:gain ratio (online Supplementary Table 3).
Apparent zinc absorption
Figure 1 presents broken-line models on the response of apparent Zn absorption to varying dietary Zn levels in the presence or absence of GLDA. The statistical parameters of the respective regression curves are shown in online Supplementary Table 4. The results of T–statistics for the comparison of curve parameters of GLDA supplemented vs. control animals are provided in Table 2. Apparent Zn absorption exhibited a non-linear behaviour in response to changes in dietary Zn concentrations, independently of GLDA inclusion. Break points were identified for curves reflecting the response of control and GLDA supplemented animals, respectively (P < 0·01 in both cases), at a similar dietary Zn level. Also, the slopes over dietary Zn doses below the respective breakpoint were numerically identical between both curves, whereas the slopes reflecting the response to diet Zn above the breakpoints were numerically lower for the GLDA curve (P > 0·05). Y-intercepts for linear curve sections above and below the respective dietary thresholds were in any case higher for the GLDA curve, but this difference was only significant for the curve section above the breakpoint (P < 0·0001).
Response of 1apparently absorbed diet Zn (mg/kg diet intake) in weaned piglets fed 2control and 2treatment diets for 8 d (see supplementary Table 3 for detailed information on the statistical measures of the respective regression models). 1Apparently absorbed feed Zn was calculated on the basis of respective ratios of Zn and TiO2 concentrations in feed and faeces, respectively, and is expressed as mg/kg feed intake;2Treatment diets received 200 mg GLDA/kg and control diets received 200 mg hydrated silica/kg diet as a filler, respectively, each in the presence of varying dosages of dietary Zn from ZnSO4 · H2O (+0, +5, +10, +15, +20, +25, +45 and +75 mg/kg). Values are arithmetic means ± sds, n 12. Error bars represent respective standard deviation of mean values of control and treatment diets, respectively. Dashed grey and black errors highlight statistical breakpoints in parameter response of control and treatment diets, respectively, to varying dietary Zn supply. Diet Zn, dietary Zn; GLDA, L-glutamic acid N,N-diacetic acid, tetrasodium salt; Zn, zinc. ![]() , Zn sulphate;
, Zn sulphate; ![]() , GLDA + Zn sulphate.
, GLDA + Zn sulphate.

T–Statistics of curve parameters from regression models describing the response of different Zn status parameters in control v. Treatment animals receiving different dietary Zn supply (respective regression curves and models can be found in the online Supplementary Files: Tables 3–5)
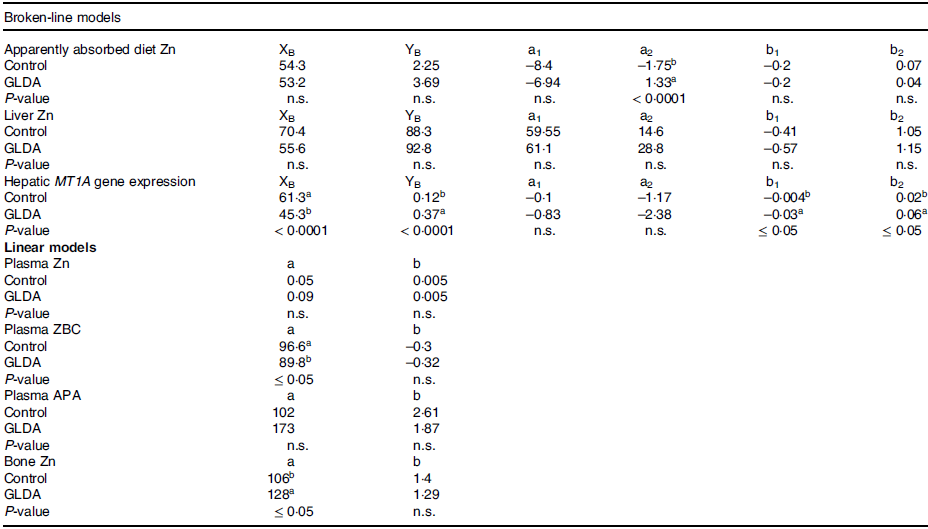
P ≤ 0·05 was considered to indicate a significant difference between respective curve parameters; a, y-intercept of linear regression models; a1, a2, y-intercept of linear broken-line segments below and above the respective breakpoint, respectively; APA, alkaline phosphatase activity; b, slope of linear regression models; b1, b2, slope of linear broken-line segments below and above the respective breakpoint, respectively; GLDA, l-glutamic acid N,N-diacetic acid, tetrasodium salt; MT1A, metallothionein 1A; n.s., not significant; XB, x-coordinate of the breakpoint; YB, y-coordinate of the breakpoint; ZBC, zinc-binding capacity; Zn, zinc.
Response of status parameters in bone and plasma
Figure 2 highlights the response of Zn status parameters in bone and plasma to varying dietary Zn in the presence or absence of GLDA, respectively. Respective statistical regression parameters for these curves can be found in online Supplementary Table 5. T-statistics on the comparison between the curve parameters in the presence of GLDA vs. control are shown in Table 2. Zn concentrations in bone and plasma as well as plasma Zn-binding capacity and plasma APA concentration followed a straight linear response over the whole dose range for GLDA and control animals, respectively. Individual slopes were in any case significant (P < 0·001). This was also the case for the individual Y-intercepts (P ≤ 0·02) with the exception of plasma Zn in response to diet Zn with and without GLDA, respectively. Slopes were parallel for plasma Zn and Zn-binding capacity curves, respectively, whereas slopes of control curves were in any case numerically higher for plasma APA and bone Zn (P > 0·05). All intercepts of GLDA curves increased compared to respective control curves with the exception of plasma Zn binding capacity for which it was decreased. However, these differences were only significant for bone Zn and plasma Zn binding capacity (P ≤ 0·05).
Response of Zn (a), 1relative Zn-binding capacity (b) and alkaline phosphatase activity (c) in blood plasma as well as 2bone Zn in weaned piglets fed 3control and 3treatment diets for 8 d (see supplementary Table 5 for detailed information on the statistical measures of the respective regression models). 1Treatment diets received 200 mg GLDA/kg diet and control diets received 200 mg hydrated silica/kg diet as a filler, respectively, each in the presence of varying dosages of dietary Zn from ZnSO4 · H2O (+0, +5, +10, +15, +20, +25, +45 and +75 mg/kg). Values are arithmetic means ± sds, n 12. Error bars represent respective standard deviation of mean values of control and treatment diets, respectively. Diet Zn, dietary Zn; GLDA, l-glutamic acid N,N-diacetic acid, tetrasodium salt; Zn, zinc. ![]() , Zn sulphate;
, Zn sulphate; ![]() , GLDA-Na + Zn sulphate.
, GLDA-Na + Zn sulphate.

Response of zinc status parameters in liver
The response in liver parameters to diet Zn in the presence and without GLDA is shown in Fig. 3 and the respective statistical parameters of the curves are presented in online Supplementary Table 6. T-statistics on comparisons between respective GLDA and control curves can be found in Table 2. Both, liver Zn and hepatic MT1A gene expression responded in a non-linear broken line fashion. Significant dietary thresholds were estimated at 70·4 and 55·6 mg/kg diet as well as 61·3 and 45·3 mg Zn/kg diet for liver Zn as well as MT1A gene expression (control and GLDA curves, respectively) (P ≤ 0·004). Breakpoints of GLDA curves were numerically lower than in control curves but this difference was only statistically significant for MT1A gene expression (P < 0·0001). GLDA curves showed steeper slopes than control curves over dietary Zn doses above and below the respective dietary Zn threshold; however, this difference was only significant for MT1A gene expression (P ≤ 0·05). None of the Y-intercepts was significantly different between curves (P > 0·05), but the values were numerically higher for liver Zn in the presence of GLDA and MT1A gene expression compared to control.
Response of liver Zn and 1relative hepatic metallothionein 1A gene expression in weaned piglets fed 2control and 2treatment diets for 8 d (see supplementary Table 4 for detailed information on the statistical measures of the respective regression models). 1xfold differences in relative hepatic MT1A gene expression response in treatment and control groups were calculated relative to a gene expression response of 1·0 (not regulated) in the highest Zn supplied control group (103 mg/kg diet without GLDA addition) using the relative gene expression value according to Livak and Schmittgen(Reference Livak and Schmittgen40); 2treatment diets received 200 mg GLDA/kg and control diets received 200 mg hydrated silica/kg diet as a filler, respectively, each in the presence of varying dosages of dietary Zn from ZnSO4 · H2O (+0, +5, +10, +15, +20, +25, +45 and +75 mg/kg). Values are arithmetic means ± sds, n 12. Error bars represent respective standard deviation of mean values of control and treatment diets, respectively. Dashed grey and black errors highlight statistical breakpoints in parameter response of control and treatment diets, respectively, to varying dietary Zn supply. Diet Zn, dietary Zn; GLDA, l-glutamic acid N,N-diacetic acid, tetrasodium salt; Zn, zinc. ![]() , Zn sulphate;
, Zn sulphate; ![]() , GLDA-Na + Zn sulphate.
, GLDA-Na + Zn sulphate.

Discussion
The present study aimed to test the value of GLDA to improve diet Zn utilization in a phytate-rich diet supplemented with decreasing levels of Zn from ZnSO4·H2O. The experimental design was based on the approach developed by Brugger et al.(Reference Brugger, Buffler and Windisch31) in which finely graded differences in Zn status are induced ranging from different grades of SZD to mild oversupply above the estimated gross Zn requirement (∼60 mg Zn/kg diet). This double-dose response approach allows a comparative regression analysis where each GLDA supplemented group at given Zn dosage is compared to a negative control receiving the same amount of Zn without the test substance.
Effects of diminishing levels of Zn supply irrespective of l-glutamic acid N,N-diacetic acid
Classic experiments in rodents have demonstrated the basic principles of mammal Zn homoeostatic regulation in light of varying Zn supply levels. Under the conditions of deficient dietary Zn supply, the organism attempts to stabilise its endogenous Zn levels by increasing the expression and presentation of SLC39A4 at the apical gut mucosal layer, which has been shown in mice and pigs(Reference Weaver, Dufner-Beattie and Kambe44,Reference Brugger, Hanauer and Ortner45) . This explains the increase in the relative efficiency of true Zn absorption, as demonstrated in 65Zn-labelled rats(Reference Weigand and Kirchgessner46,Reference Windisch47) . In parallel, endogenous losses are reduced to an inevitable minimum mostly by reducing pancreatic losses into the gastrointestinal tract, through modulation of ZIP and ZnT transporters(Reference Brugger and Windisch34,Reference Weigand and Kirchgessner46) . Studies in mice suggest this is due to down- and upregulation of SLC39A5 and SLC30A1, respectively, at the basolateral membrane of pancreatic acinar cells and reduced SLC30A2-dependent Zn loading into zymogen granules within these cells(Reference Liuzzi, Guo and Chang48–Reference Guo, Lichten and Ryu51). On the other hand, the described adaptation of Zn absorption capacity and endogenous losses reverses under conditions of satiated Zn requirements to avoid excess accumulation and the associated detrimental consequences of excessive Zn retention(Reference Weaver, Dufner-Beattie and Kambe44,Reference Weigand and Kirchgessner46,Reference Liuzzi, Bobo and Lichten49) . These principles have recently been translated to pigs under conditions of SZD(Reference Brugger, Buffler and Windisch31). The authors demonstrated a non-linear adaption of apparent Zn absorption and liver Zn while plasma and bone parameters responded in a straight linear fashion. The data from the present study directly correspond to these findings irrespective of the GLDA supply level. Again, we were able to map the gross Zn requirement threshold by applying the apparently absorbed amount of dietary Zn under given dietary conditions in a comparable range as the previous time this piglet model was used (55 vs. 58 mg/kg diet in the present data set vs. the earlier dataset)(Reference Brugger, Buffler and Windisch31). Supplementation above this threshold led to a satiation response of apparently absorbed dietary Zn and a linear accumulation of liver Zn. The latter was accompanied by a linear increase in MT1A gene expression. This reflects the well-described phenomenon of unregulated passive influx of Zn, which is less efficient than the regulated active route(Reference Martin, Lodemann and Bondzio52). Interestingly, plasma and bone parameters again responded in a straight linear fashion despite the non-linear response of Zn absorption and liver Zn. This phenomenon seems to reflect the short experimental period since long-term studies, e.g. in chickens also point towards a non-linear response of these parameters after > 2 weeks(Reference Wedekind, Hortin and Baker53). This discrepancy can be explained by the time-frame of Zn homoeostatic adaption. After changing dietary supply conditions, the organism needs about 3–5 d to adapt its absorption capacity and endogenous losses, which has been shown earlier in rats(Reference Windisch and Kirchgessner54). Hence, during this time frame the organism still loses disproportionally more Zn into the gastrointestinal tract, which is compensated by increased bone Zn mobilization. In our present study as well as the earlier work of Brugger et al.(Reference Brugger, Buffler and Windisch31) all animals were fed at the highest applied Zn dose during the 14 d acclimatization period after which, dietary Zn levels were gradually reduced for the different feeding groups. The reduction from the highest dose down to the gross Zn requirement threshold appeared to promote bone Zn losses, which highlights the detrimental effect of fluctuations in nutritionally available Zn in time. This occurs even in diet Zn ranges that do not show apparent phenotypical effects and are expected to be sufficient to meet mid-term Zn requirements.
Effects of l-glutamic acid N,N-diacetic acid under conditions of insufficient dietary Zn supply
Although the general response pattern to diminishing dietary Zn supply of GLDA-supplemented animals was not different to that of the control animals, there was an overall numerical improvement as compared to non-supplemented animals. This was indicated by higher intercepts of GLDA curves, despite the slopes being in most cases parallel to the control curves. This was different for liver parameters, indicating that most of the Zn absorbed was quickly released to the circulation for transportation to soft tissues. Overall, this suggests that GLDA holds more Zn absorbable in the presence of high phytate concentrations within the gastrointestinal lumen, which is in line with earlier data on GLDA effects in broiler chickens(Reference Boerboom, Busink and Smits21,Reference Boerboom, Busink and Smits22) . Comparing the X-axis intercepts of the regression curves of apparently absorbed dietary Zn in GLDA-supplemented vs. control animals yields a numerical difference of 8 mg Zn/kg diet. In other terms, dietary Zn could be reduced by 8 mg/kg to result in the same parameter response. Based on own in vitro observations, GLDA at 200 ppm can bind around 40 ppm of Zn under neutral aqueous conditions (data not shown), making the difference observed here lower than expected, as well as lower than observed in previously published work(Reference Boerboom, Busink and Smits21,Reference Boerboom, Busink and Smits22) . This discrepancy can be explained by the present experimental design, since the exposure to experimental feeds was limited to 8 d and occurred in a restrictive manner. Especially interesting is the finding of increased parameter response at the lowest Zn dose, which received just the native Zn from raw feed components. At the lowest supply level, the response in apparent Zn absorption of control animals was negative (-2 mg Zn/kg feed intake), which means these animals on average lost more Zn with the faeces than they consumed. Native Zn in these diets ranged around ∼30 mg/kg, which is the usual level for corn-soybean-based diets. In gross terms, this content would be sufficient for piglets, as they are estimated to have a net Zn requirement of 15–20 mg/kg diet, when being fed semi-purified feed components mostly absent of antagonistic substances like phytate(Reference Smith, Plumlee and Beeson55,Reference Shanklin, Miller and Ullrey56) . The fact that it was necessary to supplement ∼25 mg Zn/kg on top of the basal feed to satiate Zn requirements at ∼55 mg/kg indicates that the native Zn fraction has been completely associated to phytic acid during the transfer through the gastrointestinal tract. However, in the presence of GLDA less native Zn appeared to be associated to phytic acid, which was evident by the higher apparently absorbed amount of Zn in the GLDA supplemented group receiving the lowest dietary Zn supply (–0·5 mg Zn/kg feed intake). The association of Zn to phytic acid happens during different stages of absorption, when the phytic acid dissociates under the acidic conditions in the stomach and, subsequently, is able to chelate divalent cations within the neutral pH of the small intestinal lumen(Reference Humer, Schwarz and Schedle30). Hence, GLDA appeared to protect a significant fraction of soluble luminal Zn from precipitation by phytic acid and sustained Zn solubility for transport mechanisms in the gut mucosa. This promoted higher Zn retention in GLDA-supplemented animals, which led to lower necessity for mobilization of body Zn stores in SZD piglets (+16·6 mg Zn/kg bone ash in GLDA supplemented animals at native supply (30·9 mg Zn/kg diet) compared to control) to compensate for endogenous losses in the presence of GLDA.
Effects of l-glutamic acid N,N-diacetic acid under conditions of mild dietary zinc oversupply
All animals fed above the gross Zn requirement threshold experienced a mild excess absorption as indicated by a linear increase in liver Zn. This phenomenon of unregulated passive Zn uptake has been described earlier for example in pigs(Reference Martin, Lodemann and Bondzio52). GLDA-supplemented animals experienced a significantly higher Zn accumulation in liver than control animals, suggesting that GLDA increased the non-regulated Zn influx, likely through uptake by divalent metal transporters other than SLC39A4. The reduced slope of apparent Zn absorption over Zn doses above the gross Zn requirement in the presence of GLDA suggests that the organism responded to this influx by a more efficient excretion of excess amounts via pancreatic and hepatic routes in combination with a stronger down-regulation of active absorptive processes (mainly by SLC39A4) at the apical mucosal membrane, based on the above discussed earlier published data sets on Zn homoeostatic regulation in mammals. However, this has yet to be confirmed in future studies applying techniques that allow for a discrimination of unabsorbed dietary Zn and endogenously secreted Zn, as well as by quantification of Zn transporter expression in the mucosa under the present experimental conditions. The effect of GLDA on the influx of other divalent trace elements in piglets should also be determined in future studies. It is noteworthy that no effect of GLDA on retention of other trace elements was observed in poultry in previously published works(Reference Boerboom, Busink and Smits21,Reference Boerboom, Busink and Smits22) .
In conclusion, 200 mg GLDA/kg diet increased Zn retention in weaned piglets over the whole range of applied dietary Zn dosages (30·9–103 mg/kg diet). GLDA can mitigate negative effects of high-phytate levels in plant-based diets, by sustaining Zn solubility, thereby improving Zn availability. This reduces the chance of (sub) clinical Zn deficiency in the field. In farming animals, this could lead to a reduction in overall necessity for Zn fortification and the associated Zn emissions into the environment. In current practice, the uncertainty in the availability of zinc as affected by dietary and digestive factors is compensated by calculating gross requirements from net requirements using a worse-case availability factor in the conversion(Reference Brugger and Windisch57,Reference Underwood58) . Consequently, the higher levels of Zn inclusion lead to a reduction in relative efficiency of uptake, as levels fed are higher than Zn requirements(Reference Weigand and Kirchgessner46). As a consequence, Zn in manure increases, which can result in high Zn levels in soil post-fertilisation(Reference Brugger and Windisch59–Reference Monteiro, Lofts and Boxall61). Such pollution has been accompanied by declined crop yields in maize, sorghum and bush beans(Reference Abd El-Hack, Alagawany and Arif62). In this context, the high biodegradability of GLDA together with the lower Zn inclusion levels allows for more sustainable farming practices. We are confident that these results can be directly translated from pigs to humans given the high similarities in nutrition physiology between both species.
Acknowledgements
The authors thank M. Gertitschke, A. Reichlmeir, M. Janovsky and T. Sonnhütter for excellent technical assistance. Special thanks is related to Dr. med. vet. A. Künert for veterinary consultation and advise.
Trouw Nutrition
Conceptualisation, D. B., J. M-T., R. B. and W. W.; methodology, D. B., W. W.; investigation, D. B. E. G. J. O.; data curation: E. G., J. O.; formal analyses: G. B., D. B.; visualisation: G. B., D. B.; writing – Original Draft, G. B., D. B.; Writing – Review & Editing, G. B.,D. B., J. M-T., R. B. and W.W.
D. B., W. W., no conflicts of interest. G. B., R. B. and J. M-T. are employed at Trouw Nutrition R&D, which was the funding party of this study and also supplied the test material and the supplemental zinc source.
Supplementary material
For supplementary materials referred to in this article, please visit https://doi.org/10.1017/S000711452100489X


 Open access