

Friedrich Engels arrived in Manchester in 1842 to oversee family investments in textile manufacturing. Within a few months, however, his interest in the workings of cotton mills was supplanted by the curious urban life of the industrial city. With the help of his Mancunian lover, Mary Burns, Engels was exposed to Manchester’s many lives, including gritty working-class districts, which he carefully recorded in his journals. These entries would become The condition of the working-class in England in 1844, which describes an industrial town characterized by aesthetic dichotomy and rampant inequality: the cramped, sewage-filled alleys of the working-class poor were a stark contrast to the grand and glittering establishments frequented by the middle and upper classes, who seemed ignorant of the plight of their neighbours.Footnote 1 His experience in Manchester served as an early, transformative influence on his future political views, offering vivid and visceral illustrations of poverty and inequality to fuel his fight against the bourgeoisie.Footnote 2 Engels’s account is but one of several which emerged from Manchester in the second quarter of the nineteenth century, as both local Englishmen and continental visitors recorded rhythms and practices of its life. Physician James Kay-Shuttleworth’s pamphlet on the ‘moral and physical condition of the working classes’ pleaded intervention to address standards of living, as did local merchant and alderman Joseph Adshead’s Distress in Manchester; while French journalist Leon Faucher focused more on the economic dimensions of the city.Footnote 3 Local newspapers catalogued urban conditions in the poorest neighbourhoods, and in his address to the city’s churchwardens and sidesmen in 1841, Canon Richard Parkinson decried that there was ‘no town in the world where the distance between the rich and the poor is so great, or the barrier between them so difficult to be crossed’, blaming mutual ignorance for impeding the social improvement of the lower orders.Footnote 4 Across these texts, Manchester is portrayed as a city where separate classes rarely interacted and the urban poor were abandoned to their suffering, illustrating the polarity and irony of progress in early Victorian cities. The severity of conditions in British industrial centres were widely publicized and supported through a growing body of social statistics, which encouraged reformers to push forth a series of local and national regulations aimed at tackling the growing gap between rich and poor through attempts to build more healthful, moral cities – none more of a target than Manchester.Footnote 5
Over time, however, the conflation of class division and spatial segregation has come under scrutiny. Alternative readings of primary accounts suggest more nuance in the spatialization of class and the patterns which fomented and perpetuated class division, engendering a critical question: to what extent was segregation a spatial phenomenon? Is the model of stark segregation in Manchester a ‘true’ reflection of historical conditions? And in cases of discrepancy, how can we reconcile them? Despite the undeniable value of qualitative material, over-reliance on such sources has historically limited the accuracy and specificity of answers to these questions. Fortunately, developments in quantitative methods have improved possibilities in historical-geographical analyses. Employing these tools and techniques in conjunction with traditional, qualitative approaches to social and cultural history offers richer, layered assessments of urban dynamics with significant results.
This article begins by outlining the existing debate on segregation in Victorian cities and specifically on Manchester. Using historical census data to study class distributions, it then presents evidence on the residential patterns of Manchester in the early 1850s which contradicts traditional narratives of spatial clustering and compartmentalization. In fact, census data from the period demonstrates residential heterogeneity rather than separation and allows us to focus on the aspects of society which did, rather, define the experience of segregation. With these findings in mind, I review primary source material to reassess urban class dynamics to reconcile spatial conditions and social perceptions of segregation, confirming the position that early Victorian cities were residentially integrated. While rich and poor lived cheek-by-jowl, temporal rhythms of employment, institutionalized cultures of class, and emerging modes of urban discipline all produced practices which differentiated one class from another in industrial Manchester.
I
The Victorian city has been a popular subject of study for historians since the early 1970s, with the emergence of urban history as a subfield. The impact of industrialization on the social, economic, and physical lives of nineteenth-century towns provided fruitful avenues of research, prompting theories of urban development, political economy, and the legacies of early reform. A key aspect of this modernization involved the separation of the home from the workplace.Footnote 6 This separation redefined processes of class formation as different communities formed both within and without the workplace and the home and in Manchester, one of the earliest cities to see the consolidation of the manufacturing sector from small workshops into increasingly large factories, the relationships between work and class are especially pertinent.
As the epicentre of Lancashire’s textile industry, the ‘Cottonopolis’ of the industrial era, Manchester epitomized the rapidity of late eighteenth- and nineteenth-century urban growth. The development of manufacturing drew in hundreds of thousands of workers and their families from the countryside, tripling the town’s population between 1800 and 1850, and enticed industrialists and their capital to build up the city. By the middle of the nineteenth century, cotton was but one of Manchester’s growing sectors. While the textile industry remained dominant, parallel industries such as chemical and machinery manufacturing substantially contributed to the occupational makeup of the city, as well as growing sales and service sectors.Footnote 7 The plurality of sectors in Manchester’s economy fostered complex new social patterns, including the emergence of middle and middling classes, but appeared to widen the divide between England’s ‘two nations’.Footnote 8
Simon Gunn has described the ways in which this middle class developed with both occupational and economic features – through direct involvement in the productive economy outside of wage labour, as well as cultural and ideological ones – including the development of domestic and religious ideologies which will be further explored below.Footnote 9 ‘Respectability’ became a specific signifier of the middle-class and aspiring skilled workers, who used the term to differentiate themselves from the ‘roughness’ of the lower working classes and ‘immorality’ of pauperism, and this terminology was wielded against the working classes in condemnation of their conditions of life. Historical conventions usually treat class as a nebulous type of categorization which includes but transcends the simple variable of employment, yet work remains a crucial aspect in understanding the city’s urban dynamics.Footnote 10 In the case of industrial Britain, Patrick Joyce has expounded upon the close relationship between work and class.Footnote 11 Despite his warnings against conflation, it remains clear that the former greatly informed the latter. While occupation is used as a proxy for class in the initial, quantitative analysis of Manchester’s residential patterns, the subsequent discussion includes supplementary characteristics and habits to define the separation of classes.
Segregation has always been central to studies of British Victorian cities, yet conclusions regarding its extent remain unsettled. As Colin Pooley has explained, different geographic and methodological focuses have produced differing opinions on the types, extents, and timelines of socio-spatial separations which make cohesive and generalizable claims difficult and limited.Footnote 12 H. J. Dyos and D. A. Reeder’s concept of the ‘slums and suburbs’ – which described a dynamic in which the affluent escaped urban centres in favour of spacious suburbs, leaving the poor to form slums in their wake – has been a model for nineteenth-century urban development yet studies of Leeds and Merthyr Tydfil counter this narrative.Footnote 13 In his study of Victorian Leeds, David Ward has demonstrated that an overemphasis on the wealthiest classes grossly distorted contemporary visions of residential segregation which declined in the second quarter of the nineteenth century.Footnote 14 In fact, ‘segregation’ has been accepted as an identifying characteristic of modern cities, yet the conditions encompassed are often vague and misleading.Footnote 15 In Manchester, the issue is especially contentious.
Qualitative source material, and in particular Engels’s Condition, has been used by historians to fit a pattern of severe concentric segregation to the city aligning with Dyos and Reeder’s suggested model – with the working poor in central slums surrounded by the emerging middle classes, and the wealthiest at the outskirts of the city – though with acknowledgement that Manchester’s dense central core increasingly gave way to warehouses from the mid-1840s. Engels described this commercial core as being encircled by ‘unmixed working-peoples’’ quarters beyond which dwelled the ‘middle bourgeoisie’ and further beyond, the upper classes.Footnote 16 Key thoroughfares connected these wealthier suburbs to Manchester, allowing the ‘aristocracy’ access to the commercial district without needing to interact with the poorer slums lining the area. Assertions of this spatial separation have percolated through the historiography: Alan Kidd, a historian specialized in Manchester, cited Engels’s model of concentric segregation in his own book on the city, and this historiographic positioning of the wealthy at the urban periphery has been repeated in Roger Scola’s book on the city’s food networks and Tristram Hunt’s on the construction of Victorian cities, while Gunn has pointed to spatial segregation as a defining condition of class formation in the city over the course of the century.Footnote 17 The prevailing narrative has been one which describes the exclusion of the working poor from middle-class parts of the city, maintaining a tenuous ecosystem in which the ‘two nations’ rarely interacted.
Others, however, have denounced this portrayal of mid-nineteenth-century Manchester. Richard Dennis declared this vision of Manchester a caricature – a sentiment which has been shared by others who have asserted the heterogeneity of the city’s urban character.Footnote 18 Engels’s depiction of the city has faced increasing scrutiny and scepticism; scholars such as Asa Briggs and Patrick Joyce have pointed out that the vision of the city described in Condition appears to have been painted with broad strokes and creative liberties, conflating mid-nineteenth-century Manchester both with its earlier period and with its surrounding neighbours.Footnote 19 Despite this, it is understood to retain value as a historical source; taken with a grain of salt and an eye for the dramatic flair, alongside additional records from the period, it offers valuable insight into the complex urban dynamics of the city. A critical weakness in the urban historiography of Manchester has been its over-reliance on Engels as the primary qualitative source, despite widespread recognition of his weaknesses, with only passing integrations of others who wrote of life in early Victorian Manchester or the quantitative material which exists from the period. This narrow-minded view is especially questionable given the breadth of material which does exist to provide comparative descriptions of the city. In fact, concern with the state of the working class alongside a burgeoning ambition to catalogue Britain and its empire spurred a wave of social and demographic investigations around the mid-century.Footnote 20 Local and national surveys combined aspects of qualitative and early statistical research both to outline the realities of life in Britain as well as inform urban reform and national policy, exploring new frameworks for what Alain Desrosières has described as work which is ‘simultaneously oriented…toward description and prescription’.Footnote 21 These early forays into the social sciences introduced new practices for governance involving the collection of ‘knowledge’ and as a result, there exists a rich collection of qualitative source material specific to Manchester, including local newspapers, magazines, trade books, and missionary and medical reports which offer key insights into modes of living in the Shock City (as dubbed by Briggs for the speed and intensity of industrialization it experienced), a range of which are presented in this article. Concern with the plight of the urban poor, specifically, meant that many studies and surveys focused predominantly on those worst off with only passing mentions of the middle classes who bridged rich and poor. Complementary use of quantitative and qualitative material allows each to fill critical gaps left by the other by marrying numbers and stories.
To this effort, David Cannadine’s idea of ‘shapes on the ground, shapes in society’ lends itself particularly well.Footnote 22 Its utility arises from the observation that perceptions of societal patterns might be incompatible with spatial physicality, in other words: whether what the Victorians ‘thought was happening was closely consistent with what was actually happening’, or not.Footnote 23 Compartmentalizing a city’s physical versus social forms allows for multilayered analysis of urban fabric which understands these elements as separate, albeit often dependent and overlapping. In Manchester, this separation of layers allows us to reconcile social and spatial realities which have engendered debates around ‘segregation’ by unpacking this complex, nebulous term. What Victorians ‘thought’ was happening still matters very much, but comparing these perceptions against concrete geographic patterns permits more accurate reconstructions of life in the city to understand how such perceptions arose. Pooley used the similar phrase of ‘patterns on the ground’ to discuss how Victorian populations mediated identity and appropriations of space in their cities over the course of the nineteenth century.Footnote 24 Crucially, he explains how Victorian cities could be quite residentially mixed while still exhibiting strong patterns of social differentiation due to differences in work and consumer practices. As we will see, Manchester’s architecture and urban fabric played critical roles in the development of particular class dynamics in ways which, as both Gunn and Joyce have explained, were both physical and symbolic.Footnote 25 The built environment dictated specific forms of interaction through the puzzle of public and private space which made up the city, but overlaying these were cultural readings which produced particular patterns of self-segregation and social discrimination which reinforced class divides.
As a final note, this article’s discussion of ‘segregation’ relies largely on the concept of encounters: how, where, and with what frequency did individuals of different classes interact? Perhaps of equal importance, how were those interactions registered and perceived? By exploring the different spaces in and around which urban life was conducted, I study the patterns of circulation and occupation which influenced social heterogeneity through likelihood of encounter. In certain cases, societal norms undermined the weight of mixed-class encounters, thereby exacerbating the dissonance between ‘shapes on the ground’ and ‘shapes in society’. The practices of examination and surveillance – to borrow from Michel Foucault – developed by upper-middle-class Victorians brought about more attention to those who failed to meet such standards, whether due to physical appearance or general comportment, and thus were more easily othered.Footnote 26 While the range of those who ‘passed’ was wide, the homogeneity of behaviour which was necessary for this integration made it more difficult to identify class differences. As such, performance and aesthetics both became critical dimensions of class formation and identity in the Victorian city and fed perceptions of class divides.
II
The great limitation in comparing the physical versus social dimensions of segregation in Victorian cities has been determining the finer contours of the former. The extent and patterns of residential segregation in British Victorian cities has been a popular topic for urban historians since the 1970s, yet these have been limited in either scope or scale due to their labour intensiveness.Footnote 27 In recent years, however, large-scale data digitization such as the Integrated Census Micro-Data project have created unprecedented opportunities for the revisitation of these traditional questions.Footnote 28 The granular reconstruction of geo-demographic data, specifically, can be used to explore urban occupation, mobility, and most pertinent to this article, segregation.Footnote 29 Much of recent work on such reconstructions of British cities rely on automated methods which either fail to link records at any scale below street-level or else rely on asynchronous geographic sources which introduce widespread inaccuracies.Footnote 30 However, the existence of geographic surveys and commercial directories from mid- to late nineteenth-century Manchester make possible a reconstruction of the city’s residential demography at a highly granular, and accurate scale. From these materials, I have linked individuals from the 1851 census to their specific building address and used this dataset for the analysis of spatial patterns.Footnote 31 While a range of demographic variables are available from these censuses, the focus here is on occupational descriptors, used as a proxy for class. Individuals were categorized under one of six classes based on their listed occupation. The six classes approximate the socio-economic structures of industrial Manchester by drawing on historical wage data from contemporary Lancashire to adapt the 1911 Registrar-General’s scheme for the social classification of occupations, a widely accepted social scheme used by the General Register Office until the end of the twentieth century.Footnote 32 These are attributed as follows:
1. Professional Occupations, including doctors, engineers, national defence officers, and clergymen
2. Managerial and Technical Occupations, and Dealers, including shop owners, jewellers, and news agents
3. Skilled Occupations, including many employed in the transports, machine and building industries, and clerks
4. Partly-Skilled, including service workers, police and national defencemen, stone miners and quarriers, and labourers in semi-specialist industries (wire, tin, wood)
5. Unskilled (General) Labourers
6. Unskilled (Textiles, Mining, Agriculture) Labourers
Spatializing this occupational structure offers visualizable patterns of distribution for the city, and the granularity of the data makes analysis possible at a multiplicity of scales. The smallest unit in the original 1851 census is that of the registration sub-district, a wide scale which obscures important micro-patterns, but the creation of smaller and more standardized units captures more nuance and facilitates comparison. While the census, collected over the course of a single day in March 1851, can only provide a snapshot of a city which was rapidly changing, it remains valuable material for the analysis of spatial conditions in mid-century Manchester.
Figure 1 depicts working-class (classes three through six) proportions for neighbourhood across the city, with population data aggregated into 200-metre tiles. This measurement reveals the differences in social composition across Manchester; the commercial district to the south-west, for example, was much more diverse than the residential zones of the city to the north and east. With few exceptions, these areas seemed to have proportions of working-class individuals which were consistently higher than the city-wide mean of 79.3 per cent, results which evoke the ‘girdle’ described by Engels.Footnote 33 And yet by no means was this girdle ‘unmixed’: even in the least diverse parts of the city, nearly or above 10 per cent of the population belonged to the wealthier employed classes. This evidence undermines the notion that the middle and upper-middle classes managed to avoid the lower orders based on residential patterns alone. The granularity of data, furthermore, makes the study of building-specific heterogeneity possible. These results cast further aspersions on the degree of neighbourhood segregation in the mid-century, for the extent of class heterogeneity of addresses is striking. By calculating building heterogeneity as the difference between the highest and lowest class categories at each address, the data shows that over 60 per cent of buildings housing the wealthiest occupational classes also housed unskilled labourers (Table 1). Of these, 61 per cent were living in multi-household buildings. Unlike the concentric model suggested by Engels, the wealthier classes were by no means confined to the core and the periphery, sheltered from the poor in townhouses and villas.
Working-class proportions across Manchester 1851, by 200m tile.

Range of classes in buildings housing class 1 individuals, calculated as the difference between class 1 and the lowest class present at the same address. Data: I-CeM, Census of England and Wales 1851

Comparing Manchester’s occupation distribution with its surrounding townships further undermines the applicability of the ‘slums-and-suburbs’ model for the area (Table 2). Cheetham’s higher proportion of upper-middle class aligns with the literature; however, the larger township of Salford closely mirrors Manchester’s occupational structure which undermines its association as a distinctly ‘working-class’ suburb. Within Manchester itself, certainly, some parts of the city housed higher proportions of the working classes. Yet, the middle and upper-middle classes were consistently found not only in the same neighbourhoods but the same buildings as individuals from the lowest orders. These results definitively ascertain that mid-nineteenth-century Manchester was indeed a residentially integrated city. This consequently invites us to revisit the conditions of segregation in Victorian Manchester which have informed the historiographic narrative of socio-spatial divisions. One dimension explaining the dissonance between physical closeness and social isolation is the city’s housing stock, which allowed members of different classes to live together but apart.
Class distribution of Manchester and surrounding townships. Data: I-CeM, Census of England and Wales 1851

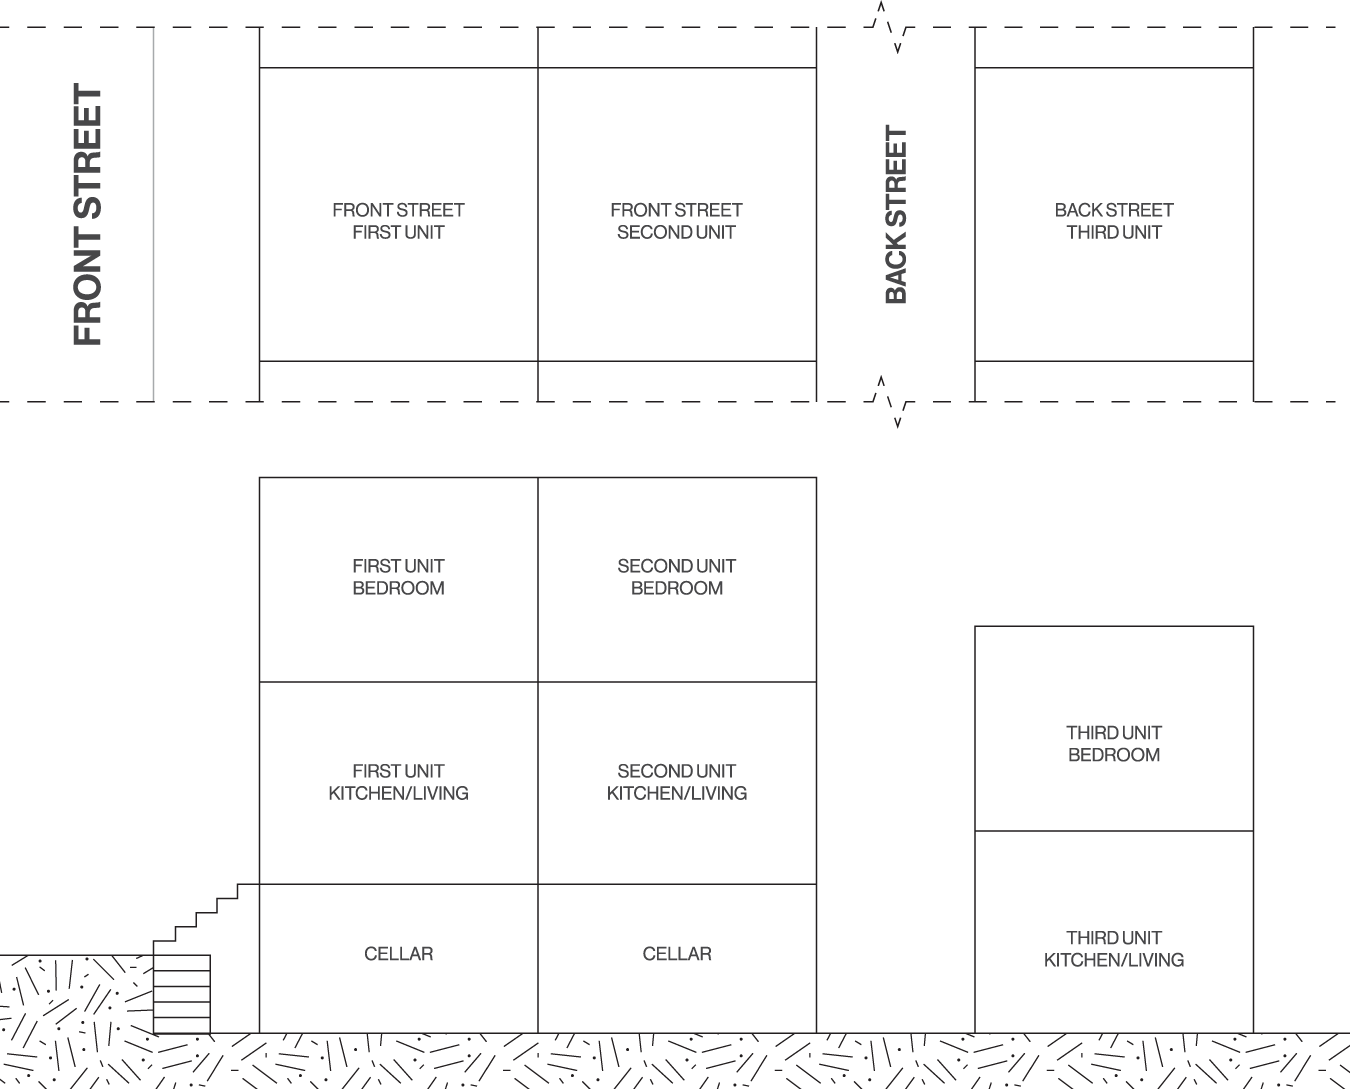
While the reality of residential integration seems to contradict the narrative of class separation, the idiosyncrasies of Manchester’s residential infrastructures – in their construction, design, and maintenance – contributed to the city’s complex balance of spatial proximity but social segregation. The early Victorian housing market was predominantly one of rented accommodations, particularly so for the middle and working classes.Footnote 34 In the rapidly densifying Manchester, dwellings were built en masse as developers sponsored the erection of dozens of units at a time, prioritizing speed over quality.Footnote 35 With few regulations governing construction practices in the early 1800s, the city had, by the mid-century, turned into a field of cramped, dirty, and poorly ventilated buildings. As in other northern industrial cities, typical residential constructions in Manchester took the form of the ‘one-up, one-down’ cottage organized in a back-to-back arrangement (Figures 2 and 3).Footnote 36 These minimalist dwellings consisted of one room on the ground floor and one on the first floor, often containing a semi-subterranean cellar and sometimes an attic. Shared privies could be found in back alleyways. Many of these new developments, furthermore, were arranged via a system of back streets and courts. A first row of units faced the main street with a second row backing it directly facing onto a narrow back street or ‘court’ which in some instances sat lower than the front street, and finally, a third row of units along the other side of these back streets.Footnote 37
Diagram of a typical system of ‘one-up, one-down’ dwellings in their back-to-back arrangement.

Rows of housing at the Ancoats border with the Central Ward (Ordnance Survey, Sheet 29). Reproduced with the permission of the National Library of Scotland, https://maps.nls.uk/#.

These ‘mighty wildernesses of building’, as Kay-Shuttleworth described them, enabled developers to maximize tenant density whilst keeping construction costs low, caring for neither the shoddiness nor the unhealthiness of the structures. The high demand for housing left tenants to the mercy of profit-driven landlords who took advantage of this need by renting to as many households as would accept the poor terms of living. While the ground- and first-floor units were deemed ‘respectable’ enough for the middle classes, and therefore rented to only a household or two, subterranean cellars were severely overcrowded. By the mid-century, cellar dwellings had become as ubiquitous as notorious in early Victorian Manchester, each housing up to a dozen individuals of the poorest classes.Footnote 38
Manchester’s rapid densification had exacted unprecedented pressure on urban sanitary infrastructure, and those living in cellars were the front lines facing the consequences. With no proper drainage ahead of the reforms of the later century, sewage ran from streets and flooded these spaces with dirty, contaminated waste. The poor were often the first and the most severely affected by diseases such as cholera and smallpox, but once introduced, these spread quickly to higher echelons of society.Footnote 39 By the end of the 1840s, Manchester’s governing elites were slowly recognizing the squalor of cellar dwellings, yet proposals to abolish them were met with staunch opposition by the city’s landlords. In an 1850 meeting of property owners discussing the potential removal of all cellar dwellings, members of the group were quick to voice their opposition to such a measure: Mr Frederick Richmond, the chair of the council, proclaimed that ‘the attempt to take away that which formed the bread of a large portion of the community was to be resisted by every possible means’, as it was ‘well known that many cellar dwellings were even better than cottages’, and was further supported by Mr Abel Heywood who argued that the conditions of the proposed act were so stringent that even ‘first-class cellars’ would have to be eradicated.Footnote 40 Despite the need for housing improvements, Manchester’s landlords continued to argue for the necessity of cellars in supporting the city’s housing demand – opposition that allowed cellar dwellings to persist through the rest of the century, albeit at gradually lower rates.Footnote 41
The structure of these buildings, with separate units above and below ground, therefore made it possible for landlords to rent these spaces to separate households. While a middle- or upper-working-class family could occupy the upper unit, the cellar could be rented out to the poorest members of society.Footnote 42 And indeed, this precise sort of arrangement was noted by Peter Gaskell in his description of the city’s residential conditions in 1833: ‘most of these houses have cellars beneath them, occupied…by a still lower class than those living above them’.Footnote 43 In many cases, furthermore, these cellars accommodated multiple households at a time each occupying different micro-spaces of the room, if at all possible.Footnote 44 The conversion of existing buildings into tenements further enabled this kind of mixed living arrangement through subdivisions, which was the most affordable way to increase housing stock given the high price of land.Footnote 45 Manchester’s rapid population growth put considerable strain on the building industry, and overcrowding was a widespread consequence. Anthony Wohl has estimated that the city would have had to build at least 2,500 additional rooms every year in the first half of the century to keep up with the demand – an impossible undertaking for the time.Footnote 46 These practices of subdivision in the face of high demand do much to explain the heterogeneity of buildings in Manchester. Despite these conditions of residential integration, however, the experience of segregation prevailed as various ‘shapes in society’ contributed to class formation and urban visibility in the city beyond.
III
In early Victorian Manchester, the rhythms and constraints of the industrial workday and workweek defined patterns of urban navigation which separated the masses of working-class labourers from the rest of society. Before the introduction of labour reforms in the late nineteenth century, Manchester’s operative class regularly worked more than twelve-hour days, six days a week – certain factories remaining open as long as seventeen hours a day.Footnote 47 This monopoly over labourers’ time limited their access to the public and consumer domains and consequently, their opportunities for overlap with the middle and upper classes. In contrast to other Victorian cities such as London and Liverpool which bustled with daytime activity, Manchester’s public spaces were ‘almost deserted’.Footnote 48 Rarely were streets occupied by weavers, blacksmiths, and doctors simultaneously, with the exception occurring around one o’clock when warehouses, factories, and banks all emptied for the midday meal.Footnote 49 The financial disparity of classes, furthermore, determined not only who could buy what, but also when.
The emergence of department stores around the mid-century offered new consumer opportunities to the emerging middle classes, while high-end boutiques continued to cater to the bespoke preferences of the upper classes. The advertisement pages of local newspapers boasted the range and quality of their products, yet these items and the establishments they were sold in were almost exclusively out of reach of the urban poor, who increasingly relied on systems of credit managed through Manchester’s rapidly proliferating pawnshops. By 1842, it was estimated that pawnshops had tripled over the preceding decade.Footnote 50 While the middle classes wandered the aisles of early department stores such as Kendal Milne, established in 1836, the closest the labouring classes ever found themselves to these institutions was in making the clothes which would come to fill their shelves. As many working-class households struggled to make ends meet from week to week, furthermore, their consumer habits were forced around the weekly payday. The wealth of the upper classes and the relative comfort of middle classes lent them flexible and regular access to shops, markets, and grocers, and those with the means to do so let domestics conduct errands on their behalf. Factory workers, however, were often forced to wait until the disbursement of wages on Saturday evenings before rushing to the markets in the hopes of finding enough to feed their families for the following week: ‘the buyers of the middle-class have had the first choice during the morning, when the market teems with the best of everything’, explained Engels, ‘but when the workers reach it, the best has vanished, and if it was still there, they would probably not be able to buy it’.Footnote 51 Over the course of the week, the best items had been picked off, leaving the working classes with few options – many of which were near, or past, their expiration dates. Beyond the markets, small back-street shops offered supplements, but these were often of questionable provenance, quality, and price.Footnote 52 A handful of soup kitchens catered towards the very poorest in society, but the demand always outweighed the supply, condemning a substantial proportion of the population to hunger – ‘barely supporting life on a scanty supply of the most meagre diet’.Footnote 53 The separation between boutique stores and pawnshops, grocers, and soup kitchens embodied consumer segregation in mid-century Manchester, and the isolation of one class from another encouraged perceptions of social differentiation across the city.
Particular aspects of class identity, furthermore, reinforced practices of micro-spatial segregation in mid-century Manchester, largely those revolving around habits of leisure and cultural consumption. This condition is best symbolized by two sets of opposing institutions: the church versus the pub. While the ‘respectable’ classes could be seen filling the pews of Manchester’s churches and chapels, numerous drinking establishments were crowded with their working-class counterparts. These were not, of course, fully dichotomized conditions and yet their relative proportions remained nonetheless influential in feeding perceptions of segregation.Footnote 54
Religion is an issue which loomed large in the imaginaries of middle- and upper-class Victorians; over the course of the nineteenth century, Britain experienced a ‘religious expansion’, as hundreds of churches were restored or built from new and ‘evangelical philanthropies’ were established both at home and abroad.Footnote 55 Church-going became integral to many urban bourgeois communities but in Manchester, especially, it was an opportunity for political involvement. The rise of Liberalism in the nineteenth century established strong ties between political economy and religious participation, as the city’s churches and chapels became public forums for the discussion of social reform and welfare. At the centre of Manchester’s religious network were two small but significant nonconformist chapels, the Cross Street and Mosley Street Unitarian Chapels, whose membership included some of the city’s most influential figures.Footnote 56 Both welcomed members from the humbler ranks of the middle class – artisans and small-business owners – but, notably, included individuals from the political and economic elite who represented key industrial, journalistic, and cultural institutions. Through this network, the city’s Unitarians led and disseminated ideological discourse both within chapel walls and through publications such as the Manchester Guardian as well as more official channels of local government. This membership embodied an emerging form of Liberalism that redefined dynamics of wealth and property in accordance with more middle-class interests, as opposed to previous priorities set by the ‘ruling Tory’.Footnote 57 Over time, religious participation began to shape and symbolize middle-class identity in early Victorian Manchester. The performative aspects of church-going, however, fostered alienation and the exclusion of working classes from these institutions.
The Christian revival of nineteenth-century Britain encouraged, in 1851, the Census of Religious Worship to assess religious participation and Sunday service attendance across England and Wales.Footnote 58 The results revealed that approximately half of the adult population attended a religious establishment and of these, half attended Church of England services. Victorian evangelists, rather than seeing this as a testament to the prevalence of religion in England and Wales, considered it a failing of emerging industrial forms of life. Horace Mann’s reflections on the Census of Religious Worship denounced the ‘deplorable deficiency’ of large towns, where the growth of the labouring populations was failing to maintain the religious standards of the middle classes.Footnote 59 This investigation, alongside reports such as Kay-Shuttleworth’s which denounced working-class truancy from these establishments, fed the notion of working-class ‘immorality’. In recent decades, historians of the subject have revealed and rewritten the central role of religion in Victorian working-class culture but even so, these support the notion that the rich and poor practised their faith differently.Footnote 60
While the middle classes saw their attendance as evidence and a testament to their respectability, the conspicuousness of public services stimulated fear and shame in the urban poor, as many ‘desirous of attending a place of worship [could not] for want of food or clothing’.Footnote 61 Appearance signified one’s respectability, a characteristic by which individuals were examined for their suitability within these spaces, resulting in self-censorship from the working classes themselves. This sense of targeted marginalization was exacerbated with the restructuring of the Poor Laws in 1834 and produced widespread disillusionment in religious institutions within the working classes. Under the Old Poor Laws, welfare was administered and distributed through parochial channels but from the 1830s, workhouses were introduced as a key measure for managing poor ‘relief’. Where churches and chapels had once offered shelter and safety to those in dire circumstances, they now evoked feelings of accusation and condemnation, with religion increasingly seen as ‘a contrivance to frighten poor folks and keep them down’.Footnote 62
Those who did attend these services, furthermore, were still kept apart through space or time. Many religious establishments offered several services. Morning services rented out pews on an annual basis, and catered towards the middle and upper classes, while afternoon or evening services were more likely to be frequented by the working class who could not afford regular rents. Despite the fee differences, records from the Census of Religious Worship from Manchester show that attendance at morning services consistently exceeded that of the evening services, sometimes by as much as double.Footnote 63 Even more significantly, the classification of ‘free’ – where individuals were permitted to sit anywhere in the establishment free of cost – versus ‘appropriated’ – which involved either a service fee or designated seating – allows us to see that despite the lower threshold for access, free sittings were on average half as popular as appropriated sittings and in only one case, that of the two ‘Methodist New Connexion [sic]’ chapels, were there a greater number of free sittings than appropriated ones.
Even mixed services were characterized by forms of micro-segregation. The Cross Street Chapel’s small local archive contains nineteenth-century pew rental records which denote, for each year since the early 1840s, the price of each pew and the tenant.Footnote 64 These records reveal that pew rates were variable depending on location in the hall: the most expensive were found centrally, by the pulpit, while others were priced decreasingly as one moved outward. Those few working-class families who might have been able to attend these popular morning services were likely relegated to the furthest seats, and certainly excluded from the central pews by what would have been exorbitant prices relative to their wages. The city’s ethnic makeup further contributed to certain class divides. Manchester’s Irish population, which represented the largest non-British ethnic group at the time, suffered from consistent discrimination as an intentionally stigmatized subgroup of the working class.Footnote 65 These Irish immigrants were predominantly Roman Catholics who attended their own establishments, therefore specifically excluded from the city’s main religious institutions. The significant Jewish population, however, was largely integrated into the lower-middle-class Protestant community. Of the 122 religious establishments listed in the Census of Religious Worship, only two were synagogues, likely attended by only the most Orthodox, while the rest could be found attending Protestant institutions such as the Cross and Mosley Street Unitarian Chapels.Footnote 66 For the middle and wealthy classes, religion represented a key aspect of their participation in society, but the social and financial marginalization of the working classes maintained social divisions even in these ‘public’ institutions.
Instead, on Sundays, the working classes gathered at a different kind of establishment: the pub. While the rise of the Temperance movement popularized abstinence and moderation in middle- and upper-class drinking habits, very few of the urban poor had such reservations and spent what meagre earnings they had in beerhouses and gin ‘palaces’, attracted by warmth, conviviality, and the free-flow of spirits. Slater’s Directory of 1850 for Manchester and the surrounding towns listed over 600 public houses, and descriptions from this period make their popularity clear: ‘where there are the most paupers’, Kay-Shuttleworth wrote, ‘the gin shops, taverns, and beer houses are most numerous…chiefly ministering to the vicious propensities of the inhabitants’.Footnote 67 Local officials and social investigators like Kay-Shuttleworth deplored the working-class propensity for drink, which they linked back to signs of immorality and unhealthiness. That the urban poor chose to frequent the pub rather than invest in domestic homemaking was, to the middle classes, proof of their lack of respectability and a reason for indictment.Footnote 68
And yet, public drinking establishments came to represent the heart of working-class socialization in the first half of the century.Footnote 69 Open before the earliest factories and after the latest, seven days a week pubs offered a refuge from smoky, overheated factories or cramped, foetid dwellings. They were hubs for community and sites for enculturation. Taverns often provided opportunities for dancing, musical performances, and exhibitions, with certain publicans even going as far as organizing local sports competitions and training.Footnote 70 They provided means of social education to the largely illiterate masses who were taught to count, for example, through playing cards.Footnote 71 ‘The public house is for the operative, what the public squares were for the ancients’, remarked Faucher, ‘it is where they meet one another, and where they discuss the topics in which they are interested.’Footnote 72 And, as churches and chapels were sites for middle-class political organization, so was the pub for the working man: Samuel Bamford, a working-class radical, recalled in his memoir how men gathered there to share their ideological aspirations.Footnote 73 Despite widespread condemnation of these establishments, pubs were welcoming oases for those seeking a respite from the workweek.
Consumption and leisure were conspicuous practices which produced perceptions of segregation, and these were exacerbated by sanitary and disciplinary urban practices which enhanced the aesthetics of class segregation in the city. Joyce and Gunn have both written on the ways in which new forms of governmentality and cultural hegemony embedded themselves in the industrial city through its morphology, and offer valuable framework for understanding the relationship between class and urban aesthetics in the Victorian city.
In Manchester, the erection of new civic buildings – which employed architectural forms and features evoking grandness and displayed innovative uses of modern materials such as glass and cast iron – signalled a shift towards the city’s appearance as a point of pride and ambition, and this was paired with increased attention to the maintenance of public space. Central thoroughfares were popular urban improvement projects; an 1852 issue of the Manchester Times described the impacts of industrialization and early sanitary intervention: ‘the advance of trade and wealth, as well as the knowledge of what is conducive to health, comfort, and other advantages, has…given us the spacious highways, the wide thoroughfares, the palaces of merchant princes, and the shops and warehouses, with which the town now abounds’.Footnote 74 Avenues were opened up to light and air, and repaved to help shape Manchester into the image of a modern city. Both sanitary and aesthetic motivations encouraged the maintenance of these thoroughfares and £5,000 a year was drawn from property rates to be put towards street cleaning. This provision, however, could not cover the whole city and officials were forced to develop a system of ‘street classes’ to determine priority. Faucher explained, ‘the first-class streets are cleansed once per week; those of the second class, once per fortnight; and the streets of the third class once a month. As to the courts, alleys, and yards, inhabited by the poorer classes, no means are used to ensure their periodical cleansing.'Footnote 75 Associations between secondary streets and the urban poor thus exacerbated reputational differences for certain parts of the city. Kay-Shuttleworth denounces the inhabitants of ‘loathsome dwelling[s] in the close alley’ as ‘debased’, while local news columns described how, ‘in back courts, and at the end of narrow passages…we discover more especially our unskilled, labourers, and poor, improvident, and dissipated orders of people’. Footnote 76
Despite the city’s residential heterogeneity, associations between these back streets and the working classes encouraged local officials to disregard their maintenance, and their lack of cleanliness only reinforced this perception of spatial segregation. This was aggravated by differences in quality of construction found in main versus lesser streets. While these ‘palaces of merchant princes’ lined the grand boulevards of Manchester’s city centre, the blocks of back-to-back residential developments were, by this time, showing their shoddiness. The hastiness with which contractors had erected these structures was made worse by the lease-holding system of early Victorian England, in which developers could not own urban land outright and were forced to take on land leases as short as 30 or 40 years. Engels critiqued this system, explaining how, with little incentive otherwise, contractors were quick to minimize costs by skimping on materials and cutting corners.Footnote 77 A lack of adequate sanitary amenities forced the disposal of waste into the streets and courts around these neighbourhoods, while the thinness of walls and their lack of structural integrity drove them quickly into disrepair.Footnote 78 In 1840, William Neale released a pamphlet on ‘juvenile delinquency’ in Manchester, identifying specific districts as especially rife with crime. There, Neale wrote,
the narrow, ill-ventilated, and filthy streets, with their stunted and dirty hovels, markedly contrast with the spacious warehouse, the lofty factory, and the public buildings situated in the more airy and commodious quarters of the town; and while such is the uninviting character of the external appearance, it is only exceeded by the confinement, darkness, nakedness, and filth, which characterized the thickly populated dwellings of a class, who live by a mingled recourse to elemosynary [sic] relief and criminal pursuits, and whose honest or illicit gains are spent with equal improvidence and profligacy.Footnote 79
The spatialization of crime, here, juxtaposes back streets against grand central boulevards and conflates the dirtiness of the former with the quality of its inhabitants. Andrew Davies has written more extensively on crime in Victorian Manchester, and while it was indeed the case that gangs did claim certain territories, we have seen how diverse Manchester’s residential districts in fact were.Footnote 80 The contrast between the clean, open boulevards of the city and its dirty, crowded residential areas reinforced the perception of spatial segregation and the dichotomy between the ‘respectable’ and ‘immoral’ parts of the city, despite the reality of residential heterogeneity.
Alongside the early public health reforms of the nineteenth century was a new system of policing which supported the development of the ‘moral and sanitary city’ through surveillance and regulation, yet largely served to reinforce the marginalization of the urban poor.Footnote 81 The working classes, considered vectors of chaos and disease, bore the brunt of these disciplinary practices. An expansion of the police force from the 1840s introduced new levels of regulation and surveillance, reinforcing the exclusion of the urban poor from the public realm. As the middle classes embarked on their ‘civilizing mission’ to shape the lower orders into a more moral and respectable class, police supported these efforts through the controlling of urban maintenance and public behaviour.Footnote 82 Their scope and attention, however, often corresponded to the aforementioned rating of streets in the city, further strengthening differentiation between first-class avenues and the poor, tucked away back-alleys: ‘as the police charged with care of the streets does not trouble itself about the condition of these courts’, explained Engels, ‘everything quietly lies where it is thrown, there is no cause for wonder at the filth and heaps of ashes and offal to be found here’.Footnote 83 Sanitary inspections helped support the maintenance of first-rate streets while anti-loitering systems of policing aimed towards the unsavouriness of the urban poor restricted the appearance of certain bodies in urban space. Even small congregations of working-class men were made to disperse by officers on rotation, forcing gatherings indoors or, at the very least, away from Manchester’s main thoroughfares. Police presence in these central streets made them more ‘tranquil, if not more safe’, according to Faucher, yet their neglect of the poorer quarters perpetuated their squalid conditions.Footnote 84 At the lowest strata of society, the working poor were forced to disappear out of sight from the middle- and upper-class-dominated public realm, to ‘struggle along as [they could]’.Footnote 85
This working-class discrimination further manifested through the regulation and scrutinization of popular leisurely activities. In 1843, the year that the Manchester Corporation took charge of the police force, legislation was passed prohibiting dogfighting, cockfighting, and bull- and badger-baiting – all forms of working-class entertainment which, up until then, had usually been conducted in outdoor space.Footnote 86 Excluded from public spaces, these activities were forced to relocate in back rooms and cellars away from the prying eyes of the police and respectable society. The semi-public nature of pubs, furthermore, made these institutions conspicuous targets for practices of urban discipline, and their heavily working-class clientele was regularly monitored. Associations between drink, pauperism, and vice exacerbated prejudices against these establishments, feeding middle- and upper-class sentiments that pubs ‘[layed] the foundation for an increase of crime’.Footnote 87 While police were limited in their ability to control inside these ‘haunts of misery and crime’, they were quick to disperse gatherings outside their doors and to intervene at any sign of disorderly conduct.Footnote 88 The systematic monitoring of these establishments perpetuated associations between poverty and crime, reinforcing the marginalization of the poor and working classes within the urban landscape.
IV
This dissonance between the narrative of segregation which has arisen from qualitative material and the spatial heterogeneity revealed by quantitative analysis reveals a central struggle in the practice of history, which concerns the use of historical sources and the conclusions we allow ourselves to draw from them. The assumption of residential segregation is reasonable, given the tone of traditional source material; Engels, Kay-Shuttleworth, Faucher, and their peers used the industrial city to ground their critiques of class division. Each, furthermore, shaped and infused their reports according to their purpose and agendas: Engels’s philosophical and political musings were best underpinned by dramatic illustrations of social fragmentation, while Kay-Shuttleworth’s sanitary ambitions for urban reform required massive urban reform, which only the worst of circumstances could justify. Inspired by these records, scholars have taken for granted the notion that Manchester’s physical structure fostered severe inequality which only large-scale urban and political reform could rectify.
A quantitative analysis of the city’s ‘shapes on the ground’ has therefore been critical for strengthening our understanding of Victorian urban dynamics and compensating, at least in part, for the biases of qualitative material. Reconstructing residential data for mid-nineteenth-century Manchester offers a concrete spatialization of class to compare against the conditions described in qualitative sources. The results illustrate the tensions between experience, or perception, and physicality: despite the prevailing narrative of spatial segregation, Manchester was quite a heterogeneous, residentially mixed city in which individuals of very different classes lived in the same districts, streets, and even buildings. This conclusion prompts a re-reading of traditional material in an attempt not to contradict it but rather to enhance our understanding of segregation in the industrial city. Despite very real conditions of residential integration, divisive class identities emerged from quotidian practices defined along occupational, financial, and social lines.
The structure of early nineteenth-century urban housing allowed for multiple, independent households to reside quite literally one on top of each other but with only very limited contact, and for individuals with very different routines, contact was unlikely. These routines were often dictated by occupational status, as operatives were bound by long factory and warehouse days which had them hidden away while the respectable classes went about town. Even in leisure and consumption, the gap between well-off and poor lay wide: the separation of ‘respectable’ middle classes versus the ‘immorality’ of the working class is best illustrated in the memberships of churches versus pubs, and exacerbated by barriers in time and money in access to culture and education. Lack of personal exposure to one another strengthened perceptions of class segregation and projected this division onto the aesthetics of public space. Differential sanitary and disciplinary practices exacerbated associations between the city’s back streets and the urban poor, disregarding the substantial middle-class populations who lived there. Through cumulative temporal, cultural, and architectural conditions, the general narrative of segregation came to overshadow the physicality of residential integration in early Victorian Manchester.
In the decades which followed, discussions around the ‘Condition of England Question’ and the state of industrial cities spurred waves of urban and social policy which tackled infrastructural maintenance, sanitary, and residential reform.Footnote 89 The reports emerging from Manchester bolstered these efforts for reform, by concretizing the issues and struggles of urban industrial life. Consequently, Manchester’s urban fabric changed drastically over the course of the nineteenth century, encouraged by a shift from a manufacturing town to a commercial centre. Large-scale housing reform and urban restructuring gradually changed the density and improved the sanitary conditions of much of Manchester, yet further research is required to truly understand the ways in which these policies affected Manchester’s class relations across the Victorian period.
It has previously been demonstrated that spatial analysis of quantitative data provides insight into class and ethnic patterns which is largely inaccessible through sole reliance on qualitative materials, and applying such techniques to Manchester reasserts the necessity of such work. Conversely, however, textual accounts remain essential in understanding the experiences emerging from various spatial patterns. The increasing digitization of historical source material is enriching the potential of urban historical research and may continue to reveal surprising relationships between policy, morphology, and society.
Acknowledgements
I would like to thank Simon Szreter and Pedro Ramos-Pinto for their guidance over the course of this research and writing process, as well as Simon Gunn for his advice on an early draft of this article. My gratitude also extends to the Cambridge Group for the History of Population and Social Structure for providing such an encouraging and motivating environment for work.
Funding statement
This research was generously funded by the UKRI Economic and Social Research Council (ES/P000738/1).
Competing interests
The author declares none.


 Open access