

Many countries in Latin America have recently experienced significant economic and social advancement( Reference Maire, Lioret and Gartner 1 , Reference Uauy 2 ) leading to a nutrition transition. There is a decline in the consumption of whole grains, fruits and vegetables, and a rise in the consumption of animal food products and processed foods high in fats and sugars( Reference Uauy 2 ), accompanied by a rising prevalence of overweight and sedentary lifestyles( Reference de Onis and Blossner 3 , Reference Gomez, Parra and Lobelo 4 ).
Studies in developed countries have shown that diets composed of white bread, sweets, red meat and other low-quality processed foods are positively associated with overweight risk among children aged 6–11 years( Reference Nicklas, Yang and Baranowski 5 , Reference Diethelm, Gunther and Schulze 6 ). A previous study involving the Bogotá School Children Cohort found a positive correlation between child overweight and a snacking dietary pattern( Reference McDonald, Baylin and Arsenault 7 ).
Many studies have examined the association between poor-quality dietary patterns and overweight. However, examinations of food intake using categorization methods classifying foodstuffs based on type, intensity and purpose of processing are now critical to informing nutrition public health policy, as food processing becomes increasingly prevalent( Reference Uauy 2 , Reference Monteiro, Levy and Claro 8 , Reference Monteiro 9 ). A few studies conducted in Brazil using such methods have been published in the past 2 years( Reference Louzada, Martins and Canella 10 – Reference Sparrenberger, Friedrich and Schiffner 12 ) showing that micronutrient content was lower in ultra-processed foods( Reference Louzada, Martins and Canella 10 ) while energy density and fat were higher( Reference Costa Louzada, Martins and Canella 11 , Reference Sparrenberger, Friedrich and Schiffner 12 ). Furthermore, Rauber et al. found that intake of ultra-processed products was a predictor of a higher increase in total cholesterol and LDL cholesterol levels from pre-school to school age( Reference Rauber, Campagnolo and Hoffman 13 ).
Our aim was to compare the quality of nutrient profiles by food processing categories, and among tertiles of processed and ultra-processed food intake, in our sample of children from the Bogotá School Children Cohort.
Methods
The present study was conducted using a convenience sub-sample from the Bogotá School Children Cohort, a representative study population from low- and middle-income families in Bogotá( Reference Isanaka, Mora-Plazas and Lopez-Arana 14 ). Information on this cohort study design has been reported previously in detail( Reference Isanaka, Mora-Plazas and Lopez-Arana 14 ).
In February 2006, 3202 public primary-school children aged 5–12 years were recruited in Bogotá using cluster sampling, with classrooms as the sampling units. Information on sociodemographic and lifestyle variables was collected at the time of enrolment with a self-administered questionnaire completed by the parents. Food security was measured using a version of the Spanish-language US Department of Agriculture Household Food Security Survey Module and the Community Childhood Hunger Identification Project( Reference Isanaka, Mora-Plazas and Lopez-Arana 14 ). In the weeks following enrolment, teams of trained research assistants visited the public schools. After obtaining confirmed participation consent from the parents of the children, anthropometric measurements were collected using standard techniques( Reference Lohman, Roche and Martorell 15 ).
For the present study we used a convenience sub-sample of 223 children from the Bogotá School Children Cohort from a few selected schools to guarantee 100 % participation. Baseline characteristics of children with dietary data are not different from those of the rest of the cohort, and therefore the sample is still representative of low- to middle-income families in Bogotá. Dietary intake was collected using two different methods (24 h recalls and dietary records which were administered to the mothers by trained dietitians) because it was difficult for some families to find the time to be interviewed. It was decided to collect at least one 24 h recall and one dietary record, and whenever possible we collected more than 2 d. In the end, the number of dietary records and 24 h recalls varies from one to six with an average of three per child. Each food from the dietary records and 24 h recalls was coded according to guidelines from Monteiro et al. and the nutrient composition of these foods was found using US Department of Agriculture food composition tables complemented with local food tables and chromatography analysis of fatty acids in cooking oils( Reference Monteiro, Levy and Claro 8 , Reference Monteiro 9 , Reference Baylin, Mora-Plazas and Cobos-de Rangel 16 ). The three processed food categories are (i) unprocessed and minimally processed foods, (ii) processed culinary ingredients and (iii) processed and ultra-processed food products, according to the original classification of Monteiro et al.( Reference Monteiro 9 ). Two independent research assistants carried out categorization with high reliability (κ=0·80). Disagreements were resolved by a third independent reviewer.
Data analysis
We calculated the total energy intake and percentage of total energy by food processing group. We also calculated the percentage of total energy from fats, protein, carbohydrates and sugars, by food processing group. Then, for these nutrients as well as for fibre, cholesterol, vitamins, folate, Ca, Fe, K, Na and Zn, we adjusted for total energy intake using the residual method( Reference Willett 17 ). Differences by food processing group were tested with a one-way ANOVA and a t test. We also present average nutrient levels, adjusted for total energy intake and stratified by tertiles of intake of processed and ultra-processed foods. ANOVA was used to test differences across tertiles.
P values were considered significant at the P<0·05 level. All analyses were conducted using the statistical software package SAS version 9.3.
Results
Table 1 shows characteristics of the 223 children from the Bogotá School Children Cohort overall and stratified by child’s sex (Table 1).
Baseline characteristics of children aged 5–12 years (n 223) from low- to middle-income families in Bogotá, Colombia

BMIZ, BMI-for-age Z-score; HAZ, height-for-age Z-score; TV, television; SES, socio-economic status.
Table 2 shows that foods from group 1 (unprocessed and minimally processed) represented 45·2 % of total daily energy intake, foods from group 2 (processed culinary ingredients) represented 20·4 % and foods from group 3 (processed and ultra-processed) represented 34·4 % (Table 2). Diets high in processed and ultra-processed foods were in general of lower quality than diets high in unprocessed and minimally processed foods, although not all nutrients followed this expected distribution. Nutrient indicators known to be beneficial for health that were lower in the processed and ultra-processed category compared with unprocessed and minimally processed foods and processed culinary ingredients included: n-3 PUFA (P<0·001), fibre (P<0·001), vitamin A (P<0·001), vitamin B12 (P<0·001), vitamin C (P<0·001), vitamin E (P<0·001), Ca (P=0·019), K (P<0·001) and Zn (P<0·001). Nutrient indicators known to be detrimental to health that were higher in processed and ultra-processed foods compared with unprocessed and minimally processed foods and processed culinary ingredients included Na (P<0·001; Table 2). Some nutrients known to be detrimental, including sugar and trans-fatty acids, though lower in processed and ultra-processed foods compared with the combination of unprocessed and minimally processed foods and processed culinary ingredients, were higher in processed and ultra-processed foods compared with unprocessed and minimally processed foods alone (P<0·001 and P=0·007, respectively; Table 2). However, some nutrients known to be beneficial to health, including folate and Fe, were higher in processed and ultra-processed foods compared with unprocessed and minimally processed foods (P=0·015 and P=0·008, respectively; Table 2).
Distribution of nutrients by group of processed foods, adjusted for total energy intake, among children aged 5–12 years (n 223) from low- to middle-income families in Bogotá, Colombia
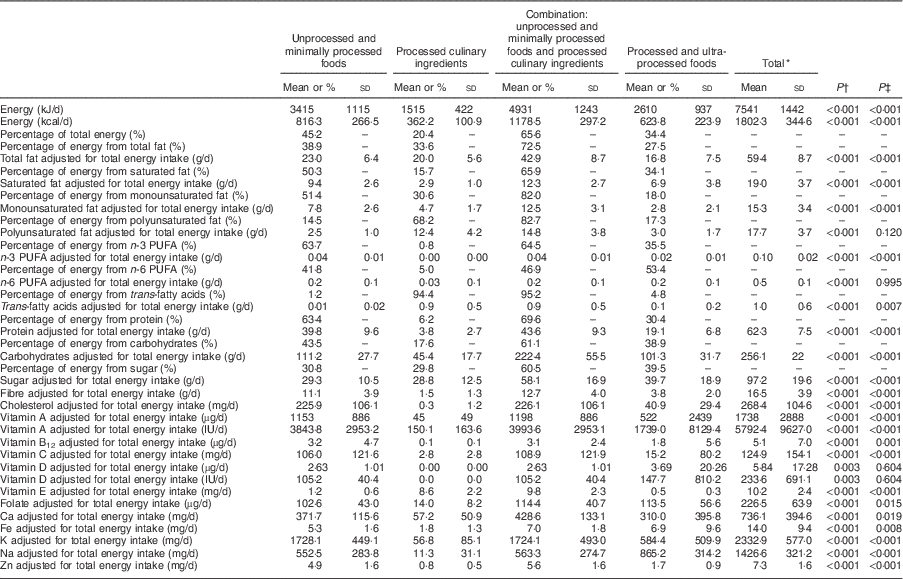
* The total is the mean of the combination of the unprocessed and minimally processed foods, processed culinary ingredients, and processed and ultra-processed foods columns.
† One-way ANOVA comparing three groups: (i) unprocessed and minimally processed foods, (ii) processed culinary ingredients and (iii) processed and ultra-processed foods.
‡ t Test comparing two groups: (i) unprocessed and minimally processed foods and (ii) processed and ultra-processed foods.
Results from Table 3 allow us to directly assess the association between the contribution of processed and ultra-processed foods to dietary intake and the nutrient quality of the overall diet. We observed a significant increase in the mean daily intakes of the following unhealthy nutrients with increasing tertiles of processed and ultra-processed food consumption: saturated fat (P<0·001), sugar (P<0·001) and Na (P<0·001); and a significant decrease in mean daily intakes of the following health-promoting nutrients with each increasing tertile: protein (P<0·001), fibre (P<0·001), vitamin C (P=0·025) and Zn (P<0·001).
Average nutrient levels, adjusted by total energy intake and stratified by tertiles of intake of processed and ultra-processed foods, among children aged 5–12 years (n 223) from low- to middle-income families in Bogotá, Colombia
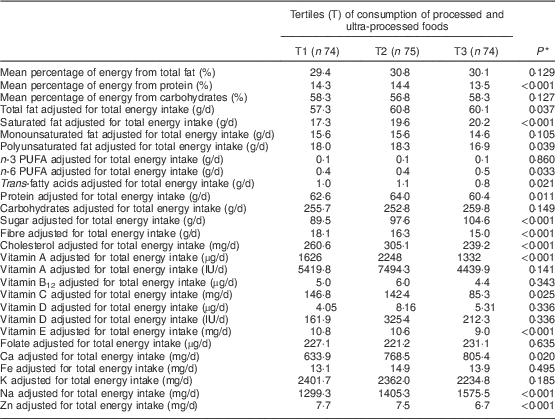
* One-way ANOVA.
Discussion
Our results support our hypothesis that diets consisting of greater consumption of energy from processed and ultra-processed foods and less from unprocessed and minimally processed foods are of lower quality. These diets are composed overall of lower amounts of beneficial nutrients and higher amounts of detrimental nutrients. Particularly, compared with unprocessed and minimally processed foods, we observed higher levels in processed and ultra-processed foods of Na, sugar and trans-fatty acids and lower levels of fibre, K, many vitamins and Zn. Additionally, with increasing processed and ultra-processed food consumption we observed greater mean daily intake of saturated fat. These findings suggest that reducing processed and ultra-processed food consumption is an important method of promoting healthy eating among Colombian children.
We saw higher Fe and folate in the processed and ultra-processed group compared with the unprocessed and minimally processed foods because of flour fortification. However, high exposure to synthetic folate from ultra-processed foods may result in high amounts of unmetabolized folic acid that may lead to increased risk of cancer( Reference Sangalli, Rauber and Vitolo 18 , Reference Vaish, White and Daly 19 ).
We also found that the low-dietary-quality processed and ultra-processed foods made up over a third of our Bogotá School Children Cohort sample’s average total daily energy intake. These findings support the evidence of a transition to a dietary pattern composed of greater amounts of significantly lower-quality processed foods among children in Colombia. This shift should be combated to address the rising health problems among Colombian children that are known to be associated with a poor-quality diet largely composed of high-energy-density processed foods.
Our study sample is a representative sample of children from low- to middle-income families in Bogotá. In some transitioning countries, there is evidence that lower income groups are more susceptible to the convergence towards cheaper high-energy-density foods, whereas more educated higher income groups converge towards ‘healthy market niches’( Reference Hawkes 20 ). However, as developing countries such as Colombia urbanize, they become part of a global culture. This globalization westernizes diets in Latin America, and those with higher incomes often live in more urban areas with better access to processed foods( Reference Uauy, Albala and Kain 21 ). Thus, the relationship between socio-economic factors and diet is multifaceted in transitioning countries. Future investigations should examine populations in Latin American countries that represent a wide range of socio-economic statuses in order to assess the associations between these variables and dietary quality in these transitioning countries. This will direct policy to improve dietary quality.
Our study has some limitations. Our results cannot be generalized to children from high-income families. The dietary records and 24 h recalls measuring dietary information in the children were administered to the children’s mothers with consequent potential for misclassification. Some nutrients like Na are likely to be estimated with more error because added salt intake is not recalled accurately. Trans-fatty acids are higher for the processed culinary ingredients group because we had information on the type of oil that each family was consuming and we analysed the fatty acid composition by GC( Reference Baylin, Mora-Plazas and Cobos-de Rangel 16 ). On the other hand, many of the snacks consumed in Colombia are made with palm oil that is not partially hydrogenated. However, we cannot rule out the possibility that a lower amount of trans-fatty acids in the processed/ultra-processed group is due to lack of accurate food composition tables. Similarly, sugar intake was calculated as total sugar since the available food composition tables did not allow us to distinguish between sugars naturally found in foods and added sugars.
A final limitation is that, within the last 2 years, the classification criteria for food processing have improved such that a distinction has been made between processed and ultra-processed foods( Reference Monteiro, Cannon and Levy 22 ). Studies using this updated classification have demonstrated a global rise in production and consumption of ultra-processed foods and a substantial negative impact of these foods on dietary quality and conditions such as obesity and metabolic syndrome( Reference Monteiro, Cannon and Levy 22 ). Due to the timing of the present work, we analysed processed and ultra-processed foods together. We uncovered valuable findings that these foods together have unhealthy nutrition profiles when compared with less processed foods and should be avoided by children. However, we acknowledge that distinction between processed and ultra-processed foods would have been useful to better inform dietary guidelines. In future studies, the updated version of the processing classification system should be used to examine the association between the shift towards an ultra-processed dietary pattern and children’s dietary quality in Latin America( Reference Monteiro, Cannon and Levy 22 ).
Consumption of processed and ultra-processed foods is rising in Colombia( Reference Uauy 2 ). This transition poses a serious public health threat in this country. Despite the aforementioned study limitations, we did find that, generally, Monteiro et al.’s three-group classification shows that diets high in processed and ultra-processed foods are of poorer quality. This suggests that studies classifying foods by type, intensity and purpose of processing will be useful for understanding how the nutrition transition in Colombia and other developing countries is affecting children’s health in future studies. Longitudinal studies examining these associations over time that are generalizable to children of varying socio-economic status are also necessary.
Acknowledgements
Financial support: This work was supported by the ASISA Research Fund at the University of Michigan. The ASISA Research Fund had no role in the design, analysis or writing of this article. Conflict of interest: None. Authorship: B.C. analysed the data and drafted the manuscript; A.B. and E.V. designed the study; C.M. and M.M.-P. collected the data; C.A.M. provided specific input on the categorization of foods; all authors reviewed and commented on the manuscript. Ethics of human subject participation: The study protocol was approved by the Ethics Committee of the National University of Colombia Medical School. The Institutional Review Board at the University of Michigan approved the use of data and samples from the study.


