

INTRODUCTION
The Neotoma Paleoecology Database (hereafter called Neotoma; http://www.neotomadb.org) was launched in 2009 with a mission to provide an open, community-curated, sustainable, and high-quality repository for multiple kinds of paleoecological and paleoenvironmental data. Neotoma’s name refers to the behavior of woodrats or packrats (genus Neotoma), which (inadvertently) serve paleoecology by gathering diverse biological materials into their nests, there to be preserved for future generations. Although Neotoma itself is relatively young, it builds on decades of effort by paleoecologists, paleoclimatologists, and paleontologists to gather individual records into larger spatial networks for the purpose of studying ecological, evolutionary, biogeographic, climatic, and cultural processes at spatial scales beyond the scope of any single site-level paleoecological record. The gathering of these records is expensive, with substantial investments in money and time, and their scientific value is multiplied when aggregated into larger networks. By bringing these resources into a single open data resource with an accompanying distributed governance framework, Neotoma seeks to accelerate our capacity to do global-scale paleoscience, serve as an open-source platform for new kinds of analytics and visualizations, enhance reproducibility, and increase the longevity and sustainability of our communities’ hard-won data.
Neotoma’s creation and design is motivated by the goal of enabling global-scale science from long-term, site-level data. Ecological processes operate across a wide range of interacting spatial and temporal scales (Heffernan et al., Reference Heffernan, Soranno, Angilletta, Buckley, Gruner, Keitt and Kellner2014). Dynamics at one location are often interpretable only in the context of larger-scale biogeographic and climatic processes (Webb, Reference Webb1997; Williams et al., Reference Williams, Shuman, Webb, Bartlein and Leduc2004), and ecosystems can be affected by slow processes that were triggered by events centuries or even millennia ago (Svenning and Sandel, Reference Svenning and Sandel2013; Goring and Williams, Reference Goring and Williams2017). Networks of paleoecological records, therefore, provide fundamental scientific infrastructure for understanding the responses of species to large and abrupt environmental changes, the mechanisms that promote resilience, and the interplay between climatic and biotic interactions (Dawson et al., Reference Dawson, Jackson, House, Prentice and Mace2011; Blois et al., Reference Blois, Zarnetske, Fitzpatrick and Finnegan2013; Moritz and Agudo, Reference Moritz and Agudo2013; Jackson and Blois, Reference Jackson and Blois2015). Examples include the processes controlling contemporary and past patterns of community, species, and genetic diversity (Fritz et al., Reference Fritz, Schnitzler, Eronen, Hof, Böhning-Gaese and Graham2013; Blarquez et al., Reference Blarquez, Carcaillet, Frejaville and Bergeron2014; De La Torre et al., Reference De La Torre, Roberts and Aitken2014; Gutiérrez-García et al., Reference Gutiérrez-García, Vázquez-Domínguez, Arroyo-Cabrales, Kuch, Enk, King and Poinar2014; Sandom et al., Reference Sandom, Ejrnæs, Hansen and Svenning2014; Cinget et al., Reference Cinget, de Lafontaine, Gérardi and Bousquet2015; Jezkova et al., Reference Jezkova, Riddle, Card, Schield, Eckstut and Castoe2015); identification of species refugia (Bennett and Provan, Reference Bennett and Provan2008; Gavin et al., Reference Gavin, Fitzpatrick, Gugger, Heath, Rodríguez-Sánchez, Dobrowski and Hampe2014; Vickers and Buckland, Reference Vickers and Buckland2015); rates of species expansion (Ordonez and Williams, Reference Ordonez and Williams2013; Giesecke et al., Reference Giesecke, Brewer, Finsinger, Leydet and Bradshaw2017); the reshuffling of species into no-analog communities during climate change (Graham et al., Reference Graham, Lundelius, Graham, Schroeder, Toomey, Anderson and Barnosky1996; Radeloff et al., Reference Radeloff, Williams, Bateman, Burke, Carter, Childress and Cromwell2015; Finsinger et al., Reference Finsinger, Giesecke, Brewer and Leydet2017); the timing and patterns of abrupt ecological and climate change (Shuman et al., Reference Shuman, Newby and Donnelly2009; Seddon et al., Reference Seddon, Macias-Fauria and Willis2015); quantification of the time lags between abrupt climate change and local ecological response (Ammann et al., Reference Ammann, van Leeuwen, van der Knaap, Lischke, Heiri and Tinner2013; Birks, Reference Birks2015); and the timing, causes, and consequences of late Quaternary megafaunal extinctions (Lorenzen et al., Reference Lorenzen, Nogues-Bravo, Orlando, Weinstock, Binladen, Marske and Ugan2011; Doughty et al., Reference Doughty, Wolf and Madhi2013; Emery-Wetherell et al., Reference Emery-Wetherell, McHorse and Davis2017).
The scientific communities interested in paleoecological data extend well beyond paleoecology and biogeography. Paleoecological data such as fossil pollen, diatoms, and marine foraminifera are the backbone of continental- to global-scale paleoclimatic reconstructions developed to benchmark climate models and assess feedbacks within the earth system (CLIMAP Project Members, 1976; Wright et al., Reference Wright, Kutzbach, Webb, Ruddiman, Street-Perrott and Bartlein1993; MARGO Project Members, 2009; Bartlein et al., Reference Bartlein, Harrison, Brewer, Connor, Davis, Gajewski and Guiot2011; Shakun et al., Reference Shakun, Clark, He, Marcott, Mix, Liu, Otto-Bliesner, Schmittner and Bard2012; Viau et al., Reference Viau, Ladd and Gajewski2012; Marcott et al., Reference Marcott, Shakun, Clark and Mix2013; Trouet et al., Reference Trouet, Diaz, Wahl, Viau, Graham, Graham and Cook2013) and constrain estimates of climate sensitivity (Schmittner et al., Reference Schmittner, Urban, Shakun, Mahowald, Clark, Bartlein, Mix and Rosell-Melé2011). Paleoecological data help establish ecosystem baselines and trajectories for managers seeking to conserve species and ecosystems of concern (Whitehouse et al., Reference Whitehouse, Langdon, Bustin and Galsworthy2008; Dietl et al., Reference Dietl, Kidwell, Brenner, Burney, Flessa, Jackson and Koch2015; Panagiotakopulu and Buchan, Reference Panagiotakopulu and Buchan2015; Clarke and Lynch, Reference Clarke and Lynch2016; Barnosky et al., Reference Barnosky, Hadly, Gonzalez, Head, Polly, Lawing and Eronen2017). Similarly, paleoecological data are necessary for understanding the interactions between past environmental change and early human evolution, land use, cultural and technological innovation, and dispersal at local to global scales (deMenocal, Reference deMenocal2001; Kaplan et al., Reference Kaplan, Krumhardt and Zimmermann2009, Reference Kaplan, Krumhardt, Ellis, Ruddiman, Lemmen and Goldewijk2011; Gaillard et al., Reference Gaillard, Sugita, Mazier, Trondman, Broström, Hickler and Kaplan2010; Muñoz et al., Reference Muñoz, Gajewski and Peros2010; Ellis et al., Reference Ellis, Kaplan, Fuller, Vavrus, Goldewijk and Verburg2013; Grant et al., Reference Grant, Stevens, Whitehouse, Norcott, Macphail, Langdon and Cameron2014).
In response to these scientific drivers, multiple databases have been developed by multiple teams over the past 30 yr for different kinds of Pliocene-Quaternary fossil data. These prior efforts, beginning in North America and Europe in the 1970s (Davis, Reference Davis1976; Bernabo and Webb, Reference Bernabo and Webb1977; Huntley and Birks, Reference Huntley and Birks1983; Sadler et al., Reference Sadler, Buckland and Rains1992; Grimm et al., Reference Grimm, Keltner, Cheddadi, Hicks, Lézine, Berrio and Williams2013), resulted in multiple paleoecological databases, each usually restricted to a particular data set type or region—for example, the North American, European, African, and Latin American Pollen Databases (Vincens et al., Reference Vincens, Lézine, Buchet, Lewden and Le Thomas2007; Fyfe et al., Reference Fyfe, de Beaulieu, Binney, Bradshaw, Brewer, Le Flao and Finsinger2009; Grimm et al., Reference Grimm, Keltner, Cheddadi, Hicks, Lézine, Berrio and Williams2013; Flantua et al., Reference Flantua, Hooghiemstra, Grimm, Behling, Bush, González-Arango and Gosling2015); the FAUNMAP and MIOMAP terrestrial vertebrate databases (Graham et al., Reference Graham, Lundelius, Graham, Schroeder, Toomey, Anderson and Barnosky1996; Carrasco et al., Reference Carrasco, Barnosky, Kraatz and Davis2007); the Mexican Quaternary Mammal Database (Arroyo-Cabrales et al., Reference Arroyo-Cabrales, Polaco and Johnson2007, Reference Arroyo-Cabrales, Polaco and Johnson2009); NANODe (Forester et al., Reference Forester, Smith, Palmer and Curry2005); the Diatom Paleolimnology Data Cooperative (https://diatom.ansp.org/dpdc/) (Sullivan and Charles, Reference Sullivan and Charles1994); North American and Latin American packrat midden databases (Betancourt et al., Reference Betancourt, Van Devender and Martin1990; Latorre et al., Reference Latorre, Moreno and Grimm2014) and plant macrofossil databases (Jackson et al., Reference Jackson, Overpeck, Webb, Keattch and Anderson1997, Reference Jackson, Grimm and Thompson2000); the Base de Données Polliniques et Macrofossiles du Quebec (Richard, Reference Richard1995); the BUGS insect database (Sadler et al., Reference Sadler, Buckland and Rains1992); and others. Other, newer proxies, such as testate amoebae and organic biomarkers, are just beginning to be gathered for use in broadscale studies and need a common platform for data archiving, sharing, and reuse.
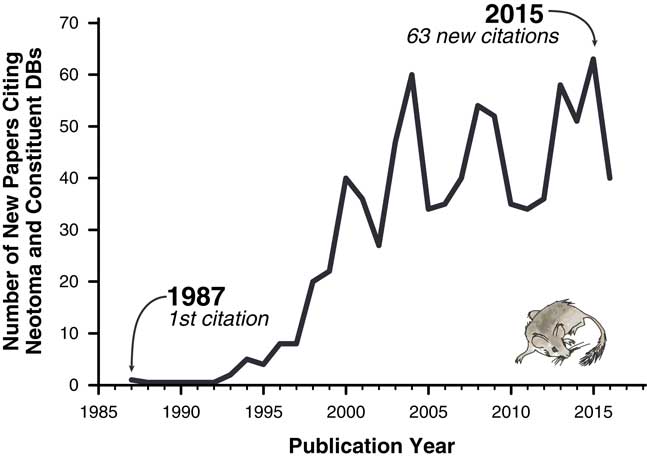
The importance of these databases cannot be overstated. Hundreds of scientific papers have utilized them (Fig. 1), and entire dissertations and subsequent papers have been based on them (e.g., Lyons, Reference Lyons2001; Li, Reference Li2004; Buckland, Reference Buckland2007). Nevertheless, the various paleoecology databases were typically established with either one-time or sporadically funded projects. Long-term maintenance, sustainability, and development have plagued virtually all paleoecological and paleoclimatic database efforts mainly because continuous funding is needed for both information technology (IT) and data preparation and cleaning. Some databases have had curatorial support from museums and government entities (e.g., Canada Museum of Nature’s curation of the Delorme ostracode database), whereas others have not. Funding hiatuses rarely cause these databases to disappear entirely but have caused data backlogs and delays, with long delays between data contributions by individual scientists and their release to the public. Additionally, early databases were maintained in flat files or stand-alone, desktop-database management systems such as Paradox or Microsoft Access (Grimm et al., Reference Grimm, Keltner, Cheddadi, Hicks, Lézine, Berrio and Williams2013), versus the new standard of client/server systems that serve data over the Internet. Copies of databases sometimes proliferated, and individual copies rapidly became obsolete (e.g., the initial release of FAUNMAP was distributed by hard copy and floppy disks, as well as online; FAUNMAP Working Group, 1994). Because paleoecological data were dispersed across different resources, with differing data architectures and degrees of accessibility, it has been difficult to synthesize data across resources.
Papers citing Neotoma and its constituent databases.
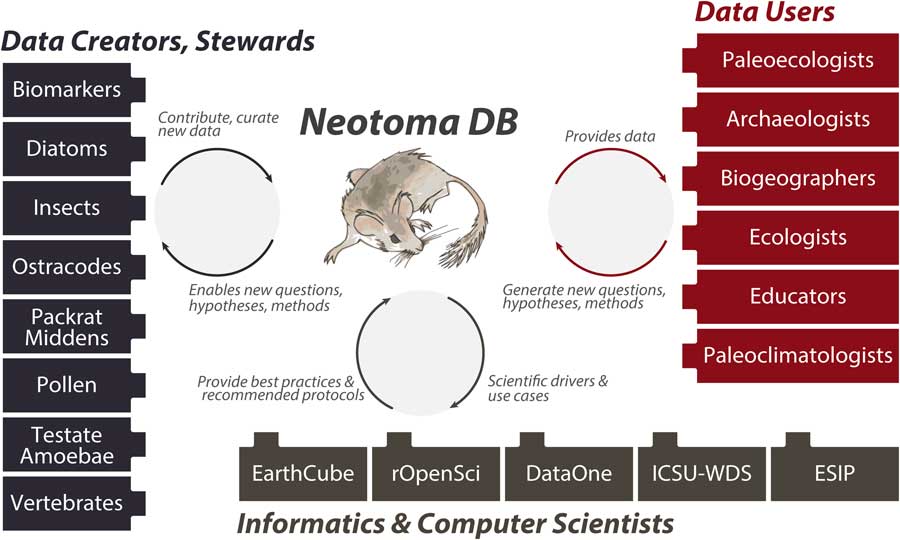
Neotoma builds on these prior efforts by providing (1) a consolidated and hence more cost-efficient and sustainable IT structure, (2) an open and flexible data model based on decades of experience with paleoecological data, and (3) a distributed and extensible governance structure that promotes high-quality, curated data and establishes pathways for new scientists and research groups to join and contribute. The Neotoma data model supports, or can be extended to support, any kind of paleoecological or paleoenvironmental data from sedimentary archives. Neotoma has focused on the Quaternary to Miocene section of the geologic record and primarily supports research about ecological processes operating at time scales of 102 to 106 yr, but there is no hard limit to Neotoma’s temporal extent. Neotoma employs a distributed governance structure based on constituent databases (see “Governance and Data Use”), because the scientific expertise necessary for curating paleoecological data is widely distributed across the scientific community. Each constituent database corresponds to a particular dataset type (e.g., ostracodes, insects, vertebrates, diatoms, pollen, organic biomarkers) or region, and each is led by expert data stewards (list of stewards available at http://bit.ly/2tzjEsZ), with opportunities available for scientists who would like to contribute their data and become stewards, either for existing constituent databases or to launch new ones. Neotoma also acts as a boundary organization and translator (Fig. 2; Guston, Reference Guston2001) among multiple interacting groups, bridging across the field- and lab-oriented communities that contribute data to Neotoma, the diverse multiple research and educational communities that use paleoecological data, and the informatics communities that build systems for translating big data to knowledge.
(color online) Neotoma serves many communities and acts as a boundary organization (Guston, Reference Guston2001) among these communities. Neotoma serves paleoecologists by providing a high-quality repository for their paleoecological data, with value added via digital object identifiers to facilitate data citation, data curation, and a flexible data model. Neotoma serves data users by providing a well-structured, open-access, and easy-to-use source of paleoecological data, specializing in time scales that bridge the boundary between global change ecology and geology (Jackson and Hobbs, Reference Jackson and Hobbs2009; Dietl and Flessa, Reference Dietl and Flessa2011; Betancourt, Reference Betancourt2012; Jackson and Blois, Reference Jackson and Blois2015; Kidwell, Reference Kidwell2015; Jackson, in press). In return, these communities generate new questions and analytical approaches for paleoecological data. Neotoma serves educators, students, and the general public seeking to learn about the past distributions of charismatic species such as the Pleistocene megafauna and the effects of climate change on species distribution and diversity. Neotoma also serves as a boundary organization between geoscientists and computer scientists, passing data, new research questions, best practices and protocols, and geoscientific use cases and priorities.
Neotoma is part of the emerging field of paleoecoinformatics (Brewer et al., Reference Brewer, Jackson and Williams2012), which itself contributes to larger efforts in bioinformatics and geoinformatics to overcome bottlenecks associated with data access, mobilize dark data, and maximize the power of scientific data collected by networks of researchers (Heidorn, Reference Heidorn2008; Howe et al., Reference Howe, Costanzo, Fey, Gojobori, Hannick, Hide and Hill2008; Lynch, Reference Lynch2008; Hampton et al., Reference Hampton, Strasser, Tewksbury, Gram, Budden, Batcheller, Duke and Porter2013; Ferguson et al., Reference Ferguson, Nielson, Cragin, Bandrowski and Martone2014). Related efforts include the Paleobiology Database (https://paleobiodb.org/#/), the International Tree Ring Databank (https://www.ncdc.noaa.gov/data-access/paleoclimatology-data/datasets/tree-ring), the Paleoclimatology data holdings at the National Oceanic and Atmospheric Administration’s (NOAA) National Centers for Environmental Information (https://www.ncdc.noaa.gov/data-access/paleoclimatology-data), Pangaea (https://www.pangaea.de/), iDigBio and iDigPaleo (https://www.idigpaleo.org/), MorphoBank (https://morphobank.org/), the Limnological Research Center and Continental Scientific Drilling Office (https://csdco.umn.edu/), the Interdisciplinary Earth Data Alliance (http://www.iedadata.org/), and the Strategic Environmental Archaeology Database (http://www.sead.se). Interlinking efforts are also underway through, for example, the National Science Foundation’s (NSF) EarthCube program.
Neotoma also seeks to support and leverage ongoing advances in paleosciences and data sciences. In paleoecology and paleobiology, the rate of publications is increasing exponentially (Uhen et al., Reference Uhen, Barnosky, Bills, Blois, Carrano, Carrasco and Erickson2013), which requires scalable informatic solutions; new paleoecological proxies continue to emerge (e.g., organic biomarkers and compound-specific stable isotopes; Zhang et al., Reference Zhang, Zhao, Eglinton, Lu and Huang2006; Sachse et al., Reference Sachse, Billault, Bowen, Chikaraishi, Dawson, Feakins and Freeman2012; Bush and McInerney, Reference Bush and McInerney2013); radiometric dating techniques and age modeling software continue to improve, enabling more precise ecological inferences (e.g., Zazula et al., Reference Zazula, MacPhee, Metcalfe, Reyes, Brock, Druckenmiller and Groves2014); and the growth of data assimilation and ecological forecasting approaches is requiring a closer and interactive coupling between ecological data and mechanistic models (Dietze et al., Reference Dietze, Lebauer and Kooper2012; Dietze, Reference Dietze2017). Relevant advances in the data sciences include the development of efficient protocols (e.g., JSON, SPARQL) that enable the establishment of networks of reliable and linked distributed resources across the Internet (https://www.w3.org/blog/SW/2008/01/15/sparql_is_a_recommendation/) (ECMA International, 2013), the development of international standards for unique data identifiers (e.g., digital object identifier [DOI]; http://www.datacite.org), and the rapid advances in open-source and collaborative programming environments such as R, GitHub, or Jupyter that place state-of-the-art analytical tools at the fingertips of scientists (Ohri, Reference Ohri2014; Goring et al., Reference Goring, Dawson, Simpson, Ram, Graham, Grimm and Williams2015). Neotoma also supports the now-common requirement by funding agencies and journals for scientific data to be made publicly available (Nature, 2017).
Here we provide an overview of the Neotoma Paleoecology Database, its design principles, key concepts, software ecosystem, governance structure, and a snapshot of current data holdings and uploads. We summarize the structure of the Neotoma data model and the available capabilities for uploading, finding, exploring, analyzing, and validating data. The Supplementary Materials point readers to additional information about the technical details of implementation, available in open-source code repositories (www.github.com/NeotomaDB), several online help manuals, and other publications (Grimm et al., Reference Grimm, Blaauw, Buck and Williams2014; Goring et al., Reference Goring, Dawson, Simpson, Ram, Graham, Grimm and Williams2015). We begin by describing key design principles and core semantic concepts that underlie the Neotoma data model, software design, and governance structure. Finally, we highlight ways that interested scientists can contribute to building this community resource, and we look ahead to current opportunities, challenges, and their solutions.
NEOTOMA DATABASE: DESIGN PRINCIPLES
Seven core principles and philosophies govern Neotoma’s design.
(1) Neotoma is a spatiotemporal paleoecological database: The core mission of Neotoma is to store and openly share well-organized and curated information about the past occurrences and abundances of organisms, their geobiological signatures, and associated paleoenvironmental variables, in space and time (see “Data Holdings and Data Types” for a fuller listing). Informed interpretation of these data also requires Neotoma to store and curate information about the geographic and sedimentary characteristics of the field site and stratigraphic horizons from which fossils were collected or variables measured, age controls and age-depth models used to estimate time, and the identity and contact information of investigators. Other kinds of information are also relevant to informed paleoecological interpretation but fall outside Neotoma’s core mission and may be best curated by other communities and data resources (e.g., ecological traits, digital images of fossils, contemporary genetic data, archaeological excavation data, reconstructions of past sea level and paleogeography, and paleoclimatic simulations from earth system models). Neotoma’s data and governance models are designed to be flexible and extensible to other paleoecological or paleoenvironmental proxies.
(2) Neotoma consolidates IT, distributes scientific governance: Neotoma combines a centralized database structure with a system of distributed scientific governance. All Neotoma data are housed in a single relational database (see “Technical Specifications and Software Ecosystem”) and organized according to a common set of core semantic concepts (see “Neotoma Data Model: Fundamental Concepts”). The use of one data structure for multiple paleoecological proxies reduces developer support costs, facilitates data discoverability and reuse, and increases data interoperability. Neotoma comprises virtual constituent databases, each encompassing a particular data set type or region (e.g., North American Pollen Database, European Pollen Database, North American Non-marine Ostracode Database, FAUNMAP, Bugs) and each with its own data stewards (Fig. 3). Constituent databases and allied cyberinfrastructure resources can also create their own front-end portals into Neotoma through the use of the Neotoma application programming interface (API; see “Technical Specifications and Software Ecosystem”). New constituent databases can be created to bring in new data types and regions (see “Governance and Data Use”), and new data stewards can be readily trained (see “Governance and Data Use” and “Next Steps”). This distributed governance structure addresses the challenge of distributed scientific expertise and allows Neotoma to scale as new records and proxy types are added to it.
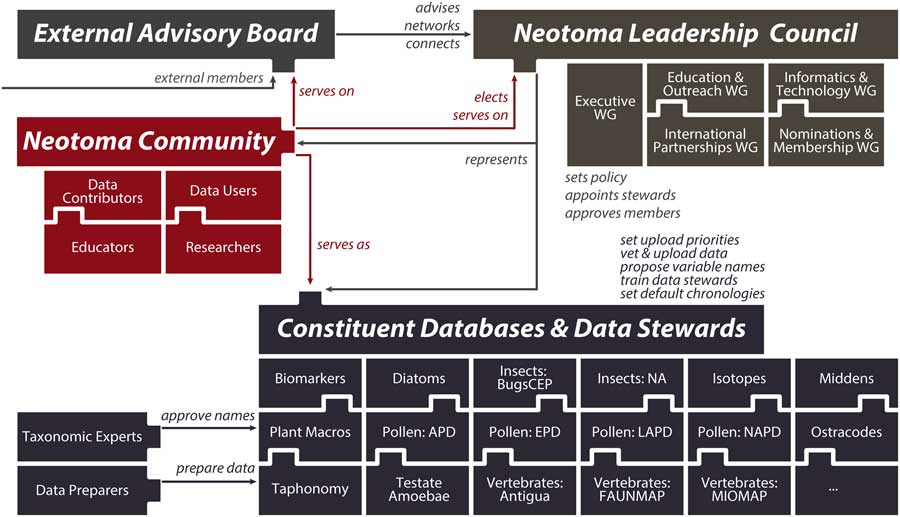
(color online) Diagram of Neotoma’s governance structure. Neotoma is governed by a leadership council, which is populated by elected members serving four-year terms. The executive working group coordinates day-to-day operations and reports to the leadership council. Other working groups coordinate education and outreach activities, build informatics and development activities, cultivate international partnerships, and handle membership requests and leadership elections. Constituent databases and the data stewards within these databases are charged with uploading data to Neotoma, setting data standards and vocabularies, adopting and harmonizing taxonomies, and deciding default age models. These constituent databases are organized by taxonomic group or paleoecological proxy type and often are further subdivided by region or time period. The Neotoma governance system is extensible, such that new members can readily join and new constituent databases can form.
(3) Neotoma is a community-curated data resource: Neotoma’s data stewards are functionally similar to a journal’s board of editors, charged with ensuring that data stored in Neotoma conform to community-established data standards. Data input into Neotoma is led by trained data stewards and data processors (see “Governance and Data Use”) appointed by their communities, with taxonomic names approved by taxonomic experts. Distributed scientific governance is essential for Neotoma because no single individual or institution can be expert in all the dataset types, regions, and time periods represented within Neotoma. Software systems provide stewards with automated tools to check for data inconsistencies, metadata completeness, and taxonomic conformity with Neotoma standards prior to uploading (see “Technical Specifications and Software Ecosystem”). This process of data validation, standardization, and cleaning adds significant value (Lehnert and Hsu, Reference Lehnert and Hsu2015) and distinguishes Neotoma from general-purpose and comprehensive data depositories such as DataDryad or FigShare.
(4) Neotoma data are open: Neotoma data are available to anyone with an Internet connection and are accessible through several interfaces (Fig. 4), each serving distinct user communities. Neotoma uses a CC-BY license, allowing free reuse of data with proper attribution to Neotoma and the original data contributors (see “Governance and Data Use”; http://www.neotomadb.org/data/category/use). By supporting open data, Neotoma prevents the underuse and eventual loss of valuable paleodata that languish on individual computers (Heidorn, Reference Heidorn2008; Hampton et al., Reference Hampton, Strasser, Tewksbury, Gram, Budden, Batcheller, Duke and Porter2013) while promoting scientific transparency and reproducibility across the community. Neotoma has an embargo policy for data contributed to Neotoma prior to publication (“Governance and Data Use”) and is working on an embargo management system, to promote good data management practice of organizing data early in a project cycle, rather than at the moment of publication, when details may be difficult to recollect. This embargo will also allow contributors to analyze their data in the context of the whole database without releasing it for public access until publication. Neotoma supports data archival and management plans required by many funding agencies and journals.
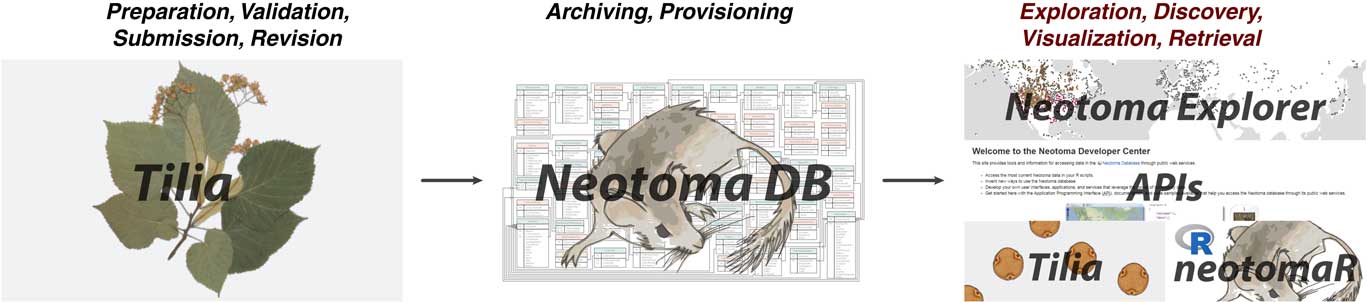
(color online) Diagram of the Neotoma software ecosystem. Data preparation and cleaning for upload to Neotoma are handled by the Tilia software (https://www.tiliait.com/), which has password-protected access for data stewards to upload data sets, update age models, and correct errors. Data are stored in the Neotoma relational database, which is deployed in SQL Server and currently hosted at Pennsylvania State University’s Center for Environmental Informatics. Neotoma data can be discovered, explored, viewed, and obtained through multiple platforms. Neotoma Explorer and its graphical map-based interface is designed for first-pass data explorations, new users, and educational and student groups. The application programming interfaces (APIs) and neotoma R package are intended for programmatic access and for users who wish to do large-volume searches of Neotoma data holdings. Tilia can also download data sets from Neotoma, which is useful for data visualizations and for data stewards needing to update data sets or looking for examples of prepared Tilia files.
(5) Neotoma is a living database: The life cycle of a paleoecological data set does not end with its first publication. Data are reused, as the original investigators and new teams synthesize existing data to answer new questions. Errors may be caught and corrected during subsequent syntheses (e.g., inaccurate transcriptions of geographic coordinates, inaccurate or incomplete capture of all fossil data from a site, missing metadata). Derived inferences may be updated with newer analytical methods (e.g., newer Bayesian age models; Parnell et al., Reference Parnell, Haslett, Allen, Buck and Huntley2008; Blaauw and Christen, Reference Blaauw and Christen2011). Neotoma stores relatively stable raw data (e.g., number of fossil specimens of a species in an assemblage, radiocarbon dates), as well as derived data (e.g., age models), subject to change as scientific understanding advances. Of these, the most changeable data tend to be age estimates and taxonomic names. Age estimates will change as dating techniques and age-depth models improve. Taxonomic names may change if taxonomic identifications of individual specimens are revised or if taxonomic nomenclature is revised or updated.
(6) Community engagement and empowerment are essential: Neotoma serves diverse communities (Figs. 2, 3). The constituent groups are essential to Neotoma’s ability to grow and scale upward. Hence, Neotoma continually seeks to enlarge and support its community of data stewards, contributors, and third-party developers (see “Governance and Data Use” and “Next Steps”). The sustainability of Neotoma is ultimately determined by the degree to which it supports key research priorities of its community.
(7) Neotoma is part of a larger ecosystem: Many communities are gathering and assembling their data, while others establish standards, vocabularies, and systems for sharing data across systems. Data types are many, and Neotoma’s resources are few. Hence, whenever possible, Neotoma will partner with allied resources. For example, other organizations have set standards for storing and representing information about individual investigators (ORCID; https://orcid.org/), physical samples (International Geo Sample Numbers; http://www.geosamples.org/igsnabout), geospatial data (Open Geospatial Consortium; http://www.opengeospatial.org/), or funding agencies (FundRef registry built by CrossRef; https://www.crossref.org/services/funder-registry/); Neotoma is adopting or moving toward adopting these common standards. Similarly, Neotoma seeks to develop partnerships to intersect paleoecological and paleoenvironmental data with other kinds of climatic, archaeological, and ecological data (see “Next Steps”).
NEOTOMA DATA MODEL: FUNDAMENTAL CONCEPTS
This section describes high-level semantic concepts embedded within Neotoma’s data model. We first describe Neotoma’s system for representing and storing the many kinds of sedimentary sampling designs used by paleoecologists, then the kinds of information linked to variables, and finally Neotoma’s system for representing time. We do not attempt to describe in detail Neotoma’s relational database structure because most scientific users do not come into direct contact with the actual relational database. However, many of the concepts described here correspond to one or more data tables in Neotoma’s relational database. For interested scientists and developers, further information is available in the Neotoma Database Manual (http://www.neotomadb.org/uploads/NeotomaManual.pdf).
Sites, collection units, analysis units, samples, and data sets
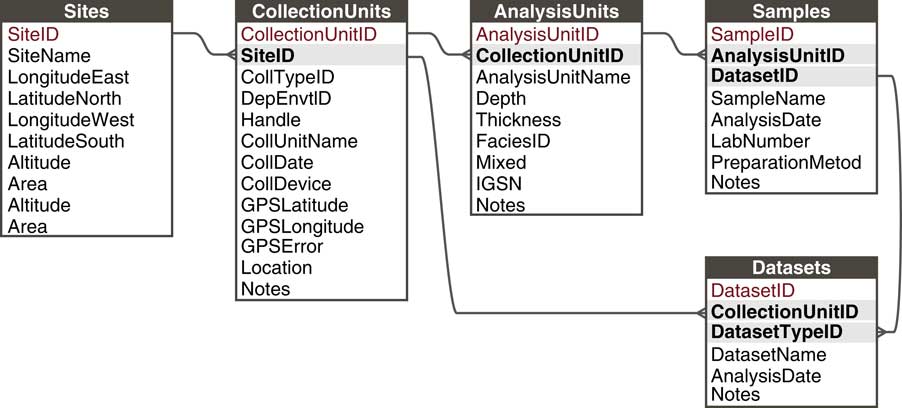
Paleoecological data from sedimentary archives have many commonalities: They typically involve measurements of fossil organisms or proxies found in various geologic archives along some spatial direction, usually vertical depth, for which we estimate time with uncertainty (see also Evans et al., Reference Evans, Tolwinski-Ward, Thompson and Anchukaitis2013). These commonalities enable a common data model. Within this general framework, many sampling systems exist that vary within and among subdisciplines and depositional environments. For example, paleolimnologists may collect one or more sediment cores from a lake, with multiple kinds of measurements made on the cores and subsamples from it; archaeologists may collect botanical or faunal specimens from surface scatter or excavations; or vertebrate paleontologists may measure stable isotopes on bones collected from a sediment section or cave deposit. In order to flexibly store data from these different sampling methods, Neotoma uses a hierarchical arrangement of sites, collection units, analysis units, samples, and specimens, with samples further grouped by type into Datasets (Fig. 5; Grimm et al., Reference Grimm, Keltner, Cheddadi, Hicks, Lézine, Berrio and Williams2013).
The Neotoma data model handles different kinds of sampling designs by paleoecologists through a flexible hierarchical system consisting of sites, collection units, analysis units, samples, and datasets. Sites are the field locations from which paleoecological data are obtained and can contain multiple collection units. Collection Units are the specific point-level locations within sites from which data are obtained and can contain multiple analysis units. Analysis Units are the specific depth horizons from which data are obtained and can contain multiple samples. A Sample is a single piece of material extracted from an analysis unit, for which a single kind of measurement is made (e.g., analyzed for fossil pollen, stable isotopic analyses, etc.). A Dataset comprises all samples of a single data set type in a single collection unit (e.g., all pollen samples from a single core).
A site is a geographic place from which paleoecological data have been collected. Examples of sites include lakes, caves, archaeological excavations, and stratigraphic sections. The spatial extent of sites is flexible and tends to be defined based on field practice, ranging from a single point to a lake or archaeological site with an extent measured in hectares. Key properties include name, geographic coordinates, altitude, and areal extent. In Neotoma, the spatial extent of sites is represented by bounding boxes with north and south latitudes and east and west longitudes. The bounding box can circumscribe the site (e.g., a lake) or may circumscribe a larger area containing the site, either because site location is imprecisely known (e.g., described as “on a gravel bar 5 miles east of town”) or because location is purposely kept vague (e.g., to prevent looting and vandalism). Many legacy sites in Neotoma have point coordinates. A site will have one to many collection units.
A collection unit is a place within a site from which a set of fossil specimens or samples has been collected. Typical collection units include individual or composite cores from lakes and peatlands, profiles from stratigraphic sections (e.g., river cutbanks, quarry walls), archaeological or paleontological excavation features or contexts, isolated specimens (e.g., a bone collected from a gravel bar), and surface samples. Collection units typically have spatial Cartesian or geographic coordinates within a site. Collection unit properties include name, latitude-longitude coordinates (represented as point coordinates with error), altitude, date of collection, and metadata about collection methods and the depositional environment. The definition of collection units and their spatial extent is flexible. For example, in a pit cave with three fossil-rich sediment cones, each with several excavation squares, the collection units could be defined as the individual squares, or as three composite collection units, one from each sediment cone. In another example, consider a lake with two closely adjacent cores from the lake center, plus a single core near the lake margin. In this case, the two central cores might be merged into one composite collection unit, with a second collection unit representing the lake-margin core. A collection unit will have one to many analysis units.
An analysis unit is a unique sampling location within a collection unit. Analysis units are typically arrayed along a depth transect, usually oriented vertically. Analysis units may be identified by depth and optionally thickness or by name and optionally ordinal position. Analysis units may be arbitrary intervals or natural strata. Examples of analysis units include individual depth intervals along a sediment core or within an excavation, individual strata or features within an excavation, individual measurements taken along a transect from outer surface to inner core of a speleothem, and so forth. Natural strata may be vertically superimposed but may vary in depth and thickness within a section or excavation, particularly in colluvial sections and sediment cones below pit-cave openings. In this case, the “depths” may be ordinal positions or pseudo-depths. However, in some cases, analysis units may be single-context features (e.g., archaeological hearths and storage pits), which may be identified by name only, with no explicit depth. An analysis unit will have one to many samples.
A sample is a single set of measurements of a single dataset type from an analysis unit. Dataset types usually correspond to taxonomic groups that are the loci of scientific expertise and Neotoma’s constituent databases (e.g., diatoms, ostracodes, pollen, plant macrofossils, and terrestrial vertebrates). Samples and dataset types can also comprise geochemical measurements (e.g., stable isotopes, organic biomarkers), physical measurements (e.g., loss on ignition), or geochronological measurements (e.g., 14C or 210Pb dates). For example, the same analysis unit from a stratigraphic section may have a vertebrate sample and a macrobotanical sample, or an analysis unit from a sediment core may have pollen, diatom, ostracode, and stable isotope samples. The analysis unit links together samples located in the same stratigraphic interval, whereas datasets links samples from the same collection unit.
Datasets comprise all samples of the same data type from a collection unit. Datasets are typically the subjects of publication and are a primary mode in which data within Neotoma are packaged for delivery to users. For example, clicking on a site in Neotoma Explorer (http://apps.neotomadb.org/explorer/) will return a list of all datasets at that site. Similarly, in the neotoma package in R, Neotoma data are primarily passed to R in the form of datasets, using the get_datasets and get_download functions (which respectively return dataset metadata and data; Goring et al., Reference Goring, Dawson, Simpson, Ram, Graham, Grimm and Williams2015). Similarly, DOIs are assigned to datasets, but not to samples or analysis units (http://data.neotomadb.org/datasets/5000/index.html).
A specimen is the physical form of a biological object (e.g., a vertebrate bone or other fossil) retrieved from a sample. Specimens are often curated and housed at museums, geologic surveys, or other repositories. Specimens often have catalog numbers, accession numbers, or other unique identifier assigned by their institution. In 2016–2017, the Neotoma data model was extended to store specimen-level measurements (e.g., radiocarbon dates and stable isotopic measurements from individual teeth or bones). Neotoma does not currently store information about specimen morphometric traits, but the data model could be extended in this direction, or Neotoma could link out to other databases that store specimen- or species-level trait data (e.g., iDigBio, MorphoBank).
Variables
In Neotoma, variables store information about measured organisms or proxies of any type. Variables have the property taxon name (equivalent to variable name) and the optional properties element, units, and context.
In Neotoma, taxon name is used in the broad sense to include both organismal taxa and physical “taxa” such as stable isotopes, organic biomarker compounds, and inorganic minerals. Neotoma uses defined vocabularies of taxon names, and, during the validation process of uploading data to Neotoma, taxon names in uploaded files are automatically checked and flagged if there is no match. New names may be proposed by stewards and approved by taxonomic experts (see “Governance and Data Use”). Taxon names for organisms can include non-Latin modifiers to indicate the level of uncertainty in the taxon identification. For example, Ambrosia, Ambrosia-type, and cf. Ambrosia are three different taxa. The uncertainty modifiers are included in the taxon name, rather than in a separate field, so as to indicate the exact level of uncertainty and to faithfully record the original identification, in which the uncertainty is usually included as part of the name. Thus, Odocoileus cf. O. virginianus indicates that the genus identification is secure, but the species is uncertain; whereas, cf. Odocoileus virginianus indicates that the genus identification is uncertain. This example might be the case for regions in which Odocoileus virginianus (white-tailed deer) is the only Odocoileus species biogeographically reasonable; thus if it is an Odocoileus, it must be Odocoileus virginianus. The “cf.” designation may occur at any number of taxonomic ranks or cladistic nodes. With the exception of the uncertainty modifiers (cf., aff., sp., spp., undiff., -type, ?), non-Latin modifiers are included in parentheses—for example, Poaceae (<50 µm), Leporidae (large), Eudicotyledoneae (tricolpate, Hooghiemstra 1984 type 152). The forward slash symbol is used to indicate identifications limited to a small number of taxa (usually two) with elements that cannot be differentiated (e.g., Ostrya/Carpinus). This packaging of taxon name and uncertainty into a single field carries the advantage of staying true to paleontological tradition and nomenclature but hinders integration with contemporary biodiversity databases.
If taxonomic names used by data contributors or publications are changed, the original name can be stored. Database-wide changes to a taxon are always stored—for example, a name change because of taxonomic revision. Different constituent databases have somewhat differing practices for nomenclatural synonymizations made at the time of initial data validation and upload: some retain the original name, others replace with the currently accepted synonym. For homotypic synonymizations that do not involve a change in circumscription (e.g., Gramineae ≡ Poaceae), original names do not have to be stored; but for heterotypic synonymizations or any name change that involves a potential change in circumscription, original names should be stored. In addition, name changes because of reidentification should be stored—for example, a specimen initially identified as Mammuthus but later reidentified as Mammut.
For organismal taxa, the element is the organ or part of the organism that was identified. Thus, for pollen datasets, element names include “pollen,” “spore,” and “stomate.” For plant macrofossil datasets, elements include “leaf,” “seed,” “bud scale,” “microstrobilus,” and “wood.” For fossil insects, elements include “heads,” “pronota” (thoraces), “elytra” (left and right), and “aedeagii” (reproductive organs). For vertebrates, the element is generally the bone or tooth identified, such as “femur” or “tooth, third molar.” Elements, particularly vertebrate elements, may have components, including symmetry, portion, and maturity, entered in that order and separated by semicolons (e.g., “femur;left;distal;fused” or “tooth, third molar;lower left”). Elements are also used for modifying physical variables. For example, for the variable loss on ignition, the element is the temperature (e.g., 500°C). Neotoma also uses defined vocabularies for elements.
Units are the measurement units in which the variable is measured. For organismal taxa, the most common units are NISP (number of identified specimens, often called a “count” for microfossils), MNI (minimum number of individuals), and presence. For example, five left femurs would indicate at least five organisms (MNI = 5), but five pollen grains could have one to five source plants (NISP = 5). For presence data, a value of 1 is entered for presence, or the cell is left blank. Zeroes or absences are not stored in Neotoma for organismal taxon variables, because the true absence of a taxon is difficult to definitively establish, given that probability of detection is a function of sampling effort, ecological rarity, and taphonomic processes (Birks and Line, Reference Birks and Line1992; Weng et al., Reference Weng, Hooghiemstra and Duivenvoorden2006; Olszewski and Kidwell, Reference Olszewski and Kidwell2007). However, partial evidence for taxonomic absence exists for some samples if that taxon was identified in other samples in the same data set, under the assumption that the analyst looked for that taxon in all samples in a data set. Neotoma also allows semiquantitative systems for measuring abundance—for example, the 1–5 relative abundance scale often used in the rodent midden literature (Spaulding et al., Reference Spaulding, Betancourt, Croft and Cole1990) or other relative scales used in archaeobotany. Geochemical and physical variables can have many kinds of measurement units (e.g., “percent,” “per mil,” “meq/L,” “mg/L,” and so on). For physical and geochemical measurements, such as δ13N, for which zero can be a measured value, zeroes are stored. Neotoma uses defined vocabularies for units.
Context refers to a depositional context that may influence the interpretation of the taxon. Examples include anachronic, redeposited, or intrusive, which imply that the taxon was deposited at a different time than its sediment matrix. A Cretaceous pollen grain may be reworked and redeposited into more recent sediments; a modern Sus (pig) bone may be intrusive in Pleistocene sediment. Anachronic simply implies the taxon is of a different age. Contexts sometimes used with pollen are clump and anther, where clumps of pollen or anther fragments may indicate an overrepresentation of the taxon (e.g., a bee carrying usually infrequent entomophilous pollen may have fallen into the sediment). It is possible for fossils in a data set or sample to be from the same taxon but have different contexts—for example, both clumped and nonclumped pollen of one taxon, or Holocene and older reworked Betulaceae pollen (distinguishable by preservational differences) in the same assemblage.
Time, age controls, relative ages, age-depth models, chronologies
In Neotoma, the age estimates attached to samples and specimens are treated and stored as a derived variable that must be estimated through a combination of absolute age controls, relative age controls, event stratigraphic ages, and age-depth models fitted to those controls (e.g., Parnell et al., Reference Parnell, Haslett, Allen, Buck and Huntley2008). Some types of geochronological information are more stable than others. For example, individual geochronological measurements will remain stable, but the set of age controls available at a site or collection unit can change as new dates are obtained. The fitted age-depth models and derived age inferences are also changeable, as estimates of radiometric decay constants are updated, radiocarbon calibration curves are adjusted, the quality of individual age controls is reassessed, new statistical age-depth models are developed, and so forth. Hence, the Neotoma data model separately represents and stores these layers of information about time as age controls, relative ages, age-depth models, and chronologies. Most of the definitions described here are originally from Grimm et al. (Reference Grimm, Blaauw, Buck and Williams2014).
An age control is an estimate of absolute age, often with a specified uncertainty, for a sample within a core or stratigraphic profile that is used to constrain an age model for that core or profile. Examples of age controls include radiocarbon and other radiometric dates, optically stimulated luminescence, biostratigraphic events, tephras, core top, coins or other dated cultural artifacts, and so forth (Blois et al., Reference Blois, Williams, Grimm, Jackson and Graham2011; Giesecke et al., Reference Giesecke, Davis, Brewer, Finsinger, Wolters, Blaauw and de Beaulieu2014). Age controls are primary data in Neotoma and generally assumed to be fixed and unchanging; barring data entry error, new age controls can be added, but existing age controls are not modified. Age control data are stored in tables that are separate from but linked to tables that store information about age-depth models and chronologies. In Neotoma, age control data are stored in the Geochronology table.
Radiometric ages are the most common kind of age control stored in Neotoma, and radiocarbon dates are the most common kind of radiometric date (17,054 of 18,483 age controls in Neotoma are radiocarbon dates, as of November 7, 2017). Radiocarbon dates are stored in original radiocarbon years, with counting uncertainties stored as one standard deviation. Calibrated ages are stored in Neotoma as components of chronologies, or simply regenerated by users as needed. Other radiometric metadata include depth and thickness of sample, material dated, lab identifier, δ13C (for radiocarbon dates), instrumental measurement system, and publication information.
Relative ages store information about the association of analysis units with formally recognized relative age scales based on the stratigraphic record or a series of geologic events. These formations and events have their own age estimates, which can change over time. A relative age encompasses a range of time (i.e., it has an upper and lower age bound), and samples assigned to a relative age event are assigned those ages. Examples include Marine Oxygen Isotope Stages, Heinrich stadials, geomagnetic chrons, archaeological periods, and North American land mammal ages. Thus, a sample assigned to Marine Isotope Stage 5e would be assigned a sample age of 130–116 ka based on the current authoritative estimate (currently, Lisiecki and Raymo, Reference Lisiecki and Raymo2005). Optionally, this sample age could be further constrained by other criteria. A full list of relative age scales is available via the Neotoma API (http://api.neotomadb.org/v1/dbtables/RelativeAgeScales; in JSON format). Currently, these relative age scales and associated age estimates are stored in Neotoma in the RelativeAges table and must be updated by stewards; ideally, these ages would be dynamically updated by linking to other authoritative data resources on stratigraphic age.
Event stratigraphic ages are globally synchronous, single-event stratigraphic markers, ideally with an age and error, which can be used in age models similar to geochronological ages. Volcanic deposit tephras often serve this purpose. For example, the Mazama tephra, which occurs over a large area of western North America, has been dated to 7627±150 cal yr BP (Zdanowicz et al., Reference Zdanowicz, Zielinski and Germani1999). The Hekla 1104 tephra originating from Iceland, but distributed as far east as Ireland, is historically documented to AD 1104 or 846 cal yr BP (Boygle, Reference Boygle1999). Some event stratigraphic ages are the boundaries of relative age units (e.g., geomagnetic polarity reversals are event stratigraphic ages and are also the boundary ages for geomagnetic chrons, which are relative ages). Hence, a fossil vertebrate assemblage might occur within a unit stratigraphically assigned to the reversed polarity Matuyama chron, with a relative age of 2.581–0.781 Ma, while the Brunhes/Matuyama geomagnetic polarity reversal, which might be an age control for an age model in a core or section, is dated to 0.781 Ma (Ogg and Smith, Reference Ogg and Smith2005). Event stratigraphic ages are treated in the Neotoma data model as instantaneous; although, of course, the actual events occurred over periods of time, from weeks to a few years for a volcanic eruption to perhaps several hundred or even a few thousand years for a geomagnetic reversal (e.g., Clement, Reference Clement2004). However, for most practical applications, this error should be relatively small and ideally incorporated within the age error estimate.
An age-depth model is an algorithm used to estimate the age-depth relationship for a given stratigraphic profile based on the age controls available for that profile and prior knowledge. Age-depth models are used to estimate ages for depths not directly associated with an age control or to resolve discrepancies among age controls. Examples of age-depth modeling programs include classical age modeling approaches (linear interpolation, linear regression, polynomials, and splines; Blaauw, Reference Blaauw2010) and Bayesian approaches such as Bacon (Blaauw and Christen, Reference Blaauw and Christen2011) or BChron (Parnell et al., Reference Parnell, Haslett, Allen, Buck and Huntley2008). In Neotoma, information about age-depth models is stored in the Chronologies table.
A chronology is a series of estimated ages for a set of samples in a collection unit, ideally with associated uncertainty estimates. Chronologies usually derive from an age-depth model and a set of age controls (radiometric, relative, events, or other) used to constrain that model. In Neotoma, information associated with chronologies is parsed into three tables, including (1) the ChronControls table, which stores information about the age controls used to constrain an age-depth model. These age controls can, but do not have to, correspond to the age controls stored in the Geochronology and other primary data tables; this flexibility allows scientists to remove age controls deemed to be inaccurate or add other age constraints to the age-depth model (e.g., assigning a modern depositional age to the top of the stratigraphic profile). (2) The Chronologies table stores information about the age-depth model, its parameters, the analyst, and other metadata. (3) The SampleAges table stores the resultant inferred ages for individual samples. All Neotoma chronologies have a unique identifier and are also linked to a specific collection unit.
Chronologies can be stored as calendar years before present, radiocarbon years before present, or calibrated radiocarbon years before present. The chronology and associated age-depth model originally published for a collection unit are stored provided that the age controls, sample ages, and metadata sufficient to replicate the age model are published or provided by the contributor. A collection unit may have multiple chronologies or none, if no age information is available for the collection unit. Hence, each sample in the collection unit may have multiple age estimates, each linked to a unique chronology. New chronologies may be added to Neotoma, and we envision this component of the Neotoma database to be dynamic over time, as users download data and build new chronologies.
To handle the multiplicity of chronologies, Neotoma allows one chronology per collection unit to be designated as a default chronology. Choice of default chronologies is made by data stewards, and this choice can be revised as new chronologies are added. Default chronologies may be stored in calendar, radiocarbon, or calibrated radiocarbon years before present. Chronologies in radiocarbon years are not recommended but exist as legacies in Neotoma. We anticipate that over time, these default radiocarbon chronologies will be replaced by updated chronologies in calibrated radiocarbon years. Researchers using Neotoma data are cautioned to critically examine its chronologies and encouraged to contribute new and revised chronologies.
DATA HOLDINGS AND DATA TYPES: CURRENT STATUS AND TRENDS
As of November 8, 2017, Neotoma holds more than 3.8 million data records from 17,275 data sets and 9269 sites (Fig. 6). Each data record is the measured value of a single taxon or other variable from a single sample. The Neotoma taxa table is a dictionary with more than 29,000 taxa, fossil morphotypes, geochemical variables, and other variable names.
(color online) History of data uploads to Neotoma, expressed as number of observations (left) and data sets (right). Neotoma launched in 2009 with a number of data sets already in it, mostly pollen and vertebrates, representing prior database building efforts from the Global Pollen Database and FAUNMAP efforts. Rate of data uploads accelerated after 2013, when the new Neotoma data model was established and Tilia’s data upload and validation routines were written. The number of data sets is relatively even among several major data set types (vertebrates, pollen, geochronological data) with recent rapid growth of ostracode and diatom data sets. The number of pollen observations (left) is large relative to the number of data sets (right) because pollen data sets often have many samples (e.g., many samples per core) and many variables per sample (i.e., dozens of taxa per sample). As other taxa- and sample-rich data sets are added to Neotoma (e.g., diatoms, ostracodes), their relative proportions will quickly increase.
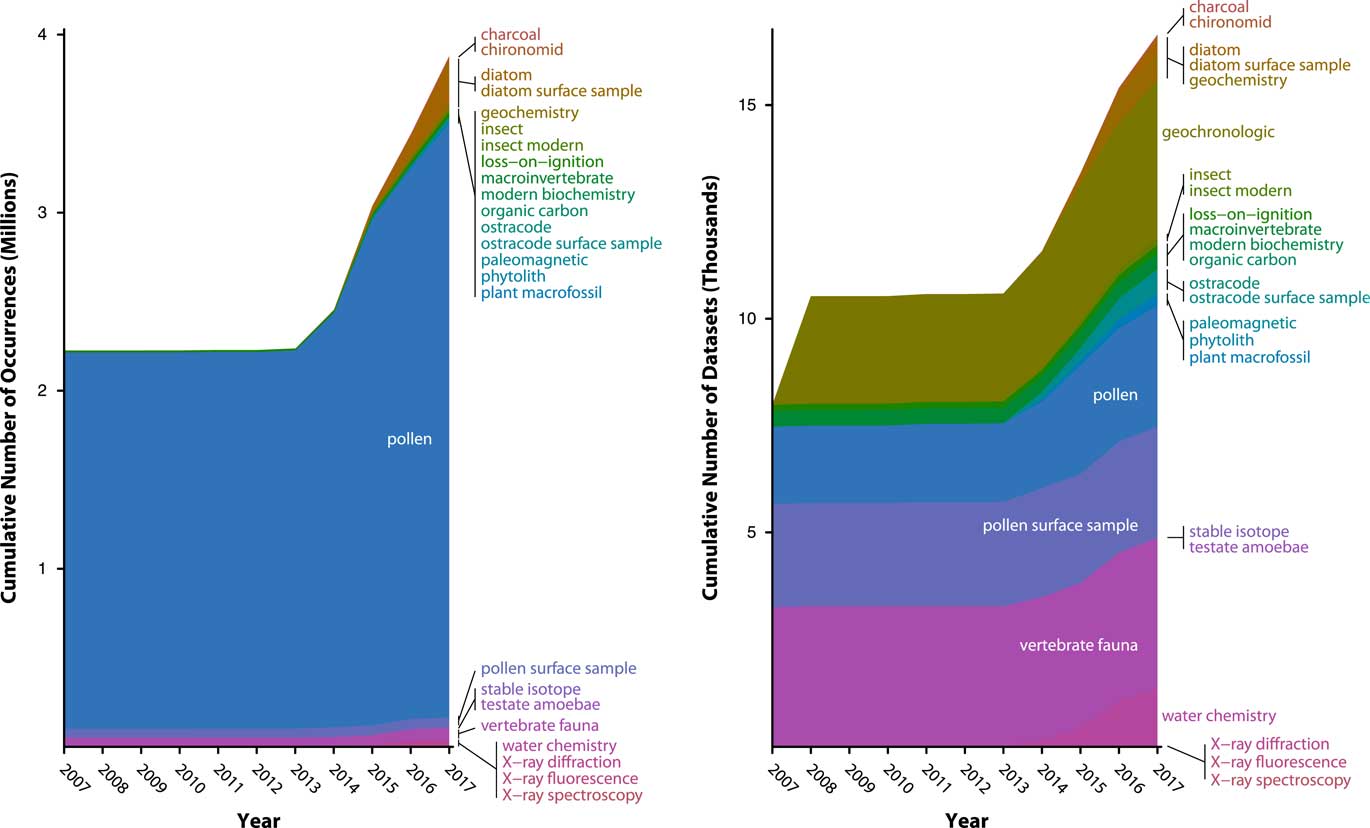
Data volumes in Neotoma have been rapidly growing as data are uploaded, with a 30% increase since 2014, when a new wave of data uploads began, following the extension of the Tilia software package (see “Technical Specifications and Software Ecosystem”) was extended to enable data validation and upload to Neotoma (Fig. 6). As of July 13, 2017, Neotoma holds 2954 pollen data sets (3,274,501 data records), 2600 pollen surface sample data sets (56,205 data records) 3669 vertebrate fauna data sets (59,278 data records), 388 diatom data sets (238,344 data records), 637 diatom surface sample data sets (29,968 data records), 554 ostracode surface sample data sets (2410 data records), 384 macroinvertebrate data sets (805 data records), 283 plant macrofossil data sets (10,654 data records), 177 insect data sets (19,766 data records), and a number of other data set types (Table 1). Of these, 5226 data sets are from sediment cores, 562 from rodent middens, 285 from excavations, and 1051 from stratigraphic sections. Neotoma holds 3842 geochronological data sets, with 18,543 individual geochronological measurements. These data volumes have made Neotoma one of the largest structured repositories of geochronological data.
Constituent Databases in Neotoma and the number of datasets in each.
* The European Pollen Database is currently being migrated into Neotoma and contains additional datasets not tallied here. These datasets are archived at Pangaea (www.pangaea.de).
Although Neotoma has focused primarily on paleoecological and geochronological data, it also stores associated physical and geochemical proxies. It includes modern water chemistry data (1317 data sets, 18,487 data records), loss-on-ignition data (190 data sets, 24,903 data records), charcoal (100 data sets, 14,428 data records), and physical sediment measurements (55 data sets, 1292 data records). Trial data sets have been uploaded for X-ray fluorescence and X-ray diffraction, as well as sedimentary geochemistry data. Surface samples can be flagged in Neotoma during upload, to facilitate their use in the building of modern calibration data sets for transfer functions (Birks, Reference Birks1995). Some associated measurements of environmental variables (relating to water chemistry) are enabled for the ostracode and diatom surface samples stored in Neotoma, and we plan to extend the Neotoma data model to store other environmental variables (e.g., climate variables) associated with surface samples. The Neotoma data model was recently extended to include stable isotopic data and metadata for δ18O, δ13C, δ15N, δD, δ34S, and 87Sr/86Sr. Isotopic measurements can be stored for samples from sedimentary profiles or from individual fossil specimens. We are expanding the Neotoma data model to store organic biomarker data and taphonomic measurements on vertebrate fossils. Because the formation of constituent databases in Neotoma is a voluntary, bottom-up process (“Governance and Data Use”), whether to extend Neotoma to other proxies largely depends on (1) interest by paleodata communities in using Neotoma to house their data and (2) developer and steward time to extend data tables and metadata variables as needed.
Note that Neotoma currently focuses on storing primary paleoecological measurements and generally does not emphasize the storing of derived inferences. For example, Neotoma currently does not store indices of community diversity (richness, evenness, etc.), paleoclimatic reconstructions, biomes or other paleovegetation reconstructions, and so forth. Our general philosophy is that, given finite resources and the rapid pace of generating these inferences by the scientific community, these reconstructions are best generated and managed outside of Neotoma, ideally using workflow methods that clearly link all derived inferences back to the primary data resources inside Neotoma. However, this boundary between primary data and secondary inferences is not set in stone and could be revised depending on research and development priorities within and among constituent databases and their research communities.
TECHNICAL SPECIFICATIONS AND SOFTWARE ECOSYSTEM
The Neotoma software ecosystem (Fig. 4) has Neotoma’s relational database at its heart and includes multiple systems for finding, exploring, visualizing, downloading, processing, and uploading data. We describe each in turn.
Database
Neotoma is currently hosted on servers at Pennsylvania State University, maintained by the Center for Environmental Informatics (CEI). Neotoma uses a relational database structure that was originally deployed in Microsoft SQL Server and now is being migrated to PostgreSQL, so that it will rely primarily on open source technology. Neotoma’s relational database structure continues to evolve over time, as new data types and metadata fields are added. A description of the relational database structure and tables is available in an online manual (http://neotoma-manual.readthedocs.org/en/latest/).
Data uploaded to the Neotoma relational database are protected by multiple backup measures at CEI, including redundant disk storage, off-site mirroring, file system snapshotting, regular tape backup, and duplication of the backup set. Complete snapshots of the Neotoma database are posted to the Neotoma website (https://www.neotomadb.org/snapshots) and to figShare (e.g., https://dx.doi.org/10.6084/m9.figshare.3376393.v1). figShare in turn ensures long-term data sustainability through its partnership with the Digital Preservation Network, which obtains periodic snapshots of the entire figShare collection (including the Neotoma snapshots) and replicates it across at least two replicating nodes, including the Academic Preservation, DuraCloud Vault, Stanford Digital Repository, Texas Preservation Node, and HathiTrust. Neotoma also will send these snapshots to the paleoclimatology branch of NOAA’s National Center for Environmental Informatics. Database snapshots are intermittent at present, but we plan to establish a regular automated schedule on a quarterly frequency. Neotoma is a certified member of the International Council for Science’s World Data Service, which sets standards for open, quality-assured, and sustained stewardship of scientific data.
Data retrieval: finding, exploring, and downloading
Multiple avenues exist to find, explore, and obtain data from Neotoma, each serving different needs and users. Neotoma data can be accessed via the Neotoma Explorer interactive map-based interface (https://apps.neotomadb.org/Explorer/), through a RESTful API (https://api.neotomadb.org/), and through DOIs that provide persistent and unique identifiers for every dataset in Neotoma (e.g., https://data.neotomadb.org/datasets/1001/). Further, Neotoma data can be searched, viewed, and analyzed through Neotoma Explorer and the Neotoma API, and also the neotoma R package and stratigraphic and map-based visualizations in Tilia. Through partnership with the Earth Life Consortium (http://earthlifeconsortium.org/), we are developing wrapper APIs that can simultaneously search for paleobiological data in Neotoma, the Paleobiology Database, and other partner databases (http://www.earthlifeconsortium.org/api_v1/ui/). A full set of links, manuals, code repositories, and other resources are provided in the Supplementary Materials.
Neotoma Explorer (https://apps.neotomadb.org/explorer/), a map-based web application for searching, visualizing, and downloading data, is Neotoma’s primary data discovery portal. Users can generate flexible queries for properties such as taxon name, variable type, time window, location, constituent database, site name, and researcher name. Results are displayed in an interactive map, and users can quickly retrieve site and dataset metadata by clicking on sites of interest. Users interested in deeper exploration of datasets can then view them in Explorer’s Stratigraphic Diagrammer to inspect age models, stratigraphic plots, and associated publications. Datasets can be downloaded as delimited text files or shared via links that make use of Neotoma’s API (e.g., http://apps.neotomadb.org/Explorer/?datasetid=1768). Searches can be saved as JSON files, which can be archived or shared with other users, who can reopen them in Neotoma Explorer (by dragging the JSON file to the Explorer window) to redisplay the results and map configuration produced from the query. Following our design principle of promoting openness, Explorer is built on the Open Web Platform using HTML5, CSS3, and JavaScript, enabling cross-browser and cross-platform support, and makes use of the open-source Dojo and OpenLayers libraries (Roth et al., Reference Roth, Donohue, Sack, Wallace and Buckingham2014).
APIs enable programmatic access to the database by third-party developers and software applications. Likely API users include the following: scientists who need to incorporate the most current data into analytical workflows such as scripts written in R; organizations that want to distribute Neotoma data (with attribution) via their own data portal or web interface (e.g., customized and branded web portals for individual constituent databases); and developers creating stand-alone applications for data analysis and display. Known third-party users of Neotoma APIs include NOAA Paleoclimatology (https://www.ncdc.noaa.gov/data-access/paleoclimatology-data), which has a data search portal that will search and retrieve data housed in either NOAA or Neotoma; Flyover Country (http://fc.umn.edu/), a mobile app-based program for travelers to discover geologic data and knowledge during their journeys (Loeffler et al., Reference Loeffler, Ai, McEwan and Myrbo2015); and the Global Pollen Project (https://globalpollenproject.org/) (Martin and Harvey, Reference Martin and Harvey2017), a community platform for pollen identification. The APIs are implemented as platform- and language-independent RESTful web services; response formats include JSON and XML.
The R package neotoma uses the Neotoma API to pass data into R for further analysis (Goring et al., Reference Goring, Dawson, Simpson, Ram, Graham, Grimm and Williams2015). R is an open-source fourth-generation programming language for statistical analysis and graphics. Many paleoecological statistical and visualization packages have been developed for R, such as analogue (Simpson, Reference Simpson2007; Simpson and Oksanen, Reference Simpson and Oksanen2015), rioja (Juggins, Reference Juggins2015), bchron (Parnell et al., Reference Parnell, Haslett, Allen, Buck and Huntley2008), bclim (Parnell et al., Reference Parnell, Haslett, Sweeney, Doan, Allen and Huntley2016), clam (Blaauw, Reference Blaauw2010), and bacon (Blaauw and Christen, Reference Blaauw and Christen2011). Development of neotoma is ongoing (v. 1.7.0 is available via the Comprehensive R Archive Network; https://cran.r-project.org/web/packages/neotoma/index.html), and the living neotoma code, feature requests, bug reports, and development are open and available through GitHub (https://github.com/ropensci/neotoma).
DOIs are now being assigned as persistent and unique identifiers to all Neotoma data sets, which will facilitate citation of Neotoma data and linked-data systems for sharing and connecting earth science data (Duerr et al., Reference Duerr, Downs, Tilmes, Barkstrom, Lenhardt, Glassy, Bermudez and Slaughter2011). DOIs are created using the EZID system (https://ezid.lib.purdue.edu/), affiliated with DataCite (https://www.datacite.org/), through a license with the University of Wisconsin–Madison Library and University of Illinois. DOIs are assigned at the level of datasets, and each DOI has a landing page (e.g., https://data.neotomadb.org/datasets/1001/) that is designed to provide information to both human and machine users. The DOI pages point to living versions of the Neotoma data; if the Neotoma data are updated, these changes will be automatically detected and incorporated in the DOI landing pages. This approach differs from, for example, Pangaea (http://www.pangaea.de), in which DOIs point to static versions of datasets.
Data validation, upload, and management
All data added to Neotoma are reviewed by a data steward (see “Governance and Data Use”) before upload; this expert curation is central to Neotoma’s mission of providing high-quality scientific data. Data entry, curation, and upload into Neotoma are handled through the Tilia software (https://www.tiliait.com/). Tilia was originally developed as a DOS program to visualize and analyze pollen stratigraphic data (Grimm, Reference Grimm1988) and is still often used for this purpose. Tilia, now a Windows program, still maintains its end-user functions for managing, analyzing, and visualizing stratigraphic data, but its capabilities have been extended to support validation and upload of data to Neotoma, as well as direct download of data from Neotoma. Only Neotoma stewards who have password access to Neotoma have access to the upload capability; any user can download data. Tilia now generates .tlx files in extensible markup language (XML) format, which is a simple, extensible text-based markup language format. Tilia contains multiple validation procedures for quality control during upload, including checks against controlled vocabularies, for missing or duplicate data, data inconsistencies, common errors, and commonly omitted metadata.
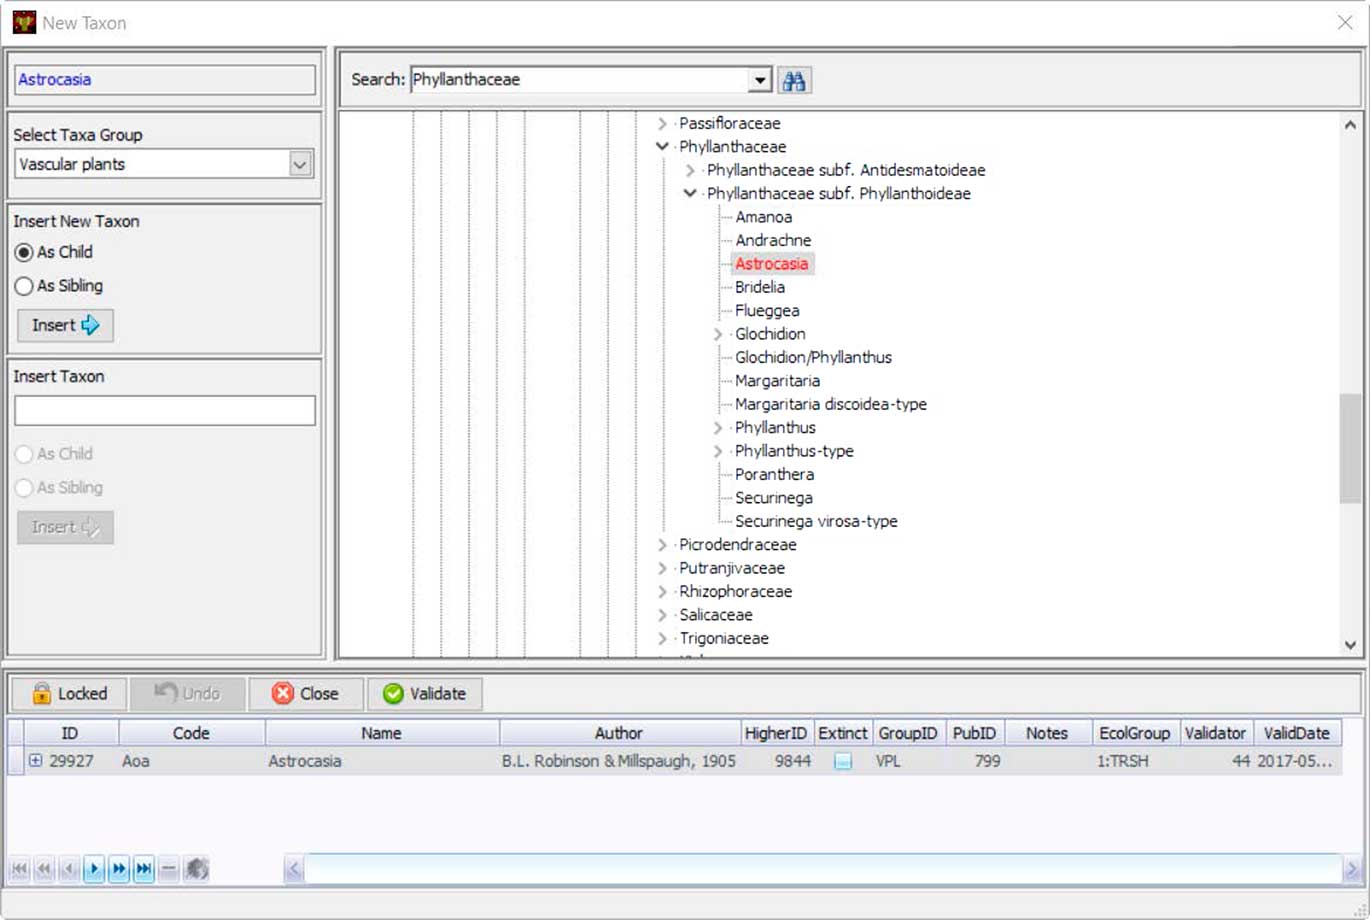
Neotoma uses controlled vocabularies for taxa, elements, units, contexts, geopolitical units, depositional environments, geochronological measurements, chronological controls, and other variables that store text-based names. These names are stored in Neotoma tables, and the Tilia validation process checks names in .tlx files against these names. Central to the database is the Taxa table, which contains the names of all taxa in the database. Names not found in the Taxa table during Tilia validation are listed, and stewards can check for spelling errors or formatting differences for non-Latin modifiers by searching with wildcards. If the name is valid but not yet in Neotoma, the steward can upload it to the database. Taxonomic names are separately validated by designated taxonomic experts. If the steward is a taxonomic expert, then the date of entry is recorded as the date of validation. Otherwise the field for validation date is left empty until the taxon is validated. Tilia has a tool that shows the Neotoma taxa in a taxonomic hierarchy, easily allowing the steward to place the new taxon in its correct taxonomic position (Fig. 7).
(color online) Tilia’s interface for stewards to add new taxonomic names to Neotoma’s Taxa table. Names are placed within a taxonomic tree, and each taxon name is assigned a unique identifier. Stewards can also upload a citation for the source of that taxonomic name.
Other Tilia validation steps include checking for valid data set types, for valid combinations of taxon and element (e.g., disallowing the combination of “Picea” and “femur”), that latitude-longitude coordinates for collection units fall within site bounding boxes, that elevations fall within possible limits, and that the younger/older reliable age bounds for chronologies are not reversed (a common error). To validate longitudes and latitudes, the steward is shown a world map with the hemisphere indicated, which must be approved. Positive δ13C values associated with radiocarbon dates (a common entry error) are flagged. Tilia will ask the steward whether the top sample of a stratigraphic sequence should be flagged as a modern surface sample. During the validation process, error messages, warnings, or notes may be issued. Notes indicate omissions of optional metadata items that are not required and often nonexistent or unavailable. Warnings indicate omissions of optional metadata items that nevertheless are highly desirable. Warnings are also issued for likely or possible inconsistencies, which nevertheless may be correct. Errors must be addressed before upload is possible. Once data are validated with no errors, authorized data stewards can upload data from Tilia directly to Neotoma through password-protected web services.
Tilia has a customized API for data upload and download. Controlled vocabularies that appear in Tilia drop-down pick lists, such as taxa and geopolitical names, are held in local XML lookup files, which should be synchronized periodically from their counterparts in the central Neotoma database. Datasets downloaded from Neotoma to Tilia include all relevant metadata, including various notes and comments that may have been entered. This functionality enables enhanced review, visualization, and analysis of Neotoma data beyond that possible in Neotoma Explorer. The downloaded data also facilitate training for end users and data stewards, by providing model datasets in Tilia format. The data steward version of Tilia also allows data stewards to amend data already in Tilia. For example, metadata items such as latitude-longitude coordinates may be corrected, or missing metadata items for sites and collection units may be added. Publications can be corrected or added. Contact information can be updated. Data sets can be added to sites already in Neotoma. New chronologies and sample ages can be added. The ultimate goal is to enable data stewards to correct or add to any data or metadata item within their constituent database through the Tilia interface. Changes made through Tilia are logged, Neotoma preserves snapshots of prior database versions, and we are collaborating with others on building an annotation system, with support from NSF’s EarthCube program. The ability to upload and amend data is a significant power available to data stewards, hence the need for experts to serve as data stewards and for data stewards to act judiciously when modifying data and metadata.
Tilia software is available from https://www.tiliait.com/. The free version has all the spreadsheet and metadata form options, including the ability to download data from Neotoma, which can be copied to other spreadsheet programs. A licensed version for stewards is available at no cost and exposes additional options for data visualization, validation, upload, and management, with a password needed for any action that may alter the database. Other licensed versions of Tilia with graphics capabilities are available and are priced to cover software licensing costs associated with Tilia development.
The Tilia workflow for uploading data follows a model in which site-level datasets and associated metadata are uploaded individually. For larger data ports, where many site-level datasets must be exported from one database into Neotoma (e.g., from the Access tables storing data in FAUNMAP and the European Pollen Database), we have taken two approaches. One is to place the database on the Neotoma server and write customized SQL procedures and web services to download datasets directly to individual Tilia files for validation and upload to Neotoma. The second is to write customized scripts in R or Python that export data sets from the other database to individual Tilia .tlx files, which can then be opened for validation and uploaded by data stewards. Examples of these batch export scripts, developed for FAUNMAP are available on GitHub (https://github.com/NeotomaDB/FAUNMAP_Import).
GOVERNANCE AND DATA USE
Governance and data use policies are designed to support Neotoma’s core goals of data openness and distributed scientific governance. In particular, these policies are intended to (1) make Neotoma data open and available to all interested scientific and public communities; (2) build a governance structure that accommodates both a centralized cyberinfrastructure and a highly distributed scientific community of expertise; and (3) empower and facilitate individual data stewards and constituent databases to set data acquisition priorities, curate data, and establish data quality standards and nomenclatures.
All Neotoma data are free to use through a CC BY 4.0 license. Complete attribution of Neotoma data includes a reference to the Neotoma Paleoecology Database, constituent databases where relevant, and references to all original investigators and publications. An embargo policy has been developed and included in the Neotoma website, and technical implementation is underway. See the Neotoma website (https://www.neotomadb.org/data/category/use) for a full description of the Neotoma data use policy and for the data use statements and citation formats for specific constituent databases.
With respect to governance, key needs include (1) an extendible, scalable governance structure that is easily open to new members; (2) effective executive decision making and responsibility that is bounded by community oversight; and (3) mechanisms to ensure that Neotoma is curated by a community of professionals and scientific experts. Here we briefly summarize the main elements of Neotoma’s governance (Fig. 3) and data use policies. A full description of Neotoma governance is described in its bylaws, available at http://www.neotomadb.org/about/category/governance.
Neotoma is governed by a leadership council (Neotoma Leadership Council [NLC]) that sets policy and represents the scientific perspectives of constituent databases and their data stewards (Fig. 3). Councilors serve for four-year renewable terms, with one-fourth of the NLC up for election each year. The council is elected by Neotoma’s members, who are professional researchers and educators who contribute to and use Neotoma data and are interested in helping govern the database. Membership can be requested by any individual through a simple web form (https://tinyurl.com/NeotomaMember), and requests are approved by Neotoma’s Nominations and Membership Working Group, chaired by Neotoma’s associate chair. Data stewards are automatically granted Neotoma membership.
The NLC delegates responsibility for day-to-day operations to an executive team (Fig. 3), consisting of an executive chair, associate chair, and two other members. All positions on the executive team serve staggered four-year terms and are selected from and by the NLC. Other teams within the NLC include the Education and Outreach Working Group, the Informatics and Technology Working Group, and the International Partnerships Working Group.
Constituent databases are a core concept in Neotoma, and a mechanism by which scientific data governance is distributed among the multiple fields of scientific expertise that Neotoma data embody. (A list of Neotoma’s constituent databases can be obtained through the Tilia API, https://tilia.neotomadb.org/retrieve/?method=GetConstituentDatabases, which returns a JSON object.) All data in Neotoma are associated with a constituent database, each curated by a community of data stewards, taxonomic experts, and data uploaders. Constituent databases are responsible for vetting and uploading their community’s data to Neotoma, setting priorities and quality standards for data uploads, managing taxonomic names, and appointing and training their data stewards and taxonomic experts. Constituent databases may develop variants on the standard Neotoma data use policy. Some constituent databases may be active for a few years (e.g., during a data mobilization campaign linked to a specific large-scale synthesis project and research grant). Other constituent databases may be active indefinitely, when individuals and communities use Neotoma as their platform for archiving, managing, and sharing data.
Data stewards serve a role analogous to that of editors in a peer-reviewed scientific journal. Much of the day-to-day power and responsibility devolves to stewards for ensuring high-quality data uploads to Neotoma. Data stewards are authorized to upload data directly to Neotoma within their constituent database and to modify data within their constituent database. Data stewards often work with one or more data processors, often students or other assistants who assist in the preparation and entry of data into Tilia for eventual upload to Neotoma. Taxonomic experts are a type of data steward that can also authorize the addition of names to Neotoma’s list of accepted taxa names and variables.
NEXT STEPS
New users, contributors, and communities
Neotoma welcomes new members, data contributors, users, data stewards, and constituent databases. There are many avenues for participation by interested scientists. One simple step is to become a Neotoma member (https://tinyurl.com/NeotomaMember). Scientists interested in contributing their data to Neotoma should contact a data steward (https://www.neotomadb.org/data/category/contribution). Research labs with a lot of data may want to consider steward training for someone in their lab. Training webinars can be scheduled by request and are led by current stewards. For scientists interested in learning how to access and use Neotoma data, we have posted learning materials online and periodically hold user-oriented training workshops (see Supplementary Materials).
Research teams interested in building regional- to global-scale data syntheses, both paleoecological and paleoclimatic, may find Neotoma useful as a data synthesis platform. In some cases, these efforts could lead to targeted data mobilization campaigns, uploads of data to Neotoma, and the chartering of new constituent databases.
For example, the ANTIGUA project (e.g., Barnosky et al., Reference Barnosky, Lindsey, Villavicencio, Bostelmann, Hadly, Wanket and Marshall2016) is using Neotoma to store fossil occurrences and age constraints for South American megafaunal species, with data sets currently being processed for upload to Neotoma. The SKOPE project, studying human-environment interactions in the southwestern United States (e.g., Bocinsky and Kohler, Reference Bocinsky and Kohler2014), is using Neotoma as a platform for accessing paleoecological data and, in the process, discovering data corrections and additional records for addition to Neotoma. PalEON, interested in understanding climate-driven vegetation dynamics over the last 2000 yr, has been discovering new records for addition to Neotoma and updating age models as part of its development of the STEPPS pollen-vegetation model (Dawson et al., Reference Dawson, Paciorek, McLachlan, Goring, Williams and Jackson2016; Goring et al., Reference Goring, Williams, Mladenoff, Cogbill, Record, Paciorek, Jackson, Dietze and McLachlan2016; Kujawa et al., Reference Kujawa, Goring, Dawson, Calcote, Grimm, Hotchkiss and Jackson2016).
Building partnerships with allied resources
In the paleosciences, a distributed network of data resources has emerged, each serving a particular suite of data and research communities: evolutionary biologists, paleoclimatologists, archaeologists, sample and core curators, and so forth. From this perspective, Neotoma is one node among several in what is emerging as a federated ecosystem of complementary and allied data resources. The key need is to interlink these resources through adoption of common standards and data identifiers, so that scientific users can easily gather data from multiple sources.
Initial efforts to interlink resources have been supported by the NSF’s EarthCube program and include the Cyberinfrastructure for Paleogeoscience research coordination network (RCN) and the EarthRates RCN, which have brought together leaders and users of cyberinfrastructure resources in the paleogeosciences to identify priorities for developing common standards and integrative analytical tools. Neotoma belongs to the EarthCube Council of Data Facilities (https://earthcube.org/group/council-data-facilities). One outcome of these collaborations is the Earth Life Consortium (http://earthlifeconsortium.org/), which is building easy-to-adopt APIs that can simultaneously search for data from multiple paleobiological data repositories. We are also working with VertNet (http://vertnet.org/) to send Neotoma data to the Global Biodiversity Information Facility (GBIF, http://www.gbif.org/).
Adding data to Neotoma
Entering, preparing, and validating data for entry into Neotoma requires effort. This effort of data cleaning, validation, and preparation is not unique to Neotoma, of course, and it remains the single largest bottleneck to comprehensive global-scale syntheses of paleoenvironmental data. A great advantage of putting data into Neotoma is that this effort is done just once, and then the data are readily available to multiple groups for multiple data synthesis projects. This unified effort contrasts with the common ad hoc and inefficient system in which multiple groups search for, obtain, and clean the same individual datasets.
Multiple solutions exist to this data ingest barrier, and Neotoma is exploring them all. One ready-to-go solution is to crowdsource it, by encouraging and incentivizing individual scientists to contribute data (e.g., through training workshops, recognition of data stewards, and by supporting scientists’ research objectives). Another solution is to further streamline data input systems that prepare data and metadata in import-ready formats for Neotoma, at the earliest stages of scientific workflows (e.g., building customized import software for data generated from mass spectrometers or for microfossil analysts working at microscopes). A third is to make use of text-mining programs such as GeoDeepDive (Peters et al., Reference Peters, Zhang, Livny and Ré2014, Reference Peters, Husson and Wilcots2017) for help to discover and bring online dark data (Heidorn, Reference Heidorn2008) and automating the discovery of new papers and the particularly routine parts of data entry, such as bibliographic citations. We welcome innovation by others in all of these areas.
Scalability and sustainability
Scalability refers to the ability of Neotoma to grow, both with respect to the size of its data holdings and community of scientific data contributors and users, whereas sustainability refers to the ability of Neotoma to persist over time. The two are closely linked, because in both cases the central solution rests in Neotoma as a resource that both supports community research priorities and is supported by its constituent communities.
With respect to scalability, the key barriers are primarily social, rather than technological. In particular, potential limits to scalability include Neotoma’s emphasis on (1) expert curation to ensure high data quality and utility and (2) Neotoma’s model of community governance and voluntary participation. The former requires both community crowdsourcing and streamlined support tools for data entry, validation, and correction, and the latter means that Neotoma adoption is a voluntary social process, which can be fast or slow. Neotoma is working on the scalability challenge through the mechanisms described in the “Governance and Data Use” and “New Users, Contributors, and Communities” sections.
Sustainability covers multiple dimensions, including guarantees of the long-term preservation of the data housed by Neotoma and sustainability of the development efforts linked to Neotoma. Data sustainability is the easier challenge: Neotoma ensures long-term data sustainability through multiple and redundant mechanisms, including partnerships with multiple organizations and by ensuring that Neotoma and its constituent databases exist in multiple repositories (see “Technical Specifications and Software Ecosystem”). Data sustainability solutions are well developed.
Sustainability of development is the larger challenge. Neotoma development efforts so far have been primarily supported by the U.S. NSF. This reliance on a single funding source is risky, but no clear alternatives yet exist. Ongoing hosting of Neotoma data and data services is cheap, requiring just a few servers, and could be maintained indefinitely, in case of a lapse in funding. The real risk involves sustaining the community of developers who build and update these services. Neotoma’s data are complex, and its infrastructure development relies on individuals with good practical training in both data sciences and paleosciences. This talent pool is very small but growing, and recruitment and retention of this talent remains a persistent challenge.
Community engagement is critical to sustainability because if Neotoma is closely engaged with its data contributors and users, and is seen by the scientific community as vital cyberinfrastructure that facilitates large-scale earth system science, then its prospects improve for continued support, growth, and development. If Neotoma is not serving this mission, then it will (and should) ultimately lapse. Our personal view is that funding agencies need to commit resources to long-term support of mesoscale community cyberinfrastructure efforts such as Neotoma, as they do to other forms of physical scientific infrastructure, contingent on satisfactory demonstration that these efforts are advancing community scientific needs.
One charge for the NLC is to explore multiple funding sources and business models. Because of Neotoma’s commitment to open data, there are no plans to charge users for data access, but other options exist. One is for other national science agencies to support Neotoma’s data ingest and development activities, perhaps through the leadership of individual investigators associated with constituent databases or new data synthesis efforts. A second is to establish a voluntary dues model, perhaps through partnership with professional societies, which traditionally have supported other forms of scientific knowledge dissemination such as peer-reviewed journals. A third is to partner with journals by providing them with a high-quality data archival service that meets community data standards. A fourth is to partner with investigators on data mobilization campaigns that as part of the process include resources for preparing and vetting data sets for upload to Neotoma. A fifth is to work with home universities to establish long-term base support for scientific databases, in line with universities’ mission of discovering and disseminating knowledge, in a role similar to that served by university presses. All these options are viable, and all are being explored.
Although recognizing that uncertainties exist, we are fundamentally optimistic about the long-term persistence, growth, and evolution of Neotoma. Neotoma, through its constituent databases, has supported macroscale research for decades, and it has coalesced and grown organically from the lab-scale data synthesis efforts of individual investigators, to the development of relational database systems, and now to the development of online client-server architectures and the rise of distributed and networked networks of developers and scientists. Neotoma originated in direct response to the scientific objectives of paleoecologists and allied disciplines, and the general challenge of pursuing broadscale science with local-scale data. As data volumes grow, both inside Neotoma (Fig. 6) and outside, community-curated data resources such as Neotoma are, increasingly, foundational infrastructure for big data science.
CONCLUSIONS
The Neotoma Paleoecology Database seeks to advance large-scale paleoecological, biogeographic, and global change research by providing an open, high-quality, and community-curated resource for paleoecological and associated paleoenvironmental data. Sedimentary paleoecological proxy data are expensive to collect, in time and money; Neotoma provides a low-cost solution to data sharing and access via a common platform for many different kinds of paleoecological and associated data. High data quality is achieved through open and distributed scientific governance, based on a distributed network of expert data stewards and associated constituent databases. Neotoma is in a growth stage, with open doors for membership, new data stewards being trained, development of new functional capabilities, extension of the data model to additional data types (e.g., organic biomarkers, stable isotopes), and more data uploaded. At the same time, much more work remains to be done, given the large volumes of paleoecological data worldwide that remain dark, trapped in unstructured publication supplements, spreadsheets on personal computers, or other inaccessible venues, and at high risk of permanent loss. We respectfully encourage other paleoecologists, paleontologists, paleoclimatologists, archaeologists, and allied disciplines to use Neotoma data and software resources as part of their research workflows, to contribute their paleoecological and associated data to Neotoma (or other community-curated resources), and to serve as members, data stewards, taxonomic experts, and on the leadership council. Such service can advance both personal research goals for one’s own region, time, taxonomic group, and questions of interest and broader community goals of open data and enabling large-scale science. Gathering, structuring, and sharing our hard-won data into larger open resources is our community’s big data challenge; community-curated resources such as Neotoma are an essential part of our community’s solution.
Acknowledgments
Neotoma is a community effort, and it relies on the voluntary data contributions made by individual scientists and research groups and on work by data stewards (http://bit.ly/2tzjEsZ) to clean and check these data during and after their submission to Neotoma. We thank them all. Neotoma has been supported by the NSF Geoinformatics (0948652, 0947459, 1550707, 1550717, 1550805, 1550728, 1550716, 1550700, 1550890, 1550721, 1550755) and EarthCube (1541002, 1540994, 1541015, 1540979, 1540977) programs and the Wisconsin Alumni Research Foundation (WARF). Any use of trade, firm, or product names is for descriptive purposes and does not imply endorsement by the U.S. government. Much of this paper was written while JWW was a visiting fellow at Durham University, hosted by the Institute for Advanced Study and Dr. Brian Huntley. This manuscript was improved by comments from Tom Webb, Simon Brewer, and several anonymous reviewers. Scott Farley assisted in figure design and drafting. Neotoma is indebted to the vision and work of early builders of community paleodatabases, including Pat Anderson, Anthony Barnosky, Patrick Bartlein, Richard Bradshaw, Simon Brewer, Paul Buckland, Rachid Cheddadi, Jacques-Louis de Beaulieu, Joel Guiot, Sheila Hicks, Geoff Hope, Brian Huntley, Anne-Marie Lézine, Anatoly Lozhkin, Ernie Lundelius, Vera Markgraf, Pierre Richard, Jon Sadler, and Tom Webb, as well as to all the database coordinators and contributors too numerous to mention. Their vision carries on today.


 Open access