

The concept of glycaemic index (GI) was originally introduced by Jenkins et al. (Reference Jenkins, Wolever and Taylor1). It is a classification of the blood glucose-raising potential of carbohydrate foods. GI is defined as the incremental area under the blood glucose curve of a test food, expressed as the percentage of the response to a reference food consumed by the same subject on a different day(2). When glycaemic responses to meals are investigated, the incremental area under the blood glucose curve of a test meal is divided by the response to a reference food, which is called the relative glycaemic response (RGR) of the test meal.
Since GI was first introduced, many studies have investigated the potential health benefits of a low-GI (LGI) diet, as reviewed by Livesey et al. (Reference Livesey, Taylor and Hulshof3). A high-GI (HGI) meal, digested and absorbed rapidly, initially results in a high glycaemic response and increased need for insulin secretion, followed by a relative hypoglycaemia, increased counter-regulatory hormone secretion and increased serum NEFA concentrations(Reference Ludwig4). The beneficial effects of a LGI meal on postprandial hyperglycaemia and insulin levels have been demonstrated in many studies(Reference Wee, Williams and Tsintzas5–Reference Galgani, Aguirre and Díaz9), but the data on the effects of meals with different GI values on TAG and NEFA responses are limited. A few studies(Reference Galgani, Aguirre and Díaz9, Reference Ludwig, Majzoub and Al-Zahrani10) have shown an increased level of lipid response after a HGI meal, while others have failed to show any lipid differences(Reference Brynes, Edwards and Ghatei11, Reference Kirwan, Cyr-Campbell and Campbell12). To our knowledge, there are only a few studies(Reference Wolever, Bentum-Williams and Jenkins13, Reference Wolever, Campbell and Geleva14) that have assessed the acute effect of physiological characteristics, overweight and glucose tolerance on postprandial glucose, insulin and lipid responses to LGI and HGI meals.
While it is generally recommended that GI test subjects should be healthy(Reference Brouns, Bjorck and Frayn15), many studies have shown no effect of BMI(Reference Wolever, Brand-Miller and Abernethy16–Reference Wolever, Jenkins and Vuksan18), glucose tolerance(Reference Atkinson, Foster-Powell and Brand-Miller19), sex(Reference Wolever, Brand-Miller and Abernethy16, Reference Wolever, Jenkins and Vuksan18), age(Reference Wolever, Brand-Miller and Abernethy16, Reference Wolever, Jenkins and Vuksan18) and ethnicity(Reference Wolever, Brand-Miller and Abernethy16, Reference Wolever, Jenkins and Vuksan18, Reference Henry, Lightowler and Newens20) on the measured GI values. Interestingly, there is little knowledge about the effect of body weight and glucose tolerance on the RGR of the meals.
The primary aim of the present study was to examine the effects of overweight and glucose tolerance on the glucose, insulin and lipid responses to a HGI and LGI meal. Furthermore, the second aim was to study the effect of BMI and glucose tolerance on the RGR of the meals.
Experimental methods
Subjects
We studied twenty-four normal-weight (BMI 20–24·9 kg/m2) and twenty-four overweight (BMI 27·5–34·9 kg/m2) subjects aged 62–72 years. Both groups included twelve subjects with normal glucose tolerance (NGT) and twelve with impaired glucose tolerance (IGT) based on a 75 g, 2 h oral glucose tolerance test, where the 2 h glucose values were < 7·8 and 7·8–11·0 mmol/l, respectively. Exclusion criteria included smoking, milk allergy, regular medication that would have an effect on glucose or lipid metabolism (e.g. antidiabetic drugs, lipid-lowering drugs), gastrointestinal disease influencing absorption or a first-degree family history of diabetes mellitus.
Diet, health and lifestyle data were assessed by questionnaires. The subjects' mean energy intake was calculated on the basis of their BMR, taking into account their daily physical activity(21).
The present study was conducted according to the guidelines laid down in the Declaration of Helsinki, and all procedures involving human subjects were approved by the Ethics Committee of the Hospital District of Helsinki and Uusimaa. Written informed consent was obtained from all subjects.
Postprandial study
The subjects were advised to follow their usual diet during the study. In addition, they were also advised to consume at least 150 g carbohydrates/d during the 3 d before the test mornings. The subjects were not allowed to drink alcohol and were asked to avoid strenuous exercise and sauna for 24 h before each study day. The day before the study day, they were asked to eat an evening meal, in accordance with instructions, that would provide 15 % of the calculated daily energy requirement. The carbohydrate content of the evening meals was 55 % energy. The subjects were also asked to fast for 10–12 h after their standardised evening meal.
In the clinic, body weight was measured. Changes of up to 2 kg in weight were allowed during the study. An intravenous cannula was inserted into an antecubital vein in the forearm, and a finger-prick capillary blood sample (0·5 ml/sample) and an intravenous blood sample (8 ml/sample) were drawn. Thereafter, the subjects consumed the test meal within 10 min. After the start of the meal, finger-prick capillary blood samples were taken at 15, 30, 45, 60, 90 and 120 min, and intravenous blood samples were collected at 30, 60, 120, 180, 240 and 300 min.
Study meals
All subjects consumed two different test meals, a HGI meal (calculated GI 81) and a LGI meal (calculated GI 33), and twice a reference meal, a glucose solution, in randomised order at 1-week intervals. The GI of the study meals was calculated using the recommended method(2), and the GI values of each component of the meals were based on the GI database of the National Institute for Health and Welfare(Reference Similä, Valsta and Virtanen22). The test meals and the reference meal contained 50 g of available carbohydrate. Both the test meals contained the same amount of energy, protein, fat and fibre. The foodstuffs and the nutrient composition of the study meals are shown in Table 1. The energy nutrient contents of the meals were in accordance with the Nordic Nutrition Recommendation(23) and included 55 % energy as carbohydrate, 15 % energy as protein and 30 % energy as fat. All meals were served with a 150 ml drink of the subjects' choice (water, coffee or tea); the selected drink was the same for all test meals. Water was chosen by twelve (three with normal-weight NGT, four with overweight NGT, two with normal-weight IGT and three with overweight IGT), coffee by twenty-seven (eight with normal-weight NGT, five with overweight NGT, six with normal-weight IGT and eight with overweight IGT) and tea by nine (one with normal-weight NGT, three with overweight NGT, four with normal-weight IGT and one with overweight IGT) subjects.
Foodstuffs and energy nutrient content of the test meals

GI, glycaemic index; ACHO, available carbohydrate.
* Whole-grain rye bread (REAL-ruisleipä, Fazer Limited, Vantaa, Finland).
† Flora margarine 70 % (Unilever Limited, Helsinki, Finland).
‡ Edam cheese 24 % (Valio Limited, Helsinki, Finland).
§ Barley porridge prepared with lactose-free (1·5 % fat) milk.
∥ Sweetened by 17 g fructose.
¶ Filtered coffee (Juhlamokka; Gustav Paulig Limited, Helsinki, Finland).
** Instant tea (Lipton Yellow Label; Unilever Limited).
†† Wheat baguette (Fazer Limited).
‡‡ Wheat porridge prepared with water.
§§ Sweetened by 13·5 g glucose.
Chemical composition of the test meals
The chemical composition of the test meals was analysed by AnalyCen Laboratory (Lidköping, Sweden). The protein content of the meals was estimated by the method of Kjeldahl(Reference Eagan, Kirk and Sawyer24) and the fat content by a modified method of Schmid–Bondzynski–Ratzlaff(Reference Croon and Fuchs25). Free sugars (glucose, fructose, lactose, maltose and sucrose) were determined by the Dionex ion chromatograph system, and the starch contents of the test meals were analysed by the modified Åman & Hesselman method(Reference Åman and Hesselman26). Total fibre was analysed by an enzymatic gravimetric procedure (Association of Official Analytical Chemists 45.4.07)(Reference Englyst and Cummings27). The amount of available carbohydrate was calculated as the sum of free sugars and enzymatically available starch.
Laboratory analysis
Capillary blood glucose was analysed directly by using a glucose meter (Glucose 201 meter; HemoCue Limited, Espoo, Finland). The HemoCue Glucose system is based on a glucose dehydrogenase method. The results were automatically converted to express plasma values. A quality-control solution recommended by HemoCue was measured twice every study morning; the CV of these measurements was 1·2 %.
Samples for capillary blood insulin were collected in serum gel tubes (Capiject®; Terumo Sweden AB, Västra Frölunda, Sweden). The samples were clotted 20 min at room temperature and centrifuged for 15 min at 4000 rpm (Rotofix 32; Hettich Zentrifugen, Tuttlingen, Germany). Separated serum was stored at − 70°C until required for analysis. Blood for the determination of serum TAG and NEFA was collected in serum gel tubes (Venosafe™; Terumo Sweden AB). The samples were clotted 10 min at room temperature. Thereafter, samples were transferred to a refrigerator (+4 to +6°C) and allowed to clot for 10 min. Samples were centrifuged as capillary insulin samples, and the separated serum was stored at − 70°C until analysis.
Serum insulin was measured by a microparticle enzyme immunoassay (Abbott Laboratories, Abbott Park, IL, USA) using the Axsym analyser (Abbott Laboratories), and the values are expressed as pmol/l (pmol/l = 7·175 × mU/l). Serum NEFA and TAG measurements were done with the Architect c8000 clinical chemistry analyser (Abbott Laboratories) using an enzymatic colorimetric method (Wako Chemicals, Neuss, Germany) and an enzymatic glycerol-3-phosphate oxidase method (Abbott Laboratories), respectively. During the course of the study, the mean CV of the different control levels between days for insulin, NEFA and TAG measurements were 6·8 (sd 0·7), 1·8 (sd 0·2) and 1·4 (sd 0·5) %, respectively. Fasting total cholesterol at baseline was analysed using an enzymatic method (Abbott Laboratories).
Statistical analysis
The 2 h incremental area under the glucose and insulin response curve (IAUC), the 5 h incremental area under the TAG response curve and the incremental area over the NEFA response curve were calculated using a trapezoidal method for each test meal(2). The RGR of the meals was calculated from the 2 h incremental glucose area using glucose as a reference.
Individual RGR values >2 standard deviations from the mean were excluded from the results of the test meals according to the same standard praxis compared with the GI value measurement(Reference Wolever, Brand-Miller and Abernethy16). Therefore, two RGR values were excluded for each test meal. Insulin curves that included at least one strongly haemolysed serum sample or more than two mildly haemolysed serum samples were excluded from the analysis. Only two insulin curves were excluded from the statistical analysis. Insulin resistance was measured by the homeostasis model assessment of insulin resistance, and it was calculated as described by Matthews et al. (Reference Matthews, Hosker and Rudenski28).
The independent sample t test with Bonferroni's corrections was used for testing the differences between study groups. Insulin responses were non-normally distributed; statistical significance was therefore assessed by using the non-parametric Wilcoxon test. All statistical analyses were done using SPSS for Windows version 15.0 (SPSS Inc., Chicago, IL, USA). The level of significance was P < 0·05. Results are expressed as means with their standard errors or standard deviations.
Results
Subjects' characteristics
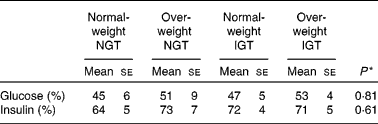
Baseline characteristics of the subjects are illustrated in Table 2. Fasting serum glucose, TAG and NEFA levels did not differ between the groups, whereas fasting insulin levels (P < 0·001) and the homeostasis model assessment of insulin resistance (P < 0·001) were significantly higher among overweight subjects with IGT than among normal-weight subjects with NGT.
(Mean values and standard deviations)

NGT, normal glucose tolerance; IGT, impaired glucose tolerance; HOMA-IR, homeostasis model assessment of insulin resistance.
* Mean values were significantly different from those of the normal-weight NGT group (P < 0·001).
† A 2 h oral glucose tolerance test result.
Glucose and insulin responses
Mean glucose concentrations during the 2 h after the LGI and HGI meals are shown in Fig. 1, and the postprandial responses expressed as IAUC are shown in Table 3. Overweight subjects with NGT had a similar 2 h glucose IAUC to normal-weight subjects with NGT after both the LGI and HGI meals, whereas among subjects with IGT, the 2 h glucose IAUC after the test meals were significantly greater than that among normal-weight subjects with NGT (Table 3). The LGI meal produced a glucose response that was significantly smaller – about half – than that for the HGI meal among all of the study groups (P < 0·001; Table 4). Neither did the BMI nor the glucose tolerance had a significant effect on the RGR of the meals (Table 3). The mean RGR for the HGI meal was 74, and that for the LGI meal was 36.
Mean responses in plasma glucose after the consumption of (a) the low-glycaemic index (GI) meal, (b) the high-GI meal and (c) the glucose standard solution in normal-weight subjects with normal glucose tolerance (NGT; -—○—, n 12); overweight subjects with NGT (—●—, n 12); normal-weight subjects with impaired glucose tolerance (IGT; - -△- -, n 12); overweight subjects with IGT (- -▲- -, n 12).

(Mean values with their standard errors, n 12)

NGT, normal glucose tolerance; IGT, impaired glucose tolerance.
* Mean values were significantly different from the high-GI meal (P < 0·001).
† Differences from the normal-weight NGT group.
‡ n 10.
§ n 11.
(Mean values with their standard errors)
NGT, normal glucose tolerance; IGT, impaired glucose tolerance.
* Differences between the groups (statistical differences tested by ANOVA).
When comparing the 2 h insulin responses of the meals between normal-weight subjects with NGT and the other study groups, only the insulin responses of the overweight subjects with IGT differed significantly (Table 3). The LGI meal produced smaller insulin responses than the HGI meal in all of the study groups (P < 0·001; Fig. 2 and Table 3). After the LGI meals, the insulin IAUC was about 30–40 % lower than the insulin IAUC after the HGI meals (Table 4). The HGI meal increased the postprandial glucose and insulin responses in the same ratio among normal-weight and overweight subjects with NGT or IGT (Table 4).
Mean responses in serum insulin after the consumption of (a) the low-glycaemic index (GI) meal and (b) the high-GI meal in normal-weight subjects with normal glucose tolerance (NGT; —-○—, n 12); overweight subjects with NGT (—●—, n 10); normal-weight subjects with impaired glucose tolerance (IGT; - -△- -, n 12); overweight subjects with IGT (- -▲- -, n 12).

TAG and NEFA responses
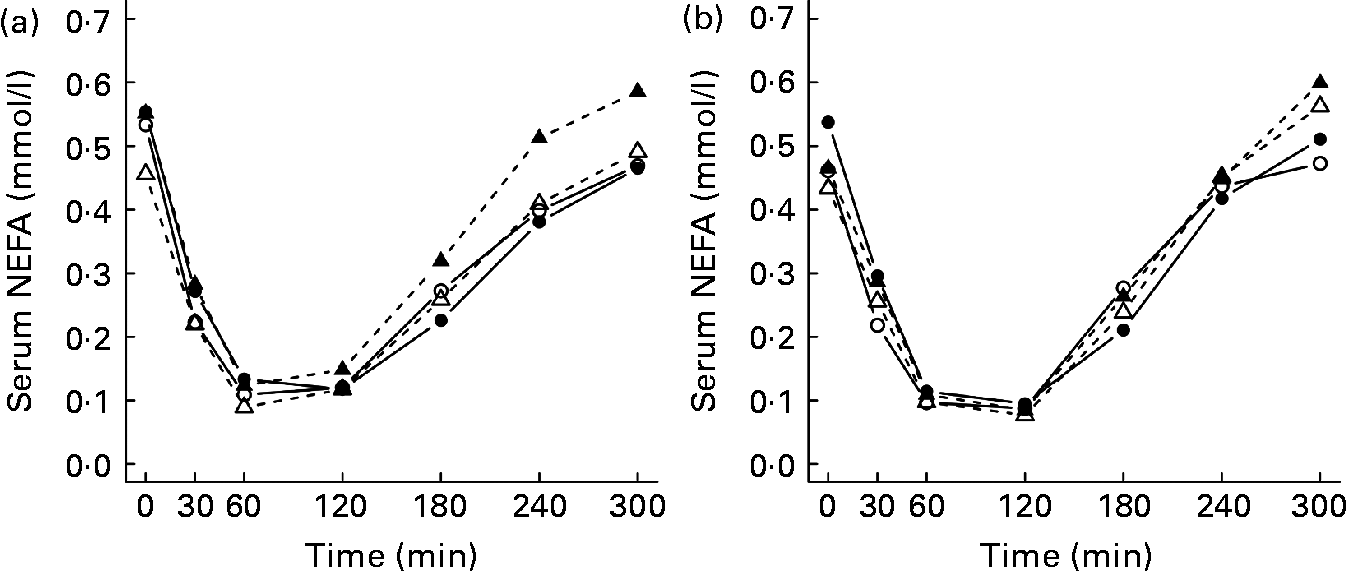
The mean TAG and NEFA postprandial responses during 5 h after the test meals are presented in Table 3. The TAG responses were higher after the LGI meal than after the HGI meal in all of the study groups (P < 0·001), but no statistically significant differences were observed between the groups (Table 3 and Fig. 3). After the test meals, NEFA concentration decreased and reached the nadir within 1–2 h (Fig. 4). The GI values of the meals or the study group had no significant effect on the NEFA responses (Table 3).
Mean responses in serum TAG after the consumption of (a) the low-glycaemic index (GI) meal and (b) the high-GI meal in normal-weight subjects with normal glucose tolerance (NGT; —○—, n 12); overweight subjects with NGT (—●—, n 12); normal-weight subjects with impaired glucose tolerance (IGT; - -△- -, n 12); overweight subjects with IGT (- -▲- -, n 12).

Mean responses in serum NEFA after the consumption of (a) the low-glycaemic index (GI) meal and (b) the high-GI meal in normal-weight subjects with normal glucose tolerance (NGT; —○—, n 12); overweight subjects with NGT (—●—, n 12); normal-weight subjects with impaired glucose tolerance (IGT; - -△- -, n 12); overweight subjects with IGT (- -▲- -, n 12).
Discussion
In the present study, we investigated the influence of overweight and glucose tolerance on the postprandial glucose, insulin, TAG and NEFA responses to the HGI and LGI meals. In addition, we studied the effect of the test subjects' BMI and glucose tolerance on the RGR of the meals. As expected, the glucose responses of normal-weight subjects with NGT differed after the consumption of the LGI and HGI meals from the responses of the subjects with IGT. This result is consistent with those of an earlier study(Reference Wolever, Chiasson and Hunt17). We also observed that when overweight and IGT occurred together, they had an impact on the insulin responses. The higher degree of insulin resistance among these subjects probably explains the higher insulin responses. This is in line with earlier studies that have shown a higher postprandial insulin response in overweight subjects than in subjects of normal weight(Reference Jensen, Bysted and Dawids29, Reference Umpaichitra, Banerji and Castells30). In the present study, we did not observe significant differences in insulin responses between normal-weight and overweight subjects with NGT. This may be due to the large variation of insulin responses in overweight subjects.
In line with previous studies, we found that the LGI meal produced a glucose response that was about 50 % lower than that of the HGI meal and an insulin response that was 30–40 % lower than that produced by the HGI meal(Reference Wee, Williams and Tsintzas5–Reference Galgani, Aguirre and Díaz9). Elevated postprandial glucose and insulin levels have been shown to have harmful effects on small and large blood vessels(Reference Rendell and Jovanovic31). Our findings therefore suggest that the LGI meal is more beneficial in preventing elevated postprandial glucose and insulin levels than the HGI meal. The subjects' physiological characteristics did not modify the results. Thus, the HGI meal increased the postprandial responses at the same ratio among normal-weight and overweight subjects with NGT or IGT.
In the present study, the test meals were served with a drink of the subjects' choice (water, coffee or tea). Caffeine in coffee and tea may increase the glucose responses(Reference Moisey, Kacker and Bickerton32–Reference Moisey, Robinson and Graham35) and decrease insulin sensitivity(Reference Moisey, Kacker and Bickerton32). However, in our previous study, coffee modified postprandial glucose and insulin responses only modestly (unpublished results), an observation that is consistent with the study of Aldughpassi & Wolever(Reference Aldughpassi and Wolever36). Therefore, it is unlikely that the drink served influenced the results.
In the present study, neither the subjects' BMI nor their glucose tolerance affected the RGR of the test meals, although the glucose responses were higher among subjects with IGT than among subjects with NGT. The present results are in line with previous studies where BMI(Reference Wolever, Brand-Miller and Abernethy16–Reference Wolever, Jenkins and Vuksan18), glucose tolerance(Reference Atkinson, Foster-Powell and Brand-Miller19), sex(Reference Wolever, Brand-Miller and Abernethy16, Reference Wolever, Jenkins and Vuksan18), age(Reference Wolever, Brand-Miller and Abernethy16, Reference Wolever, Jenkins and Vuksan18) and ethnicity(Reference Wolever, Brand-Miller and Abernethy16, Reference Wolever, Jenkins and Vuksan18, Reference Henry, Lightowler and Newens20) did not have a major effect on the GI values of foods.
Overweight is typically associated with a pattern of dyslipidaemia characterised by elevated levels of fasting and postprandial TAG and NEFA levels(Reference Jensen, Bysted and Dawids29, Reference Umpaichitra, Banerji and Castells30). In the present study, however, neither fasting concentrations nor postprandial responses of TAG and NEFA differed between normal-weight and overweight subjects. Because the previous day's eating and alcohol consumption modify TAG concentrations, and therefore daily variations in fasting TAG levels are common(Reference Lairon, Lopez-Miranda and Williams37), in the present study, the subjects were asked to follow their usual diet during the study, and they were not allowed to drink alcohol for 24 h before each study day. In addition, they were advised to eat a standardised evening meal preceding the study day. In the present study, the intra- and inter-individual variation of fasting TAG concentrations were modest. Only two subjects had a 1 mmol/l difference in fasting TAG concentrations between the test meals. These modest variations may have had an impact on the results.
Ingestion of the LGI meal resulted in elevated TAG levels in comparison with the HGI meal, which was not expected. It has been proposed that LGI meals have a beneficial effect on postprandial TAG responses(Reference Harbis, Perdreau and Vincent-Baudry6). There are, however, studies that have not detected any effect of the GI of meals on postprandial TAG levels(Reference Brynes, Edwards and Ghatei11, Reference Wolever, Bentum-Williams and Jenkins13). In the present study, the fructose-sweetened juice may explain the higher TAG responses after the LGI meal. This finding is consistent with an earlier postprandial study(Reference Jeppesen, Chen and Zhou38). The harmful effect of fructose consumption may be caused by its ability to induce hepatic de novo lipogenesis and thus TAG production(Reference Laville and Nazare39). It is, however, unknown whether small amounts of fructose, such as 17 g in our LGI meal, can induce higher postprandial TAG responses(Reference Livesey and Taylor40).
It has been suggested that after the glucose peak of the HGI meal, the glucose level decreases below the fasting level, which in turn causes an increased secretion of counter-regulatory hormones, e.g. cortisol and adrenalin. Counter-regulatory hormones stimulate the release of NEFA from adipose tissue and thus increase NEFA concentrations(Reference Ludwig4). Previous studies have replicated these findings in young lean and obese subjects(Reference Ells, Seal and Kettlitz7, Reference Ludwig, Majzoub and Al-Zahrani10). In addition, Wolever et al. (Reference Wolever, Bentum-Williams and Jenkins13) have shown that the GI and amount of carbohydrate of the meal have an effect on NEFA responses. However, in the present study, the GI of the test meals did not have a significant effect on the NEFA responses. Therefore, our findings are in agreement with previous studies(Reference Harbis, Perdreau and Vincent-Baudry6, Reference Brynes, Edwards and Ghatei11, Reference Kirwan, Cyr-Campbell and Campbell12, Reference Backhouse, Williams and Stevenson41), suggesting that the GI of a meal has little or no effect on postprandial NEFA responses.
In conclusion, the present study shows that postprandial glucose responses are affected only by glucose tolerance, whereas overweight and IGT occurring simultaneously have an impact on insulin responses. Overweight and glucose tolerance do not have an effect on postprandial lipid responses. The present study confirms that the LGI meal causes lower postprandial glucose and insulin responses than the HGI meal. The LGI meal may cause higher TAG responses, especially when the meal contains fructose. The subjects' physiological characteristics do not modify these effects. The RGR of the meals does not differ between normal-weight and overweight subjects with NGT or IGT.
Acknowledgements
We thank the volunteers for participating in the postprandial study, Heikki Pakkala and Sigrid Rosten for assisting with the technical aspects of the study, Laura Lund and Elina Rintala for assistance in sampling and laboratory analysis, Sheryl Hinkkanen for language editing. The present study was supported by grants from Academy of Finland (111420), Juho Vainio Foundation, the National Institute for Health and Welfare and the Finnish Graduate School on Applied Bioscience. The contribution of each author was as follows: M.-M. P. wrote the first draft of the manuscript, carried out the postprandial studies and did the statistical analysis. M.-M. P., K. A. H., J. V., J. G. E. and L. M. V. contributed to the conception and design of the study. J. S. was responsible for the analysis of the blood samples. H. K. S. supervised the statistical analysis. M.-M. P., K. A. H., J. V., J. G. E. and L. M. V. participated in the writing of the final draft of the manuscript. All authors contributed to the critical revision of the manuscript. The authors had no conflicts of interest.


