

In Canada, approximately 30 % of children are overweight or obese (OW/OB), representing more than a doubling in prevalence over the past three decades( Reference Raine 1 , Reference Tremblay, Katzmarzyk and Willms 2 ). Children who are OW/OB are at increased risk for serious long-term health complications including insulin resistance, type 2 diabetes, vascular disease, osteoarthritis and various forms of cancers( Reference Raine 1 , Reference Must and Strauss 3 , Reference Grotle, Hagen and Natvig 4 ). In order to optimize child health and to reduce financial burden associated with the treatment of OW/OB-related complications, prevention and treatment of OW/OB should become public health priorities( Reference McKinnon, Orleans and Kumanyika 5 , Reference Lobstein, Baur and Uauy 6 ).
Diet is a major determinant of childhood OW/OB( Reference McKinnon, Orleans and Kumanyika 5 ). The main source of information for healthy eating in Canada is the Eating Well with Canada's Food Guide (CFG), the primary objective of which is the maintenance of population health( 7 , 8 ). Another widely referenced diet, albeit within clinical settings, is the Dietary Approaches to Stop Hypertension (DASH) diet, an initiative of the National Heart, Lung, and Blood Institute( 9 , Reference Sacks, Obarzanek and Windhauser 10 ). The primary purpose of the DASH diet is the treatment and management of hypertension( 9 ). Neither CFG nor the DASH diet has been designed exclusively for the prevention and/or treatment of OW/OB. However, since adherence to the DASH diet has been linked in adults to improved body weight and decreased hypertension( Reference Azadbakht, Fard and Karimi 11 , Reference Svetkey, Simons-Morton and Vollmer 12 ), a common complication of OW/OB( 13 ), it is hypothesized that the DASH diet may be more effective in reducing OW/OB than CFG. Aside from the DASH diet's focus on reduced sodium intake( 9 ), its emphasis on fruit and vegetable intake( Reference Bes-Rastrollo, Martinez-Gonzalez and Sanchez-Villegas 14 – Reference Sartorelli, Franco and Cardoso 16 ) may reduce hypertension via a reduction in weight. Despite the pressing concerns of childhood OW/OB, few studies have assessed the impact of following the CFG recommendations and the DASH diet on measures of adiposity in youth. The aim of the present study was to assess how conformity to the recommendations of each of these diets was associated with BMI, waist-to-height ratio (WHtR), waist-to-hip ratio (WHR), waist girth (WG), hip girth (HG) and risk of OW in peri-adolescent boys and girls.
Methods
Data were collected between September 2007 and June 2008 on 2304 children recruited from schools within the Niagara region. After cleaning for missing information related to the present study, data on a total of 1570 (68·1 %) children (mean age 12·39 (sd 0·33) years; 782 girls; 788 boys) were available for analysis. Prior to data collection, ethics approval was obtained from Brock University's Research Ethics Board and the District School Board of Niagara's Research Committee.
Body composition was assessed during school hours by trained research assistants using standard protocols. Participants wore clothing required for light physical activity (PA) and no footwear. Weight and height were measured using a Tanita electronic weight scale and a Seca portable stadiometer, respectively. WG was measured at the umbilicus and HG was measured around the widest portion of the buttocks using a flexible measuring tape. Each measure was recorded three times and the average of these three measures was calculated. All values were recorded to the nearest 0·1 kg or 0·1 cm. Weight, height, WG and HG were used to calculate BMI, WHtR and WHR. Students were categorized into OW or non-OW groups using gender- and age-specific BMI cut-offs( Reference Cole, Bellizzi and Flegal 17 ).
The degree to which children's diets conformed to the recommendations of CFG and the DASH diet were quantified using two indices that were calculated based on responses provided to the Youth/Adolescent Questionnaire (YAQ), an FFQ previously validated for use in peri-adolescent children( Reference Rockett, Wolf and Colditz 18 , Reference Rockett, Breitenbach and Frazier 19 ). The YAQ was administered and completed in participants’ classrooms during regular school hours.
The DASH index was derived using methods described previously( Reference Gunther, Liese and Bell 20 – Reference Liese, Schulz and Moore 22 ). The CFG index was derived using a method tailored to the specifications of the CFG. In brief, each response to the YAQ was categorized into one of the eight food groups (fruits, vegetables, grains, dairy, meat/fish/eggs, legumes/nuts/seeds, oils/fats, sweets) for the calculation of the DASH index or one of six food groups (vegetables/fruits, grain products, milk alternatives, meat alternatives, oils/fats, sweets) for the calculation of the CFG index. For each food group, a maximum score of 10 was assigned if the recommended intake was met according to the CFG and the DASH diet. Intakes below the recommended level were scored proportionally less. For food groups where a lower intake was recommended, reverse scoring was applied and a score of 0 was assigned for intakes ≥200 % of the upper recommended limit. The scores of each food group were summed to produce final CFG and DASH indices, where a higher index was indicative of greater conformity to the dietary recommendations of the CFG and the DASH diet, respectively. For a more detailed explanation of how each index was calculated, refer to Supplementary Materials.
The covariates assessed in the present study included gender, age, total PA and age to peak height velocity (aPHV). Gender and date of birth were self-reported. Age was calculated using date of birth. Total PA was a scored self-report measure derived from responses provided to the Participation Questionnaire (PQ)( Reference Hay 23 ). aPHV, a gender-specific measure of maturity, was calculated using the anthropometric measures that were collected by the trained research assistants, as per the methods of Mirwald et al.( Reference Mirwald, Baxter-Jones and Bailey 24 ). As with all of the other variables of interest, data on covariates were collected from participants during regular school hours.
Early life experience data were collected on a sub-sample of children. Birth order (1 v. >1) was assessed as part of the PQ and maternal BMI (derived from self-reported weight and height), maternal education (≤high school v. ≥college) and family living status (single- v. two-parent household) were assessed using a parental questionnaire that was sent home with each participant and returned to the school upon completion. Of the 1570 children available for the main analyses, 616 children (321 boys; 295 girls) had no missing information of early life experiences and were available for the sub-sample analyses.
Analyses were performed using the SAS statistical software package version 9·2 (SAS Institute Inc., Cary, NC, USA). Differences in means/proportions were tested between boys and girls using Student t tests and Fisher exact tests. Multivariable linear and logistic regression analyses were used to assess the relationship between the CFG and DASH indices and BMI, WHtR, WHR, WG, HG and risk of OW. Three models were implemented in all analyses. Model 1 was unadjusted, Model 2 was adjusted for aPHV and Model 3 was further adjusted for total PA. A fourth model was conducted for the sub-sample of children on whom early life experience data were collected. In addition to adjusting for aPHV and total PA, this model was further adjusted for birth order, maternal BMI, maternal education and family living status.
Results
Approximately 29 % of girls and 32 % of boys were classified as OW. Boys were slightly older, less mature and had larger WHtR, WHR and WG and smaller HG compared with girls (Table 1).
Characteristics of the boys and girls who were recruited from schools within the Niagara region and assessed between September 2007 and June 2008
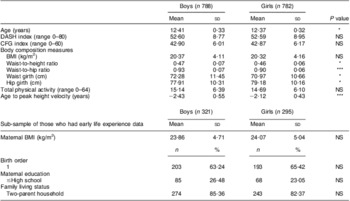
DASH, Dietary Approaches to Stop Hypertension; CFG, Canada's Food Guide.
P values were calculated for continuous variables using the Student t test and for categorical variables using the Fisher exact test: *P < 0·05, **P < 0·001, ***P < 0·0001.
In girls, all models, except for Model 4, showed that the CFG index was negatively associated with WHtR, WHR and WG (the parameter estimates from Model 3 were b = −0·001, 95 % CI −0·002, −0·0004 for WHtR, b = −0·001, 95 % CI −0·002, −0·001 for WHR and b = −0·18, 95 % CI −0·30, −0·07 for WG). Although in girls a higher CFG index was also associated with decreased BMI (Models 1 and 2), decreased HG (Model 1) and decreased risk of OW (Model 1), these associations were not observed after further adjustment. In boys, no associations were observed between the CFG index and measures of body composition or risk of OW (Tables 2 and 3).
Results of regression models of the CFG index v. measures of body composition in the boys and girls who were recruited from schools within the Niagara region and assessed between September 2007 and June 2008Footnote †
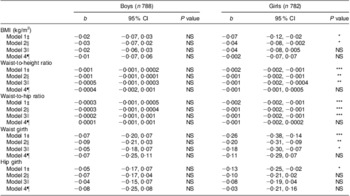
CFG, Canada's Food Guide.
* P < 0·05, **P < 0·001, ***P < 0·0001.
† Multiple linear regression analyses were conducted using SAS version 9·2 (SAS Institute Inc., Cary, NC, USA). The parameter estimate (b) represents the change in the body composition variable per one unit increase in the CFG index.
‡ Model 1: unadjusted.
§ Model 2: adjusted for age to peak height velocity (aPHV).
∥ Model 3: adjusted for aPHV and total physical activity.
¶ Model 4: analysis on a sub-sample of children for whom early life experience data were available (321 boys; 295 girls). Model was adjusted for aPHV, total physical activity, birth order, parental BMI, parental education and marital status.
Odds ratios (95 % confidence intervals) of overweight for tertile of the CFG index in the boys and girls who were recruited from schools within the Niagara region and assessed between September 2007 and June 2008Footnote †
CFG, Canada's Food Guide; T1, tertile 1; T2, tertile 2; T3, tertile 3.
† BMI was used to model the probability of overweight. BMI cut-offs were age- and gender-specific and corresponded to the widely used cut-off point of 25 kg/m2 for adult overweight(17). T1 of the CFG index was used as the reference group in the logistic regression model where T1 < 40, T2 ≥ 40 < 46 and T3 ≥ 46. All analyses were conducted using SAS version 9·2 (SAS Institute Inc., Cary, NC, USA).
‡ Model 1: unadjusted.
§ Model 2: adjusted for age to peak height velocity (aPHV).
∥ Model 3: adjusted for aPHV and total physical activity.
¶ Model 4: analysis on sub-sample of children for whom early life experience data were available (321 boys; 295 girls). Model was adjusted for aPHV, total physical activity, birth order, parental BMI, parental education and marital status.
Similarly, the DASH index in girls was negatively associated with BMI (b = −0·07, 95 % CI −0·10, −0·04), WHtR (b = −0·001, 95 % CI −0·002, −0·001), WHR (b = −0·001, 95 % CI −0·002, −0·001), WG (b = −0·24, 95 % CI, −0·31, −0·16), HG (b = −0·15, 95 % CI −0·23, −0·07) and odds of OW (OR = 0·70, 95 % CI 0·56, 0·87) after adjustment for aPHV and total PA (Model 3). These associations remained even after further adjustment for the early life experience data that were collected on the sub-sample of children (Model 4), except for HG and odds of OW for which the P values did not reach statistical significance. In boys, however, a higher DASH index was also associated with lower values of BMI (b = −0·05, 95 % CI −0·08, −0·02), WHtR (b = −0·001, 95 % CI −0·002, −0·0004), WHR (b = −0·001, 95 % CI −0·001, −0·00004), WG (b = −0·15, 95 % CI −0·24, −0·07) and HG (b = −0·12, 95 % CI −0·19, −0·04) and lower odds of OW (OR = 0·76, 95 % CI 0·62, 0·93) after adjustment for aPHV and total PA (Model 3). With further adjustment for early life experiences, the association between a higher DASH index and a lower WG and lower odds of OW remained (Tables 4 and 5).
Results of regression models of the DASH index v. measures of body composition in the boys and girls who were recruited from schools within the Niagara region and assessed between September 2007 and June 2008Footnote †
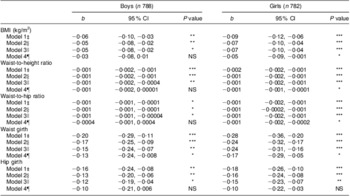
DASH, Dietary Approaches to Stop Hypertension.
* P < 0·05, **P < 0·001, ***P < 0·0001.
† Multiple linear regression analyses were conducted using SAS version 9·2 (SAS Institute Inc., Cary, NC, USA). The parameter estimate (b) represents the change in the body composition variable per one unit increase in the DASH index.
‡ Model 1: unadjusted.
§ Model 2: adjusted for age to peak height velocity (aPHV).
∥ Model 3: adjusted for aPHV and total physical activity.
¶ Model 4: analysis on sub-sample of children for whom early life experience data were available (321 boys; 295 girls). Model was adjusted for aPHV, total physical activity, birth order, parental BMI, parental education and marital status.
Odds ratios (95 % confidence intervals) of overweight for tertile of the DASH index in the boys and girls who were recruited from schools within the Niagara region and assessed between September 2007 and June 2008Footnote †
DASH, Dietary Approaches to Stop Hypertension; T1, tertile 1; T2, tertile 2; T3, tertile 3.
† BMI was used to model the probability of overweight. BMI cut-offs were age- and gender-specific and corresponded to the widely used cut off-point of 25 kg/m2 for adult overweight(17). T1 of the DASH index was used as the reference group in the logistic regression model where T1 < 48, T2 ≥ 48 < 56 and T3 ≥ 56. All analyses were conducted using SAS version 9·2 (SAS Institute Inc., Cary, NC, USA).
‡ Model 1: unadjusted.
§ Model 2: adjusted for age to peak height velocity (aPHV).
∥ Model 3: adjusted for aPHV and total physical activity.
¶ Model 4: analysis on sub-sample of children for whom early life experience data were available (321 boys; 295 girls). Model was adjusted for aPHV, total physical activity, birth order, parental BMI, parental education and marital status.
Discussion
The findings of the present study indicate that a higher CFG index derived from the YAQ was associated with reduced WHtR, WHR and WG in girls only; whereas a higher DASH index was associated with reduced BMI, WHtR, WHR, WG and HG and lower odds of OW in both girls and boys. In the analyses conducted on the sub-sample of children for whom early life experience data were available, the findings were similar. No association was observed between the CFG index and measures of adiposity after full adjustment in either girls or boys. A higher DASH index was, however, associated with reduced WG and reduced risk of OW in boys and with reduced BMI, WHtR, WHR and WG in girls. The results of both the main and the sub-sample analyses suggest that although adherence to the CFG is associated with certain measures of adiposity for girls, adherence to the DASH diet may be an effective means by which to reduce the risk of OW in both peri-adolescent boys and girls.
To our knowledge, the present study is the first one to assess how conformity to the recommendations of both CFG and the DASH diet are associated with measures of body composition in a sample of youth from a school-based population. Two previous studies assessed the role of adherence to the DASH diet on measures of adiposity in a sample of youth with diabetes( Reference Gunther, Liese and Bell 20 , Reference Liese, Bortsov and Gunther 25 ). Neither study found an association between adherence to the DASH diet and measures of adiposity, although one of the studies did report that a higher adherence to the DASH diet was associated with a better lipid profile( Reference Liese, Bortsov and Gunther 25 ). The lack of association between adherence to the DASH diet and measures of adiposity in these studies may have been a consequence of their sample being youths with diabetes – a population in which OW and obesity are highly prevalent( Reference Liu, Lawrence and Davis 26 ).
Conformity to the DASH diet may have been associated with more measures demonstrating decreased adiposity than conformity to the CFG due to the DASH diet's greater emphasis on fruit and vegetable intake. The DASH diet recommends four to five servings of fruit daily and four to five servings of vegetables daily (total of eight to ten servings), at an energy intake level of 8368 kJ/d (2000 kcal/d)( 9 ), which is close to the average energy intake of our population (9037 kJ/d (2160 kcal/d)). In contrast, CFG recommends six servings of fruits and/or vegetables daily for children aged 9 to 13 years( 8 ). Thus, those whose diets more closely conform to recommendations of the DASH diet may consume between two and four servings of fruits and vegetables more daily than those whose diets more closely conform to the recommendations of CFG. The hypothesis that the observed disparity between CFG and the DASH diet may be a result of the differences in the recommendations that each makes regarding the consumption of fruits and vegetables is supported by the findings of past studies, which have shown that increased consumption of fruits and vegetables is associated with decreased measures of adiposity( Reference Bes-Rastrollo, Martinez-Gonzalez and Sanchez-Villegas 14 – Reference Sartorelli, Franco and Cardoso 16 ). Foods high in soluble and insoluble fibre, such as fruits and vegetables, have been shown to reduce the risk of OW by being less energy dense than a comparable volume of food containing little or no dietary fibre( Reference Slavin 27 , Reference van Dam and Seidell 28 ), by increasing satiety( Reference Raben, Christensen and Madsen 29 ), by decreasing the intestinal absorption of fat( Reference Slavin 27 , Reference Heaton 30 ) and/or by decreasing the intestinal absorption of carbohydrates which prevents sharp increases in postprandial insulin and thereby limits the storage of fat( Reference Brennan 31 ). In light of these findings, CFG may be able to enhance its ability to reduce the risk of OW in peri-adolescence by increasing the recommended intake of fruits and vegetables.
Given that CFG and the DASH diet were designed for the maintenance of population health( 7 ) and for the management of hypertension in adults( 9 ), respectively, rather than for the management of body weight in children, caution must be taken before existing food guidelines are modified. Indeed, more research is required before either diet is prescribed to children as a means of managing body weight. Specifically, it is suggested that prospective studies be conducted to determine if adherence to either diet will reduce adiposity and/or prevent OW. In terms of the DASH diet, because it was designed specifically for use in adults, before it is used as a method of preventing or treating OW in children, studies will need to be conducted in order to verify that it meets the dietary needs of a growing population. Furthermore, even after the value of the diet in managing body weight is established and the adequacy of meeting the dietary needs of children is verified, before the DASH diet is used by public health policy makers to make dietary recommendations, it is suggested that the presentation of the dietary recommendations be tailored to the target population. For example, in order to increase the amenability of the DASH diet to adolescents, presenting the recommended daily intakes of each food group by age category, as is done by CFG, rather than by estimated daily energy requirements may be of value.
In addition, there are several limitations to the present study. First, due to the cross-sectional study design, conclusions regarding causation cannot be drawn. Second, many parents did not return the parental questionnaire resulting in a dramatic drop in sample size from the main analysis to the sub-sample analysis. Although there were no major differences between those who were included in the sub-sample analysis and those who were not in terms of the main characteristics, because those who were included reported being slightly more physically active and had slightly smaller BMI, WHtR, WG and HG measures, the sub-sample results may underestimate the true association. There are several strengths of the study including that the sample was from a school-based population, dietary data were collected using a validated questionnaire, and body composition was assessed by trained research assistants.
Conclusion
The results of the present study indicate that diets that conform to the recommendations of CFG are associated with reduced measures of adiposity among girls; whereas diets that conform to recommendations of the DASH diet are associated with reduced measures of adiposity among girls and boys. These findings suggest that following the DASH diet may prevent OW in peri-adolescents. Before the DASH diet is prescribed to peri-adolescents as a means of preventing and/or treating OW, however, prospective research is needed to verify that adherence to the diet will reduce adiposity and/or prevent OW and that the diet will also meet the dietary needs of a growing population.
Acknowledgements
The study was funded by the Canadian Institutes of Health Research (grant number: 171577) and the Social Sciences and Humanities Research Council of Canada (grant number: 410-2007-1770). There are no conflicts of interest. All authors contributed substantially to the conception and design of the study, the acquisition, analysis and interpretation of data, have drafted the article or revised it critically for important intellectual content. The authors would like to thank the District School Board of Niagara, students and their parents for their support of the study.
Supplementary Materials
For Supplementary Materials for this article, please visit http://dx.doi.org/10.1017/S1368980012001024


