


1. Introduction
The convection configuration considered in this paper has emerged from the study of radiatively driven convection in ice-free Lake Superior. During springtime warming of this freshwater lake, observational data in Austin (Reference Austin2019) appear to show that an instability arises each day near the surface and carries heat through the entire water column on a time scale of hours. The temperature of the lake is between approximately  $0\,^\circ \text {C}$ and $4\,^\circ \text {C}$, which means that the water is in the anomalous regime where increasing temperature increases rather than decreases density.
The instability can be understood physically as follows. Observations show that the water column begins the day at a uniform temperature throughout. As the sun comes up, radiative heating penetrates into the water column, with the heating concentrated near the surface and falling off exponentially with depth. Because the water is in the anomalous regime where temperature increase leads to density increase, heating at the surface increases the density of the water there. Buoyancy then causes the denser water to sink. If the buoyancy effects outweigh the restraining effects of heat diffusion and viscosity, then an instability arises. In many bodies of water, radiative heating penetrates into only a small fraction of the water column, and here we therefore treat the limit of radiative heating confined to an infinitesimally small layer near the surface, meaning that we specify a time-varying heat flux at one of the boundaries rather than including a radiative source term in the governing equations. The two infinite surfaces with heat flux imposed at one boundary and temperature imposed at the other makes this essentially a Rayleigh–Bénard (RB) configuration, but with an imposed flux that is modulated in time rather than an imposed steady temperature difference.
Most previous work has considered modulation on top of a background temperature gradient. Here, we treat modulation with zero mean, meaning that the average of the temperature difference between the top and bottom surfaces is zero for the unperturbed base state. With zero-mean modulation, if the amplitude of the boundary heat-flux modulation is set to zero, then nothing interesting happens as the water column is stably stratified from gravity and uniform in temperature. Only with a non-zero modulation amplitude is there a possibility for an unstable configuration.
The linear stability of modulated convection has been studied in earnest since at least Gershuni & Zhukhovitskii (Reference Gershuni and Zhukhovitskii1963), who looked at the low-frequency limit of modulated temperature gradient in standard RB convection. Just as temperature boundary conditions were considered first in standard RB convection, temperature modulation was considered first for modulated RB convection. In particular, the combination of no-stress velocity conditions and imposed temperature boundary conditions allows an analytical solution in terms of sine functions to be obtained, which was the approach taken in Venezian (Reference Venezian1969), where the amplitude of modulation of the boundaries in standard RB convection was taken as a small parameter.
These were followed by a number of studies on the linear stability of modulated convection. Few authors, however, addressed zero-mean modulation, with the exception of Yih & Li (Reference Yih and Li1972), Gershuni & Zhukhovitskii (Reference Gershuni and Zhukhovitskii1976), Or & Kelly (Reference Or and Kelly1999) and Souhar & Aniss (Reference Souhar and Aniss2016). These authors investigated boundary temperature modulation, but no one appears to have addressed boundary heat-flux modulation. Davis (Reference Davis1976) reviewed the stability (linear and nonlinear) of a variety of time-periodic flows, including thermal instabilities, but did not explicitly mention zero-mean modulated flow or heat-flux modulation.
In addition to linear stability, we also examine nonlinear stability of modulated convection using the energy method. The first major work using the energy method to establish nonlinear stability in fluid dynamics appears to be Joseph (Reference Joseph1976), though it was used before that by a variety of researchers, including Serrin (Reference Serrin1959), who cited Reynolds and Orr as the progenitors. More recent textbooks covering the energy method include Doering & Gibbon (Reference Doering and Gibbon1995) and Straughan (Reference Straughan2004). The work most relevant to our concerns is Homsy (Reference Homsy1974), which investigated gravity modulation as well as modulation of the boundary temperatures.
To summarize the two approaches to determining stability, linear stability analysis establishes a sufficient condition for instability, in this case a Rayleigh number above which at least one infinitesimal disturbance grows exponentially in time. Nonlinear stability analysis establishes a sufficient condition for stability, in this case a Rayleigh number below which the energy of all disturbances eventually decays. In the present case with a time-periodic base state, we consider two possibilities. For asymptotic stability, the disturbance may grow during a cycle but overall experiences net decay, whereas for strong global stability the disturbance decays exponentially in time.
In the present paper, we consider convection in a layer of fluid that is infinite in the horizontal directions. We investigate zero-mean modulation of the heat flux at the bottom boundary of a standard fluid layer, which, from the symmetry of the modulation profile, is equivalent to modulation at the top of a water layer in the anomalous  $0\unicode{x2013}4\,^\circ {\rm C}$ regime, as would be the case for a lake. For comparison, we also give results for zero-mean modulation of the temperature at the bottom boundary, though we do not detail the derivation of the equations. After discussing the set-up and governing equations in § 2, we go through the calculation of linear and nonlinear stability thresholds in §§ 3 and 4, respectively. We then present results in § 5. Our main conclusions are further confirmed by selected direct numerical simulations (DNS) of the initial value problem, presented in § 6. We finally discuss our results and future works in § 7.
2. Set-up
We consider two parallel plates extending infinitely far in the horizontal  $x$- and $y$-directions, containing fluid satisfying the Boussinesq equations,
 \begin{gather} \partial_{t_*} \boldsymbol{u}_* + \boldsymbol{u}_* \boldsymbol{\cdot} \boldsymbol{\nabla}_* \boldsymbol{u}_* ={-}\frac{1}{\rho_0}\,\boldsymbol{\nabla}_* p_* + \alpha g T_* \hat{\boldsymbol{z}} + \nu\,{\nabla}_*^2 \boldsymbol{u}_*, \end{gather}
 \begin{gather}\boldsymbol{\nabla}_* \boldsymbol{\cdot} \boldsymbol{u}_* = 0, \end{gather}
 \begin{gather}\partial_{t_*} T_* + \boldsymbol{u}_* \boldsymbol{\cdot}\boldsymbol{\nabla}_* T_* = \kappa\, {\nabla}_*^2 T_*, \end{gather}
where asterisks represent dimensional quantities. Here,  $\boldsymbol {u}_*$ is the velocity, $T_*$ is the temperature measured with respect to the reference temperature at the upper boundary, $\rho _0$ is the density at the reference temperature, $g$ is the acceleration due to gravity, $\nu$ is the kinematic viscosity, $\kappa$ is the thermal diffusivity, $\alpha$ is the thermal expansion coefficient, and $p_*$ is the pressure. Figure 1 shows a schematic of the configuration.
Schematic geometry.

The velocity boundary conditions can be either no-stress or no-slip, and the temperature boundary conditions are
 \begin{gather} k\,\partial_z T_* = H \cos(\omega_* t_*) \quad \mathrm{at} \ z_*=0, \end{gather}
 \begin{gather}T_* = 0 \quad \mathrm{at} \ z_*=d, \end{gather}
where  $d$ is the domain size in the vertical $z$-direction pointing up, $H$ is the amplitude of the modulated heat flux, and $k$ is the conductivity. We non-dimensionalize using
 \begin{equation} t \equiv \omega_* t_* \quad \boldsymbol{x} \equiv \frac{\boldsymbol{x}_*}{d}, \quad \boldsymbol{u} \equiv \frac{d \boldsymbol{u}_*}{\kappa}, \quad T \equiv \frac{k T_*}{H d}, \end{equation}
and an appropriate scaling for pressure. We note that choosing to scale time by a diffusive time scale (e.g.  $d^2 / \kappa$) may be more appropriate in certain cases such as in the low-frequency limit $\omega _* \rightarrow 0$.
Using the non-dimensional variables in (2.6a–d), the non-dimensional governing equations become
 \begin{gather} \omega\,\partial_t \boldsymbol{u} + \boldsymbol{u} \boldsymbol{\cdot} \boldsymbol{\nabla} \boldsymbol{u} ={-}\boldsymbol{\nabla} p + {Ra} \,{Pr} \,T \hat{\boldsymbol{z}} + {Pr} \,\nabla^2 \boldsymbol{u}, \end{gather}
 \begin{gather}\boldsymbol{\nabla}\boldsymbol{\cdot} \boldsymbol{u} = 0, \end{gather}
 \begin{gather}\omega\,\partial_t T + \boldsymbol{u} \boldsymbol{\cdot} \boldsymbol{\nabla} T = \nabla^2 T. \end{gather}
The temperature boundary conditions become
 \begin{gather} \partial_z T = \cos{t} \quad \mathrm{at} \ z=0, \end{gather}
 \begin{gather}T = 0 \quad \mathrm{at} \ z=1. \end{gather}
The non-dimensional frequency  $\omega$, Rayleigh number ${Ra}$, and Prandtl number ${Pr}$, are defined as
 \begin{equation} \omega \equiv \frac{ \omega_* d^2}{\kappa}, \quad {Ra} \equiv \frac{\alpha g H d^4}{k \nu \kappa}, \quad {Pr} \equiv \frac{\nu}{\kappa}. \end{equation}
 We write the base state velocity, temperature and pressure as  $\boldsymbol {u}_{B}$, $T_{{B}}$ and $p_{{B}}$. For the stability analysis, we take a base state with no motion ( $\boldsymbol {u}_{B}=0$) and a temperature profile satisfying (2.9) with the velocity set to zero, namely
 \begin{equation} \omega\,\partial_t T_{{B}} = \nabla^2 T_{{B}}, \end{equation}
and the boundary conditions (2.10) and (2.11). We write the solution for the base state temperature as
 \begin{equation} T_{{B}}(z,t) = {\rm Re}\left\{ \frac{\mathrm{e}^{\mathrm{i} t}}{\beta} \left[ \sinh{(\beta z)} - \frac{\sinh{\beta} \cosh{(\beta z)}}{ \cosh{\beta}} \right] \right\}, \end{equation}
where  $\beta = \sqrt {\mathrm {i} \omega } = \mathrm {e}^{\mathrm {i}{\rm \pi} /4}\,\omega ^{1/2}$, and $\mathrm {Re}(\cdot )$ indicates ‘real part of’.
3. Linear stability calculation
For linear stability, we consider small perturbations to the base state and write
 \begin{equation} \boldsymbol{u} = \boldsymbol{u}_{B} + \boldsymbol{u}_{p}, \quad T = T_{{B}} + \theta_{{p}}, \quad p = p_{{B}} + P. \end{equation}
Using these in the governing equations (2.7) and (2.8), neglecting products of perturbations, and isolating the vertical velocity component ( $\boldsymbol {e}_z \boldsymbol {\cdot } \boldsymbol {u}_{p} = w_{p}$) results in
 \begin{gather} ( \omega\,\partial_t \nabla^2 - {Pr} \,\nabla^4 ) w_{p}(\boldsymbol{x},t) = {Ra} \,{Pr} \,{\nabla}_{H}^2 \theta_{{p}}(\boldsymbol{x},t), \end{gather}
 \begin{gather}( \omega\,\partial_t - \nabla^2 ) \theta_{{p}}(\boldsymbol{x},t) ={-} (\partial_z T_{{B}})\,w_{p}(\boldsymbol{x},t), \end{gather}
where  ${\nabla }_{H}^2 = \partial _x^2 + \partial _y^2$. The governing equations have constant coefficients in space, therefore the horizontal spatial components of the functions can be analysed using normal modes, so that we can write the perturbations as
 \begin{gather} w_{p}(\boldsymbol{x},t) = \mathrm{e}^{\mathrm{i} k_x x}\,\mathrm{e}^{\mathrm{i} k_y y}\,w(z,t), \end{gather}
 \begin{gather}\theta_{{p}}(\boldsymbol{x},t) = \mathrm{e}^{\mathrm{i} k_x x}\,\mathrm{e}^{\mathrm{i} k_y y}\, \theta(z,t). \end{gather}
The resulting equations are
 \begin{gather} ( \omega\,\partial_t L - {Pr} \,L^2 ) w(z,t) ={-} k^2\,{Ra} \,{Pr} \,\theta(z,t), \end{gather}
 \begin{gather}( \omega\,\partial_t - L ) \theta(z,t) ={-} (\partial_z T_{{B}})\,w(z,t), \end{gather}
where  $k^2 \equiv k_x^2 + k_y^2$ and $L\equiv \partial _z^2 - k^2$.
To manage the  $z$ dependence, we use Chebyshev polynomials. One possibility is to use Chebyshev differentiation matrices, as discussed in Weideman & Reddy (Reference Weideman and Reddy2000) and Trefethen (Reference Trefethen2000), so that $w$ and $\theta$ are solved for at specific grid points. Another possibility is to express $w$ and $\theta$ as Chebyshev polynomials and then use collocation or Galerkin projection to remove the $z$ dependence so that the coefficients in the Chebyshev expansion of $w$ and $\theta$ become the relevant unknowns, which is the approach taken in Or & Kelly (Reference Or and Kelly1999). The boundary conditions must be satisfied in each case. For details on the numerical methods used, see Appendix A.
The resulting matrix equation can be written as
 \begin{equation} \boldsymbol{\mathsf{H}}_d\,\frac{\mathrm{d}\kern0.7pt \boldsymbol{x}}{\mathrm{d} t} = [\boldsymbol{\mathsf{H}}_0 +{Ra} \,\boldsymbol{\mathsf{H}}_R + \boldsymbol{\mathsf{H}}_1\,\mathrm{e}^{\mathrm{i} t} + \boldsymbol{\mathsf{H}}_{{-}1}\,\mathrm{e}^{-\mathrm{i} t}] \boldsymbol{x}, \end{equation}
with  $\boldsymbol {x} = (\boldsymbol {w},\boldsymbol {\theta })^{\rm T}$, where $\boldsymbol {w}$ and $\boldsymbol {\theta }$ are vectors of coefficients or of the solutions at chosen grid points, depending on the method chosen. The base state gradient is expressed as $\partial _z T_{{B}} = T_1(z)\,\mathrm {e}^{\mathrm {i} t} + T_{-1}(z)\,\mathrm {e}^{-\mathrm {i} t}$ and discretized using the same method as the solutions.
The system of ordinary differential equations (ODEs) represented by (3.8) has coefficients that are periodic in time, and we therefore use Floquet theory. There are two ways in which we can use Floquet theory: the Floquet–Fourier–Hill (FFH) and monodromy matrix methods. The FFH method requires solving an eigenvalue problem, while the monodromy matrix method requires solving a system of ODEs. Here, we use the FFH method because it is more efficient computationally. For details on the FFH method, see Deconinck & Kutz (Reference Deconinck and Kutz2006).
3.1. Floquet–Fourier–Hill method
For the FFH method, we use Floquet theory to decompose  $\boldsymbol {w}(t)$ and $\boldsymbol {\theta }(t)$ into an exponential function of time multiplying a function that is periodic in time with the same period as the coefficients ( $2 {\rm \pi}$). The solution vector is then
 \begin{equation} \boldsymbol{x}(t) = \mathrm{e}^{\mu t} \sum_{n={-}\infty}^{\infty} \boldsymbol{x}_n\,\mathrm{e}^{\mathrm{i} n t}, \end{equation}
where  $\mu$ is the Floquet exponent. Using this representation in (3.8) leads to
 \begin{equation} \sum_{n={-}\infty}^{\infty} \boldsymbol{\mathsf{H}}_d (\mathrm{i} n + \mu)\,\boldsymbol{x}_n\,\mathrm{e}^{\mathrm{i} n t} = \sum_{n={-}\infty}^{\infty} [ \boldsymbol{\mathsf{H}}_0 \boldsymbol{x}_n +{Ra} \,\boldsymbol{\mathsf{H}}_R \boldsymbol{x}_n + \boldsymbol{\mathsf{H}}_1 \boldsymbol{x}_{n-1} + \boldsymbol{\mathsf{H}}_{{-}1} \boldsymbol{x}_{n+1} ] \mathrm{e}^{\mathrm{i} n t}. \end{equation}
Orthogonality of the exponential functions leads to
 \begin{equation} \boldsymbol{\mathsf{H}}_d (\mathrm{i} n + \mu)\,\boldsymbol{x}_n = \boldsymbol{\mathsf{H}}_0 \boldsymbol{x}_n +{Ra} \,\boldsymbol{\mathsf{H}}_R \boldsymbol{x}_n + \boldsymbol{\mathsf{H}}_1 \boldsymbol{x}_{n-1} + \boldsymbol{\mathsf{H}}_{{-}1} \boldsymbol{x}_{n+1}, \end{equation}
which is an infinite system of coupled equations for the Fourier coefficients and can be treated as an eigenvalue problem for  ${Ra}$ or $\mu$. We solve this coupled set of equations numerically by truncating the Fourier series and solving the resulting generalized eigenvalue problem, which is block tridiagonal on one side and block diagonal on the other.
The eigenvalue problem depends on  ${Pr}$, $\omega$, $k$,
$k$,  ${Ra}$, $\mu$, the number of Fourier modes, the number of Chebyshev modes or grid points, and the boundary conditions. Once other parameters are fixed, either the Rayleigh number ${Ra}$ or the Floquet exponent $\mu$ can be considered as the eigenvalue. The critical Rayleigh number for given ${Pr}$ and $\omega$ is the lowest Rayleigh number found through varying $k$ that results in ${\rm Re}(\mu )=0$.
If the Rayleigh number is treated as the eigenvalue, then we fix  ${\rm Re}(\mu )=0$ to look for marginal stability. If we write $\mu = \mu _0 + \mathrm {i} m$ in (3.9), with $0 \leqslant \mathrm {Im}(\mu _0) \leqslant 1$ (where $\mathrm {Im}(\cdot )$ indicates ‘imaginary part of’) and $m$ a positive integer, then we find
 \begin{equation} \boldsymbol{x}(t) = \mathrm{e}^{\mu_0 t} \sum_{n={-}\infty}^{\infty} \boldsymbol{x}_n\,\mathrm{e}^{\mathrm{i} (n+m) t}. \end{equation}
We see that  $m$ serves only to shift the association between the coefficient index and the frequency of the exponential that it accompanies, and we can therefore restrict $\mathrm {Im}(\mu )$ to lie between 0 and 1 without loss of generality. The lowest Rayleigh number found over all wavenumbers is the critical Rayleigh number. If, instead, the Floquet exponent $\mu$ is chosen as the eigenvalue, then $k$ and ${Ra}$ must be swept through to find the minimum value of ${Ra}$ resulting in $\mathrm {Re}(\mu )=0$.
For our numerical results, we have generally found the critical Rayleigh number by treating  ${Ra}$ as the eigenvalue. We have then checked the resulting critical Rayleigh number and wavenumber by using these values and treating $\mu$ as the eigenvalue to ensure that $\mathrm {Re}(\mu )$ is truly close enough to zero to represent the stability threshold. Furthermore, we have checked the surrounding $(k,{Ra})$ parameter space to be sure that the critical Rayleigh number found is truly a local minimum leading to marginal stability.
We have generally used 18 Chebyshev grid points. The highest Fourier mode used when solving for  ${Ra}$ as the eigenvalue varied between 15 and 30, depending on the frequency, with more Fourier modes being necessary to reach a converged solution at lower frequencies. When solving for $\mu$ as the eigenvalue, we have been able to use sparse eigenvalue routines that use the fact that $|\mu |$ is small, which has allowed us to use a largest Fourier mode of 35 to 50. This is not possible for ${Ra}$ values that are not small.
3.2. Low-frequency limit
At a certain  $O(1)$ value of $\omega$, the eigenvalue problem resulting from the FFH method becomes too ill-conditioned to continue working. For small $\omega$, the leading order of the $z$-derivative of the base state in (2.14) becomes independent of space and can be written as
 \begin{equation} \partial_z T_{{B}} = \cos{t} + O(\omega). \end{equation}
This coincides with what we expect physically since for very slow modulation, the temperature profile will be almost linear, and its slope will be that imposed at the boundary, namely  $\cos {t}$. With the spatial dependence eliminated, we can compare the eigenvalue problems for stability in the modulated case to the eigenvalue problems for stability in the steady case with boundaries held at different temperatures, which has non-dimensional temperature profile slope $-1$.
$-1$.
For temperature modulation with no-stress boundary conditions, the governing equations reduce to a Mathieu equation in this limit, and a WKB analysis can be done, as discussed in Or (Reference Or2001). For all other cases, a similar approach leads to a system of coupled Mathieu equations, which can be solved formally with an extension of the WKB ansatz to systems of equations. Unfortunately, connecting the WKB solutions through turning points is much more difficult with higher-order systems of equations than it is for the standard second-order ODE. Mathematical details are discussed in Wasow (Reference Wasow1985), but there does not appear to be a simple way to use the WKB approach for the cases considered here.
4. Nonlinear stability calculation
To determine the threshold for nonlinear stability, we use the energy method and two notions of nonlinear stability: strong global stability and asymptotic stability, as used and described in Homsy (Reference Homsy1974) for non-zero-mean temperature modulation. The analysis in Homsy (Reference Homsy1974) uses the mean of the boundary temperature difference as the temperature scale, which is not possible for zero-mean modulation, and the base state is different, but otherwise the approach is similar. We therefore give only the essentials and refer the reader to Homsy (Reference Homsy1974), Joseph (Reference Joseph1976) or Straughan (Reference Straughan2004) for more details.
The first step is to form an energy functional using power integrals. The first integral comes from taking the dot product of (2.7) with  $\boldsymbol {u}$ and integrating over the volume. The second integral comes from writing the temperature as the base state plus a fluctuation of arbitrary size, $T(\boldsymbol {x},t) = T_{{B}}(z,t) + \theta (\boldsymbol {x},t)$, using this expression in (2.9), and then multiplying by $\theta$ and integrating over the volume. Finally, we multiply the temperature integral by $\lambda \,{Ra}$ and add the result to the momentum integral, where $\lambda$ is a coupling parameter that we can later tune to achieve better stability results. The resulting equation for the time evolution of the energy is
 \begin{equation} \omega\,\frac{\mathrm{d}}{\mathrm{d} t} \left( \frac{\left\lVert{\boldsymbol{u}}\right\rVert_{2}^2}{2 \,{Pr}} + \frac{ \left\lVert{\phi}\right\rVert_{2}^2}{2} \right) = \frac{R}{\sqrt{\lambda}} \int_V w \phi \left( 1 - \lambda\,\partial_z T_{{B}} \right) \mathrm{d} V - ( \left\lVert{\boldsymbol{\nabla} \boldsymbol{u}}\right\rVert_{2}^2 + \left\lVert{\boldsymbol{\nabla} \phi}\right\rVert_{2}^2 ), \end{equation}
where  $R = \sqrt {{Ra}}$, $\phi = \theta \sqrt {\lambda \,{Ra}}$, and the norms are
 \begin{equation} \left\lVert{\phi}\right\rVert_{2}^2 = \int_V \phi^2 \,\mathrm{d} V, \quad \left\lVert{\boldsymbol{\nabla} \phi}\right\rVert_{2}^2 = \int_V |\boldsymbol{\nabla} \phi|^2 \,\mathrm{d} V, \quad \left\lVert{\boldsymbol{\nabla} \boldsymbol{u}}\right\rVert_{2}^2 = \int_V \frac{\partial u_j}{\partial x_k}\,\frac{\partial u_j}{\partial x_k}\,\mathrm{d} V. \end{equation}
We now define
 \begin{equation}
E =
\left(\frac{\left\lVert{\boldsymbol{u}}\right\rVert_{2}^2}{2
{Pr}} + \frac{
\left\lVert{\phi}\right\rVert_{2}^2}{2}\right), \quad I_\lambda =
\lambda^{{-}1/2} \int_V w \phi \left( 1 - \lambda
\partial_z T_{{B}} \right) \mathrm{d} V, \quad D =
(\left\lVert{\boldsymbol{\nabla}
\boldsymbol{u}}\right\rVert_{2}^2 +
\left\lVert{\boldsymbol{\nabla} \phi}\right\rVert_{2}^2),
\end{equation}
\begin{equation}
E =
\left(\frac{\left\lVert{\boldsymbol{u}}\right\rVert_{2}^2}{2
{Pr}} + \frac{
\left\lVert{\phi}\right\rVert_{2}^2}{2}\right), \quad I_\lambda =
\lambda^{{-}1/2} \int_V w \phi \left( 1 - \lambda
\partial_z T_{{B}} \right) \mathrm{d} V, \quad D =
(\left\lVert{\boldsymbol{\nabla}
\boldsymbol{u}}\right\rVert_{2}^2 +
\left\lVert{\boldsymbol{\nabla} \phi}\right\rVert_{2}^2),
\end{equation}
so that we have
 \begin{equation} \omega\,\frac{\mathrm{d} E}{\mathrm{d} t} = R I_\lambda - D. \end{equation}
From (4.4), we develop strong global stability and asymptotic stability.
4.1. Strong global stability
For strong global stability, we divide both sides of (4.4) by  $D$ to find
 \begin{equation} \omega\,\frac{E'(t)}{D} = R\,\frac{I_\lambda}{D} - 1 \leqslant R \max_{\mathcal{H}} \left( \frac{I_\lambda}{D}\right) -1, \end{equation}
where  $\mathcal {H}$ is the space of divergence-free functions satisfying the boundary conditions. We define
 \begin{equation} \frac{1}{\rho_\lambda(t)} \equiv \max_{\mathcal{H}} \left( \frac{I_\lambda}{D}\right), \end{equation}
where  $\rho _\lambda (t)$ is periodic with the same period as the base state temperature gradient. We then define
 \begin{equation} R_{S,\lambda} \equiv \min_{t \in [0,2{\rm \pi}]} \rho_\lambda, \end{equation}
to arrive at
 \begin{equation} E'(t) \leqslant - \frac{D}{\omega} \left( \frac{ R_{S,\lambda} - R}{R_{S,\lambda}} \right). \end{equation}
 From Poincaré's inequality, we have  $D \geqslant \alpha _1 E$, with $\alpha _1 \geqslant 0$. We therefore obtain
 \begin{equation} E(t) \leqslant E(0) \exp{\left( - \frac{\alpha_1 t (R_{S,\lambda} - R) }{\omega R_{S,\lambda}} \right)}. \end{equation}
For  $R < R_{S,\lambda }$, the energy decays exponentially or faster in time, which we call strong global stability.
To find  $R_{S,\lambda }$, we must first solve the variational problem for $\rho _\lambda (t)$ in (4.6), which upon using variational calculus with a Lagrange multiplier for the incompressibility constraint (see Straughan (Reference Straughan2004) and Christopher (Reference Christopher2021) for details), leads to
 \begin{gather} \frac{\rho_\lambda(t)}{2\sqrt{\lambda}} \left( 1 - \lambda\,\partial_z T_{{B}} \right) {\nabla}^2_H \phi + \nabla^4 w = 0, \end{gather}
 \begin{gather}\frac{\rho_\lambda(t)}{2\sqrt{\lambda}} \left( 1 - \lambda\,\partial_z T_{{B}} \right)w + \nabla^2 \phi = 0. \end{gather}
We use normal modes and write
 \begin{equation} (w(\boldsymbol{x},t), \phi(\boldsymbol{x},t)) = (W(z,t),\varPhi(z,t))\,\mathrm{e}^{\mathrm{i} k_x x}\, \mathrm{e}^{\mathrm{i} k_y y}. \end{equation}
The equations then become
 \begin{gather} L^2\,W(z,t) = \frac{k^2\,\rho_\lambda(t)}{2 \sqrt{\lambda}} \left(1 - \lambda\,\partial_z T_{{B}} \right) \varPhi(z,t), \end{gather}
 \begin{gather}L\,\varPhi(z,t) ={-}\frac{\rho_\lambda(t)}{2 \sqrt{\lambda}} \left( 1 - \lambda\,\partial_z T_{{B}} \right) W(z,t). \end{gather}
This is a generalized eigenvalue problem for  $\rho _\lambda (t)$, which can be written as
 \begin{equation} \left(\begin{matrix} L^2 & 0 \\ 0 & L \end{matrix} \right) \left( \begin{matrix} W\\ \varPhi \end{matrix} \right) = \rho_\lambda(t) \left( \frac{1-\lambda\,\partial_z T_{{B}}}{2 \sqrt{\lambda}} \right) \left( \begin{matrix} 0 & k^2\\ -1 & 0 \end{matrix} \right) \left( \begin{matrix} W\\ \varPhi \end{matrix} \right). \end{equation}
We solve this generalized eigenvalue problem by discretizing on a Chebyshev basis (as discussed in the linear stability section). To find  $R_{S,\lambda }$, we then minimize $\rho _\lambda (t)$ over time as specified in (4.7). Finally, we vary $\lambda$ to find the best stability result, namely the highest $R_{S,\lambda }$, which we define as the threshold for strong global stability, $R_S$. Altogether, this is
 \begin{equation} R_S = \max_\lambda \min_k \min_t \rho_\lambda(t; k). \end{equation}
4.1.1. Low-frequency limit
For strong global stability, as  $\omega \rightarrow 0$ the eigenvalue problem from (4.10) and (4.11) becomes
 \begin{gather} \frac{\rho_\lambda(t)}{2\sqrt{\lambda}} \left( 1 - \lambda \cos{t} \right) {\nabla}^2_H \phi + \nabla^4 w = 0, \end{gather}
 \begin{gather}\frac{\rho_\lambda(t)}{2\sqrt{\lambda}} \left( 1 - \lambda \cos{t} \right)w + \nabla^2 \phi = 0. \end{gather}
The eigenvalue problem for the linear stability threshold in standard RB convection can be written as
 \begin{gather} R\,\nabla^2_H \theta + \nabla^4 w = 0, \end{gather}
 \begin{gather}R w + \nabla^2 \theta = 0. \end{gather}
The spatial operators in the two cases are equivalent, so  $\rho _\lambda (t)$ must satisfy
 \begin{equation} \frac{\rho_\lambda(t)}{2\sqrt{\lambda}} \left( 1 + \lambda \cos(t)\right) \in \{R_{j,{steady}}\}, \end{equation}
where each  $R_{j,{steady}}$ satisfies the eigenvalue problem in (4.19) and (4.20). Rearranging, we have
 \begin{equation} \rho_\lambda(t)= \frac{2\sqrt{\lambda}}{1 + \lambda \cos(t)}\, R_{j,{steady}} \end{equation}
for each possible  $j$. Now we use normal modes and perform $R_S = \max _\lambda \min _k \min _t \rho _\lambda (t; k)$. Minimizing in time clearly means that we must take $\cos {t}=1$. We are then left to maximize over $\lambda$, which leads to $\lambda = 1$. Finally, we minimize the resulting $\rho _\lambda (t;k)$ over $k$, which leads to
 \begin{equation} R_S \equiv \max_\lambda \min_k \min_t \rho_\lambda(t; k)= \min_k \{R_{j,{steady}}\}. \end{equation}
Because  $R_{L,{steady}} \equiv \min _k \{R_{j,{steady}}\}$, we conclude that ${Ra}_S \rightarrow {Ra}_{L,{steady}}$ as
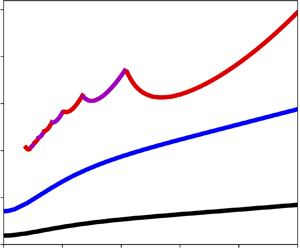
  $\omega \rightarrow 0$. This is the limit approached by the numerical results, as seen in figures 2 and 5 for modulated flux and temperature, respectively.
Critical Rayleigh numbers and wavenumbers for heat-flux modulation for  ${Pr}=1$: (a,c) no-slip; (b,d) no-stress. For ${Ra}_L$, magenta indicates a synchronous disturbance ( $\mathrm {Im}(\mu )=0$) and red indicates a subharmonic disturbance ( $\mathrm {Im}(\mu )=1/2$). Linear stability results at low frequencies are absent because the numerical problem becomes ill-conditioned.

4.2. Asymptotic stability
For asymptotic stability, we start from (4.4) and write
 \begin{equation} E'(t) = \left( \frac{R\,I_\lambda(t) - D}{\omega\,E(t)} \right) E(t). \end{equation}
First, we define
 \begin{equation} \nu_\lambda(t) \equiv \max_\mathcal{H} \left( \frac{R\,I_\lambda(t) - D}{\omega\,E(t)} \right), \end{equation}
where  $\mathcal {H}$ is the space of divergence-free functions satisfying the boundary conditions. This leads to
 \begin{equation} E'(t) \leqslant \nu_\lambda(t)\,E(t), \end{equation}
which means that
 \begin{equation} E(t) \leqslant \exp\left(\int_0^t \nu_\lambda(t') \,\mathrm{d} t'\right) E(0). \end{equation}
To find  $\nu _\lambda (t)$, we use the variational calculus with a Lagrange multiplier for incompressibility, leading to
 \begin{gather} \frac{R}{2\sqrt{\lambda}}\,(1 - \lambda\,\partial_z T_{{B}})\,\nabla^2_H \phi + \nabla^4 w = \frac{ \nu_\lambda}{2\,{Pr}}\,\nabla^2 w, \end{gather}
 \begin{gather}\frac{R}{2\sqrt{\lambda}}\,(1 - \lambda\,\partial_z T_{{B}}) w + \nabla^2 \phi = \frac{\nu_\lambda}{2}\,\phi . \end{gather}
The eigenvalue  $\nu _\lambda (t)$ is periodic, and we define the configuration as asymptotically stable if the integral of $\nu _\lambda$ over one period is less than zero, defining
 \begin{equation} \bar{\nu}_\lambda \equiv \int_0^{2 {\rm \pi}} \nu_\lambda(t) \,\mathrm{d} t. \end{equation}
We use normal modes as in (4.12) and find the generalized eigenvalue problem
 \begin{equation} \left(\begin{matrix} L^2 & \dfrac{-k^2 R}{2 \sqrt{\lambda}} \left( 1- \lambda\,\partial_z T_{{B}} \right)\\[8pt] \dfrac{R}{2 \sqrt{\lambda}} \left( 1- \lambda\,\partial_z T_{{B}} \right) & L \end{matrix} \right) \left( \begin{matrix} W\\\varPhi \end{matrix} \right) = \nu_\lambda(t) \left( \begin{matrix} {Pr}^{{-}1}\,L/2 & 0\\ 0 & 1/2\\ \end{matrix} \right) \left( \begin{matrix} W\\\varPhi \end{matrix} \right). \end{equation}
We then discretize in  $z$ using a Chebyshev basis, and solve this generalized eigenvalue problem numerically in order to estimate $\bar {\nu }_\lambda$, the integral of $\nu _\lambda (t)$ over one period. For fixed ${Ra}$, ${Pr}$ and $\omega$, we first sweep through wavenumbers and take the worst-case (largest) value for $\nu _\lambda (t)$ at the chosen points in time over one period, which upon integrating in time gives us $\bar {\nu }_\lambda$. For efficiency, we have used Gauss quadrature with 30 grid points for the integral. Checks using more advanced integration methods indicate a relative error in the resulting Rayleigh number of well below 1 % when using Gauss quadrature with 30 grid points. We then vary $\lambda$ to minimize this integral, and we define the result as
 \begin{equation} \bar{\nu} \equiv \min_\lambda \max_k \bar{\nu}_\lambda. \end{equation}
Finally, we find the largest  $R$ satisfying $\bar {\nu }<0$ and define it as $R_A$, so that
 \begin{equation} R_A \equiv \max R \quad \mathrm{s.t.}\ \bar{\nu} < 0 . \end{equation}
4.2.1. Low-frequency limit
For heat-flux modulation, we have not found any simplification to be possible in the low-frequency limit for asymptotic stability, and we therefore discuss temperature modulation only for symmetric no-stress boundary conditions in this subsubsection. In this case, sine functions may be used as eigenfunctions as in standard RB convection, and the  $z$ derivative of the base state is $\partial _z T_{{B}} \approx -\cos {t}$.
In (4.31), we take
 \begin{equation} W(z,t) = \sum_{n=0}^\infty w_n(t) \sin{n {\rm \pi}z}, \quad \varPhi(z,t) = \sum_{n=0}^\infty \phi_n(t) \sin{n {\rm \pi}z}, \end{equation}
to arrive at a quadratic equation for  $\nu _\lambda (t)$:
 \begin{equation} \nu_\lambda^2 - 2 \lambda_n (1+{Pr}) \nu_\lambda + \frac{4 \,{Pr}}{\lambda_n} (\lambda_n^3 + k^2\,g(\lambda)^2\,R^2) = 0, \end{equation}
where  $\lambda _n = -(k^2 + n^2 {\rm \pi}^2)$ and $g(\lambda ) = (1-\lambda \, \partial _z T_{{B}})/(2 \sqrt {\lambda })$.
To find the stability threshold, we solve the quadratic equation (4.35), set the resulting  $\bar {\nu }_\lambda$ equal to zero, and find
 \begin{equation} {Ra}_A \leqslant {Ra}_{L,{steady}} \left( \frac{2 {\rm \pi}\sqrt{\lambda}}{ 2 \cos^{{-}1}{({-}1/\lambda)} - {\rm \pi}+ 2 \lambda \sin{(\cos^{{-}1}{({-}1/\lambda)})} } \right)^2, \end{equation}
with the maximization over  $k$ in the definition of $\bar {\nu }$ in (4.32) leading to $k_{cr}={\rm \pi} /\sqrt {2}$, the critical wavenumber in steady RB with the same boundary conditions. The value of $\lambda$ leading to the largest ${Ra}_A$ is $\lambda \approx 1.319$, leading to ${Ra}_A \approx 2891.38$, which is exactly what we find numerically, as seen in figure 5.
5. Results
5.1. Heat-flux modulation
Carrying out the linear and nonlinear stability calculations as described in the preceding sections, we are able to find results for linear stability, asymptotic stability and strong global stability for specified  $\omega$, ${Pr}$ and boundary conditions. Results for no-slip conditions on the top and bottom are shown in figures 2(a,c), while no-stress conditions are shown in figures 2(b,d). As usual in RB convection, no-slip conditions lead to a higher critical Rayleigh number.
For linear stability, we find that the critical Rayleigh number always arises from either  $\mathrm {Im}(\mu )=0$ or $\mathrm {Im}(\mu )=1/2$, representing synchronous and subharmonic disturbances, respectively. There is a stark contrast between low and high frequencies. At low frequencies, ${Ra}_L$ generally decreases with $\omega$, but in an oscillatory manner as the critical instability switches between various modes of synchronous and subharmonic disturbances, as shown by the discontinuities in the most dangerous wavenumber curves (figures 2c,d). At high frequencies, the critical instability is always subharmonic, and an asymptotic balance is reached with ${Ra}_L\,\omega ^{-2}$ and $k_L \omega ^{-1/2}$ approaching non-zero constants, as shown in figure 3. For linear stability, no-slip conditions with ${Pr}=1$ give ${Ra}_L\,\omega ^{-2} \rightarrow 22.58$, while no-stress conditions give ${Ra}_L\,\omega ^{-2} \rightarrow 12.44$. The nonlinear stability thresholds do not appear to reach the same asymptotic relationship between the critical Rayleigh number and the modulation frequency. The nonlinear stability results do not change as radically with frequency as the linear stability results overall, though the threshold for both asymptotic stability and strong global stability does go down at low frequencies. Note that $\omega \approx 10^7$ for Lake Superior, and ${Ra} \approx 10^{20}$ at $3\,^\circ {\rm C}$ (Christopher Reference Christopher2021). This value of $\omega$ is above numerically attainable values, which makes the large- $\omega$ limit results interesting. Both of these values use molecular thermal diffusivity. As the temperature approaches the temperature of maximum density for water, the coefficient of thermal expansion approaches zero. The Rayleigh number is proportional to the coefficient of thermal expansion, so at some point the Rayleigh number must pass through the critical Rayleigh numbers found here.
As figure 2, but with results now scaled for large  $\omega$ and computed over a larger range of $\omega$.

The dependence of the critical Rayleigh numbers on  ${Pr}$ is shown in figure 4 for $\omega =100$. It can be seen that ${Ra}_L$ changes by orders of magnitude as ${Pr}$ is varied, while ${Ra}_A$ stays in a relatively narrow range. In contrast, strong global stability ${Ra}_S$ is independent of the Prandtl number. A subcritical instability is an instability arising for a ${Ra}$ value between the linear and nonlinear stability thresholds. There is therefore a very large region for potential subcritical instabilities at low ${Pr}$, with the region increasing as ${Pr}$ decreases, as seen in figure 4.
Dependence of (a)  ${Ra}_L$ and (b) ${Ra}_A$ on ${Pr}$ for $\omega =100$, with symmetric no-slip and no-stress conditions, and heat-flux modulation.

Low Prandtl number means decreasing viscosity, so on the one hand, it should be easier to trigger instability. However, for small Prandtl number, viscosity on its own disappears from the linear system, which contains  ${Ra}\,{Pr}$. It is possible that both effects compensate for nonlinear stability, leading to a nearly flat curve with a maximum near ${Pr}=1$. It is somewhat surprising, then, to find that ${Ra}_A$ reaches a maximum near ${Pr}=0.6$ and then decreases with decreasing ${Pr}$ for $\omega =100$ and no-stress boundary conditions, with a similar result for no-slip conditions. Calculations for $\omega =10$ show the same pattern of behaviour.
The asymptotic behaviour of  ${Ra}_L$ with ${Pr}$ is readily predicted by looking at the linear equation system (3.6)–(3.7). In the large Prandtl number limit, the first term on the left-hand side of (3.6) is negligible, so ${Pr}$ disappears from the linear system, as for the classical RB configuration. Then ${Ra}_L$ is independent of ${Pr}$. On the contrary, in the small Prandtl number limit, the second term on the left-hand side of (3.6) is negligible: the only remaining parameter is then ${Ra}_L\,{Pr}$, and the stability threshold in term of this parameter becomes ${Ra}_L\,{Pr} = \text {const.}$, yielding the scaling ${Ra}_L =\text {const.} \times {Pr} ^{-1}$ observed in figure 4(a).
5.2. Temperature modulation
Linear stability results for non-zero-mean temperature modulation of one boundary can be found in Or & Kelly (Reference Or and Kelly1999). For completeness, we include here nonlinear stability results for that set-up, with  ${Ra}$ defined appropriately for the configuration. These results are shown in figure 5. The general dependence of the critical Rayleigh number is the same as in the modulated flux case, and only the specific numbers are different.
Temperature modulation results with  ${Pr}=1$: (a,c) no-slip; (b,d) no-stress. For ${Ra}_L$, magenta indicates a synchronous disturbance (i.e. $\mathrm {Im}(\mu )=0$) and red indicates a subharmonic disturbance (i.e. $\mathrm {Im}(\mu )=1/2$).

The no-stress case can be treated with sine eigenfunctions, meaning that the stability problem reduces to a single ODE. It is also possible to use the WKB approximation for this case, as in Or (Reference Or2001), but we do not pursue further WKB calculations here for the reasons discussed in § 3.2.
Results scaled for large  $\omega$ are shown in figure 6. As $\omega \rightarrow \infty$, the appropriately defined Rayleigh number grows with $\omega ^{3/2}$, and the critical wavenumber grows with $\omega ^{1/2}$. For linear stability, no-slip conditions with ${Pr}=1$ lead to ${Ra}_L \omega ^{-3/2} \rightarrow 27.86$, while no-stress conditions lead to ${Ra}_L \omega ^{-3/2} \rightarrow 18.38$. The nonlinear stability thresholds do not appear to reach the same asymptotic relationship between the critical Rayleigh number and the modulation frequency.
As figure 5, but with results now scaled for large  $\omega$ and computed over a larger range of $\omega$.

5.3. High frequency
In this subsection, we look at high-frequency results for all configurations to compare the behaviour of the linear and global stability thresholds. Though we have treated explicitly only the zero-temperature top boundary condition listed in (2.11), it is of course possible to use a no-flux top boundary condition. As the modulation frequency is increased, the base state temperature profile becomes largely confined to a small layer near the modulated surface at the bottom. For large  $\omega$, the base state for heat-flux modulation in (2.14) leads to the following form for the base state derivative:
 \begin{equation} \partial_z T_{{B}}(z,t) \approx \mathrm{e}^{{-}z \sqrt{\omega/2}} \cos{ \left(t - z \sqrt{\frac{\omega}{2}} \right) }. \end{equation}
The (dimensionless) boundary layer thickness is therefore  $\delta = O(\omega ^{-1/2})$, so that for large enough $\omega$, we might expect the same results even with different boundary conditions imposed at the top at $z=1$ because the base state derivative has hardly any influence there.
Figure 7 shows the critical Rayleigh numbers for all possible configurations. The scaled linear Rayleigh number used in figure 7(a) is defined as
 \begin{equation} {Ra}_\infty = \begin{cases} {Ra}_L \, \omega^{{-}2} & \text{for heat-flux modulation},\\ {Ra}_L \, \omega^{{-}3/2} & \text{for temperature modulation}, \end{cases} \end{equation}
in agreement with figures 3 and 6. For all frequencies shown here, the critical disturbance is subharmonic. For linear stability, by  $\omega \gtrapprox 100$, the boundary conditions at the non-modulated surface have ceased to affect the critical Rayleigh number: ${Ra}_\infty$ converges towards a constant value that is essentially dependent only on the conditions at the modulated surface. This scaling behaviour can be explained following a local approach similar to that of Howard (Reference Howard1966), assuming that all the dynamics takes place in the boundary layer $\delta$ and that the depth $d$ of the system is no longer a relevant parameter of its dynamics. Then one can define a local Rayleigh number as ${Ra} \times \delta ^4 \sim {Ra}\,\omega ^{-2}$ for modulated flux, and ${Ra} \times \delta ^3 \sim {Ra}\,\omega ^{-3/2}$ for modulated temperature. Instability starts once the local Rayleigh number – here the scaled linear Rayleigh number (5.2) – reaches a given critical value that depends only on the conditions at the modulated surface. The most dangerous mode has a wavenumber inversely proportional to the only relevant scale of the system, $\delta \sim \omega ^{-1/2}$, in agreement with figures 3(c,d) and 6(c,d).
Comparison of results with  ${Pr} = 1$ for all 16 possible combinations of boundary conditions and modulation style: no-slip or no-stress for velocity, zero-temperature or no-flux for temperature, and heat-flux or temperature modulation. (a) Linear stability; (b) global stability. Colour indicates the velocity boundary condition at the surface of modulation and the modulation type, with the associations listed in the legend. Line style indicates the boundary conditions at the non-modulated surface: solid indicates no-slip and zero-temperature; dashed indicates no-slip and no-flux; dotted indicates no-stress and no-flux; dash-dotted indicates no-stress and zero-temperature.

In contrast, for nonlinear stability, the non-modulated boundary condition does affect the critical Rayleigh number even at high frequencies. The local analysis in the boundary layer is not relevant. Figure 7 shows that results for the four possible top boundary conditions do not converge at high frequency as they do in linear stability. Asymptotic stability results indicate the same pattern, with the top boundary condition influencing results even at higher frequencies. For nonlinear stability, the critical Rayleigh numbers grow at a rate closer to  ${Ra} \sim \omega$ as $\omega \rightarrow \infty$. Considering the scaling (5.2) for linear stability, this means that the potential region for subcritical instabilities grows rapidly as $\omega \rightarrow \infty$.
6. Validation by direct numerical simulations
Our purpose here is to validate the main features of our analytical stability analysis by performing initial value, two-dimensional DNS of the full equations, starting from the purely diffusive base state solution (2.14) plus some infinitesimal perturbations of the temperature field. A complete numerical study of the system – including, for instance, bistability analysis in the range below the linear threshold and above the nonlinear one, the study of the highly non-linear dynamics at large Rayleigh number, or the processing of more realistic boundary layer forcing – is left for future work.
6.1. Numerical method
Equations (2.7)–(2.9) with temperature boundary conditions (2.10)–(2.11) are solved using the commercial software COMSOL Multiphysics, based on the finite element method. Note that for numerical efficiency, it is better to start with a zero flux at the bottom: hence our bottom forcing is  $\partial _z T = \sin t$ at $z = 0$, shifted by ${\rm \pi} /2$ compared to the theoretical study, with no further consequences. The computational domain is rectangular, with dimensionless depth $1$ and dimensionless width $\varGamma \geqslant 8$, chosen to include at least 4 wavelengths of the first excited mode. Top/bottom velocity boundary conditions are either no-slip or no-stress, and we use periodic boundary conditions in the horizontal direction for both temperature and velocity. The mesh is triangular in the bulk and rectangular close to the top and bottom plates, where it is strongly refined. We use standard Lagrange elements, quadratic for the pressure, and cubic for the velocity and temperature fields. The total number of degrees of freedom is at least $2 \times 10^5$. Grid convergence and influence of the aspect ratio $\varGamma$ were tested for each studied value of the Rayleigh number and forcing frequency. No stabilization technique is used. The implicit, time-dependent solver employs the backward differentiation formula with accuracy order 2–3 and relative tolerance $5\times 10^{-3}$. We impose a minimum of 50 time steps per forcing period. A random noise of typical amplitude $10^{-6}$ is added to the diffusive temperature field (2.14) as the initial condition. Then the code is run for at least 1.5 diffusive time, or until saturation of the kinetic energy for the unstable configurations. Table 1 lists the characteristics of the 15 simulations used in the results presented in figures 8 to 12. Many other simulations were performed to confirm the trends shown here, but are not presented.
Dimensionless numbers and velocity boundary conditions for the 15 simulations used in figures 8–12. The values of the linear critical Rayleigh number  ${Ra}_L$ given here come from the analytical study (see figure 2).

Linear stability study for  $\omega =100$ and ${Pr}=1.0$. (a) Two examples of the time evolution of the space-averaged kinetic energy and of the determination of the exponential growth rate. (b) Measured growth rate as a function of the Rayleigh number for 9 runs. A complete list of parameters is provided in table 1.

Temporal evolution of the space-averaged kinetic energy as a function of time for four DNS runs illustrating the linear and nonlinear stability regimes at  $\omega =100$, ${Pr}=1.0$, and for ${Ra} = 1.025 \,{Ra}_L$, $0.95 \,{Ra}_L$, $0.95 \,{Ra}_A$ and $0.95 \,{Ra}_S$, respectively. Values of ${Ra}_L$, ${Ra}_A$ and ${Ra}_S$ come from the analytical study (figure 3). A complete list of parameters is provided in table 1.

Validation of the competition between synchronous and subharmonic modes. The analytical results come from figure 2(b). Symbols show corresponding unstable numerical simulations performed for a Rayleigh number just above the threshold. A complete list of DNS parameters is provided in table 1.

(a) Time evolution over two forcing periods of the imposed bottom heat flux, of the space-averaged kinetic energy, and of the perturbation temperature and vertical velocity at the centre of a ‘hot’ cell close to the middle of the computational domain, i.e. at  $x=8.4$, $z=0.2$ for the synchronous case (left) and $x=7.6$, $z=0.2$ for the subharmonic case (right). The three variables are rescaled to appear on the same $y$-axis. (b) Snapshot at time $t/2{\rm \pi} = 4$ of the perturbation temperature field normalized by the maximum value over the two cycles shown in (a), and of the streamlines of the associated field. The stars show the locations where the local data in (a) are taken. A complete list of DNS parameters is provided in table 1.

From top to bottom, time evolution over two forcing periods of (a,c,e,g,i,k,m,o) a synchronous mode, and (b,d,f,h,j,l,n,p) a subharmonic mode. The time space between two rows is  $1/4$ of the forcing period. For each time and each mode, from left to right, we show a zoom of the temperature perturbation field and associated streamlines, and a vertical cross-section at the centre of the ‘hot’ cell close to the middle of the computational domain (i.e. at $x=8.4$ for the synchronous case, and $x=7.6$ for the subharmonic case) of the temperature and vertical velocity.

6.2. Linear and nonlinear stability
We first checked the linear stability results. To do so, we performed a number of DNS runs, systematically changing the Rayleigh number around the theoretical critical value  ${Ra}_L$ determined in § 5. We then plot the space-averaged value of the kinetic energy as a function of time: after a short transient due to the adjustment of the initial, random perturbation of the temperature field, it is well fitted by an exponential function of type $K_0\exp {[2\sigma (t-t_0)]}$, with $\sigma$ the instability growth rate (see e.g. figure 8a). An example of a systematic study for $\omega =100$ and ${Pr}=1.0$ is shown in figure 8(b). The threshold for instability (where $\sigma =0$) is in perfect agreement with the theoretical prediction.
Our numerical code with a random, infinitesimal, initial temperature perturbation is not well fitted to study the nonlinear stability, which would require imposing as the initial condition the most dangerous mode in all the velocity, pressure and temperature fields. We can nevertheless check the existence of the different regimes. Figure 9 shows the space-averaged kinetic energy for  $\omega =100$, ${Pr}=1.0$, and four different Rayleigh numbers: just above the linear threshold, ${Ra} = 1.025 {Ra}_L$, just below it, ${Ra} = 0.95 {Ra}_L$, just below the asymptotic nonlinear threshold, ${Ra} = 0.95 {Ra}_A$, and just below the strong nonlinear threshold, ${Ra} = 0.95 {Ra}_S$. The main expected features of the different regimes are recovered: above the linear threshold, the small perturbation grows exponentially in time, while below the strong nonlinear threshold, it decreases exponentially. In between, the disturbance energy might grow transiently during a cycle, but for the infinitesimal initial perturbations considered here, it always experiences overall net decay. Again, this is not a complete study of the nonlinear stability, which would require more advanced DNS, but it illustrates the sufficient conditions provided by the nonlinear stability results.
6.3. Synchronous and subharmonic modes
One of the most surprising results from the linear analysis is the competition between synchronous and subharmonic modes at a relatively low forcing frequency  $\omega$. To verify this, we have performed simulations for various $\omega$, just above the stability threshold. Results are shown in figure 10 and confirm the analytical results. Note that the mode selection is very sensitive to the aspect ratio $\varGamma$ because of the influence of the imposed periodicity on the wavelength selection. For instance, convergence of the results shown in figure 10 was not reached for $\varGamma =8.0$ used in the previous DNS.
Figures 11 and 12 allow us to further understand the origin of the two different modes. The synchronous mode is the most straightforward to understand: heating the system from below leads to a transient destabilization of the otherwise stably stratified system, and instability appears with a period similar to the forcing; negative flux then restabilizes the system, before a new cycle begins. However, this synchronous mode is clearly subdominant close to linear threshold, where most of time a subharmonic mode kicks in first. From figure 12, both modes correspond to a similar velocity pattern, i.e. one big cell over the whole depth. This cell is mostly stationary, but the direction in which the fluid flows along this cell might reverse or not between two successive forcing cycles, respectively leading to subharmonic and synchronous modes. (Note also the positive/negative reflection symmetry of the subharmonic signals in figure 11a.) If we look at the temperature field at the end of the decreasing flux part of the first cycle ( $t/2{\rm \pi} =4.25$), then we can notice for the subharmonic case negative temperature perturbations on the left and right sides of the zoom, as opposed to the synchronous case: this might lead to a locally stronger bottom temperature gradient at these locations, hence triggering a rising convective velocity there, and a sinking return flow at the central location, which was formerly rising. This mechanism triggers the instability with a period twice that of the forcing. This process is all the more efficient for large $\omega$, i.e. when the temperature perturbation from the previous cycle does not have time to diffuse away, hence the predominance of subharmonic modes at large $\omega$. Nevertheless, preliminary studies when increasing ${Ra}$ show that these subharmonic modes are restricted to the close neighbourhood of the stability curve: as soon as buoyancy forcing becomes strong enough, the boundary layer rapidly becomes unstable at each cycle before the building up of any subharmonic interaction, and the readily expected synchronous regime appears. As an illustration, for the case $\omega =100$ and ${Pr}=1.0$ studied in figure 8, a synchronous regime dominates at ${Ra}=3.5{Ra}_L$ at saturation, while the subharmonic mode still persists at ${Ra}=2{Ra}_L$. We expect that the competition between the fine tuning necessary to trigger a subharmonic mode, and the most direct, but less efficient excitation of a synchronous mode, also explains the mode alternation observed at low $\omega$ (see e.g. figure 10).
7. Conclusion
We have described the first stability results for RB convection with a modulated flux condition at one boundary. We have also included results for a modulated temperature condition at one boundary. Three different notions of stability have been used: linear stability, asymptotic stability and strong global stability. For all results found, the linear stability threshold is above both nonlinear stability thresholds, as expected. For velocity, both no-stress and no-slip velocity boundary conditions have been considered. For temperature, the bulk of the results comes from a zero-temperature condition at the non-modulated surface, but a no-flux condition there has also been considered.
The critical Rayleigh number for linear stability  ${Ra}_L$ has different behaviour in the small and large $\omega$ limits. Below a certain value of $\omega$, the critical Rayleigh number arises alternately from synchronous and subharmonic disturbances, and decreases non-monotonically as $\omega$ decreases. The linear stability problem becomes ill-conditioned for an $O(1)$ frequency. For large enough $\omega$, the critical instability is always subharmonic, and ${Ra}_L \omega ^{-2}$ and ${Ra}_L \omega ^{-3/2}$ approach an $O(10)$ constant in the modulated flux and modulated temperature cases, respectively. The critical Rayleigh numbers for nonlinear stability grow more slowly with $\omega$, approximately linearly. The nonlinear stability results complement the linear stability results, showing that the window of possible Rayleigh numbers for subcritical instability is relatively small for low frequencies but increases rapidly as $\omega \rightarrow \infty$.
The modulated flux set-up considered here is relevant to situations in nature where a body of fluid experiences periodic heating at the surface, such as the diurnal heating of a lake by the sun. The model in this paper uses a zero-mean heat-flux modulation profile at the boundary, meaning that the net heat flux over each period is zero. This is a simplification of the motivating case of springtime warming of ice-free Lake Superior because the lake warms up during the spring. Despite this difference, the results in this paper may provide insight at the time when the Rayleigh number passes from supercritical to subcritical as the coefficient of thermal expansion goes from negative to positive. The most realistic boundary conditions for the lake would be modulated heat flux and no-stress conditions at the free surface, and zero heat flux and no-slip conditions at the lake bottom. Another example of this set-up arising in the analysis of natural phenomena is Coenen et al. (Reference Coenen, Sánchez, Félez, Davis and Pawlak2021).
We have treated the modulated flux condition at one boundary as being representative of radiative heating confined to a thin layer near the surface, and have also neglected effects from rotation. Future work could include these additional factors. Radiatively driven convection without modulation has recently been used experimentally in Bouillaut et al. (Reference Bouillaut, Lepot, Aumâitre and Gallet2019) to observe the transition to the ultimate scaling regime of RB convection, where the Nusselt number scales with the square root of the Rayleigh number. Radiative heating could be incorporated into the stability methods used here, and the theoretical modulation profile would then need to avoid radiative cooling.
When considering linear stability, rotation generally has a stabilizing effect on RB convection, as shown in Chandrasekhar (Reference Chandrasekhar1961), and we would expect the same effect when combined with modulation. When considering nonlinear stability, the form of the energy used here in the energy method is not sensitive enough to include rotation because the inner product of the velocity with the Coriolis term is zero. To find nonlinear stability results with rotation, researchers have had to use a modified energy that leads only to conditional stability results, as detailed in Galdi & Straughan (Reference Galdi and Straughan1985), for example.
Acknowledgements
M.L.B. acknowledges support from the US–France Fulbright Commission for his sabbatical stay at UCSD. Conversations with A. Sánchez and W. Coenen were helpful.
Funding
This research was supported by NSF award OCE-1829919.
Declaration of interests
The authors report no conflict of interest.
Appendix A. Numerical methods for stability analyses
The stability calculations in this paper are all solved numerically by discretizing in space with Chebyshev polynomials. We have done this in three different ways, both for checking results with a different method and because different methods work better for different cases. The three ways are (1) Chebyshev differentiation matrices, (2) Chebyshev collocation in coefficient space, and (3) Chebyshev Galerkin projection. We give some details of the first method, and then sketch the last two briefly (for more details, see Christopher Reference Christopher2021).
The use of Chebyshev differentiation matrices is covered in Weideman & Reddy (Reference Weideman and Reddy2000) and Trefethen (Reference Trefethen2000). The basic idea is to approximate the solution using a truncated Chebyshev polynomial expansion. The result of applying the derivative operator to the solution may then be expressed as the result of a matrix times a vector containing the solution at Chebyshev grid points, so that  $\mathrm {d} u/ \mathrm {d}\kern0.7pt x$ becomes $\boldsymbol{\mathsf{D}} \boldsymbol {u}$. The Chebyshev grid points that we use are defined by $x_j = \cos {( {\rm \pi}[1 - (\,j-1)/(N-1)])}$, with $j=1,2,\dots,N$.
To satisfy the boundary condition, we use what we will call the nullspace method, which does not seem to have been discussed in the literature until recently in Hsu, Hung & Liao (Reference Hsu, Hung and Liao2018). If the boundary conditions can be written in the form  $\boldsymbol{\mathsf{B}} \boldsymbol {u} = 0$, then the solution $\boldsymbol {u}$ must be in the nullspace of $\boldsymbol{\mathsf{B}}$. We project the entire problem into this nullspace. For example, if the eigenvalue problem is $u''(x) = -\lambda \, u(x)$, $u(0)=0=u(1)$, then the discretized problem is
 \begin{equation} \boldsymbol{\mathsf{D}}^2 \boldsymbol{u} ={-}\lambda \boldsymbol{u}, \quad \boldsymbol{\mathsf{B}} \boldsymbol{u} = 0, \end{equation}
where
 \begin{equation} \boldsymbol{u} = \left( \begin{matrix} u(x_1) & u(x_2) & \dots & u(x_N) \end{matrix} \right)^{{\rm T}}, \quad \boldsymbol{\mathsf{B}} = \left( \begin{matrix} 1 & 0 & \dots & 0\\ 0 & \dots & 0 & 1\end{matrix} \right), \end{equation}
and  $\boldsymbol{\mathsf{D}}$ is the appropriately sized Chebyshev differentiation matrix. To project this into the nullspace of $\boldsymbol{\mathsf{B}}$, we set $\boldsymbol{\mathsf{U}} = \mathrm {nullspace}(\boldsymbol{\mathsf{B}})$, with $\boldsymbol{\mathsf{U}}^{\dagger} \boldsymbol{\mathsf{U}} = \boldsymbol{\mathsf{I}}$, and assume that $\boldsymbol {u}_*$ holds the coordinates of $\boldsymbol {u}$ expressed in the nullspace of $\boldsymbol{\mathsf{B}}$, so that
 \begin{equation} \boldsymbol{u} = \boldsymbol{\mathsf{U}} \boldsymbol{u}_*. \end{equation}
This leads to
 \begin{equation} \boldsymbol{\mathsf{D}}^2 \boldsymbol{\mathsf{U}} \boldsymbol{u}_* ={-} \lambda \boldsymbol{\mathsf{U}} \boldsymbol{u}_*. \end{equation}
Upon multiplication on the left by  $\boldsymbol{\mathsf{U}}^{\dagger}$, we have
 \begin{equation} \boldsymbol{\mathsf{M}} \boldsymbol{u}_* = \boldsymbol{\mathsf{U}}^{\dagger} \boldsymbol{\mathsf{D}}^2 \boldsymbol{\mathsf{U}} \boldsymbol{}_* ={-} \lambda \boldsymbol{u}_*. \end{equation}
We project the operator
 \begin{equation} \boldsymbol{\mathsf{H}}_d \equiv \left( \begin{matrix} \boldsymbol{\mathsf{A}} & \boldsymbol{0}\\ \boldsymbol{0} & \boldsymbol{\mathsf{E}} \end{matrix} \right) \end{equation}
into the nullspace of the appropriate boundary condition operator
 \begin{equation} \boldsymbol{\mathsf{B}} \left( \begin{matrix} \boldsymbol{w} \\ \boldsymbol{\theta} \end{matrix} \right) = \boldsymbol{0}. \end{equation}
The same procedure is followed for the right-hand side of (3.8), with the result that all solutions to the resulting eigenvalue problem satisfy the boundary conditions.
For collocation with Chebyshev polynomials, we express the solutions in terms of basis functions consisting of Chebyshev polynomials combined so as to meet the boundary conditions. We therefore use different basis functions for  $w$ and $\theta$, which we write as $\phi _n^w$ and $\phi _n^\theta$ for the $n$th basis function of each type. The domain in $z$ is discretized $z_j = (x_j+1)/2$. We form basis functions $\phi _n^w$ and $\phi _n^\theta =0$ that satisfy the six boundary conditions. To use these basis functions, for linear stability we start from (3.6) and (3.7), and assume solutions of the form
 \begin{equation} w(z,t) = \sum_{n=1}^N w_n(t)\,\phi_n^w(z), \quad \theta(z,t) = \sum_{n=1}^N \theta_n(t)\,\phi_n^\theta(z). \end{equation}
Now we use collocation and enforce the equation at the Chebyshev grid points.
Chebyshev Galerkin projection starts in the same way as Chebyshev collocation. The same basis functions are used, but the differential equation is obtained by driving the residual to zero on the basis space used rather than enforcing the differential equation at specific points as in collocation. We take the inner product defined by
 \begin{equation} (f,g) \equiv \int_{{-}1}^1 \frac{f(x)\,g(x)}{\sqrt{1-x^2}}\,\mathrm {d}\kern0.7pt x \end{equation}
of  $2N$ basis functions with the governing equations to find $2N$ equations for the $2N$ unknown coefficients.


 Open access