

Nomenclature and terminology
 $Q_{\!J}=$
intensive performance of artifacts within a technological domain,
$Q_{\!J}=$
intensive performance of artifacts within a technological domain,
 $J$
$J$
 $t=\text{time}$
IOI
 $=$
individual operating ideas
$=$
individual operating ideas
 $P_{\text{IOI}}=$
probability of combination of any two IOI
$P_{\text{IOI}}=$
probability of combination of any two IOI
 $\text{IOI}_{0}=$
basic IOI – IOI that first introduce a natural phenomenon in the Operations regime
$\text{IOI}_{0}=$
basic IOI – IOI that first introduce a natural phenomenon in the Operations regime
 $\text{IOI}_{C}=$
cumulative number of IOI in the Operations regime
$\text{IOI}_{C}=$
cumulative number of IOI in the Operations regime
 $\text{IOI}_{L}=$
maximum number of possible IOI in Operations regime at time t
$\text{IOI}_{L}=$
maximum number of possible IOI in Operations regime at time t
 $\text{IOI}_{SC}=\text{IOI}_{C}$
successfully integrated into a domain artifact
$\text{IOI}_{SC}=\text{IOI}_{C}$
successfully integrated into a domain artifact
 $K=$
annual rate of increase in
$K=$
annual rate of increase in
 $\text{IOI}_{c}$
in the Operations regime
$\text{IOI}_{c}$
in the Operations regime
 $K_{\!J}=$
annual rate (when time is in years) of performance improvement measured by the slope of a plot of ln
$K_{\!J}=$
annual rate (when time is in years) of performance improvement measured by the slope of a plot of ln
 $Q_{\!J}$
versus time
$Q_{\!J}$
versus time
 $f_{i}=$
fitness in Understanding regime for a scientific field
$f_{i}=$
fitness in Understanding regime for a scientific field
 $i$
$i$
 $F_{U}=$
cumulative fitness of Understanding regime
$F_{U}=$
cumulative fitness of Understanding regime
 $d_{J}=$
interaction parameter of technological domain
$d_{J}=$
interaction parameter of technological domain
 $J$
defined as interactive outlinks from a typical component to other components in artifacts in domain
$J$
defined as interactive outlinks from a typical component to other components in artifacts in domain
 $J$
$J$
 $s_{J}=$
design parameter affecting the performance of an artifact in domain
$s_{J}=$
design parameter affecting the performance of an artifact in domain
 $J$
$J$
 $A_{\!J}=$
exponent of design parameter in power law for domain
$A_{\!J}=$
exponent of design parameter in power law for domain
 $J$
, relating performance and the design parameter
$J$
, relating performance and the design parameter
1 Introduction
Inventions are the outputs of the design process when they reach sufficient novelty and utility to rate that term: they are a basic building block of technological progress and the fundamental unit of this paper. In our formulation, technological domains consist of designed artifacts that utilize a specified body of knowledge to achieve a specific generic function (Magee et al. Reference Magee, Basnet, Funk and Benosn2014). Thus, technological domains involve a large number of inter-related inventions as even single artifacts can embody multiple inventions. Arthur (Reference Arthur2007) used the term ‘technologies’ to describe something that bridges inventions and technological domains; according to Arthur, these use ‘effects’ to achieve some ‘purpose’. Thus, one can also say that each artifact is a material realization of its design that intentionally embodies the effects.
This paper brings together three bodies of research that do not usually interact. The first is the design research field, particularly its cognitive scientific insights on the design process. The second is the technological change field where most researchers have been economists or business scholars. The third area is quantitative modeling of performance of artifacts.
The objective of the work reported here is to use understanding of the design and invention process to model performance how well a specific designed artifact achieves its intended function or purpose. In particular, we examine performance trends – the time dependence of performance as realized in a series of improved designs of artifacts that arise over time. We do so in an attempt to develop an explanatory and quantitative predictive model for why performance improves exponentially over multiple designs with widely varying rates among technological domains, ranging from 3 to 65 % annually for domains characterized so far. Our research question is whether a quantitative predictive model based upon foundations and insights about the design process leads to results consistent with this exponential behavior and whether such a model helps explain and possibly predict the variation in the rate of improvement, and in the process generates empirically testable hypotheses about underlying mechanisms. We first discuss relevant literature in each of the three intersecting fields.
2 Background
2.1 Design, invention and cognitive psychology literature
What connections between technological change and design research can be inferred from the existing literature? Business scholars and economists often view technical change as occurring inside a black box, and have usually avoided examining design activities that are the source of technological change. An important publication that begins to build a bridge between aspects of design research and the economics of technological change is the paper by Baldwin & Clark (Reference Baldwin, Clark, Kahin and Foray2006). These authors (and Luo, Olechowski & Magee Reference Luo, Olechowski and Magee2014) point specifically to a central role for design in achieving economic value. In addition to economic perspectives, another view that somewhat ignores design is the linear model accredited to Bush (Reference Bush1945), which considers technological change occurring through application of science. As a counterview, in his seminal book, The Sciences of the Artificial, Simon (Reference Simon1969, Reference Simon1996) was the first to highlight that design is an activity standing on its own right, like natural sciences, and has its own set of logic, concepts and principles. While the primary goal of natural science is to produce predictive explanations of natural phenomena, the primary goal of design is to create artifacts. The design activity is central to creation and improvement of artifacts in all technological domains and involves cognitive activities such as the use of knowledge, reasoning and understanding. These indisputable cognitive activities have been noted by many scholars who have studied invention and design (Simon Reference Simon1969; Dasgupta Reference Dasgupta1996; Gero & Kannengiesser Reference Gero and Kannengiesser2004; Hatchuel & Weil Reference Hatchuel and Weil2009).
In the context of realizing higher performance from subsequent generations of artifacts, the role of invention, as one outcome of the design process, is a critical one since improvement in performance of artifacts must strongly reflect the inventions. As Vincenti (Reference Vincenti1990, p. 230) puts it, inventive activity is a source of new operational principles, and normal configurations that underlie future normal or radical designs. The operational principles (Polanyi Reference Polanyi1962; Vincenti Reference Vincenti1990) of an artifact describe how its components fulfill their special functions in combining to an overall operation to achieve the function of the artifact.
Models found useful in describing the creative design process include the Geneplore model (Finke, Ward & Smith Reference Finke, Ward and Smith1996), topological structures (Braha & Reich Reference Braha and Reich2003), FBS (function-behavior-structure) theory (Gero & Kannengiesser Reference Gero and Kannengiesser2004), concept–knowledge (CK) theory (Hatchuel & Weil Reference Hatchuel and Weil2009), infused design (Shai, Reich & Rubin Reference Shai, Reich and Rubin2009), analytical product design (Frischknecht et al. Reference Frischknecht, Gonzalez, Papalambros and Reid2009) and other modeling approaches. Although all of these frameworks include – to some degree – the key idea of combining existing ideas (for example in the form of conceptual synthesis, and blending of mental models described in discussion of the Geneplore model), the framework found most helpful in our modeling of performance changes resulting from a cumulative design process is analogical transfer. Although this idea can be traced as beginning with Polya (Reference Polya1945) or earlier, the framework remains an active area in design research (Clement, Mawby & Giles Reference Clement, Mawby and Giles1994; Holyoak & Thagard Reference Holyoak and Thagard1995; Goel Reference Goel1997; Gentner & Markman Reference Gentner and Markman1997; Leclercq & Heylighen Reference Leclercq, Heylighen and Gero2002; Dahl & Moreau Reference Dahl and Moreau2002; Christensen & Schunn Reference Christensen and Schunn2007; Linsey, Wood & Markman Reference Linsey, Wood and Markman2008; Tseng et al. Reference Tseng, Moss, Cagan and Kotovsky2008; Linsey, Markman & Wood Reference Linsey, Markman and Wood2012; Fu et al. Reference Fu, Chan, Cagan, Kotovsky, Schunn and Wood2013). Scholars of analogical transfer (Gentner & Markman Reference Gentner and Markman1997; Holyoak & Thagard Reference Holyoak and Thagard1995; Weisberg Reference Weisberg2006) explain analogical transfer as involving the use of conceptual knowledge from a familiar domain (base) and applying it to create knowledge in a domain with similar structure (target): analogical transfer exploits past knowledge in both the base and target domains. The analogies utilized can be local, regional, or remote, depending on surface and structural similarities between objects involved in the base and target domains. Weisberg discusses the example of the Wright brothers using several analogical transfers to first recognize and solve the problem of flight control. First, they viewed flying as being similar to biking in which the rider has to be actively involved in controlling the bike, an application of regional analogy. Interestingly, many others attempting to design artifacts for flying did not access this regional analogy and thus did not even identify the key control problem. Second, the Wright brothers studied birds to see how they controlled themselves during flight, and learned that they adjusted their position about the rolling axis using their wing tips. From this insight, they had the idea of using similar moving surfaces, another instance of using regional analogy. Lastly, they developed the idea of warping the wings, demonstrated by using a twisted cardboard box, to act like vanes of windmills to make the airplane roll. The use of three analogical transfers in combination to see and solve the flight control problem is a clear case of analogical transfer but there is also evidence (cited earlier in this paragraph) of much wider applicability.
There are more abstract versions of combinatorial analogical transfer that have been proposed in the wider literature. Based on an extensive historical study of mechanical inventions and drawing insights from Gestalt psychology, Usher (Reference Usher1954) proposed a cumulative synthesis approach for creation of inventions. The notion of bisociation (Koestler Reference Koestler1964; Dasgupta Reference Dasgupta1996) develops the cumulative synthesis approach further and says that a new inventive idea is ideated combining disparate ideas. More recently, Fleming (Reference Fleming2001), Arthur (Reference Arthur2007) have respectively used the same combinatorial notions of invention in studying technological change. Other research in the technological change literature also discusses a related concept that is usually called ‘spillover’. Rosenberg (Reference Rosenberg1982) showed that such technological spillover greatly impacted the quantity and quality of technological change in the United States in the 20th century – a result supported by Nelson & Winter (Reference Nelson and Winter1982), Ruttan (Reference Ruttan2001). Indeed, a recent paper by Nemet & Johnson (Reference Nemet and Johnson2012) states that ‘one of the most fundamental concepts in innovation theory is that important inventions involve the transfer of knowledge from one technical area to another’. We note that these descriptions do not always make a clear distinction regarding whether the transfer is occurring at the idea level or at the artifact level. They are silent regarding how and from where designers or inventors get their disparate ideas to combine and regarding details about the complexities of transfer and combination.
Analogical transfer of ideas as a broad mechanism and expertise as the foundation of ideas (Weisberg Reference Weisberg2006) provides adequate specificity for modeling science and invention in this paper. Weisberg contends that analogical transfer is utilized in generation of both scientific and technological knowledge. Vincenti (Reference Vincenti1990), Mokyr (Reference Mokyr2002) take the view that scientific and technological knowledge can be classified into descriptive (Understanding) and prescriptive (Operations) knowledgeFootnote 1 regimes. The Understanding regime can be seen as a body of ‘what’ knowledge and includes scientific principles and explanations, natural regularities, materials properties and physical constants. A unit of understanding (UOU) is falsifiable (Popper Reference Popper1959) and enables explanation and prediction about specific phenomena, including behavior of artifacts. The Operations regime, on the other hand, can be viewed as a body of ‘design knowledge’, which suggests how to leverage natural ‘effects’ (Arthur Reference Arthur2007; Vincenti Reference Vincenti1990) to achieve a technological advantage or purpose. It includes operating principles, design methods, experimental methods and tools (Vincenti Reference Vincenti1990; Dasgupta Reference Dasgupta1996). Based on this distinction, understanding enables generation of operational knowledge, which ultimately contributes towards design of some artifact. However, operations is not entirely based upon existing understanding and in fact innovations in know-how can and often do occur before any understanding of related natural effects is available.
An important aspect of design and invention is the cooperative interaction between Understanding and Operations regimes (Musson Reference Musson and Musson1972; Musson & Robinson Reference Musson and Robinson1989). Using a historical perspective, Mokyr (Reference Mokyr2002) has carefully observed that a synergistic exchange between the two has been occurring, where each enables the other. The contribution of Understanding to Operations is well known: it provides principles, and regularities of natural effects, including new ones, in the form of predictive equations, and descriptive facts, such as material properties. Fleming & Sorenson (Reference Fleming and Sorenson2004) provide evidence that understanding helps inventors by providing a richer map to search for operating ideas, which can be combined together. Understanding also provides insight about where new technological opportunities may be found (Klevorick et al. Reference Klevorick, Levin, Nelson and Winter1995). Beyond these contributions, there is the more general view, discussed in the initial paragraph of this section, that new operational ideas can be derived from new understanding.Footnote 2 What is less discussed is the multi-faceted contributions of Operations to the Understanding regime. In his paper, Sealing wax and string, de Solla Price (Reference de Solla Price1986), a physicist, and historian of science, highlighted that instruments (an output of the Operations regime) were a dominant force in enabling scientific revolutions. He states: ‘changes in paradigm that accompany great and revolutionary changes (in science) were caused more often by application of technology to science, rather than changes from ‘putting on a new thinking cap’. ‘Operations provide tools and instruments to make measurements, and to make new discoveries. In his book, The Scientist: A History of Science Told Through the Lives of its Greatest Inventors, Gribbin (Reference Gribbin2002), a British astrophysicist, and science writer, has described how the ability to grind eyeglass lenses made it possible to make better telescopes, and hence paved the way for astronomers to make new discoveries. New or improved observational techniques are still a major driver of progress in science. Gribbin has aptly summarized the enabling exchange between the two regimes: ‘new scientific ideas leading…to improved technology and new technology providing scientists with the means to test new ideas to greater and greater accuracy’. In addition, the Operations regime provides new problems for the Understanding regime to study, and has led to birth of new fields in Understanding (Hunt Reference Hunt2010). Based upon these insights and with our focus on explaining performance improvement arising from continuing streams of inventions, our model treats mutual exchange between Understanding and Operations.
In design of artifacts, Simon (Reference Simon1962) introduced the notion of interactions in his essay on the complexity of artifacts. When a design of an artifact is changed from one state to another (with differences between the two states as defined by multiple attributes, say D1, D2 and D3) by taking some actions (say A1, A2 and A3), in many cases, any specific action taken may affect more than one attribute, thus potentially manifesting as interactions of the attributes. The same notion of interaction/conflicts is captured by the concept of coupling of functional requirements (Suh Reference Suh2001), or dependencies between characteristics (Weber & Deubel Reference Weber and Deubel2003), which can occur when two or more functional requirements are influenced by a design parameter. Theoretically it seems ideal to have one design parameter controlling one functional requirement to achieve a fully decomposable (modular) design (Suh Reference Suh2001; Baldwin & Clark Reference Baldwin and Clark2000). However, Whitney (Reference Whitney1996, Reference Whitney2004) has argued that, in reality, how decomposable a design of an artifact can be depends on the physics involved or additional constraints, such as permissible mass. These are reflected as component-to-component, and component-to-system interactions, or as a need to have multi-functional components. Consequently, Whitney argues, complex electro-mechanical-optical (CEMO) systems, primarily designed to carry power, cannot be made as decomposable as very-large-scale integration (VLSI) systems primarily designed to transmit and transform information. For example, in energy applications, the impedance of transmitting and receiving elements has to be matched for maximum power transfer, thus making the two elements coupled. Further, CEMO systems typically need to have multi-functional components in order to keep the artifact size reasonable, creating coupling of attributes at the component level. Another type of interaction Whitney has identified are the side effects, such as waste heat in computers, and corrosion of electrodes in batteries – that occur in artifacts, which in some electro-mechanical systems can consume significant portion of the design effort for their mitigation. The presence, and thus the resolution, of these different interactions cause significant delay, consume significant engineering resources and potentially stop applications of some concepts, thus making the level of interactions of a technological domain a potentially strong factor influencing its rate of improvement. Based upon Whitney’s work, the effect of interactions on rates of improvement was suggested qualitatively by Koh & Magee (Reference Koh and Magee2008) and a quantitative model of the effect was developed by McNerney et al. (Reference McNerney, Farmer, Redner and Trancik2011) – see Section 2.3.
The influence of design parameters on artifact performance is an essential part of design knowledge. Many technological domains have complex mathematical equations relating some aspects of performance with design parameters. Indeed, the so-called engineering science literature has such equations for many aspects affecting the design of artifacts of perhaps all technological domains. Simpler relationships concerning the geometrical scale of artifacts are also available and generally give performance metrics as a function of a design variable raised to a power. Use of power-law relationships can be found in: (1) Sahal (Reference Sahal1985) who studied scaling in three different sets of artifacts – airplanes, tractors and computers; and (2) Gold (Reference Gold1974) who demonstrated that doubling the size of a blast furnace reduces their cost by about 40 %. The constant percent change per doubling in size results from the power law (assumed by Gold) between performance/cost and geometrical variables such as volume.
2.2 Technological change literature
What descriptive models and theories help us understand why technologies improve and how the improvement patterns are structured? Schumpeter (Reference Schumpeter1934) introduced the idea that entrepreneurs, whose primary role is to provide improved products and services through innovation, drive economic progress. These innovations, which Schumpeter describes as industrial mutations, displace competing products and services from the economy. However, they, too, are displaced by higher performing innovations that follow, thus perpetuating the cycle of creative destruction. Building upon Schumpeter’s notion, Solow (Reference Solow1956) recognized and incorporated technological change as the key element in his quantitative explanatory theory of economic growth. The basic conclusion that technological change is the foundation of sustained economic growth has stood the test of time. Later, theorists of economic growth (Arrow Reference Arrow1962; Romer Reference Romer1990; Acemoglu Reference Acemoglu2002) have attempted to deal with the more complex problem of embedding technological change within the economy (endogenous to different degrees). Although the later theories are important, the issues are outside the scope of this paper and will not be covered here. A related question of demand-pull and technology push does have more relevance.
What drives technological innovation? Some early explanations emphasized pure demand push (Carter & Williams Reference Carter and Williams1957, Reference Carter and Williams1959; Baker, Siegman & Rubenstein Reference Baker, Siegman and Rubenstein1967; Myers & Marquis Reference Myers and Marquis1969; Langrish et al. Reference Langrish, Gibbons, Evans and Jevons1972; Utterback Reference Utterback1974) where the needs of the economy at a given time dictate technological direction. Mowery & Rosenberg (Reference Mowery and Rosenberg1979) reanalyzed the data and methodology in this early work and arrived at a strong role for science/technology push (the discoveries of scientists and inventors primarily determine technological direction). Taking a balanced view, Dosi (Reference Dosi1982) argued that both market pull (customer needs and potential for profitability) and technology push (in the form of promising new technology, and the underpinning procedures) are equally important for being sources of innovation.
Tushman & Anderson (Reference Tushman and Anderson1986) discuss discontinuities as having large socio-technical effects and note that such discontinuities are an essential element of technological change. In another highly referenced paper, Henderson & Clark (Reference Henderson and Clark1990) emphasize the importance of architectural change of artifacts – as opposed to component change – having large effects on the firm-level impact of change. Christensen & Bower (Reference Christensen and Bower1996), on the other hand, view technological change occurring as a series of disruptive product innovations that start in a niche market catering to different functional requirements, but then rapidly improve towards the requirements of mainstream performance. The disruptive technology surpasses the mature market leaders (by achieving the necessary performance in smaller, cheaper artifacts), and displaces them.
All of the concepts of technological change described in the preceding paragraphs – at least implicitly – depend upon relative rates of change of performance. This is the focus of our modeling effort, so we will now briefly review concepts related to trends in performance of designed artifacts, and what patterns they have followed. We first review two established frameworks – generalizations of Wright’s early research, and Moore’s Law – for describing trends in technological performance. In 1936, Wright (Reference Wright1936) in his seminal paper ‘Factors affecting the Cost of Airplanes’ for the first time introduced the idea of measuring technological progress of artifacts. From his empirical study of airplane manufacturing, he demonstrated that labor cost or total cost of specific airplane designs decreased as a power law against their cumulative production. This relationship is expressed as:
 $$\begin{eqnarray}C=C_{0}P^{-w},\end{eqnarray}$$
where
 $C_{0}$
, and
$C_{0}$
, and
 $C$
are unit cost of the first, and subsequent airplanes respectively, and where
$C$
are unit cost of the first, and subsequent airplanes respectively, and where
 $P$
and
$P$
and
 $w$
are cumulative production and its exponent that relates it to unit cost. Wright explains that labor cost reductions are realized as shop floor personnel gain experience with the manufacturing processes, and material usage and have access to better production tools. Since Wright’s work, this approach has been used to study production of airplanes and ships during World War II, and extended to private enterprises (Yelle Reference Yelle2007). It should be noted that Wright did not look at improvement due to new designs; instead he only considered improved manufacturing of a fixed design.
$w$
are cumulative production and its exponent that relates it to unit cost. Wright explains that labor cost reductions are realized as shop floor personnel gain experience with the manufacturing processes, and material usage and have access to better production tools. Since Wright’s work, this approach has been used to study production of airplanes and ships during World War II, and extended to private enterprises (Yelle Reference Yelle2007). It should be noted that Wright did not look at improvement due to new designs; instead he only considered improved manufacturing of a fixed design.
Moore (Reference Moore1965) presented the second approach – using time as the independent variable and investigating a series of newly designed artifacts – in his seminal paper that describes improvement of integrated circuits. He observed that the number of transistors on a die was doubling roughly every 18 months (modified to 2 years in 1975). This exponential relationship between the number of transistors on a die and time, famously knownFootnote 3 as Moore’s Law, can be mathematically expressed as:
 $$\begin{eqnarray}Q_{\!J}(t)=Q_{\!J}(t_{0})\exp \{K_{\!J}(t-t_{0})\},\end{eqnarray}$$
where
 $Q_{\!J}(t_{0})$
and
$Q_{\!J}(t_{0})$
and
 $Q_{\!J}(t)$
are the number of transistors per die (a measure of performance) at time
$Q_{\!J}(t)$
are the number of transistors per die (a measure of performance) at time
 $t_{0}$
and time
$t_{0}$
and time
 $t$
, and
$t$
, and
 $K_{\!J}$
is the rate of improvement (annual if time is in years). For integrated circuits, the exponential relationship has held broadly true for five decades. Others (Girifalco Reference Girifalco1991; Nordhaus Reference Nordhaus1996; Koh & Magee Reference Koh and Magee2006, Reference Koh and Magee2008; Lienhard Reference Lienhard2008) utilized this temporal approach to study performance of different technologies, and have demonstrated that many technologies exhibit exponential behavior with time. More recently, Magee et al. (Reference Magee, Basnet, Funk and Benosn2014) extended the study to 73 different performance metrics in 28 different technology domains. The performance curves have continued to demonstrate exponential behavior, although annual rates vary widely across domains but not across different metrics for a single domain. We note that Moore and all others who used his framework basically compared the performance of different designs over time differentiating the Wright and Moore frameworks. However, it is also possible to use the Wright framework for different designs, but only if the amount produced increases exponentially with time (Sahal Reference Sahal1979; Nagy et al.
Reference Nagy, Farmer, Bui and Trancik2013; Magee et al.
Reference Magee, Basnet, Funk and Benson2016).
$K_{\!J}$
is the rate of improvement (annual if time is in years). For integrated circuits, the exponential relationship has held broadly true for five decades. Others (Girifalco Reference Girifalco1991; Nordhaus Reference Nordhaus1996; Koh & Magee Reference Koh and Magee2006, Reference Koh and Magee2008; Lienhard Reference Lienhard2008) utilized this temporal approach to study performance of different technologies, and have demonstrated that many technologies exhibit exponential behavior with time. More recently, Magee et al. (Reference Magee, Basnet, Funk and Benosn2014) extended the study to 73 different performance metrics in 28 different technology domains. The performance curves have continued to demonstrate exponential behavior, although annual rates vary widely across domains but not across different metrics for a single domain. We note that Moore and all others who used his framework basically compared the performance of different designs over time differentiating the Wright and Moore frameworks. However, it is also possible to use the Wright framework for different designs, but only if the amount produced increases exponentially with time (Sahal Reference Sahal1979; Nagy et al.
Reference Nagy, Farmer, Bui and Trancik2013; Magee et al.
Reference Magee, Basnet, Funk and Benson2016).
In order to clarify for readers the nature of empirical performance data, we present performance data for two sample domains, magnetic resonance imaging (MRI) and electric motors (Figure 1a), and a summary of improvement rates for 28 domains (Figure 1b) from Magee et al.
Reference Magee, Basnet, Funk and Benson2016. The exponential trend for each domain can be described by Eq. (2), where
 $Q_{\!J}(t)$
and
$Q_{\!J}(t)$
and
 $Q_{\!J}(t_{0})$
are the intensive performance of an artifact in domain
$Q_{\!J}(t_{0})$
are the intensive performance of an artifact in domain
 $J$
at time
$J$
at time
 $t$
and
$t$
and
 $t_{0}$
, and
$t_{0}$
, and
 $K_{\!J}$
is the annual rate of improvement of the domain in question.
$K_{\!J}$
is the annual rate of improvement of the domain in question.
(a) Exponential growth of performance in sample domains – electric motor and magnetic resonance imaging (MRI). Adapted from Magee et al.
Reference Magee, Basnet, Funk and Benson2016. (b) Annual rate of performance improvement,
 $K_{\!J}$
, for 28 domains. Adapted from Magee et al.
Reference Magee, Basnet, Funk and Benson2016.
$K_{\!J}$
, for 28 domains. Adapted from Magee et al.
Reference Magee, Basnet, Funk and Benson2016.

A recent paper (Benson & Magee Reference Benson and Magee2015a
) has empirically investigated the variation of the improvement rates in these 28 domains. The work has important relationships to the current work, so we describe it to not only note the relationships but to also clarify the fundamental differences. Benson and Magee found strong correlations between specific meta-characteristics of the patents in the 28 domainsFootnote
4
and the improvement rate in the domains. These authors found that patent meta-characteristics reflecting the importance (citations per patent by other patents), recency (age of patents in a domain) and immediacy (the average over time of the usage of current new knowledge in the domain) are all correlated with the improvement rate. They found a particularly strong correlation
 $(r=0.76,p=2.1\times 10^{-6})$
with a metric that combines immediacy and importance (the average number of citations that patents in the domain receive in their first 3 years). The findings (and associated multiple regressions) are robust over time and with domain selection and are of practical importance in predicting technological progress in domains where performance data is not available (Benson & Magee Reference Benson and Magee2015a
). Nonetheless, the conceptual basis for the findings is observed attributes of the inventive output from a technological field (importance, recency and immediacy of a patent set) and not the process of invention, design knowledge or other technical aspects of designed artifacts in the domain. The aim of the work reported in the present paper is to develop a model that yields insights about the pace of change without recourse to concepts based upon observation of the output over time. If fully successful, we would be able to judge the potential for change based only upon the nature of the design knowledge and we might even be able to find new approaches that might achieve technological goals at more rapid improvement rates.
$(r=0.76,p=2.1\times 10^{-6})$
with a metric that combines immediacy and importance (the average number of citations that patents in the domain receive in their first 3 years). The findings (and associated multiple regressions) are robust over time and with domain selection and are of practical importance in predicting technological progress in domains where performance data is not available (Benson & Magee Reference Benson and Magee2015a
). Nonetheless, the conceptual basis for the findings is observed attributes of the inventive output from a technological field (importance, recency and immediacy of a patent set) and not the process of invention, design knowledge or other technical aspects of designed artifacts in the domain. The aim of the work reported in the present paper is to develop a model that yields insights about the pace of change without recourse to concepts based upon observation of the output over time. If fully successful, we would be able to judge the potential for change based only upon the nature of the design knowledge and we might even be able to find new approaches that might achieve technological goals at more rapid improvement rates.
2.3 Literature on quantitative modeling of technological change
What research has attempted to model the technological performance trends that we just discussed? Muth (Reference Muth1986) and Auerswald et al. (Reference Auerswald, Kau, Lobo and Shell2000) have developed models to explain Wright’s results by introducing the notion of search for technological possibilities. Each paper assumes that random search, a key element of technological problem solving, for a better technique is made within a fixed population of possibilities. Considering a case of a single manufacturing process, Muth (Reference Muth1986) developed a model to capture the idea of substituting manufacturing sequences with better ones. He argues that shop personnel improve the process by learning through experience and making random search for new techniques, which enable improvement of processes leading to cost reductions. Muth demonstrated that the notion of fixed possibilities easily leads to fewer and fewer improvements that can be realized and he argues that the data (for fixed designs) shows a leveling off and eventual stoppage as the model suggests. Building on Muth’s idea of random search within a set of fixed design possibilities, Auerswald et al. modeled a multi-process system, in which different processes can be combined to create diverse recipes, and for the first time introduced the notion of interactions by allowing adjoining processes to affect each other’s cost.
Following similar reasoning as Muth and Auerswald et al., McNerney et al. (Reference McNerney, Farmer, Redner and Trancik2011) have developed a stochastic model to explain how the cost reduction of a multi-component system is influenced by component interactions, which they refer to as connectivity between components. McNerney et al. operationalized the notion of interactions as outlinks representing influence of a component on other components. When a specific component in a domain artifact changes by introducing a new operational idea, the change affects the design of all the components it influences. If the performance of the artifact (influencing and influenced components) as a whole improves, then McNerney et al. consider the interactions to be resolved and the operating idea is considered successful. The McNerney et al. paper demonstrates that artifacts with more interactions improve more slowly than artifacts with less interactions.
Using agent-based modeling, Axtell et al. (Reference Axtell, Casstevens, Hendrey, Kennedy and Litsch2013) have developed a competitive micro-economic model of technological innovation utilizing the notion of technological fitness. Although they do not discuss or cite Moore’s law or his work, they have demonstrated that cumulative technological fitness of all agents increases exponentially overtime. This is different from other researchers who have predominantly been focused on Wright’s framework. Consistently, Axtell et al. consider new designs and not just process optimization.
Using a simulation approach, Arthur & Polak (Reference Arthur and Polak2006) have modeled how new generations of artifacts arise by combining currently available artifacts. The artifacts considered are electronic logic gates. New designs (combinations) are more complex logic gates that can then also be combined into even more complex logic gates. In their model, Arthur and Polak specify several design goals towards which the logic gates evolve. They have demonstrated that designs with higher levels of complexity cannot be attained without realizing design configurations with intermediate levels of complexity, and new designs with higher functionality substitute for current designs with inferior functionality. This model is much richer than other models in representing the artifact part of the design process; however, it does not consider performance improvement, as do the other models. It is also limited to developing pre-specified artifacts and is thus a specific process; consequently it is not open-ended or general which are characteristics necessary for modeling performance trends for general technological domains.
Although some are more explicit than others, one feature common to all these models is that all utilize the notion of building upon the performance (in the form of cost) or designs of the past, a key feature of cumulative processes included in the model presented here. On the other hand, they do not consider three aspects we believe essential for answering our research question; thus, these three factors differentiate our model from this relevant past work. First, none of them discusses or includes the influential role played by exchange between science and technology. In this paper, we treat the design process and the exchange between science and technology as important elements for understanding the change in performance over time that in turn is essential to understanding technological change. Second, none consider the design process or operating principles as part of combinatorial analogical transfer – they instead look at combinations at the artifact level instead of combination of ideas. In this paper, we consider both the idea and artifact regimes in developing our model. Third, no prior model has considered (or modeled) the role of scaling of design parameters on performance. In this paper, scaling is introduced and the resulting model results in scaling having an important predicted influence on the rate of performance improvement.
3 Overview of the model
3.1 Conceptual basis of model
We utilize two sets of mechanisms from design to construct the overall model. The first set, which gives rise to exponential trends, includes growth of knowledge – understanding and operations – using combinatorial analogical transfer aided with mutual exchange between the two. The second set, which gives rise to variation in improvement rates, includes component interactions and scaling of design variables. Since the goal of the model is to develop an explanatory and quantitative predictive model, while modeling these mechanisms we have, where necessary, simplified (removed details) and utilized abstraction to keep the model tractable.
Model of exchange between Understanding and Operations regimes and modulation of IOI assimilation by interaction
 $(d_{J})$
and scaling
$(d_{J})$
and scaling
 $(A_{\!J})$
parameters of domain
$(A_{\!J})$
parameters of domain
 $J$
.
$J$
.

The overall architecture of the model is shown in Figure 2. Based on the work of Vincenti (Reference Vincenti1990) and Mokyr (Reference Mokyr2002) that we discussed earlier, we classify scientific and technical knowledge into Understanding and Operations regimes. We further split the Operations regime into idea and artifact sub-regimes where non-physical representation of artifacts are in the idea sub-regime. The idea sub-regime, represented as an ideas pool, consists of individual operating ideas (IOI). The IOI concept is an abstraction and generalizes the idea of operating principle introduced by Polanyi (Reference Polanyi1962) and includes any ideas, including operating principles, invention claims, design structures, component integration tricks, trade secrets and other design knowledge that lead to performance improvement of artifacts. An IOI is different from a UOU which includes scientific principles, and factual information. An example of a UOU is the principle of total internal reflection, which describes how a beam of light undergoes reflection inside a dense medium, when the angle of incidence is above a critical value (see Figure 3). This principle accurately describes a natural effect, but it does not prescribe how we can use it to transmit information. On the other hand, a pair of parallel surfaces (or a fiber) enclosing a dense medium and utilizing the principle of total internal reflection provides a mechanism – an operating principle – to make a ray of light travel down the length of the medium (see Figure 3). Such a mechanism is an example of an IOI. Unlike artifacts, which belong to a specific technological domain, we model IOI in the ideas (IOI) pool as being non-domain specific and available to all technological domains. For instance, the operating principle of total internal reflection is utilized in fiber optic telecommunications, fluorescent microscopy, and fingerprinting, very distinct technological domains. In the idea sub-regime, designers/inventors source existing ideas (IOI) using analogical transfer and combine them probabilistically to create new ideas (IOI). Once new IOI are successfully created through probabilistic combination, they become part of the IOI pool, thus enlarging the number of ideas (IOI) in the pool for combination. It is important to clarify that model considers combinations at the ideas level rather than combination of components, with the former being fundamental and allowing combination of ideas from different fields using analogical transfer according to the ideas of Weisberg described earlier.
Examples of unit of understanding (UOU) and incremental operating idea (IOI).

Growth in the explanatory reach of the Understanding regime also occurs by the analogical transfer process described by, and also applied to, scientific creativity by Weisberg. The Understanding regime is conceptualized to consist of UOU. The units of understanding (UOU) from different fields within the understanding regime participate to create a new UOU that potentially (probabilistically) has a greater level of explanatory and predictive power. Following the treatment in Axtell et al. (Reference Axtell, Casstevens, Hendrey, Kennedy and Litsch2013), we model the explanatory and predictive power of a field of Understanding as a fitness parameter,
 $f_{i}$
. If the new UOU has a greater fitness value, it replaces the UOU with the smallest fitness value. Since our primary focus is on performance – the output of the Operations regime, we simulate the Understanding regime only at this higher abstraction level.
$f_{i}$
. If the new UOU has a greater fitness value, it replaces the UOU with the smallest fitness value. Since our primary focus is on performance – the output of the Operations regime, we simulate the Understanding regime only at this higher abstraction level.
Although both regimes – Understanding and Operations – evolve independently, they cannot do so indefinitely. We model the de Solla Price and Gribbin insights by having each regime act as a ‘barrier breaker’ for the other regime. When each regime hits a barrier, the other can eventually aid in breaking the barrier: infusion of understanding enables creation of important IOI in the Operations regime; and infusion of new operational tools enable new discoveries in the Understanding regime.
The performances of the artifacts in technological domains are improved by a series of designs/inventions (IOI) over time. IOI enable designers to change specific components in the domain artifact leading to a potential improvement. Following McNerney et al.’s treatment, the IOI in question is assimilated only if the performance of the artifact improves after accounting for interactions.
Another, and final, factor that we model is scaling, a property inherent in the physics of the design of the artifact.Footnote
5
Footnote
6
The successfully assimilated IOI, which we refer to as
 $\text{IOI}_{S}$
, effect improvement of the domain artifact by enabling favorable change of a relevant design parameter. The design parameter is increased or decreased such that it leads to improved performanceFootnote
7
. Scaling refers to how change in a design parameter relates to relative change in the performance of an artifact. The formulation we use in the model is that relative performance change is related to design parameters raised to some power, in other words scaled. As covered in Section 2.1, this is the most widely used functional relationship with decent empirical support and theoretical justification in some cases (Barenblatt Reference Barenblatt1996).
$\text{IOI}_{S}$
, effect improvement of the domain artifact by enabling favorable change of a relevant design parameter. The design parameter is increased or decreased such that it leads to improved performanceFootnote
7
. Scaling refers to how change in a design parameter relates to relative change in the performance of an artifact. The formulation we use in the model is that relative performance change is related to design parameters raised to some power, in other words scaled. As covered in Section 2.1, this is the most widely used functional relationship with decent empirical support and theoretical justification in some cases (Barenblatt Reference Barenblatt1996).
3.2 Mathematical summary
A performance (intensive) metric of a domain, labeled
 $Q_{\!J}$
, is a function of a set of design parameters
$Q_{\!J}$
, is a function of a set of design parameters
 $(s_{1},s_{2},s_{3})$
of a domain artifact and time, but for simplicity here we consider only a single parameter
$(s_{1},s_{2},s_{3})$
of a domain artifact and time, but for simplicity here we consider only a single parameter
 $(s)$
. The design parameter is changed by
$(s)$
. The design parameter is changed by
 $\text{IOI}_{s}$
(successfully assimilated IOI into domain artifacts), which in turn are assimilated from
$\text{IOI}_{s}$
(successfully assimilated IOI into domain artifacts), which in turn are assimilated from
 $\text{IOI}_{C}$
(number of accumulated operating ideas in the IOI pool shown in Figure 2).
$\text{IOI}_{C}$
(number of accumulated operating ideas in the IOI pool shown in Figure 2).
 $\text{IOI}_{C}$
is a function of time. Equations describing these nested variables in logarithmic form are:
$\text{IOI}_{C}$
is a function of time. Equations describing these nested variables in logarithmic form are:
 $$\begin{eqnarray}\displaystyle & \ln Q_{\!J}=f_{1}(\ln s);\quad \ln s=f_{2}(\ln \text{IOI}_{SC}); & \displaystyle \nonumber\\ \displaystyle & \ln \text{IOI}_{SC}=f_{3}(\ln \text{IOI}_{C});\quad \ln \text{IOI}_{C}=f_{4}(t). & \displaystyle\end{eqnarray}$$
Assuming that the functions are continuous and all dependence is through the named variables, the chain rule is applied and yields
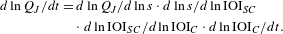 $$\begin{eqnarray}\displaystyle d\ln Q_{\!J}/dt & = & \displaystyle d\ln Q_{\!J}/d\ln s\cdot d\ln s/d\ln \text{IOI}_{SC}\nonumber\\ \displaystyle & & \displaystyle \cdot \;d\ln \text{IOI}_{SC}/d\ln \text{IOI}_{C}\cdot d\ln \text{IOI}_{C}/dt.\end{eqnarray}$$
The first term on the right hand side represents relative impact of design variable change on performance change, which will be shown in Section 4.5 to be equal to the scaling parameter
 $(A_{\!J})$
when
$(A_{\!J})$
when
 $Q_{\!J}$
follows a power law in
$Q_{\!J}$
follows a power law in
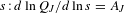 $s\,:\,d\ln Q_{\!J}/d\ln s=A_{\!J}$
. The second term is the ‘smaller-is-better/larger-is-better’ factor, and captures the notion whether a design variable has to be increased or decreased in order to improve performance. We capture this dependence using an abstraction and equate
$s\,:\,d\ln Q_{\!J}/d\ln s=A_{\!J}$
. The second term is the ‘smaller-is-better/larger-is-better’ factor, and captures the notion whether a design variable has to be increased or decreased in order to improve performance. We capture this dependence using an abstraction and equate
 $d\ln s/d\ln \text{IOI}_{SC}=\pm 1$
. Thus, Eq. (4) becomes
$d\ln s/d\ln \text{IOI}_{SC}=\pm 1$
. Thus, Eq. (4) becomes
 $$\begin{eqnarray}d\ln Q_{\!J}/dt=A_{\!J}\cdot (\pm 1)\cdot d~\ln \text{IOI}_{SC}/d~\ln \text{IOI}_{C}\cdot d~\ln \text{IOI}_{C}/dt.\end{eqnarray}$$
The third term on the right of Eq. (5) represents ‘difficulty of implementing ideas’ in specific domains, and thus relates the domain specific successful
 $\text{IOI}_{SC}$
to the
$\text{IOI}_{SC}$
to the
 $\text{IOI}_{C}$
in the pool: we will show in Section 4.4 – following McNerney et al. – that
$\text{IOI}_{C}$
in the pool: we will show in Section 4.4 – following McNerney et al. – that
 $d\ln \text{IOI}_{SC}/d~\ln \text{IOI}_{C}=1/d_{J}$
, where
$d\ln \text{IOI}_{SC}/d~\ln \text{IOI}_{C}=1/d_{J}$
, where
 $d_{J}$
is the interaction parameter introduced by McNerney et al. for technological domain
$d_{J}$
is the interaction parameter introduced by McNerney et al. for technological domain
 $J$
. Finally, the fourth term represents the rate of idea production.
$J$
. Finally, the fourth term represents the rate of idea production.
 $K=d~\ln \text{IOI}_{C}/dt$
is arrived at by a simulation of combinatorial analogical transfer which is presented in the first (following) section of the results.
$K=d~\ln \text{IOI}_{C}/dt$
is arrived at by a simulation of combinatorial analogical transfer which is presented in the first (following) section of the results.
Combination of individual operating ideas (a) basic and derived IOI (b) accumulation of IOI through feedback.

4 Results
4.1 Overall IOI simulation
As noted in Section 3.1, we model the IOI as resulting from combining knowledge from prior IOI by probabilistic analogical transfer. Figure 4(a) schematically represents combination of IOI, in which specific IOI a and b combine to create IOI d with a probability,
 $P_{\text{IOI}}$
. If this combination attempt succeeds, the newly created IOI d then is added to the pool of IOI (Figure 4b). In subsequent time steps, IOI d can attempt to combine with another specific IOI in the pool, such as IOI c, to probabilistically create a more advanced IOI e. As combination advances, the cumulative number of IOI,
$P_{\text{IOI}}$
. If this combination attempt succeeds, the newly created IOI d then is added to the pool of IOI (Figure 4b). In subsequent time steps, IOI d can attempt to combine with another specific IOI in the pool, such as IOI c, to probabilistically create a more advanced IOI e. As combination advances, the cumulative number of IOI,
 $\text{IOI}_{C}$
grows. We further make the distinction between derived IOI and basic IOI, which we label as
$\text{IOI}_{C}$
grows. We further make the distinction between derived IOI and basic IOI, which we label as
 $\text{IOI}_{0}$
.
$\text{IOI}_{0}$
.
 $\text{IOI}_{0}$
are fundamental IOI, which first introduce a natural effect into an operational principle to achieve some purpose. The example (described in Section 3.1) of a pair of close parallel surfaces (or a fiber) enclosing a dense medium and utilizing principle of total internal reflection to transmit a beam of light longitudinally can be viewed as an example of an
$\text{IOI}_{0}$
are fundamental IOI, which first introduce a natural effect into an operational principle to achieve some purpose. The example (described in Section 3.1) of a pair of close parallel surfaces (or a fiber) enclosing a dense medium and utilizing principle of total internal reflection to transmit a beam of light longitudinally can be viewed as an example of an
 $\text{IOI}_{0}$
. In contrast, derived IOI, just as the term suggests, are obtained through combination of two
$\text{IOI}_{0}$
. In contrast, derived IOI, just as the term suggests, are obtained through combination of two
 $\text{IOI}_{0}$
, or between an
$\text{IOI}_{0}$
, or between an
 $\text{IOI}_{0}$
and a derived IOI or between two derived IOI. In this sense, IOI a, b, and c in the figure represent
$\text{IOI}_{0}$
and a derived IOI or between two derived IOI. In this sense, IOI a, b, and c in the figure represent
 $\text{IOI}_{0}$
and IOI d and e, derived IOI.
$\text{IOI}_{0}$
and IOI d and e, derived IOI.
Growth of
 $\text{IOI}_{C}$
over time: initial
$\text{IOI}_{C}$
over time: initial
 $\text{IOI}_{0}=10$
, probability of combination,
$\text{IOI}_{0}=10$
, probability of combination,
 $P_{\text{IOI}_{0}}=0.25$
: (a) linear
$P_{\text{IOI}_{0}}=0.25$
: (a) linear
 $Y$
-axis (b) logarithmic
$Y$
-axis (b) logarithmic
 $Y$
-axis.
$Y$
-axis.

In one run of the simulation, we start with the initial number of basic IOI,
 $\text{IOI}_{0}$
. At each time step, the maximum number of combinations we allow to be created is equal to half the number of total IOI available. The intention is to allow each operating idea to combine with another operating idea once per time step on average. Figure 5 shows results from a simulation run starting with 10 basic IOI and a probability of combination,
$\text{IOI}_{0}$
. At each time step, the maximum number of combinations we allow to be created is equal to half the number of total IOI available. The intention is to allow each operating idea to combine with another operating idea once per time step on average. Figure 5 shows results from a simulation run starting with 10 basic IOI and a probability of combination,
 $P_{\text{IOI}_{0}}$
equal to 0.25. Figure 5a and 5b with time steps on the X-axis and the cumulative number of operating ideas,
$P_{\text{IOI}_{0}}$
equal to 0.25. Figure 5a and 5b with time steps on the X-axis and the cumulative number of operating ideas,
 $\text{IOI}_{C}$
on the Y-axis show that the cumulative number of operating ideas,
$\text{IOI}_{C}$
on the Y-axis show that the cumulative number of operating ideas,
 $\text{IOI}_{C}$
, grows exponentially with time at an improvement rate
$\text{IOI}_{C}$
, grows exponentially with time at an improvement rate
 $(K)$
of
$(K)$
of
 $0.116\pm 0.005$
.
$0.116\pm 0.005$
.
For this simplified case, the rate of growth of IOI,
 $K$
, can be mathematically shown to be equal to
$K$
, can be mathematically shown to be equal to
 $\ln (1+P_{\text{IOI}}/2),=0.118$
which can be easily derived as follows:
$\ln (1+P_{\text{IOI}}/2),=0.118$
which can be easily derived as follows:
 $$\begin{eqnarray}\displaystyle & \text{At time step }t,\text{number of IOI newly created}=P_{\text{IOI}}\cdot \text{IOI}_{C}(t)/2 & \displaystyle\end{eqnarray}$$
 $$\begin{eqnarray}\displaystyle & \text{IOI}_{C}(t+1)=\text{IOI}_{C}(t)+P_{\text{IOI}}\cdot \text{IOI}_{C}(t)/2=\text{IOI}_{C}(t)\cdot (1+P_{\text{IOI}}/2) & \displaystyle\end{eqnarray}$$
 $$\begin{eqnarray}\displaystyle & \text{Ratio of}~\text{IOI}_{C}~\text{between consecutive time steps},r=\text{IOI}_{C}(t+1)/\text{IOI}_{C}(t) & \displaystyle \nonumber\\ \displaystyle & =(1+P_{\text{IOI}}/2) & \displaystyle\end{eqnarray}$$
Then, in general,
 $\text{IOI}_{c}(t)$
can be written in terms of an initial
$\text{IOI}_{c}(t)$
can be written in terms of an initial
 $\text{IOI}_{0}$
and ratio,
$\text{IOI}_{0}$
and ratio,
 $r$
and time step,
$r$
and time step,
 $t$
; the expression can be stated in an exponential form.
$t$
; the expression can be stated in an exponential form.
 $$\begin{eqnarray}\displaystyle \text{IOI}_{C}(t) & = & \displaystyle \text{IOI}_{0}r^{t}=\text{IOI}_{0}\exp \{\ln r\cdot t\}=\text{IOI}_{0}\cdot \exp \{\ln (1+P_{\text{IOI}}/2)\cdot t\}\nonumber\\ \displaystyle & = & \displaystyle \text{IOI}_{0}\cdot \exp \{k\cdot t\},\end{eqnarray}$$
where, the rate of growth of
 $\text{IOI}_{C}(t)$
,
$\text{IOI}_{C}(t)$
,
 $$\begin{eqnarray}K=\ln (1+P_{\text{IOI}}/2).\end{eqnarray}$$
For very small values of
 $P_{\text{IOI}}$
 $$\begin{eqnarray}\displaystyle K\approx P_{\text{IOI}}/2. & & \displaystyle\end{eqnarray}$$
The simulation results to this point assume that indefinitely large numbers of operating ideas, IOI, can be created out of few basic IOI. This is because the model assumes that the same operating ideas can be repeatedly used to create new IOI without limit. (For example, recombining (a,b) with a, then with b would give new operating IOI (((a,b),a),b) and eventually an arbitrarily large number of a, b pairs.) Indefinite multiple uses of the same basic idea to create innumerable IOI does not appear to be realistic. In order to better reflect this intuition, we introduce a constraint that any derived IOI can utilize an
 $\text{IOI}_{0}$
only once. The constraint operationalizes the notion that counting repetitious use of basic IOI as new designs that potentially improve performance is unrealistic. According to this constraint, derived IOI ((a,b),c) in Figure 4 would be allowed, but not ((a,b),b). Employing this constraint, the simulation yields the results in Figure 6(a), a semi-log graph, showing the cumulative number of IOI initially growing exponentially with time. However, later on the curve bends over and hits a limit, demonstrating that all combination possibilities have been used up, and the pool of operating ideas stagnates which is also shown on the linear plot (Figure 6b) resembling a well-known ‘S curve’.
$\text{IOI}_{0}$
only once. The constraint operationalizes the notion that counting repetitious use of basic IOI as new designs that potentially improve performance is unrealistic. According to this constraint, derived IOI ((a,b),c) in Figure 4 would be allowed, but not ((a,b),b). Employing this constraint, the simulation yields the results in Figure 6(a), a semi-log graph, showing the cumulative number of IOI initially growing exponentially with time. However, later on the curve bends over and hits a limit, demonstrating that all combination possibilities have been used up, and the pool of operating ideas stagnates which is also shown on the linear plot (Figure 6b) resembling a well-known ‘S curve’.
Growth of cumulative
 $\text{IOI}_{C}(t)$
after implementing the constraint that
$\text{IOI}_{C}(t)$
after implementing the constraint that
 $\text{IOI}_{0}$
can be used only once by any specific derived
$\text{IOI}_{0}$
can be used only once by any specific derived
 $\text{IOI}_{s}$
; (a) semi-log plot and (b) linear plot.
$\text{IOI}_{s}$
; (a) semi-log plot and (b) linear plot.

The maximum number of combination possibilities, which is a function of
 $\text{IOI}_{0}$
in the pool, defines the limit. This limit, or maximum number of combination possibilities, is given by a simple combinatorics equation (Cameron Reference Cameron1995):
$\text{IOI}_{0}$
in the pool, defines the limit. This limit, or maximum number of combination possibilities, is given by a simple combinatorics equation (Cameron Reference Cameron1995):
 $$\begin{eqnarray}\text{IOI}_{max}=2^{\text{IOI}_{0}}-1.\end{eqnarray}$$
Eq. (12) entails that the limit increases rapidly as
 $\text{IOI}_{0}$
increases, due to its geometric dependence on
$\text{IOI}_{0}$
increases, due to its geometric dependence on
 $\text{IOI}_{0}$
. For example, for
$\text{IOI}_{0}$
. For example, for
 $\text{IOI}_{0}$
equal to 5, 10, 15 and 20 the corresponding limits are 31, 1023 (Figure 6), 32767 and 1,048575 combination possibilities.
$\text{IOI}_{0}$
equal to 5, 10, 15 and 20 the corresponding limits are 31, 1023 (Figure 6), 32767 and 1,048575 combination possibilities.
A natural question that arises from this result is: what might determine the
 $\text{IOI}_{0}$
over time? We postulate a role for Understanding in this regard and we first briefly look at how Understanding evolves over time.
$\text{IOI}_{0}$
over time? We postulate a role for Understanding in this regard and we first briefly look at how Understanding evolves over time.
(a) Triangular distribution of possible fitness values that can be assumed by a new unit of understanding. (b) Growth of FU (cumulative fitness of Understanding regime) over time.

4.2 Combinatoric simulations for Understanding regime
Just like the Operations regime, we model the Understanding regime to also grow through a probabilistic analogical transfer process, in which UOU combine to create new UOU. In this model, we envision that the Understanding regime is composed of many fields, with each field having an explanatory reach. Using a treatment similar to the one used by Axtell et al. (Reference Axtell, Casstevens, Hendrey, Kennedy and Litsch2013), the explanatory reach of a field may be viewed as a fitness value of the theoretical understanding of that field, which we denote with
 $f_{i}$
. Following Axtell et al., when units from two fields with fitness values,
$f_{i}$
. Following Axtell et al., when units from two fields with fitness values,
 $f_{1}$
and
$f_{1}$
and
 $f_{2}$
, combine, the fitness of the resulting unit is randomly chosen from a triangular distribution with the base or X-axis denoting the fitness values ranging from 0 to
$f_{2}$
, combine, the fitness of the resulting unit is randomly chosen from a triangular distribution with the base or X-axis denoting the fitness values ranging from 0 to
 $f_{1}+f_{2}$
, and the apex representing the maximum value of the probability distribution function, given by
$f_{1}+f_{2}$
, and the apex representing the maximum value of the probability distribution function, given by
 $2/(f_{1}+f_{2})$
. See Figure 7a. If the resulting fitness of the new understanding unit is higher than the fitness of either of the two combining units, the new understanding unit replaces the unit whose fitness is the smallest among the three. We assume the cumulative fitness of the Understanding regime
$2/(f_{1}+f_{2})$
. See Figure 7a. If the resulting fitness of the new understanding unit is higher than the fitness of either of the two combining units, the new understanding unit replaces the unit whose fitness is the smallest among the three. We assume the cumulative fitness of the Understanding regime
 $(F_{U})$
as a whole to be equal to the sum of the individual fitness value of each field.
$(F_{U})$
as a whole to be equal to the sum of the individual fitness value of each field.
Our simulation assumes 10 fields with starting fitness values ranging from 0 to 1, which are randomly assigned. Consequently, the average cumulative fitness
 $(F_{U})$
value is initially 5. As the simulation proceeds, fitness values of the 10 fields grow independently, and as a result, the cumulative fitness of the Understanding regime grows. Figure 7b shows results from a simulation run exhibiting roughly exponential growth of cumulative fitness over time. Thus, a simple model for growth of the Understanding regime is also exponential. However, as with the Operations regime, unlimited growth by simple combination of scientific theories is not realistic.
$(F_{U})$
value is initially 5. As the simulation proceeds, fitness values of the 10 fields grow independently, and as a result, the cumulative fitness of the Understanding regime grows. Figure 7b shows results from a simulation run exhibiting roughly exponential growth of cumulative fitness over time. Thus, a simple model for growth of the Understanding regime is also exponential. However, as with the Operations regime, unlimited growth by simple combination of scientific theories is not realistic.
The Understanding regime also cannot progress by simple combination of existing understanding but instead experiences a limit that we envision as depending upon availability of operational (technological) tools available for testing scientific hypotheses and for discovering new effects. We express this dependence through an equation which expresses the maximum cumulative fitness at any time,
 $\max F_{U}(t)$
, as simply proportional to the IOI existing at that time:
$\max F_{U}(t)$
, as simply proportional to the IOI existing at that time:
 $$\begin{eqnarray}\max F_{U}(t)=Z_{F}\cdot \text{IOI}_{C}(t),\end{eqnarray}$$
where
 $\text{IOI}_{C}$
thus represents an approximation for the effectiveness of available operational tools, and
$\text{IOI}_{C}$
thus represents an approximation for the effectiveness of available operational tools, and
 $Z_{F}$
is a constant of proportionality. This equation captures the concept first suggested by Price that the extent (or scope) of explanatory reach of the Understanding regime is dependent upon what experimental tools are available for scientists and researchers. It also recognizes in the terms of our model that these tools are essentially operational artifacts.
$Z_{F}$
is a constant of proportionality. This equation captures the concept first suggested by Price that the extent (or scope) of explanatory reach of the Understanding regime is dependent upon what experimental tools are available for scientists and researchers. It also recognizes in the terms of our model that these tools are essentially operational artifacts.
4.3 Exchanges between Understanding and Operations regimes
As discussed in Section 3.1, prior qualitative work indicates that the interaction of Understanding and Operations is probably best modeled by assuming mutual beneficial interaction. In our model, we capture this enabling exchange from the Understanding to the Operations regime using a simple mathematical criterion:
 $$\begin{eqnarray}F_{U}(t)/F_{U}(t\_\text{prev})\geqslant \text{cutoff}\_\text{ratio}(R)\end{eqnarray}$$
where,
 $F_{U}(t)$
and
$F_{U}(t)$
and
 $F_{U}(t\_\text{prev})$
represent cumulative fitness values at time step
$F_{U}(t\_\text{prev})$
represent cumulative fitness values at time step
 $t$
and the most recent time step,
$t$
and the most recent time step,
 $t\_\text{prev}$
, at which a
$t\_\text{prev}$
, at which a
 $\text{IOI}_{0}$
had been introduced.
$\text{IOI}_{0}$
had been introduced.
This criterion states that when cumulative fitness of the Understanding regime grows by some multiple
 $(R)$
from the time when the last
$(R)$
from the time when the last
 $\text{IOI}_{0}$
was invented, understanding has improved enough to generate a new
$\text{IOI}_{0}$
was invented, understanding has improved enough to generate a new
 $\text{IOI}_{0}$
, which becomes available for combinations with all existing IOI. The threshold ratio,
$\text{IOI}_{0}$
, which becomes available for combinations with all existing IOI. The threshold ratio,
 $R$
, determines the frequency at which
$R$
, determines the frequency at which
 $\text{IOI}_{0}$
are created.
$\text{IOI}_{0}$
are created.
We now show results from a simulation including the exchange and limits on
 $\text{IOI}_{0}$
. In the simulation, we study how synergistic exchange from Understanding influences the rate of growth of
$\text{IOI}_{0}$
. In the simulation, we study how synergistic exchange from Understanding influences the rate of growth of
 $\text{IOI}_{0}$
in the Operations regime, including escape from stagnation. We focus particularly on two variables, namely, the initial number of
$\text{IOI}_{0}$
in the Operations regime, including escape from stagnation. We focus particularly on two variables, namely, the initial number of
 $\text{IOI}_{0}$
in the Operations regime and the threshold ratio
$\text{IOI}_{0}$
in the Operations regime and the threshold ratio
 $R$
for creation of new
$R$
for creation of new
 $\text{IOI}_{0}$
. Other pertinent variables are the probability of combination,
$\text{IOI}_{0}$
. Other pertinent variables are the probability of combination,
 $P_{\text{IOI}}$
the number of attempts per time step and the number of time steps per year and are not varied in this set of results.
$P_{\text{IOI}}$
the number of attempts per time step and the number of time steps per year and are not varied in this set of results.
For this simulation study, Table 1 presents the parameter values for
 $\text{IOI}_{0}$
(column 3) and the threshold ratios of cumulative fitness (column 4) that are used. As an example, 5B3R starts with
$\text{IOI}_{0}$
(column 3) and the threshold ratios of cumulative fitness (column 4) that are used. As an example, 5B3R starts with
 $\text{IOI}_{0}$
of 5 and a new
$\text{IOI}_{0}$
of 5 and a new
 $\text{IOI}_{0}$
is created when cumulative fitness grows by a factor of 3. Both the initial number of
$\text{IOI}_{0}$
is created when cumulative fitness grows by a factor of 3. Both the initial number of
 $\text{IOI}_{0}$
and the threshold ratios of cumulative fitness are set at 3 different values, giving a total set of 9 parameter combinations. For all 9 runs, the probability for combination is kept constant at 0.25, and we assume one attempt per yearly time step.
$\text{IOI}_{0}$
and the threshold ratios of cumulative fitness are set at 3 different values, giving a total set of 9 parameter combinations. For all 9 runs, the probability for combination is kept constant at 0.25, and we assume one attempt per yearly time step.
Simulation study: Parameter values of
 $\text{IOI}_{0}$
and
$\text{IOI}_{0}$
and
 $R$
(threshold ratios of cumulative fitness of Understanding) for the study. Results:
$R$
(threshold ratios of cumulative fitness of Understanding) for the study. Results:
 $K$
is the slope fitting the simulation results to an exponential with
$K$
is the slope fitting the simulation results to an exponential with
 $R^{2}$
for the fit (also shown). Other parameters, such as probability of combination,
$R^{2}$
for the fit (also shown). Other parameters, such as probability of combination,
 $P_{\text{IOI}}=0.25$
, are kept constant
$P_{\text{IOI}}=0.25$
, are kept constant

Growth of
 $\text{IOI}_{c}$
; initial
$\text{IOI}_{c}$
; initial
 $\text{IOI}_{0}$
and
$\text{IOI}_{0}$
and
 $R$
(cumulative fitness ratio) for each run are shown in the legend for each run; e.g., 10B5R represents 10
$R$
(cumulative fitness ratio) for each run are shown in the legend for each run; e.g., 10B5R represents 10
 $\text{IOI}_{0}$
and fitness ratio of 5.
$\text{IOI}_{0}$
and fitness ratio of 5.

The simulation results in Figure 8 shows the temporal growth of
 $\text{IOI}_{C}$
in the Operations regime for the nine runs shown in Table 1. Runs 5B3R and 5B5R clearly stand out: they have a bumpy growth since they encounter periods of stagnation multiple times, as they evolve. Moreover, their effective rates of growth are meager, standing only at 0.055 and 0.04, which is much lower than 0.118, the rate given by Eq. (10)
$\text{IOI}_{C}$
in the Operations regime for the nine runs shown in Table 1. Runs 5B3R and 5B5R clearly stand out: they have a bumpy growth since they encounter periods of stagnation multiple times, as they evolve. Moreover, their effective rates of growth are meager, standing only at 0.055 and 0.04, which is much lower than 0.118, the rate given by Eq. (10)
 $\{\ln (1+P_{\text{IOI}}/2)\}$
. Columns 5, 6 and 7 list the
$\{\ln (1+P_{\text{IOI}}/2)\}$
. Columns 5, 6 and 7 list the
 $K,R^{2}$
and
$K,R^{2}$
and
 $K$
calculated using
$K$
calculated using
 $\ln (1+P_{\text{IOI}}/2)$
, respectively. The small deviations from Eq. (10) found for the other 7 runs are within the 2-sigma estimated from multiple simulation repetitions for each run.
$\ln (1+P_{\text{IOI}}/2)$
, respectively. The small deviations from Eq. (10) found for the other 7 runs are within the 2-sigma estimated from multiple simulation repetitions for each run.
Both 5B3R and 5B5R start with low initial
 $\text{IOI}_{0}$
of 5 and have higher cumulative fitness threshold ratios
$\text{IOI}_{0}$
of 5 and have higher cumulative fitness threshold ratios
 $(R)$
for infusion of new
$(R)$
for infusion of new
 $\text{IOI}_{0}$
. Low initial
$\text{IOI}_{0}$
. Low initial
 $\text{IOI}_{0}$
implies that the Operations regime has a low number of combinatorial possibilities of IOI to start with. In addition, since new
$\text{IOI}_{0}$
implies that the Operations regime has a low number of combinatorial possibilities of IOI to start with. In addition, since new
 $\text{IOI}_{0}$
are not coming fast enough to push the frontier of combinatorial possibilities of IOI far enough, the Operations regime quickly exhausts the possibilities and again stagnates. Run5B5R stagnates for longer periods compared to 5B3R since it has a higher threshold ratio
$\text{IOI}_{0}$
are not coming fast enough to push the frontier of combinatorial possibilities of IOI far enough, the Operations regime quickly exhausts the possibilities and again stagnates. Run5B5R stagnates for longer periods compared to 5B3R since it has a higher threshold ratio
 $(R)$
for infusion of a new
$(R)$
for infusion of a new
 $\text{IOI}_{0}$
and thus slower progress. The Operations regime cannot escape the stagnation until another
$\text{IOI}_{0}$
and thus slower progress. The Operations regime cannot escape the stagnation until another
 $\text{IOI}_{0}$
is created with infusion of new understanding. It is clear from the curves that this pattern repeats itself time after time.
$\text{IOI}_{0}$
is created with infusion of new understanding. It is clear from the curves that this pattern repeats itself time after time.
Other simulation runs, except run 10B5R grow exponentially and smoothly and their rates are consistent with the theoretical value calculated using
 $\ln (1+P_{\text{IOI}}/2)$
, 0.1178. These curves have either high enough
$\ln (1+P_{\text{IOI}}/2)$
, 0.1178. These curves have either high enough
 $\text{IOI}_{0}$
to start with or fast infusion of
$\text{IOI}_{0}$
to start with or fast infusion of
 $\text{IOI}_{0}$
, or both. Run 5B1.5R, for example, starts with a low number of
$\text{IOI}_{0}$
, or both. Run 5B1.5R, for example, starts with a low number of
 $\text{IOI}_{0}$
but has fast infusion of
$\text{IOI}_{0}$
but has fast infusion of
 $\text{IOI}_{0}$
, since the threshold ratio
$\text{IOI}_{0}$
, since the threshold ratio
 $R$
is only 1.5. On the other hand, run 20B5R has slow infusion of
$R$
is only 1.5. On the other hand, run 20B5R has slow infusion of
 $\text{IOI}_{0}$
(high
$\text{IOI}_{0}$
(high
 $R$
), but starts with high initial
$R$
), but starts with high initial
 $\text{IOI}_{0}$
.
$\text{IOI}_{0}$
.
These runs do not exhibit stagnation for two reasons. The first reason is that the frontier of combinatorial possibilities for some runs is very far from the number of realized IOI at a given time step. For example, run 20B5R has over a million possibilities when it starts with 20
 $\text{IOI}_{0}$
. The second reason is that the frontier of the combinatorial possibilities keeps on moving further away as
$\text{IOI}_{0}$
. The second reason is that the frontier of the combinatorial possibilities keeps on moving further away as
 $\text{IOI}_{c}$
increases. Run 5B1.5R, for example, starts with 5
$\text{IOI}_{c}$
increases. Run 5B1.5R, for example, starts with 5
 $\text{IOI}_{0}$
, and yet it never experiences stagnation due to fast infusion of
$\text{IOI}_{0}$
, and yet it never experiences stagnation due to fast infusion of
 $\text{IOI}_{0}$
(low
$\text{IOI}_{0}$
(low
 $R$
) that push the frontier of combinatorial possibilities. The growth of
$R$
) that push the frontier of combinatorial possibilities. The growth of
 $\text{IOI}_{C}$
is also free of stagnation for runs (e.g., such as Run10B3R) with medium number of initial
$\text{IOI}_{C}$
is also free of stagnation for runs (e.g., such as Run10B3R) with medium number of initial
 $\text{IOI}_{0}$
and medium rate of infusion of
$\text{IOI}_{0}$
and medium rate of infusion of
 $\text{IOI}_{0}$
(medium R). This is true because both factors in combination ensure that frontier of combinatorial possibilities is far enough to start with, and the frontier continues to move rapidly enough with time.
$\text{IOI}_{0}$
(medium R). This is true because both factors in combination ensure that frontier of combinatorial possibilities is far enough to start with, and the frontier continues to move rapidly enough with time.
Run 10B5R exhibits somewhat unusual behavior. Although it grows smoothly at the beginning for quite some time, it experiences stagnation later on. This is because the frontier of combinatorial possibilities is far enough away to sustain steady growth early on. Later, the Operations regime exhausts the combinatorial possibilities before new
 $\text{IOI}_{0}$
arrive. However, once a new
$\text{IOI}_{0}$
arrive. However, once a new
 $\text{IOI}_{0}$
arrives, it jumpstarts again but it briefly halts at each new limit demonstrating the value of frequent interchange between Understanding and Operations in this simulation.Footnote
9
$\text{IOI}_{0}$
arrives, it jumpstarts again but it briefly halts at each new limit demonstrating the value of frequent interchange between Understanding and Operations in this simulation.Footnote
9
We have seen that a combinatorial process combined with synergistic exchange between Understanding and Operations leads to an exponentially growing pool of operating ideas,
 $\text{IOI}_{C}$
. This growth is described by an exponential function:
$\text{IOI}_{C}$
. This growth is described by an exponential function:
 $$\begin{eqnarray}\text{IOI}_{C}(t)=\text{IOI}_{0}(t_{0})\exp \{K(t-t_{0})\}\end{eqnarray}$$
 $$\begin{eqnarray}K=\frac{d\ln \text{IOI}_{c}}{dt},\end{eqnarray}$$
where,
 $K=~$
the effective rate of growth of
$K=~$
the effective rate of growth of
 $\text{IOI}_{C}$
,
$\text{IOI}_{C}$
,
 $\text{IOI}_{0}(t_{0})=~$
the number of initial basic IOI,
$\text{IOI}_{0}(t_{0})=~$
the number of initial basic IOI,
 $t=\text{time}$
,
$t=\text{time}$
,
 $t_{0}=\text{initial time}$
.
$t_{0}=\text{initial time}$
.
Our overall model (Section 3, Figure 2) envisages that this exponentially growing pool of operating ideas,
 $\text{IOI}_{C}$
, provides the source for the exponential growth of performance of technological domains. How does this exponential growth of
$\text{IOI}_{C}$
, provides the source for the exponential growth of performance of technological domains. How does this exponential growth of
 $\text{IOI}_{C}$
result in performance improvement and what accounts for the variation in rates of performance improvement across technological domains?
$\text{IOI}_{C}$
result in performance improvement and what accounts for the variation in rates of performance improvement across technological domains?
Interactions in an artifact; (a) illustration of interactions as outlinks (b) sample space of probabilities for unit cost.

4.4 Modeling interaction differences among domains
As explained in Section 3, two factors potentially responsible for modulating the exponential growth of operating ideas as they are integrated into technological domains are the domain interactions and scaling of relevant design variables. We consider domain interactions first following the work of McNerney et al. (Reference McNerney, Farmer, Redner and Trancik2011) who modeled how interactions in processes affect unit cost. We build on their mathematical treatment to analyze the effect of interactions between components upon integrating an IOI into an artifact in a domain, which in turn improves the artifact’s performance. Figure 9a shows a simplified schematic of an artifact in a technological domain that has three components (1, 2, 3) with interaction being depicted by outgoing arrows, representing influence, from a component to other components, including itself. The outgoing arrows are referred to as outlinks. The number of outlinks,
 $d$
, from a component provides a measure of its interaction level, and has value of 1 or greater as McNerney et al. assume each component at least affects itself. For simplicity, Figure 9a shows each component with two outlinks, to itself and to another component. We represent an instance of an attempt being made to improve the performance of component 2 by an IOI being inserted. Since component 2 interacts with itself and another component, the performance of the interacting component is also changed by the insertion but in a fashion described probabilistically. The performance improvement attempt is accepted, only if the performance of the artifact as a whole improves. If that does occur, we follow McNerney et al. and consider the interactions being successfully resolved to improve the performance.
$d$
, from a component provides a measure of its interaction level, and has value of 1 or greater as McNerney et al. assume each component at least affects itself. For simplicity, Figure 9a shows each component with two outlinks, to itself and to another component. We represent an instance of an attempt being made to improve the performance of component 2 by an IOI being inserted. Since component 2 interacts with itself and another component, the performance of the interacting component is also changed by the insertion but in a fashion described probabilistically. The performance improvement attempt is accepted, only if the performance of the artifact as a whole improves. If that does occur, we follow McNerney et al. and consider the interactions being successfully resolved to improve the performance.
For a simplified artifact with
 $d$
number of outlinks for each component (
$d$
number of outlinks for each component (
 $d=2$
in Figure 9a), McNerney et al.’s treatment McNerney et al. (Reference McNerney, Farmer, Redner and Trancik2011) for unit cost results in the following relationship:
$d=2$
in Figure 9a), McNerney et al.’s treatment McNerney et al. (Reference McNerney, Farmer, Redner and Trancik2011) for unit cost results in the following relationship:
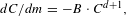 $$\begin{eqnarray}\displaystyle dC/dm=-B\cdot C^{d+1}, & & \displaystyle\end{eqnarray}$$
where,
 $C=~$
unit cost normalized with respect to initial cost,Footnote
10
$C=~$
unit cost normalized with respect to initial cost,Footnote
10
 $m=~$
number of attempts,
$m=~$
number of attempts,
 $d=~$
number of outlinks,
$d=~$
number of outlinks,
 $B=~$
constant.
$B=~$
constant.
This equation states that the level of interaction inherent in the domain artifact influences the rate of unit cost reduction. We adapt this equation for our analysis in the following manner. We interpret the number of attempts as
 $\text{IOI}_{c}$
since the number of IOI determines the attempts (at each attempt an IOI is being introduced into an artifact to make a design change). Secondly, cost reduction is inversely related to performance improvement, such as in a typical metric kWh/$.Footnote
11
With these extensions of McNerney et al. Eq. (16) can be re-written as:
$\text{IOI}_{c}$
since the number of IOI determines the attempts (at each attempt an IOI is being introduced into an artifact to make a design change). Secondly, cost reduction is inversely related to performance improvement, such as in a typical metric kWh/$.Footnote
11
With these extensions of McNerney et al. Eq. (16) can be re-written as:
 $$\begin{eqnarray}d(Q)/d\text{IOI}_{c}=B\cdot Q^{-(d-1)},\end{eqnarray}$$
where,
 $Q=~$
performance.
$Q=~$
performance.
Since as shown in Eqs. (4) and (5), successfully resolved operating ideas in a domain,
 $\text{IOI}_{SC}$
, are the source for its performance improvement, we replace performance
$\text{IOI}_{SC}$
, are the source for its performance improvement, we replace performance
 $Q$
of a domain with
$Q$
of a domain with
 $\text{IOI}_{SC}$
. An IOI is considered a successful attempt if the interaction resolution leads to net performance improvement of the artifact, and the count of successful IOI is denoted by
$\text{IOI}_{SC}$
. An IOI is considered a successful attempt if the interaction resolution leads to net performance improvement of the artifact, and the count of successful IOI is denoted by
 $\text{IOI}_{SC}$
. The modified equation shown below states that the interaction level,
$\text{IOI}_{SC}$
. The modified equation shown below states that the interaction level,
 $d$
, has a retarding effect on the growth of
$d$
, has a retarding effect on the growth of
 $\text{IOI}_{SC}$
in a domain.
$\text{IOI}_{SC}$
in a domain.
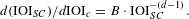 $$\begin{eqnarray}d(\text{IOI}_{SC})/d\text{IOI}_{c}=B\cdot \text{IOI}_{SC}^{-(d-1)}.\end{eqnarray}$$
We solve the differential equation by separating the variables (
 $\text{IOI}_{SC}$
on the left and
$\text{IOI}_{SC}$
on the left and
 $\text{IOI}_{C}$
on the right), and integrating both sides using dummy variables, and express
$\text{IOI}_{C}$
on the right), and integrating both sides using dummy variables, and express
 $\text{IOI}_{SC}$
explicitly. The integration limits are: (a) for the right side, 0 to
$\text{IOI}_{SC}$
explicitly. The integration limits are: (a) for the right side, 0 to
 $\text{IOI}_{C}$
, (b) for the left side, 1 to
$\text{IOI}_{C}$
, (b) for the left side, 1 to
 $\text{IOI}_{SC}$
. The result is:
$\text{IOI}_{SC}$
. The result is:
 $$\begin{eqnarray}\displaystyle \text{IOI}_{SC}=(B\cdot d\cdot \text{IOI}_{C}+1)^{1/_{d}}. & & \displaystyle\end{eqnarray}$$
Since
 $B$
and
$B$
and
 $d$
are close to unity, and
$d$
are close to unity, and
 $\text{IOI}_{c}\gg 1$
, we can ignore 1 in the brackets. Since our goal is to determine
$\text{IOI}_{c}\gg 1$
, we can ignore 1 in the brackets. Since our goal is to determine
 $\{d~\ln \text{IOI}_{SC}/d~\ln \text{IOI}_{C}\}$
, we take the natural log of both sides and differentiate it with respect to
$\{d~\ln \text{IOI}_{SC}/d~\ln \text{IOI}_{C}\}$
, we take the natural log of both sides and differentiate it with respect to
 $\ln \text{IOI}_{C}$
, resulting in the following expression which will be substituted into Eq. (5) in Section 4.6:
$\ln \text{IOI}_{C}$
, resulting in the following expression which will be substituted into Eq. (5) in Section 4.6:
 $$\begin{eqnarray}d\ln \text{IOI}_{SC}/d\ln \text{IOI}_{c}=1/d_{J}.\end{eqnarray}$$
4.5 Performance models – scaling of design variables
Our research question is concerned with intensive technological performance of domain artifacts. The intensive technological performance represents an innate performance characteristic of an artifact. We operationalize the notion of intensive performance by dividing desirable artifact outputs with resource constraints (e.g., mass, volume, time, cost) as discussed in Section 2.2 (see Figure 1a for electric motors metric). We now consider three examples of relationships between intensive performance and design variables.
4.5.1 Selected examples
We first consider blast furnaces used in the manufacturing of steel as representative of reaction vessels of various kinds. Widely used performance attributes for a blast furnace are capacity and cost, where cost can be considered the resource constraint. So, an intensive performance metric can be defined as capacity (output per hour or day typically) per unit cost. The capacity of a reaction vessel is proportional to its volume while its cost is primarily proportional to surface area (Lipsey, Carlaw & Bekar Reference Lipsey, Carlaw and Bekar2006). The following dimensional analysis shows that following these simplistic assumptions, intensive performance of a reaction vessel is linearly proportional to size,
 $s$
.
$s$
.
 $$\begin{eqnarray}Q_{RV}=\mathit{capacity/cost~of~reaction~vessel}=s^{3}/s^{2}=s^{1}.\end{eqnarray}$$
Gold (Reference Gold1974) has empirically shown that the cost of a blast furnace goes up by 60 % when the capacity is doubled. Intensive performance
 $Q_{RV}$
using this empirical finding goes up by 1.25 (
$Q_{RV}$
using this empirical finding goes up by 1.25 (
 $=2/1.6$
) when
$=2/1.6$
) when
 $s^{3}$
doubles, and thus
$s^{3}$
doubles, and thus
 $s$
goes up by 1.26
$s$
goes up by 1.26
 $(=2^{.333})$
closely agreeing with the simply derived equation (21).
$(=2^{.333})$
closely agreeing with the simply derived equation (21).
A second example we consider is specific power output from internal combustion (and other heat) engines. Power output (kW) is proportional to volume occupied by the combustion chamber minus the heat loss from the engine, which in turn is proportional to the engine’s surface area. The power, then, is:
 $$\begin{eqnarray}\text{power}=As^{3}--Bs^{2};B/A<1,\end{eqnarray}$$
where
 $A$
and
$A$
and
 $B$
are constants for power generation and heat loss, respectively.
$B$
are constants for power generation and heat loss, respectively.
 $Q_{IC}=~$
specific power
$Q_{IC}=~$
specific power
 ${\it\alpha}$
power/volume of engine; thus specific power is
${\it\alpha}$
power/volume of engine; thus specific power is
 $$\begin{eqnarray}=(As^{3}-Bs^{2})/s^{3}=A-B/s.\end{eqnarray}$$
Eq. (23) indicates that similar to reaction vessels, specific power output of IC engines increases with size so both are ‘larger is better’ artifacts. For small values of
 $B/As$
, specific power increases approximately linearly with
$B/As$
, specific power increases approximately linearly with
 $s$
. For larger values of
$s$
. For larger values of
 $s$
, the increase is less than linear in
$s$
, the increase is less than linear in
 $s$
.
$s$
.
As a final example, we consider information technologies, whose performance improvement ranks amongst the highest. Several modern information technologies depend upon integrated circuit (IC) chips. Electronic computers have been improving performance by reducing the feature sizes of transistors in IC chips for microprocessors. The number of computations per second per unit volume, an intensive measure of performance, depends upon frequency and the number of transistors in a unit volume. Frequency is inversely proportional to the linear dimension of a feature,
 $s$
, and the number of transistors per unit area is inversely proportional to area of the feature. Thus,
$s$
, and the number of transistors per unit area is inversely proportional to area of the feature. Thus,
 $$\begin{eqnarray}\text{Computation per sec per cc}=1/s\cdot 1/s^{2}=s^{-3}.\end{eqnarray}$$
The dimensional analysis indicates that computations per second increases rapidly for a decrease in a linear dimension of a feature. This is due to the cubic (or higher)Footnote 12 dependence of computations per second on feature size. The negative sign captures the fact that reduction of the design variable increases performance – smaller is better for this artifact.
4.5.2 Generalization of scaling of design variables
The three examples we have presented illustrate the notion that intensive performance improved by different degrees depending how the design variables are scaled. In the first two cases, a 10 % increase in a design variable will improve performance by 10 % or less. However, in the case of computations, for the same 10 % change in design variable (feature size), the performance would improve by over 33 %. This dependence is modeled as a power-law:Footnote 13
 $$\begin{eqnarray}\displaystyle & Q_{\!J}=s^{A_{\!J}} & \displaystyle\end{eqnarray}$$
 $$\begin{eqnarray}\displaystyle & \ln Q_{\!J}=A_{\!J}\ln s & \displaystyle\end{eqnarray}$$
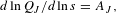 $$\begin{eqnarray}\displaystyle & d\ln Q_{\!J}/d\ln s=A_{J}, & \displaystyle\end{eqnarray}$$
where,
 $A_{\!J}$
is the scaling factor for domain
$A_{\!J}$
is the scaling factor for domain
 $J$
,
$J$
,
 $s$
is the design variable.
$s$
is the design variable.
4.6 Bringing all elements together
We now bring the results for rate of
 $\text{IOI}_{SC}$
growth and influence of interaction and scaling together. For the reader’s convenience, we reproduce Eq. (4) here, and substitute the results for the four factors:
$\text{IOI}_{SC}$
growth and influence of interaction and scaling together. For the reader’s convenience, we reproduce Eq. (4) here, and substitute the results for the four factors:
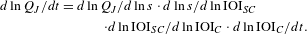 $$\begin{eqnarray}\displaystyle d\ln Q_{\!J}/dt & = & \displaystyle d\ln Q_{\!J}/d\ln s\cdot d\ln s/d\ln \text{IOI}_{SC}\nonumber\\ \displaystyle & & \displaystyle \qquad \cdot d\ln \text{IOI}_{SC}/d\ln \text{IOI}_{C}\cdot d\ln \text{IOI}_{C}/dt.\end{eqnarray}$$
Substituting the results from Eqs. (27), (20) and (15B
) for the first, third and fourth terms,
 $\pm 1$
for the second term and then rearranging, we get:
$\pm 1$
for the second term and then rearranging, we get:
 $$\begin{eqnarray}K_{\!J}=\frac{d\ln Q_{\!J}}{dt}=(\mp 1)A_{\!J}\frac{1}{d_{\!J}}K.\end{eqnarray}$$
Eq. (28) represents the overall model of the annual rate of improvement for domain
 $J$
. According to this equation,
$J$
. According to this equation,
 $K_{\!J}$
, the annual rate of improvement of domain
$K_{\!J}$
, the annual rate of improvement of domain
 $J$
depends upon
$J$
depends upon
 $K$
, the exponential rate at which the
$K$
, the exponential rate at which the
 $\text{IOI}_{C}$
pool increases in size.
$\text{IOI}_{C}$
pool increases in size.
 $K$
is then modulated by domain specific parameters,
$K$
is then modulated by domain specific parameters,
 $d_{J}$
(interaction) inversely and
$d_{J}$
(interaction) inversely and
 $A_{\!J}$
(scaling) proportionally to result in a domain specific rate of improvement
$A_{\!J}$
(scaling) proportionally to result in a domain specific rate of improvement
 $K_{\!J}$
. The minus sign is converted into positive one by negative sign of
$K_{\!J}$
. The minus sign is converted into positive one by negative sign of
 $A_{\!J}$
(for those cases where smaller is better). One observation to note is that
$A_{\!J}$
(for those cases where smaller is better). One observation to note is that
 $A_{\!J}$
and
$A_{\!J}$
and
 $d_{J}$
are constants for a given domain, thus resulting in a time invariant rate (or a simple exponential) for a domain.
$d_{J}$
are constants for a given domain, thus resulting in a time invariant rate (or a simple exponential) for a domain.
5 Discussion
The goal of this paper was to develop a mathematical model that utilizes mechanisms in the design/invention process to examine the nature of technological performance improvement trends. The exploration has utilized simulation to gain insight into a combinatorial process based upon analogical transfer and Understanding/Operations exchange and quantitatively modeled interactions and scaling. In this section, we first briefly review the consistencies of the model with empirical results (and what is known about technological change). All empirical results we are aware of are found to support the model. Another goal in developing a quantitative model as done in this paper is to generate predictions that can be further tested empirically. Thus, after discussing the known agreements with the model, we consider the (largely as yet) untested predictions of the model regarding how the long-term performance of artifacts collectively improves at the technological domain level.
According to the model, the exponential nature of performance improvement for all technological domains arises in the idea realm of the operational knowledge regime, where new inventive ideas are created using combinatorial analogical transfer of existing ideas, which, in turn, become the building blocks for future inventive ideas. We emphasize that the combinations modeled are occurring at the idea level, although combinations can also take place between components. As noted in Section 3.1, we make this distinction as the former is much more pervasive and allows combination of ideas from different fields; however, it is likely that some ideas cannot be combined and this is treated probabilistically since many combination attempts fail. The model demonstrates this incessant cumulative combinatorial aspect of knowledge in both the Understanding and the Operations regimes manifests as exponential trends. The combinatorial model is simple but it leads naturally to the exponential behavior with time that has only been obtained previously by Axtell et al. in a model that went beyond performance to diffusion over a set of agents. Since such exponential behavior with time is one of the most widely noted behaviors of technical performance (Moore Reference Moore1965; Koh & Magee Reference Koh and Magee2006, Reference Koh and Magee2008; Nagy et al. Reference Nagy, Farmer, Bui and Trancik2013; Magee et al. Reference Magee, Basnet, Funk and Benosn2014), the combinatoric model enacting analogical transfer that was developed in the current paper is clearly supported by what is known empirically about performance trends with time.
The Operations and the Understanding regimes can improve independently in the model but not indefinitely. How long the Operations regime can improve depends in the model upon the size of the technological possibility space, which according to the model is dependent on the number of basic IOI, fundamental operational principles, existing. The Understanding regime can also experience stagnation, but this happens when the operational tools that scientists and researchers use for discovery and testing hypotheses are not adequate. The Operations regime comes to its rescue by providing these operational tools in form of empirical methods, tools and instruments (increased numbers of IOI), which greatly enhances the scientists ability to discover and test, and thus further push the limits of understanding in the manner suggested by de Solla Price (Reference de Solla Price1986), Gribbin (Reference Gribbin2002) and in the following quote from Toynbee (Reference Toynbee1962).
Physical Science and Industrialism may be conceived as a pair of dancers both of whom know their steps and have an ear for the rhythm of the music. If the partner who has been leading chooses to change parts and to follow instead there is perhaps no reason to expect that he will dance less correctly than before.
In this sense, the Operations regime and the Understanding regime are like two independent neighbors who interact for mutual benefit. In the model, their frequency of interaction however influences their effective rate of growth. Our model is a specific realization that achieves this mutual interaction that has previously been widely noted from deep qualitative research.
Variation of
 $K$
as a function of initial
$K$
as a function of initial
 $\text{IOI}_{0}$
and
$\text{IOI}_{0}$
and
 $R$
. Lower
$R$
. Lower
 $R$
refers to higher frequency of interaction with the Understanding regime.
$R$
refers to higher frequency of interaction with the Understanding regime.

The results in Figure 8 are summarized as a surface plot in Figure 10.
 $K$
, the effective rate of growth of
$K$
, the effective rate of growth of
 $\text{IOI}_{C}$
was determined by the initial
$\text{IOI}_{C}$
was determined by the initial
 $\text{IOI}_{0}$
, and the frequency of interaction
$\text{IOI}_{0}$
, and the frequency of interaction
 $({\it\alpha}\,1/\ln R)$
. The former determined the envelope of technological possibility space. When
$({\it\alpha}\,1/\ln R)$
. The former determined the envelope of technological possibility space. When
 $\text{IOI}_{0}$
are high, the effective rate of growth
$\text{IOI}_{0}$
are high, the effective rate of growth
 $K$
is close to the theoretical combinatorial rate determined by Eq. (10)
$K$
is close to the theoretical combinatorial rate determined by Eq. (10)
 $\{\ln (1+P_{\text{IOI}}/2)\}$
, irrespective of whether there was frequent exchange. However, when the
$\{\ln (1+P_{\text{IOI}}/2)\}$
, irrespective of whether there was frequent exchange. However, when the
 $\text{IOI}_{0}$
are low, the limit is hit repeatedly, translating into halting and a reduced effective rate of growth. The value of
$\text{IOI}_{0}$
are low, the limit is hit repeatedly, translating into halting and a reduced effective rate of growth. The value of
 $K$
in this case was determined by the frequency of enabling exchange from the Understanding regime, with higher frequency (low
$K$
in this case was determined by the frequency of enabling exchange from the Understanding regime, with higher frequency (low
 $R$
) leading to higher effective rate. With sufficiently high frequency, even with low initial
$R$
) leading to higher effective rate. With sufficiently high frequency, even with low initial
 $\text{IOI}_{0}$
, the effective rate
$\text{IOI}_{0}$
, the effective rate
 $K$
eventually approaches the theoretical rate.
$K$
eventually approaches the theoretical rate.
Detailed historical studies of technological change (Mokyr Reference Mokyr2002) note centuries of slow, halting progress that eventually becomes much more rapid and sustained starting in the late 18th century in the UK. An interesting consistency of these observations with our model is seen since our model attributes the transition to sustained higher improvement rate to the combinatorial growth of individual ideas that are able to reinforce one another by the analogical transfer mechanism. That our model partially accomplishes this through the synergistic exchange between Understanding and Operations is also consistent with the detailed historical studies as interpreted by many observers (Schofield Reference Schofield1963; Musson Reference Musson and Musson1972; Rosenberg & Birdzell Reference Rosenberg and Birdzell1986; Musson & Robinson Reference Musson and Robinson1989; Mokyr Reference Mokyr2002; Lipsey et al. Reference Lipsey, Carlaw and Bekar2006).
The
 $K_{\!J}$
values found empirically vary by approximately a factor of 22 (from 0.03 to 0.65 according to Magee et al. (Reference Magee, Basnet, Funk and Benson2016). Eq. (28) states that annual improvement rate for a domain is determined by the product of
$K_{\!J}$
values found empirically vary by approximately a factor of 22 (from 0.03 to 0.65 according to Magee et al. (Reference Magee, Basnet, Funk and Benson2016). Eq. (28) states that annual improvement rate for a domain is determined by the product of
 $K$
times the scaling parameter,
$K$
times the scaling parameter,
 $A_{\!J}$
, and the reciprocal of the interaction parameter,
$A_{\!J}$
, and the reciprocal of the interaction parameter,
 $d_{J}$
. According to this result, the last two parameters produce the variation of improvement rates across domains. During the embodiment process, interactions prevalent in the domain artifacts influence how many inventive ideas can be absorbed. The percent increase in successfully absorbed ideas by a domain artifact is inversely proportional to the average interaction parameter of the domain
$d_{J}$
. According to this result, the last two parameters produce the variation of improvement rates across domains. During the embodiment process, interactions prevalent in the domain artifacts influence how many inventive ideas can be absorbed. The percent increase in successfully absorbed ideas by a domain artifact is inversely proportional to the average interaction parameter of the domain
 $d_{J}$
. By definition, the minimum value of
$d_{J}$
. By definition, the minimum value of
 $d$
is 1 and the maximum might be higher but a value of 6 appears reasonable. The other factor that is predicted to differentiate domains is performance scaling. Inventive ideas affect artifact performance by modifying the design parameters in domain artifacts. The model indicates that the relative improvement of performance for a given number of absorbed new operating ideas is governed by the scaling parameter
$d$
is 1 and the maximum might be higher but a value of 6 appears reasonable. The other factor that is predicted to differentiate domains is performance scaling. Inventive ideas affect artifact performance by modifying the design parameters in domain artifacts. The model indicates that the relative improvement of performance for a given number of absorbed new operating ideas is governed by the scaling parameter
 $A_{\!J}$
. The examples presented in Section 4.5 illustrated that the value of
$A_{\!J}$
. The examples presented in Section 4.5 illustrated that the value of
 $A_{\!J}$
can vary across domains. In particular, for the IC domain (where smaller is better),
$A_{\!J}$
can vary across domains. In particular, for the IC domain (where smaller is better),
 $A_{\!J}$
is apparently 3 to 4 times larger than for typical larger-is-better domains such as combustion engines. Thus, the range of
$A_{\!J}$
is apparently 3 to 4 times larger than for typical larger-is-better domains such as combustion engines. Thus, the range of
 $K_{J}$
empirically observed is potentially explainable by changes in
$K_{J}$
empirically observed is potentially explainable by changes in
 $d_{J}$
and
$d_{J}$
and
 $A_{\!J}$
, but much more empirical work is needed to fully support these quantitative implications of Eq. (28) as will be discussed further below.
$A_{\!J}$
, but much more empirical work is needed to fully support these quantitative implications of Eq. (28) as will be discussed further below.
The empirical findings of Benson & Magee (Reference Benson and Magee2015a ) also support the model. In particular, they found no correlation of rates in domains with effort in a domain (measured by number of patents or patenting rate) or with the amount of outside knowledge used by a domain (this is very large for all domains). They interpreted their findings by a ‘rising sea metaphor’ that represents all inventions and scientific output being equally available to all domains but that fundamentals in the domains determine the rate of performance improvement. Overall effort in Understanding (science) and invention increase the rates in all domains but the differences among rates of improvement are due to differences in fundamental characteristics among the domains. The model in this paper identifies interactions and scaling as two such fundamentals and Eq. (28) is specific about the variation expected due to these two fundamental characteristics.
Thus, our model is supported by what is known empirically including exponential dependence of performance on time; slow, halting progress in the early stages of technological development; a role for science in enabling technological performance improvement; the range of variation in performance improvement across domains; and the importance of domain fundamentals to variation in performance. However, to what extent does it achieve the ideal level of understanding mentioned in Section 2 when discussing the related Benson and Magee research? It is – as desired – based upon what is known about the design/inventive process and does not rely upon characteristics only determined by observation of output in a domain. Moreover, it provides explanations of existing empirical results not made by prior models. However, does it make any new predictions; do its assumptions appear reasonable; and what new avenues of design research if any does it open up for further exploration? We consider these issues in the remainder of the discussion.
There are three new predictions made by the model as instantiated in Eq (28). These are: (1) that the noise in estimating
 $K_{J}$
should vary with
$K_{J}$
should vary with
 $K_{J}$
linearly rather than for example be independent of
$K_{J}$
linearly rather than for example be independent of
 $K_{\!J}$
; (2) that performance improvement comparisons across domains vary as
$K_{\!J}$
; (2) that performance improvement comparisons across domains vary as
 $1/d_{J}$
where
$1/d_{J}$
where
 $d$
is the interaction parameter; and (3) that performance improvement across domains vary as
$d$
is the interaction parameter; and (3) that performance improvement across domains vary as
 $A_{\!J}$
. The first prediction follows from the fact that the model ascribes all variation in the process to the probabilistic analogical transfer process that creates IOI and thus any noise generated in the process is amplified by the same factors that determine
$A_{\!J}$
. The first prediction follows from the fact that the model ascribes all variation in the process to the probabilistic analogical transfer process that creates IOI and thus any noise generated in the process is amplified by the same factors that determine
 $K_{\!J}$
(namely
$K_{\!J}$
(namely
 $1/d_{J}$
and
$1/d_{J}$
and
 $A_{\!J}$
). Very recent work appears to confirm the first prediction. In a careful study of the observed noise in a wide variety of domains, Farmer & Lafond (Reference Farmer and Lafond2016) have found that the variation in
$A_{\!J}$
). Very recent work appears to confirm the first prediction. In a careful study of the observed noise in a wide variety of domains, Farmer & Lafond (Reference Farmer and Lafond2016) have found that the variation in
 $K_{\!J}$
is proportional to
$K_{\!J}$
is proportional to
 $K_{\!J}$
offering empirical support to the form of Eq. (28). This is potentially an important confirmation of a prediction of the model but the careful work by Farmer & Lafond (Reference Farmer and Lafond2016) has potential data limitations (detailed in their paper) and further work of this kind is highly desirable. Prediction 2 is that component interactions
$K_{\!J}$
offering empirical support to the form of Eq. (28). This is potentially an important confirmation of a prediction of the model but the careful work by Farmer & Lafond (Reference Farmer and Lafond2016) has potential data limitations (detailed in their paper) and further work of this kind is highly desirable. Prediction 2 is that component interactions
 $(d_{J})$
, which characterize the domains, influence improvement rate by modulating the implementation of IOI in the domain artifacts. This prediction can be tested by study of the performance improvement rates over a variety of domains where an independent assessment of
$(d_{J})$
, which characterize the domains, influence improvement rate by modulating the implementation of IOI in the domain artifacts. This prediction can be tested by study of the performance improvement rates over a variety of domains where an independent assessment of
 $d_{J}$
is made. The authors have performed such a test using patent data (Basnet & Magee Reference Basnet and Magee2016) and the results show strong correlation of the performance improvement rate
$d_{J}$
is made. The authors have performed such a test using patent data (Basnet & Magee Reference Basnet and Magee2016) and the results show strong correlation of the performance improvement rate
 $(K_{\!J})$
with the inverse of the interaction parameter
$(K_{\!J})$
with the inverse of the interaction parameter
 $(d_{J})$
directly supporting our model (Eq. (28)) and the underlying model of McNerney et al. Prediction 3 is that relative improvement among domains varies proportionally to the scaling parameter for the domain design parameters, a consequence of performance following a power law with the design parameters. If scaling laws were found (or derived) for a variety of domains whose rate of progress is known, prediction 3 can also be tested. In this paper, we showed that the factor A is at least 3 times larger for Integrated circuits than for combustion engines. While this provides preliminary support for the model since Integrated circuits improve about 7 times faster than combustion engines (Magee et al.
Reference Magee, Basnet, Funk and Benson2016), two points do not achieve a rigorous test. One would need to have reliable scaling factors for at least 10 domains with varying
$(d_{J})$
directly supporting our model (Eq. (28)) and the underlying model of McNerney et al. Prediction 3 is that relative improvement among domains varies proportionally to the scaling parameter for the domain design parameters, a consequence of performance following a power law with the design parameters. If scaling laws were found (or derived) for a variety of domains whose rate of progress is known, prediction 3 can also be tested. In this paper, we showed that the factor A is at least 3 times larger for Integrated circuits than for combustion engines. While this provides preliminary support for the model since Integrated circuits improve about 7 times faster than combustion engines (Magee et al.
Reference Magee, Basnet, Funk and Benson2016), two points do not achieve a rigorous test. One would need to have reliable scaling factors for at least 10 domains with varying
 $K_{\!J}$
to determine whether this part of the model is empirically supported.
$K_{\!J}$
to determine whether this part of the model is empirically supported.
A fundamental aspect of the overall model is that it differentiates between the idea/knowledge and artifact aspects of design and invention. Such decomposition is an essential step in arriving at our key result (Eq. (28) through Eq. (5)). It is not clear that this assumption is testable so it must remain an unverified assumption or definition but we do note that it appears to accord with reality in that inventors/designers spend significant amount of time working with ideas and representations of artifacts, for example in the form of sketches and drawings, well before they build artifacts. Others have noted the higher leverage of analogical transfer between ideas as opposed to designed artifacts (Weisberg Reference Weisberg2006).
A potentially important and non-obvious assumption made in the model is that inventive effort increases as the cumulative number of IOI –
 $\text{IOI}_{C}$
– increases. This assumption is introduced when we assume that every existing IOI undergoes a combination attempt in each time step. As
$\text{IOI}_{C}$
– increases. This assumption is introduced when we assume that every existing IOI undergoes a combination attempt in each time step. As
 $\text{IOI}_{C}$
increases, this means that more inventions are attempted in each successive time step. This assumption is critical to obtaining the exponential time dependence for
$\text{IOI}_{C}$
increases, this means that more inventions are attempted in each successive time step. This assumption is critical to obtaining the exponential time dependence for
 $\text{IOI}_{C}$
and thus for
$\text{IOI}_{C}$
and thus for
 $Q$
because the growth of
$Q$
because the growth of
 $\text{IOI}_{C}$
would be choked off if inventive attempts did not increase over time. Although a rigorous test of this assumption is suggested for further work, we do note support for the assumption in the exponential growth of patents over time (Youn et al.
Reference Youn, Bettencourt, Strumsky and Lobo2014; Packalen & Bhattacharya Reference Packalen and Bhattacharya2015).Footnote
14
Approximate support is also given by the roughly exponential growth of R&D spending over time (NSF, 2014) and by the roughly exponential growth of graduate engineers globallyFootnote
15
over time (NSF, 2014).
$\text{IOI}_{C}$
would be choked off if inventive attempts did not increase over time. Although a rigorous test of this assumption is suggested for further work, we do note support for the assumption in the exponential growth of patents over time (Youn et al.
Reference Youn, Bettencourt, Strumsky and Lobo2014; Packalen & Bhattacharya Reference Packalen and Bhattacharya2015).Footnote
14
Approximate support is also given by the roughly exponential growth of R&D spending over time (NSF, 2014) and by the roughly exponential growth of graduate engineers globallyFootnote
15
over time (NSF, 2014).
The model assumes a simple exchange between Understanding (largely science) and Operations (largely technology) as described by Eqs. (13) and (14). The details of this mechanism are not testable but in our opinion not critical because other formalisms (based upon differences rather than ratios and based upon count of UOU rather than our choice of explanatory reach) lead to results closely similar to those reported here. Therefore, this assumption remains unverified but is not critical to our conclusions. Similarly, the initial value of
 $\text{IOI}_{0}$
chosen in the simulation (and the exchange frequency with Understanding
$\text{IOI}_{0}$
chosen in the simulation (and the exchange frequency with Understanding
 $({\it\alpha}1/\ln R)$
) is essential to our finding of halting slow growth that can transition to sustained and more rapid growth. Although this finding is consistent with detailed observation as noted above and the initial number of useful ideas must be small, there is no independent means of assessing
$({\it\alpha}1/\ln R)$
) is essential to our finding of halting slow growth that can transition to sustained and more rapid growth. Although this finding is consistent with detailed observation as noted above and the initial number of useful ideas must be small, there is no independent means of assessing
 $\text{IOI}_{0}$
. Moreover, we have made a number of assumptions in parameter values to construct a simple and operational simulation. The values for parameters in the simulation, such as
$\text{IOI}_{0}$
. Moreover, we have made a number of assumptions in parameter values to construct a simple and operational simulation. The values for parameters in the simulation, such as
 $P_{\text{IOI}}$
, number of time steps, number of scientific fields,
$P_{\text{IOI}}$
, number of time steps, number of scientific fields,
 $R$
, fitness values are chosen to keep the computational cost reasonable, without sacrificing the essential aspects. Simulations show that results are robust to different combinations of parameter values with respect to exponential trends and variation in rates. Therefore, these choices and simplifications do not undercut the explanatory or predictive capabilities of the model but do limit the potential for non-calibrated calculation of, for example, the improvement rate for a domain since
$R$
, fitness values are chosen to keep the computational cost reasonable, without sacrificing the essential aspects. Simulations show that results are robust to different combinations of parameter values with respect to exponential trends and variation in rates. Therefore, these choices and simplifications do not undercut the explanatory or predictive capabilities of the model but do limit the potential for non-calibrated calculation of, for example, the improvement rate for a domain since
 $K$
is only approximately known.
$K$
is only approximately known.
To make the model tractable, we have made number of simplifying abstractions, introducing several other limitations to the model. Since the model is not agent-based, it does not distinguish between organizations nor between inventors. Since our goal is to explain the patterns at the domain level, we consider the domain as one entity. For this reason, variations among organizations or among inventors within a domain are not taken into account, and hence the model is not useful to understand organizational or individual inventor effectiveness in its current form and any systematic differences among inventor capability across domains is ignored. Second, once IOI are created by any inventor, the model assumes they are instantly available for combinatorial analogical transfer across the pool underlying all domains. Thus, the model does not take into account time delay that can result due to, for example, geography, secrecy and governmental regulations, and hence is not useful for studying such factors’ influence in technological change. Third, the model assumes that 2 pre-existing ideas are sufficient (probabilistically) to create another idea whereas inventions also result from bringing more than 2 pre-existing ideas together. However, adding such complications to the model and simulation does not change the fundamental findings since the creation of new ideas would still increase as the number of pre-existing ideas increase as long as we still assume an increasing invention effort. Fourth, although conceptually the notion of fitness of scientific fields makes sense, how the fitness can be measured, and who measures it for a scientific field are contested, especially for rapidly growing fields.
This analysis of the predictions points out that some key aspects of Eq. (28) have the potential to be empirically tested and thus are clear future research activities suggested by the model. Among these future research activities, one important issue to discuss is the extensions possible to design research potentially opened up by the current work. The model in this paper explicitly considers design changes in succeeding artifacts in a series to be the central element in technological change over time. Thus, it adds to the few other papers (Baldwin & Clark Reference Baldwin, Clark, Kahin and Foray2006; Luo et al. Reference Luo, Olechowski and Magee2014) that have connected these two large fields of research – technological change and design theory. This paper in particular connects design conceptually and quantitatively to changes in performance over time. Since there is significant data of this type (Moore Reference Moore1965; Girifalco Reference Girifalco1991; Nordhaus Reference Nordhaus1996; Koh & Magee Reference Koh and Magee2006, Reference Koh and Magee2008; Lienhard Reference Lienhard2008), this paper points the way for further quantitative comparisons of models based upon design theory with data. Another line of research that this model suggests is more explicit consideration of interactions and scaling as part of design theories. The current model explores simple models for both of these that are capable of predicting differences in time dependence of performance in differing domains. Design of artifacts could conceptually be changed so that the potential for improvement with ongoing redesign is enhanced possibly through reduced interactions or more intensive scaling relationships. Thus, the current paper suggests the potential importance of further research on specific differences in design approaches with different scaling laws and with different level of interactions.
6 Concluding remarks
The model and simulations of the improvements in performance due to a series of inventions (new designs) over time presented in this work are based upon a simple version of analogical transfer as a combinatorial process among pre-existing operational/inventive ideas. The model is supported by a number of empirically known aspects of technological change including:
-
(1) the transition from slow, hesitant technological change to more sustained technological progress as technological ideas accumulate;
-
(2) a role for the emergence of the scientific process in stimulating the transition in point 1;
-
(3) the exponential increase of performance with time (generalized Moore’s Law) seen quite widely empirically;
-
(4) that stochastic noise in the slopes of the log performance vs time curves is proportional to the slope;
-
(5) the level of effort in domains is not important in the rate of progress.
The model also indicates that:
-
(6) The rate of performance increase in a technological domain is at least partly (and possibly largely) due to fundamental technical reasons (component interactions and scaling of design variables), rather than contextual reasons (such as investment in R&D, scientific and engineering talent, or organizational aspects).
Numerous modeling assumptions were made in developing the model but only some of these are critical to the conclusions just listed. Further specific research is suggested to move some critical assumptions into the testable category, and to consider interactions and scaling parameters in new design approaches. These are discussed in the paper particularly for the assumptions underlying point 6 above. The tests involve detailed studies of the interaction and scaling parameters in a variety of domains. All of this future research could support or lead to modification of point 6.
Acknowledgments
The authors are grateful to the International Design Center of MIT and the Singapore University of Technology and Design (SUTD) for its generous support of this research. They would also like to thank Dr James McNerney for helpful discussion about artifact interactions. The authors also acknowledge valuable input on an earlier version of this paper by Dr James McNerney and Dr Daniel. E Whitney.


 Open access