


Social inequalities are key determinants of health and disease across different populations(Reference Braveman, Egerter and Williams1,Reference Braveman and Gottlieb2) . Health indicators like life expectancy or infant mortality have a stepwise association with socio-economic position (SEP), with health improving incrementally as social position rises(Reference Braveman and Gottlieb2). Evidence from a multinational study of older individuals undertaken in five Latin American countries, India and China, showed that multiple indicators of SEP including education, occupational attainment, assets and pension receipt were inversely associated with total mortality over a 5-year period(Reference Ferri, Acosta and Guerra3).
Diet may constitute a crucial link between social inequalities and disease. Obesity(Reference Drewnowski4), diabetes, IHD, stroke and cancer are known to be associated with both SEP and diet quality(Reference Pampel, Krueger and Denney5,6) . Additionally, and despite methodological differences, a large number of studies show a significant influence of social status over energy, macro- and micronutrient intake(Reference Darmon and Drewnowski7). A systematic review of cross-sectional studies from low- and middle-income countries found that higher SEP was associated with a larger intake of energy, protein and all fat subtypes, and with lower intakes of carbohydrates and fibre(Reference Mayén, Marques-Vidal and Paccaud8).
Although several Latin American countries(Reference López-Olmedo, Carriquiry and Rodríguez-Ramírez9–11) conduct nationally representative nutritional surveys, the association between socio-economic variables and dietary composition has been explored mostly in Brazil and Mexico. The first Brazilian National Dietary Survey (2008–2009) included 13 569 households and found that energy intake was positively and independently associated with income and years of education for both sexes(Reference Araujo, Verly Junior and Junger10). In the last National Health and Nutrition Survey of Mexico (ENSANUT 2012), which included 10 886 households(Reference López-Olmedo, Carriquiry and Rodríguez-Ramírez9), higher SEP was associated with increased energy intake but reduced carbohydrate consumption for both sexes. A prior small, single-city study in Bucaramanga, Colombia, examined dietary intake using a 7-d food diary and encountered a positive correlation of SEP with protein and total fat intake and a negative correlation with carbohydrate intake(Reference Herrán, Prada and Ardila12).
Colombia and other middle-income Latin American countries are currently undergoing an epidemiological and nutritional transition, in which non-communicable diseases represent an ever-increasing share of the disease and mortality burden, while acute and infectious diseases have not been completely eradicated(Reference Ramos-Clason13). Despite its developing country status, non-communicable causes are by far the most significant source of morbidity and mortality in Colombia. This is well illustrated by the fact that CVD, cerebrovascular disease, diabetes and cancer accounted for 68 % of the total deaths in 2015(14). Disorders of energy balance and metabolism have a deep influence on the risk of these conditions, both directly and through their effect on mediating risk factors like BMI, blood pressure, blood lipids and diabetes. The prevalence of overweight and obesity from the five main cities of Colombia in 2018 was 57·5 % in adults (36·2 % overweight, 21·3 % obesity)(Reference Jimenez-Mora, Nieves-Barreto and Montaño-Rodríguez15) and 31·8 % in children and adolescents (23·0 % overweight, 8·8 % obesity). These extremely worrisome figures place Colombia close to countries with a massive epidemic of overweight and obesity like Mexico and the USA. Given that dietary behaviour is a major determinant of energy balance and the risk of developing non-communicable diseases, knowledge of dietary intake and its major correlates is of essential importance for the country. Among these correlates, factors related to SEP have a preeminent relevance.
In spite of the existing evidence about the association between diet composition and indicators of social standing, this relationship and its magnitude have not been extensively studied in Latin America. In order to design and implement successful public health policies, it is imperative to assess the relative contribution of factors like income and education to the nutritional profile of different segments of the population. With this motivation, the present study aimed to dissect the influence of two relevant indicators of SEP: socio-economic stratum (SES) and educational level, on habitual dietary intake in five Colombian cities and to explore whether such influences differ between men and women.
Methods
Study area
Colombia is a Latin-American country, located at the northwestern tip of South America. In 2018, Colombia had an estimated population of 48 million, 78 % of whom lived in urban areas(16). Colombia has a Human Development Index of 0·767, ranking eighty-three out of 189 countries(17). Similar to other Latin American countries, Colombia is characterised by a marked difference in poverty levels and economic development between rural and urban locations. The prevalence of multidimensional poverty is almost 3 times larger in rural than urban areas, mostly due to differences in access to public services and literacy levels(18). The five cities included in this study (Bogota, Medellin, Barranquilla, Cali and Bucaramanga) comprise approximately 30 % of the Colombian population and 38 % of the Colombian urban population(16).
Sampling and data collection
COPEN (Estudio Colombiano de Perfiles Nutricionales – Colombian Study of Nutritional Profiles) was a population-based, cross-sectional, multi-stage sampling survey designed to represent five cities, one from each of Colombia’s major regions. The sampling frame was obtained from the last (2005) census of the Colombian population(19), cartography was obtained from the national geostatistical frame developed by the Colombian National Department of Statistics and data on SES came from the National Superintendence of Public Services. In the first stage of sampling, we selected cartographic sectors, within sectors we selected blocks (on average eight per cartographic sector), within blocks we selected households and within households we selected individual participants. All individuals over the age of 2 were listed and a person was randomly selected. In the case of participants under the age of 13, information was provided by the adult responsible for the participant. The sample was stratified by city, sex, age group and SES of the household.
All data were collected between June and November 2018. Information was captured using a tablet device containing digital forms with proper validation rules, developed for the study. All staff in charge of data collection was extensively trained by the study Principal Investigator. A random 10 % of participants were re-contacted by phone to double-check the accuracy of the information provided on the date of birth, sex, city of residence, marital status, job status, educational level and date of initial contact. With this design and including the design effect, the study sample yielded an overall sampling error of 2·2 % for the prevalence of overweight or obesity in the target population, which was a central objective of the COPEN study. The sampling errors for each city were respectively: Bogota 4·0 %, Medellin 5·0 %, Cali 5·0 %, Barranquilla 5·6 % and Bucaramanga 6·8 %.
Participants
Participants were individuals between the ages of 2 and 75, residing in one of the five cities mentioned above. We excluded foreigners living in Colombia, individuals in haemodialysis or peritoneal dialysis therapy and persons with disabilities that precluded a reliable fulfilment of the study questionnaire.
Socio-demographic and anthropometric variables
We collected information on sex, date of birth and household SES (in all participants), and marital status, individual educational level and employment status (in participants aged 18 or older), using a standardised questionnaire. SES is classified in Colombia by the Statistics Department DANE in six strata according to characteristics of the residence (with stratum 1 being the lowest and stratum 6 being the highest)(Reference Bushnell, Hudson and Hudson20). Residential dwellings are classified according to their physical characteristics and environment. The methodology for this classification creates homogeneous strata taking as input information about land use, public utilities, access routes, topography, land valuation and property characteristics. Residential dwellings are classified in the predominant stratum of the sub-zone, as long as their characteristics do not differ ostensibly from the predominant conditions in the group. Otherwise, they are considered outliers and their stratum is assessed based on their particular characteristics. This information is very well established, updated and freely accessible for all the country(21). It also has a significant correlation with household income. A single score is created, converting and weighing each variable with the Savage score method. Living places are classified in six strata, according to a cluster analysis (with stratum 1 being the lowest and stratum 6 being the highest). Given that socio-demographic, income and human development indicators are more similar for individuals living in strata 4–6 than among the other strata(21), we analysed SES in three groups, corresponding to strata 1–2 (low SES), 3 (medium SES) and 4–6 (high SES). Participants were asked to report what was the highest educational cycle they had completed: pre-school, primary school, secondary school (lasting 6 years, there is no equivalent of high school in Colombia), technical degree, college degree or post-graduate degree. For the effects of analyses, and in order to make findings more comparable with international standards, the variable educational level was operationalised in three categories as: elementary or lower, secondary or technical degree, and college or higher. Only participants aged 18 or older were asked about their educational level, as many underage individuals may still be completing their education. Hence, all analyses involving educational level include only adult participants and have a different sample size. Height was measured using a portable stadiometer supported on a firm surface. Weight was measured employing a solar digital scale with 100 g sensitivity and 200 kg capacity. For the characterisation of the study sample, we analysed BMI in participants under 18 years of age as the Z-score of the sex-specific BMI-for-age curves.
Food frequency questionnaire
Dietary intake was assessed using a semi-quantitative FFQ with a 157-item food list, plus frequency of intake and number of standard portions consumed (with reference portion size written next to this field). This FFQ had been previously developed and piloted in the Colombian population(Reference Monsalve and González22). The Colombian National Nutritional Situation Survey (Encuesta Nacional de Situación Nutricional) in its 2005 version performed a 24-h dietary recall (this was omitted from later versions of Encuesta Nacional de Situación Nutricional). This dietary recall was applied in a randomly selected day of the week to 39 413 non-pregnant male and female participants aged 2–64 years (data were provided by the responsible adult in the case of persons aged less than 13). A second 24-h dietary recall was performed in a random subsample of 3534 participants, in a second, non-consecutive day. Employing the compiled results from this dietary recall, foods were ranked from most to least frequently consumed(23). From the 372 foods listed, 142 were consumed by at least 30 % of the studied population. To this list, three typical regional foods from each of the five regions studied were added, resulting in 157 food items in the FFQ. Portion sizes were calculated according to the coding of weights and measurements in Encuesta Nacional de Situación Nutricional 2005; the unit of measure most frequently reported for each food was used as reference portion size(Reference Monsalve and González22). The average frequency of intake for each food item over the last year was registered as one of nine categories: never, 1–3 times/month, once a week, 2–4 times a week, 5–6 times a week, once a day, 2–3 times a day, 4–6 times a day or more than 6 times a day. A trained staff member administered the FFQ and registered all the information.
Estimation of daily nutrient intake was done as previously described(Reference Willett, Lenarth, Willet and Lenarth24). First, a weighing factor was used to convert each frequency of intake to number of portions consumed in a day. Then a factor was used to convert the number of portions a day to 100-g units. Subsequently, an edible fraction factor was applied. Composition data were obtained from the Colombian Institute of Family Welfare (Instituto Colombiano de Bienestar Familiar) reference tables(25). For foods not in Instituto Colombiano de Bienestar Familiar tables, composition was extracted from the Central America and Panama Nutrition Institute (Instituto de Nutrición de Centro América y Panamá) tables(26) or the US Department of Agriculture food composition database (FoodData Central)(27). For foods not represented in any of these sources, information from the manufacturer was employed. For analyses purposes, we expressed total energy consumption in kJ/kg per d (kcal/kg per d). The consumption of carbohydrates, protein, lipids, SFA, PUFA and MUFA was expressed in g/kg per d, in order to compare diet composition removing the effect of body size. We also analysed differences in the percentage daily kilojoules (kcal) coming from each macronutrient across categories of SES and educational level. Nutrients providing no or negligible energy were analysed in weight units, namely mg/d for cholesterol, g/d for trans fats, g/d for fibre and mg/d for Na.
Data analysis
All estimations were projected to the target study population using city, sex, age group and SES-specific expansion factors according to the study multi-stage sampling design. The mean daily kilojoules (kcal), macronutrients and lipid subtypes (per kg body weight), fibre, cholesterol and Na were compared across categories of categorical predictors using a one-way linear model (ANOVA). We focused on these nutrients because of their proven association with the risk of chronic diseases. When global ANOVA was significant, post-hoc pairwise comparisons were done against a reference category (the lowest) using Dunnett’s method. All analyses were two-tailed and carried out at a 5 % significance level. All analyses were performed in SPSS for Windows, v.21.
Results
The study sample included 1865 participants (914 male and 951 female), most of whom were residents of Bogota (32·2 %), followed by Cali (21·1 %), Medellin (19·8 %), Barranquilla (15·7 %) and Bucaramanga (11·2 %) (Table 1). Mean BMI was 28·0 kg/m2 in female and 25·7 kg/m2 in male adult participants. Only a quarter of participants lived in high SES, and most (44·7 %) lived in low SES households. The most prevalent educational level was secondary or technical, and only 20·3 % had a college or higher degree. The age distribution of the sample resembled the Colombian population pyramid(16).
Characteristics of the study participants
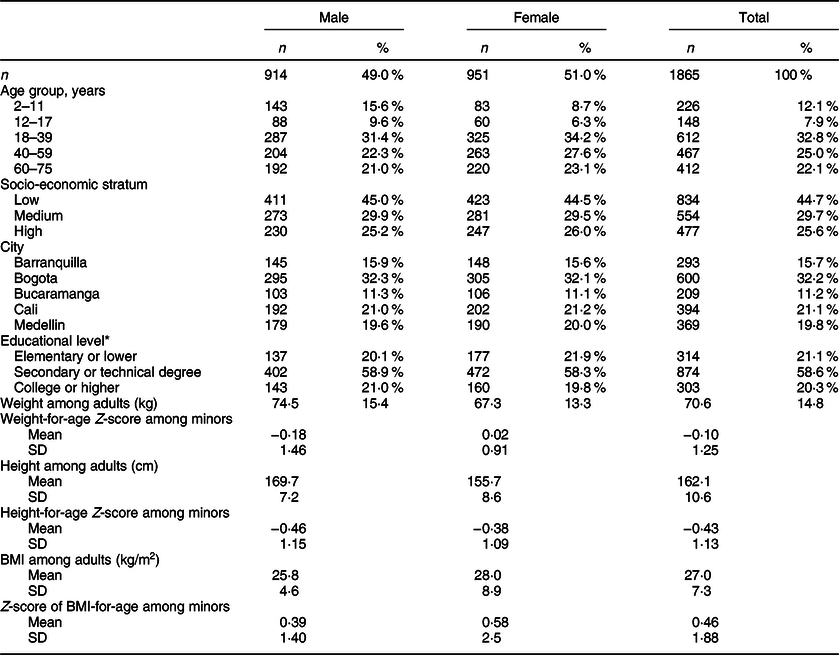
* Educational level only for participants aged 18 or older (n 1491).
Data are expressed as n (%) or mean (SD).
Female sex was associated with a lower intake of energy, all macronutrients (even on a per kg basis) and Na (P < 0·001 for all comparisons). In both sexes, there was a significant decreasing trend in the total intake of energy with increasing levels of SES. For males, the values went from 337 kJ/kg per d (80·5 kcal/kg per d) in low SES to 261 kJ/kg per d (62·3 kcal/kg per d) in high SES (P-trend < 0·001), while for females they went from 301 kJ/kg per d (72 kcal/kg per d) in low SES to 233 kJ/kg per d (55·8 kcal/kg per d) in high SES (P-trend < 0·001). The largest difference, however, was observed between participants in medium SES and those in high SES (Table 2). A similar result was observed for carbohydrates, which went from 10·0 g/kg per d in low SES to 7·6 g/kg per d in high SES among males (P-trend < 0·001), and from 8·9 g/kg per d to 6·4 g/kg per d among females (P-trend <0·001). The intake of all fat subtypes decreased with SES in both sexes, except for MUFA among females.
Estimated intake of energy, macronutrients, trans fats, Na, fibre and cholesterol, by sex and socio-economic stratum

The P-value for the univariate comparison against the lowest educational level (Dunnett’s test) is shown only when global ANOVA was significant.
Meanwhile, dietary patterns by educational level did not display such a clear tendency. Energy intake decreased with increasing education among men, going from 219 kJ/kg per d (52·4 kcal/kg per d) among those with elementary education to 194 kJ/kg per d (46·3 kcal/kg per d) among college graduates (P-trend = 0·036) (Table 3). More educated men also consumed less carbohydrates (6·71 g/kg per d in the lowest category v 5·25 g/kg per d in the highest, P-trend < 0·001). Women with secondary or college education displayed a higher intake of MUFA (0·77 g/kg per d in the lowest category v 0·89 g/kg per d in the highest, P-trend = 0·027).
Estimated intake of energy, macronutrients, trans fats, Na, fibre and cholesterol, by sex and educational level. These analyses included only participants aged 18 or older

The P-value for the univariate comparison against the lowest educational level (Dunnett’s test) is shown only when global ANOVA was significant.
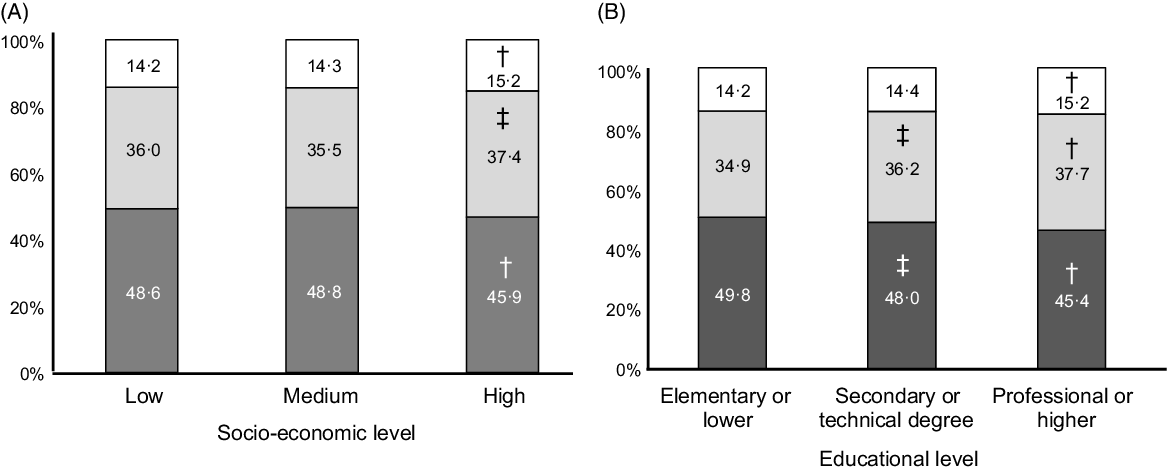
As expected, the intake of all macronutrients per kg body weight decreased markedly across age groups: 73 % for carbohydrates, 69 % for total lipids and 70 % for protein comparing age group 60–75 to age group 2–11. The macronutrient composition of the diet changed only slightly with SES, with significantly less energy coming from carbohydrates (45·9 v 48·6 %, P-trend <0·001) and more from lipids (37·4 v 36·0 %, P-trend = 0·031) and protein (15·2 v 14·2 %, P-trend <0·001) in the highest compared with lowest SES (Fig. 1, Panel A). The trend towards less carbohydrate intake was somewhat more pronounced, and also significant, across educational levels: energy from carbohydrates went from 49·5 % in the lowest to 45·4 % in the highest category (P-trend <0·001, Fig. 1, Panel C). The proportion of MUFA increased with higher SES, at the expense of SFA and PUFA (P-trend < 0·001, Fig. 2, Panel A). The trend towards more energy coming from MUFA and less from PUFA was also significant as educational level increased (P-trend < 0·001, Fig. 2, Panel B).
Estimated intake of macronutrients by socio-economic stratum (Panel A) and educational level (Panel B) (n 1491 for Panel B). Each coloured area represents the proportion of total energy intake from the corresponding macronutrient. †
P < 0·001 v lowest category, ‡
P < 0·01 v lowest category. ![]() , carbohydrates;
, carbohydrates; ![]() , lipids;
, lipids; ![]() , protein
, protein
Estimated contribution of different dietary fat types to total energy intake by socio-economic stratum (Panel A) and educational level (Panel B) (n 1491 for Panel B). SFA, saturated fats; MUFA, monounsaturated fats; PUFA, polyunsaturated fats. †
P < 0·001 v lowest category, ‡
P < 0·01 v lowest category. ![]() , PUFA;
, PUFA; ![]() , MUFA;
, MUFA; ![]() , SFA
, SFA

The intake of trans fats was particularly high in adolescents relative to other age groups (Fig. 3, Panel A). The intake of trans fats increased with SES only among men. This linear trend did not reach statistical significance (P-trend = 0·19), but the pairwise comparison between extreme SES categories did (P = 0·04). Trans fat intake was also higher among more educated men, going from 1·86 g/kg per d in the lowest to 2·26 g/kg per d in the highest education category (P-trend = 0·023). (Fig. 3, Panel B). Na intake was negatively correlated with SES, going from 5262 mg/d in low SES to 4627 mg/d in high SES among males (P-trend = 0·005), and from 4282 mg/d to 4028 mg/d among females (P-trend < 0·001); the same significant trend was observed for Na intake across educational levels in both sexes (Fig. 3, Panels C and D). The absolute difference in Na intake between males and females became smaller with higher education.
Estimated dietary intake of trans fats by age group (Panel A) and socio-economic stratum (Panel B), and dietary intake of Na by socio-economic stratum (Panel C), and educational level (Panel D) (n 1491 for Panel D). In all panels, significant P-values for the comparison v the reference category are indicated by an asterisk. This test involves all participants (male and female) in each category. In Panel A, the reference category is age 12–17, in Panels B–D, the reference category is the lowest. ![]() , male;
, male; ![]() , female
, female

Discussion
In this population-based study of the main Colombian cities, we assessed the influence of SES and educational level on the nutritional attributes of the diet. Our results show that relative to body size, the diet of individuals in a low SES is characterised by a higher intake of Na, carbohydrates and total energy. Education also had an impact on diet composition, so that more educated men consumed slightly less carbohydrates and more detrimental (trans) fats, while more educated women consumed more of the beneficial MUFA. Such information is a valuable input for health policy makers not just from Colombia but from other countries with similar demographics and economic development.
The last two decades have witnessed an unprecedented increase in prosperity in Colombia, a change that should manifest itself in the educational attainment of the population, if social mobility is to be achieved and social inequality mitigated. Despite recent increases in participation rates, the educational system remains heterogeneous in quality, and there is a narrow bottleneck in access to tertiary education(28). According to OECD data, only 25 % of the poorest Colombians went to university in 2016, while 61 % of the richest Colombians did(29). Data collected between 1998 and 2007 showed that Colombian adults with only primary education had more than twice the mortality rates of those with post-secondary education. Further, there is a trend towards reduced mortality over time in the whole population, but the declines are larger for higher-educated men and women(Reference Arroyave, Burdorf and Cardona30).
We used two measures of SEP, one at the household level (SES) and other at the individual level (educational level). According to the taxonomy proposed by Howe et al. (Reference Howe, Galobardes and Matijasevich31), SES may be considered an asset-based measure, as the classification of household is based on the availability of utilities like electricity, sewage and running water, access routes, topography, land valuation and property characteristics. These elements may be considered a better indicator of social position in low- and middle-income countries, in which income or consumption data may be volatile and unreliable(Reference Howe, Galobardes and Matijasevich31). On the other hand, education provided us with a different aspect of SEP, one concerned with the achievement of general literacy, which tends to be a very good correlate of health literacy. The fact that we registered the highest educational milestone achieved helped prevent the confounding effect of individuals who take longer to complete educational cycles(Reference Howe, Galobardes and Matijasevich31). The association of different indicators of SEP with dietary behaviour may vary greatly across populations, especially when comparing low- and middle-income countries with more affluent societies. For example, a very large study in France found that a lower income was associated with larger intakes of meat and poultry(Reference Méjean, Si Hassen and Lecossais32), both sources of dietary protein, while in our results a higher consumption of dietary protein was observed for females with higher SES.
Even though education and income tend to be correlated, in our study of urban residents SES was associated with more aspects of dietary intake than educational level, particularly energy, carbohydrates and Na intake. Meanwhile, educational level was a more important correlate of MUFA and trans fat intake. This has not necessarily been the case in nation-wide studies from other countries like Brazil(Reference Canuto, Fanton and de Lira33) or some European nations(Reference Moreira and Padra34,Reference Rippin, Hutchinson and Greenwood35) , albeit methodological differences preclude direct comparisons. Indeed, compared with income and occupation, education has a greater effect on health-related behaviours like smoking and physical activity(Reference Pampel, Krueger and Denney5), an effect that has been dubbed ‘education gradient’(Reference Zajacova and Lawrence36). In a study in five Latin American countries, the factors wealth, ability to act and cognition explained between 50 and 70 % of this education gradient in dietary behaviour(Reference Trujillo and Fleisher37). Evidence from China suggests that, in certain social contexts, even the educational level of the spouse may have a relevant influence on dietary behaviours, especially among women(Reference Wang, Yamashita and Xu38). In a study undertaken in five Italian cities, being in the highest tertile of educational level was associated with several relevant qualitative dietary behaviours, among them a lower intake of complex carbohydrates and sugary drinks and a higher intake of dairy products, fish, fruits and vegetables(Reference Ricceri, Giraudo and Sieri39). Interestingly, a recent cross-sectional study in Portugal found a higher educational level to be the main correlate of good adherence to a Mediterranean dietary pattern(Reference Teixeira, Afonso and Sousa40). In the Polish National Multi-Centre Health Examination Survey, a composite ordinal score that combined educational level and household income was correlated positively with a better overall diet quality(Reference Zujko, Waśkiewicz and Drygas41). These associations may translate into later impact on harder outcomes. In a long-term follow-up of a population study in Norway, a large difference in total mortality rates was found between the lowest and highest educational level. Health-related behaviours, of which dietary habits constituted a central part, explained between 38 and 45 % of this difference(Reference Laaksonen, Talala and Martelin42). A longitudinal analysis of nationally representative data from the Australian National Nutrition and Physical Activity Survey between 1995 and 2013 showed that individuals in a better SEP (assessed by educational level, household income and area-level disadvantage) tended to improve aspects of their dietary behaviour over the study follow-up, including intakes of energy, total fat, saturated fat and fruits(Reference Olstad, Leech and Livingstone43). These results suggest that in some countries the impact of social inequalities on dietary intakes may be getting more pronounced over time. The impact of education on self-care attitudes, habits and eventually health may be enhanced in Latin America, as access to higher/tertiary education is quite limited(Reference Barro, Lee, Barro and Lee44,45) .
Educational level seemed to have a greater impact on the quality of dietary fats. Although sex differences in dietary intake are well known(Reference McKenzie, Santos and Geldsetzer46), differences in the education–diet association between sexes have been less studied(Reference Mayén, Marques-Vidal and Paccaud8,Reference Araujo, Verly Junior and Junger10,Reference Moreira and Padra34,Reference Woo, Leung and Ho47) . Given that higher education reduces gender inequality in self-rated health and mortality(Reference Ross, Masters and Hummer48), our results support education as a nutrition public policy(Reference Monheit49) and as an instrument for social progress(Reference Kabeer50).
A lower income has been associated with greater intake of energy-dense foods, especially those rich in carbohydrates(Reference Sánchez, Betancur and Gil51,Reference Barquera, Hernández-Barrera and Campos-Nonato52) . A study in US children found that drinking sugary beverages was negatively associated with both SES and work stability of the parents(Reference Grimm, Harnack and Story53). A huge body of evidence supports the negative influence of a high carbohydrate intake on cardiovascular and metabolic health(Reference Dehghan, Mente and Zhang54,Reference Wali, Raubenheimer and Senior55) , labelling it as one of the main sources of the current obesity epidemic(Reference Cao, Wang and Zhang56,Reference Nguyen, Santos and Braun57) . Excess carbohydrate ingestion may be related to easy access to pastries and other sugary foods and drinks, plus limited access to protein-rich foods and sugar substitutes(Reference Regulska-Ilow58).
An interesting result was that a better SEP was associated with both a greater intake of MUFA (present in a Mediterranean dietary pattern)(Reference Tsigalou, Konstantinidis and Paraschaki59) among women and a greater consumption of trans fatty acids (commonly present in ultra-processed and fast foods)(Reference Cornwell, Villamor and Mora-Plazas60,Reference Wanders, Zock and Brouwer61) . Even though this pattern seems contradictory, several other studies have found the same association(Reference Monge-Rojas, Vargas-Quesada and Chinnock62,Reference Monteiro, Rodrigues and Sichieri63) . The larger MUFA intake in more educated individuals in Latin American countries could be explained by the influence of numerous public health campaigns about the negative effects of SFA in cardiovascular and neurological health, combined with the higher cost of MUFA-rich oils(Reference Monge-Rojas, Vargas-Quesada and Chinnock62,Reference Temple64) . Concerning trans fats, the influence of US culture and habits about practical and cheap foods may be greater in higher income groups(Reference Monteiro, Rodrigues and Sichieri63).
As in our investigation, many other studies have reported higher consumption of trans fats among younger persons(Reference Monge-Rojas, Vargas-Quesada and Chinnock62,Reference Monteiro, Rodrigues and Sichieri63,Reference Jiang, Shen and Zhao65) . The intake of trans fats has been increasing rapidly during the last years(Reference Monge-Rojas, Vargas-Quesada and Chinnock62,Reference Jiang, Shen and Zhao65) , despite their well-known harmful effects on CVD and mortality(Reference De Souza, Mente and Maroleanu66). Different factors may explain this phenomenon in underage individuals: first, there is a positive correlation between ingestion of trans fats or sugar-sweetened beverages and time spent watching television(Reference Wiecha, Peterson and Ludwig67). Second, there has been a rise in fast food advertising, and third, such publicity appears mostly in time slots and channels addressing children, adolescents and young adults(Reference Mejía-Díaz, Carmona-Garcés and Giraldo-López68–Reference Barr-Anderson, Larson and Nelson70). Thus, the regulation of advertising to young audiences in terms of quantity and content is a priority target for public health policy.
The conflicting results from different countries concerning the association between SES and dietary intake can reflect the ‘nutrition transition’ concept. Our results illustrate that in cities from middle-income countries like Colombia, low SES groups tend to have a higher energy intake because of increased access to energy-dense foods. Meanwhile, high SES groups tend to avoid such foods because of: (i) greater exposure to information about the increasing rates of obesity and its consequences(Reference Misra and Khurana71,Reference Popkin72) ; (ii) ability to afford non-energy-dense foods like fruits and vegetables, which may be expensive in an urban environment(Reference Pérez-Ferrer, Auchincloss and de Menezes73); (iii) an interest in projecting a socially desirable image of a healthy lifestyle and self-care and(Reference Hébert74) and (iv) the influence of body image models from the mass media that portray leanness as a sign of success and self-fulfilment(Reference Rounsefell, Gibson and McLean75). In this sense, findings from China (1989–1997) are similar to ours(Reference Mayén, Marques-Vidal and Paccaud8). By contrast, countries with different results(Reference Mayén, Marques-Vidal and Paccaud8–Reference Araujo, Verly Junior and Junger10,Reference Bonomo, Caiaffa and César76) could be experiencing an earlier phase of the nutrition transition, in which income is the main determinant of access to nourishment, so low SES groups are exposed to food scarcity. Also, our findings may not reflect the situation in rural areas of Colombia or of other countries at a similar stage of the nutrition transition.
The main strengths of our study include the probabilistic, population-based sample, the representation of geographically and culturally different regions of the country and the use of a FFQ that was adapted to Colombian foods and preparations. The collection of information in a supervised manner by qualified staff and the use of several quality checks helped improve the reliability of study data. The main limitations of the study are those inherent to its cross-sectional design, including the impossibility to explore the long-term health effects of the observed differences in dietary behaviour by SEP. Additionally, our results do not represent dietary habits in rural areas of Colombia, and we did not take into account foods consumed by less than 30 % of the Colombian population. We employed two different indicators of SEP, one of them focused on assets (SES) and the other on education. Our results do suggest that even though these indicators may be correlated, their association with at least some aspects of dietary intake is different. SES has the particularity of being defined by household and not by individual, so within-household variations in income or assets among respondents were not captured by this measure. Nonetheless, most of the variation in income and assets in Colombia (and presumably in other countries) is explained by between-household differences. In a population-based survey in Alberta, Canada, household income was a much better predictor of future survival and health status than respondent income(Reference Southern, Faris and Knudtson77). Self-reported educational level may be subject to misreporting, usually of a higher level, a problem that could weaken associations between the reported variable and dietary intake outcomes. However, ascertaining the maximal educational level of all participants would not be logistically feasible, as there is not a central registry of all degrees granted by Colombian institutions, so this was the best approximation possible under realistic circumstances.
In summary, our results show the strong influence that SEP has on usual diet in the main Colombian cities. Individuals living in lower SES consume significantly more total energy, more carbohydrates and more Na, characteristics extensively documented to correlate with greater risks for obesity, diabetes, CVD and total mortality. Also, this dietary pattern is very likely to be fuelling the current rise of overweight and obesity among the economically disadvantaged in Colombia(Reference Jimenez-Mora, Nieves-Barreto and Montaño-Rodríguez15). A higher educational level was associated with greater intake of cardioprotective MUFA among women but also of the very harmful trans fats among men. Thus, health policies for the lower SES segments in our local context should focus more strongly on strategies aimed at the energetic adequacy of the diet, while those aimed at more educated segments should have a stronger emphasis on the quality of dietary fats.
Acknowledgements
Acknowledgements: We wish to thank COPEN participants for their invaluable patience and collaboration. Financial support: This study was funded by Team Foods Colombia. Authorship: P.J.Q.-P. conceived and performed data analyses, participated in manuscript writing and provided final approval of the paper. P.V.G. conceived and performed data analyses, participated in manuscript writing and provided final approval of the paper. L.D.N.-B. participated in data collection and data analysis and provided final approval of the paper. A.M.-R. participated in data collection and data analysis and provided final approval of the paper. E.C.B. participated in study conception and data analysis and provided final approval of the paper. C.O.M. oversaw all research activities, participated in study conception, data collection, data analysis, manuscript writing and provided final approval of the paper. Ethics of human subject participation: This study was conducted according to the guidelines laid down in the Declaration of Helsinki. All procedures involving research study participants were approved by the IRB of Universidad de los Andes. Participants aged 14–75 years provided written informed consent, and a parent or legal guardian provided written informed consent for all participants under the age of 14 years. In addition, participants aged 7–13 years provided written assent, while in the case of participants aged 2–6 years, informed consent was provided by the adult responsible for the child. All study procedures were performed according to the principles of the Helsinki Declaration and to local rules and regulations as provided by Resolution 8430 of 1993 of the Colombian Ministry of Health. The study was approved by the IRB of Universidad de los Andes (Comité de Ética de la Vicerrectoría de Investigaciones), according to minute 1016 of 27 April 2018.
Conflict of interest:
Even though this study was funded by Team Foods Colombia, it was executed independently by the study authors. The sponsoring company had no influence on data analysis, on the contents of the manuscript or on the decision to publish.


 Open access