





Non-technical Summary
Paleontologists have long struggled to determine when differences between fossils exist because the two fossils came from different species or because the two fossils were different-aged individuals of the same species. In practice, the boundaries between species are often fuzzy, and it is hard to determine how many species of extinct animals we have discovered, or which babies go with which adults. This paper describes an experiment I conducted to see whether the guidelines and statistical tests paleontologists use frequently would allow us to tell American and Chinese alligators apart from their bones alone. They cannot—the methods confuse the two species, and the guidelines are not justified by the fossil record or the modern day. However, I was also able to show that traits relating to the anatomy of the blood vessels, nerves, and sinuses were very unlikely to vary during growth. These traits do allow us to recognize American and Chinese alligators as different species, even when they are very young and superficially resemble each other very closely. These traits are the most reliable, because they reflect very early events in development—the soft tissues of the head appear before bones even start to form and control the eventual shape of the skull bones. I argue that we should emphasize these kinds of traits when we test the species identity of fossils and predict that our understanding of the fossil record will change significantly as these new guidelines are accepted and used by paleontologists.
Introduction
Ontogeny has long been recognized as a key lens for establishing homology, reconstructing phylogeny, and elucidating the mechanisms by which major evolutionary transformations occurred. While ontogeny does not “recapitulate phylogeny” in the Haeckelian sense, it remains the case that heritable trait differences within and between species ultimately arise from modifications to the developmental program and therefore that the manner in which a trait develops during ontogeny conveys valuable information about its evolutionary origin and the phylogenetic relationships of different species. Interest in ontogeny among evolutionary biologists was re-invigorated in the 1970s by Gould (Reference Gould1977), who demonstrated the importance of ontogeny in evolutionary theory and articulated distinct mechanisms (such as heterochrony) that could produce evolutionary change. The ensuing decades have seen the rise of evolutionary developmental biology (evo-devo) as an interdisciplinary field and the establishment of labs that couple data from living animals and the fossil record to study the “great transformations” in vertebrate evolution, including the evolution of jaws (Cerny et al. Reference Cerny, Lwigale, Ericsson, Meulemans, Epperlein and Bronner-Fraser2004, Reference Cerny, Cattell, Sauka-Spengler, Bronner-Fraser, Yu and Medeiros2010; Takio et al. Reference Takio, Pasqualetti, Kuraku, Hirano, Rijli and Kuratani2004; Graham and Richardson Reference Graham and Richardson2012), the origin of tetrapods (Daeschler et al. Reference Daeschler, Shubin and Jenkins2006; Fröbisch and Shubin Reference Fröbisch and Shubin2011; Nakamura et al. Reference Nakamura, Gehrke, Lemberg, Szymaszek and Shubin2016; Stewart et al. Reference Stewart, Lemberg, Taft, Yoo, Daeschler and Shubin2020, Reference Stewart, Lemberg, Daly, Daeschler and Shubin2022; Letelier et al. Reference Letelier, Naranjo, Sospedra-Arrufat, Martinez-Morales, Lopez-Rios, Shubin and Gómez-Skarmeta2021), and the mechanisms underlying anatomical novelties such as the turtle shell (Rieppel and Reisz Reference Rieppel and Reisz1999; Lyson et al. Reference Lyson, Bever, Bhullar, Joyce and Gauthier2010; Moustakas-Verho and Cherepanov Reference Moustakas-Verho and Cherepanov2015; Schoch and Sues Reference Schoch and Sues2015, Reference Schoch and Sues2019; Lyson and Bever Reference Lyson and Bever2020). The origin of birds, and with it dinosaur evolution more broadly, has been the subject of a series of landmark integrative studies clarifying (for example) the role of paedomorphosis in the generation of the avian skull (Bhullar et al. Reference Bhullar, Marugán-Lobón, Racimo, Bever, Rowe, Norell and Abzhanov2012, Reference Bhullar, Hanson, Fabbri, Pritchard, Bever and Hoffman2016); distinct patterns of developmental modularity among birds, relative to other archosaurs (Felice et al. Reference Felice, Watanabe, Cuff, Noirault, Pol, Witmer, Norell, O’Connor and Goswami2019); developmental linkage between the brain and overlying dermal roof bones (Fabbri et al. Reference Fabbri, Koch, Pritchard, Hanson, Hoffman, Bever and Balanoff2017); the identity of the carpal ossifications in living birds and their theropod ancestors (Botelho et al. Reference Botelho, Ossa-Fuentes, Soto-Acuña, Smith-Paredes, Nuñez-León, Salinas-Saavedra, Ruiz-Flores and Vargas2014; Napoli et al. Reference Napoli, Fabbri, Ruebenstahl, O'Connor, Bhullar and Norell2025); and the evolutionary transformations that ultimately created unique avian pelvic and hindlimb anatomy (Egawa et al. Reference Egawa, Saito, Abe and Tamura2018, Reference Egawa, Griffin, Bishop, Pintore, Tsai, Botelho and Smith-Paredes2022; Griffin et al. Reference Griffin, Botelho, Hanson, Fabbri, Smith-Paredes, Carney and Norell2022).
In that time, growth and development have also become leading subjects of interest within vertebrate paleontology sensu stricto (viz., in studies focusing almost exclusively or entirely on the fossil record). However, in paleontology, these quantities of interest have also caused long-standing confusion arising from taxonomic and systematic uncertainty. Trueman (Reference Trueman1924) articulated the “species problem” in paleontology as difficulty in accounting for variation within populations and microevolutionary change in populations through time. The third axis of the species problem was not recognized until somewhat later. Unambiguous juvenile animals were not well documented in the fossil record until juvenile non-avian dinosaurs were first discovered by the American Museum of Natural History Central Asiatic Expeditions at the Gobi desert localities Iren Dabasu, Öösh (=Ashile, Oshii, Oshih), and Bayn Dzak (=Flaming Cliffs), including juvenile material of the ornithischian dinosaurs Bactrosaurus johnsoni (Gilmore Reference Gilmore1933), Psittacosaurus mongoliensis (Coombs Reference Coombs1980), and Protoceratops andrewsi (Brown and Schlaikjer Reference Brown and Schlaikjer1940), which was the first nearly complete growth series of a non-avian dinosaur. As collection priorities for fossil reptiles expanded beyond the recovery of “showpiece” specimens for major universities and museums, there seems to have been a general growth in both the number of and scientific interest in juvenile specimens (Johnson Reference Johnson1977; Horner and Makela Reference Horner and Makela1979; Coombs Reference Coombs1980, Reference Coombs1986; Galton Reference Galton1982; Brinkman Reference Brinkman1988; Horner and Weishampel Reference Horner and Weishampel1988; Horner et al. Reference Horner, Varricchio and Goodwin1992). Perhaps unsurprisingly, this period corresponds closely with resurgent interest in development as a component of evolutionary theory (e.g., Gould Reference Gould1977), which is reflected in a substantial body of literature focusing on allometric scaling of skeletal proportions (Rozhdestvensky Reference Rozhdestvensky1965; Russell Reference Russell1970; Dodson Reference Dodson1975b, Reference Dodson1976; Currie and Carroll Reference Currie and Carroll1984) and early efforts at ontogenetic staging from fossil material (Johnson Reference Johnson1977; Bakker Reference Bakker1982; Callison and Quimby Reference Callison and Quimby1984; Hutchison Reference Hutchison1984; Brinkman Reference Brinkman1988).
The growing body of data on the ontogeny of extinct groups revealed a troubling pattern: ontogenetic changes such as allometric scaling, development of ornamental features, and change in overall body sizes meant that juvenile specimens differ significantly from putative adult conspecifics. Perhaps due to the abundance of well-understood osteological maturity indicators in mammals (e.g., fusion of epiphyses, closure of cranial sutures, and dental eruption sequence), this pattern has overwhelmingly affected nonmammalian paleontology. Mook (Reference Mook1921) was among the first to recognize that ontogenetic variation could obscure species boundaries, and while pronounced ontogenetic differences in non-avian dinosaurs were noted by Gilmore (Reference Gilmore1933) and Brown and Schlaikjer (Reference Brown and Schlaikjer1940), the systematic implications of such differences were first treated extensively by Rozhdestvensky (Reference Rozhdestvensky1965). In light of prior research documenting significant ontogenetic changes and putative body-size differences between species, Rozhdestvensky (Reference Rozhdestvensky1965) synonymized five sauropodomorph species in three genera and four tyrannosaurid species in three genera into a single taxon each—Lufengosaurus huenei and Tarbosaurus bataar, respectively. Rozhdestvensky’s work was followed by applications to the North American fossil record, which similarly reinterpreted small specimens that had been erected as holotypes as juvenile individuals pertaining to other species (Russell Reference Russell1970; Dodson Reference Dodson1975b). This trend has largely continued as methods for determining the ontogenetic stage of fossil material have advanced (for review and commentary, see Griffin et al. Reference Griffin, Stocker, Colleary, Stefanic, Lessner, Riegler, Formoso, Koeller and Nesbitt2020). As more and more specimens have been reinterpreted as skeletally immature, many species have been reinterpreted as morphologically distinct growth stages (sometimes referred to as “semaphoronts” or alternatively as “ontogimorphs,” a term primarily used in the dinosaur-specific literature) of other taxa. Notable examples include the interpretation of the centrosaurine ceratopsids Brachyceratops montanensis and Monoclonius crassus as nomina dubia , based on juvenile materials that may pertain to other centrosaurine taxa (Sampson et al. Reference Sampson, Ryan and Tanke1997); of the chasmosaurine ceratopsians Nedoceratops hatcheri and Torosaurus latus as growth stages of Triceratops (Scannella and Horner Reference Scannella and Horner2010, Reference Scannella and Horner2011); of the identification of the pachycephalosaurs Dracorex hogwartsia and Stygimoloch spinifer as successively mature stages of Pachycephalosaurus wyomingensis (Horner and Goodwin Reference Horner and Goodwin2009); and reinterpretation of Thespesius edmontoni, Edmontosaurus saskatechwanensis, and Anatotitan copei as immature and fully mature stages referable to Edmontosaurus regalis and Edmontosaurus annectens (Campione and Evans Reference Campione and Evans2011). While many of these specific conclusions are debated, these and other cases have been influential in raising awareness that ontogenetic variation may be so significant as to be mistaken for phylogenetic variation between species. Thus, the paleontological “species problem” has a third axis. Not only do populations change over time and individuals within populations vary, but individuals themselves also vary during their own ontogeny. This principle prompted Hennig (Reference Hennig1979) to develop his concept of the “character-bearing semaphoront” and is well-known to systematists, but continues to cause so much difficulty within vertebrate paleontology that I suggest it be referred to as the “ontogeny problem.”
The ontogeny problem is perhaps best exemplified by the dispute that has proven most professionally acrimonious and attracted the most popular attention—the status of the tyrannosauroid taxon Nanotyrannus lancensis, which was initially interpreted as an adult of a small-bodied species of tyrannosauroid (Gilmore Reference Gilmore1946; Bakker et al. Reference Bakker, Williams and Currie1988) but was, until recently, overwhelmingly considered a juvenile Tyrannosaurus rex (Carr Reference Carr1999, Reference Carr2020; Carr and Williamson Reference Carr and Williamson2004; Brusatte et al. Reference Brusatte, Norell, Carr, Erickson, Hutchinson, Balanoff, Bever, Choiniere, Makovicky and Xu2010, Reference Brusatte, Carr and Norell2012, Reference Brusatte, Carr, Williamson, Holtz, Hone and Williams2016; Bever et al. Reference Bever, Brusatte, Carr, Xu, Balanoff and Norell2013; Gold and Norell Reference Gold and Norell2013; Brusatte and Carr Reference Brusatte and Carr2016; Carr et al. Reference Carr, Varricchio, Sedlmayr, Roberts and Moore2017; Voris et al. Reference Voris, Zelenitsky, Therrien and Currie2019, Reference Voris, Zelenitsky, Therrien, Ridgely, Currie and Witmer2022, Reference Voris, Zelenitsky, Kobayashi, Modesto, Therrien, Tsutsumi, Chinzorig and Tsogtbaatar2025; McKeown et al. Reference McKeown, Brusatte, Williamson, Schwab, Carr, Butler and Muir2020; Woodward et al. Reference Woodward, Tremaine, Williams, Zanno, Horner and Myhrvold2020; Schroeder et al. Reference Schroeder, Lyons and Smith2021). I use Nanotyrannus as an exemplar of the philosophical and scientific challenges discussed throughout the paper, given both my own involvement in this debate and its widespread familiarity. The synonymy of Nanotyrannus with T. rex was first suggested by Rozhdestvensky (Reference Rozhdestvensky1965), based on similarity he noted between the type specimen and the specimens he identified as juvenile Tarbosaurus bataar (a close relative of T. rex), but this was not formally proposed until Carr (Reference Carr1999) published the first exhaustive study of tyrannosaurid cranial ontogeny and stated that all putatively distinct features of Nanotyrannus were artifacts of the immaturity of the holotype specimen. Interpretation of N. lancensis as a junior synonym of T. rex requires that T. rex ontogeny was characterized by extreme morphological change, including loss of several tooth positions in both the maxilla and the dentary, development of serrations on its premaxillary teeth, loss of a “premaxillariform” first maxillary tooth, resorption of ornamental crests on the lacrimals, development of ornamental bosses on the postorbitals, closure of a pneumatic recess in the quadratojugal, opening of a medial pneumatic recess in the lacrimals, and a suite of other craniodental changes that led Carr (Reference Carr2020) to describe it as a “secondary metamorphosis.” Proponents of a distinct Nanotyrannus were historically a vocal minority (Larson Reference Larson, Parrish, Molnar, Currie and Koppelhus2013; Schmerge and Rothschild Reference Schmerge and Rothschild2016a,Reference Schmerge and Rothschildb; Longrich and Saitta Reference Longrich and Saitta2024; Paul Reference Paul2025) who did not accept such a degree of morphological change as a plausible aspect of Tyrannosaurus ontogeny. Some authors were more circumspect in regarding Nanotyrannus as representing the juvenile stage of a sister taxon to T. rex (Currie Reference Currie2003b) or regarding the holotype’s unusual features as potential evidence of developmental abnormality, rather than a typical juvenile (Witmer and Ridgely Reference Witmer and Ridgely2010). Only recently, with published evidence from a new, 100% complete, and effectively somatically mature specimen referable to N. lancensis (Zanno and Napoli Reference Zanno and Napoli2025) and histological evidence from the ceratobranchial of the holotype specimen that also indicates somatic maturity (Griffin et al. Reference Griffin, Bugos, Poust, Morris, Sombathy, D’Emic, O’Connor, Petermann, Fabbri and Colleary2025), has the prior consensus been abandoned, with Nanotyrannus recognized as a valid genus that coexisted with Tyrannosaurus in terminal Cretaceous ecosystems in western North America.
The status of Nanotyrannus matters beyond the confines of what may appear to be a simple (if unusually pugnacious) taxonomic dispute. Such questions cast long shadows, with implications for character construction and scoring, phylogenetic analysis, and all downstream evolutionary questions that depend upon resolution of the phylogenetic relationships of the taxa of interest and the ontogenetic trajectories thereof. Nanotyrannus alone is a fulcrum for many outstanding questions in dinosaur paleontology, such as the ontogenetic mechanisms underlying gigantism in tyrannosauroids (Voris et al. Reference Voris, Zelenitsky, Therrien, Ridgely, Currie and Witmer2022, Reference Voris, Zelenitsky, Kobayashi, Modesto, Therrien, Tsutsumi, Chinzorig and Tsogtbaatar2025), the dynamics of Mesozoic ecosystems (Schroeder et al. Reference Schroeder, Lyons and Smith2021; Therrien et al. Reference Therrien, Zelenitsky, Tanaka, Voris, Erickson, Currie, DeBuhr and Kobayashi2023), and whether dinosaurs were in terminal decline before the Cretaceous/Paleogene bolide impact (Brusatte et al. Reference Brusatte, Butler, Barrett, Carrano, Evans, Lloyd and Mannion2015); the recognition of a valid Nanotyrannus therefore forces downstream reevaluation of many hypotheses that derived from its prior mistaken identity (Zanno and Napoli Reference Zanno and Napoli2025). Systematics underlies every question in evolutionary biology, and cases such as Nanotyrannus have clear broader relevance as well. Hennig (Reference Hennig1979) articulated the principle that every individual organism should be seen as a character-bearing semaphoront of a particular ontogenetic stage of the species to which it belongs. Juveniles, by definition, have not completed development and will therefore lack apomorphies that appear late in ontogeny. Perhaps unsurprisingly, “stemward slippage” of juvenile individuals in morphological phylogenetic analyses is a widespread phenomenon (Sereno et al. Reference Sereno, Tan, Brusatte, Kriegstein, Zhao and Cloward2009; Kammerer Reference Kammerer2011; Tsuihiji et al. Reference Tsuihiji, Watabe, Tsogtbaatar, Tsubamoto, Barsbold, Suzuki, Lee, Ridgely, Kawahara and Witmer2011; Campione et al. Reference Campione, Brink, Freedman, McGarrity and Evans2012; Carballido and Sander Reference Carballido and Sander2013; Choiniere et al. Reference Choiniere, Clark, Forster, Norell, Eberth, Erickson, Chu and Xu2013; Moore et al. Reference Moore, Mo, Clark and Xu2018). Integrating ontogenetic information in phylogenetic analyses has been a topic of rich discussion in its own right (de Queiroz Reference de Queiroz1985; Mabee Reference Mabee and Wiens2000); suffice it to say that morphological systematics, as employed in vertebrate paleontology, depends upon both knowledge of which individuals are juveniles of which taxa and what traits are phylogenetically variable in each study system to avoid being biased by stemward slippage of juveniles. Many informative characters for tyrannosauroid systematics were not integrated into phylogenetic analyses for decades, because they were mistaken for juvenile features due to their presence in animals such as Nanotyrannus and the immature holotype of Alioramus altai (Zanno and Napoli Reference Zanno and Napoli2025). This principle extends to taxonomy. If T. rex experienced dramatic posthatching ontogenetic transformations, it would be unlikely to be the only species that did so. Resolution of the status of Nanotyrannus is therefore important for establishing expectations (and thus null hypotheses) for testing the taxonomic affinities of other specimens. Indeed, general acceptance of Nanotyrannus as a juvenile morph of Tyrannosaurus was likely itself influenced by the previously discussed proposals of extreme ontogenetic changes among ornithischians, many of which have been questioned (Farke Reference Farke2011; Longrich and Field Reference Longrich and Field2012; Mallon et al. Reference Mallon, Holmes, Bamforth and Schumann2022) or appear to be falling out of favor. It is important to note that the very same characters (e.g., differences in dental count, unserrated premaxillary teeth, presence of a lacrimal cornual processes) that some posited as evidence in favor of Nanotyrannus being a juvenile T. rex are among the evidence that Nanotyrannus is a valid species, suggesting that the persistence of the Nanotyrannus debate and the ontogeny problem more broadly reflect analytical assumptions and methods to a greater degree than they reflect the body of available data.
Paleontologists agree on one point—the status of putative taxa based on juvenile holotypes can only be definitively resolved by the discovery of clearly mature specimens pertaining to the same species that are clearly not their putative synonym (e.g., the “Dueling Dinosaurs” specimen of N. lancensis), or multi-individual bonebeds that clearly show the ontogenetic trajectory of the synonymous taxon. While these “Rosetta Stone” specimens have tremendous importance and may be considered the gold standard, this is not a tenable general solution, because there is no guarantee that such specimens, if they exist, will ever be found. Rather, we must scrutinize the assumptions and methods used by paleontologists to test these hypotheses from the available data, to determine what deficiencies in them allow competing groups of researchers to draw diametrically opposed conclusions from the exact same suite of character evidence. One pervasive assumption is that a given rock unit will have only one species per ecological guild (sometimes relaxed to allow multiple species per guild, but none from the same clade), under the presumption that coexistence of two or more species with an overlapping niche would be impossible. Both Rozhdestvensky (Reference Rozhdestvensky1965) and Dodson (Reference Dodson1975b) explicitly list ecological considerations (viz., the coexistence of multiple large-bodied and closely related species) as part of their rationale for synonymizing multiple species as growth stages of others, and in my experience, this assumption is now often implicit despite guiding both specimen referral and the perceived “reasonability” of taxonomic hypotheses. Implicit or explicit, this assumption is unjustifiable. Many extinct ecosystems preserve a wide range of closely related (and often large-bodied) species at even high trophic levels. Among dinosaurs, the Jurassic Morrison Formation appears to have hosted multiple species of large carnivores and a diverse assemblage of sauropods, and the Cretaceous Dinosaur Park Formation attests to a remarkably diverse fauna of coexisting multi-ton hadrosaurs, ceratopsians, ankylosaurs, and tyrannosaurs (Currie Reference Currie2003b; Brown et al. Reference Brown, Evans, Campione, O’Brien and Eberth2013; Paulina Carabajal et al. Reference Paulina Carabajal, Currie, Dudgeon, Larsson and Miyashita2021). Cretaceous localities in the Gobi Desert of Mongolia also often preserve coexisting members of the same clade. At Ukhaa Tolgod, there is evidence of at least two dromaeosaurid species (Norell et al. Reference Norell, Clark, Turner, Makovicky, Barsbold and Rowe2006), two oviraptorosaur species (Clark et al. Reference Clark, Norell and Barsbold2001), and four troodontid species (Norell et al. Reference Norell, Makovicky and Clark2000; Norell and Hwang Reference Norell and Hwang2004; Pei et al. Reference Pei, Norell, Barta, Bever, Pittman and Xu2017); two dromaeosaurids are also present at Khulsan (Napoli et al. Reference Napoli, Ruebenstahl, Bhullar, Turner and Norell2021; Turner et al. Reference Turner, Montanari and Norell2021), and at least two tyrannosaurids are known from the Nemegt Formation (Brusatte et al. Reference Brusatte, Carr, Erickson, Bever and Norell2009, Reference Brusatte, Carr and Norell2012). It is noteworthy that the majority of dinosaur species are known from only a single individual, and therefore that in many of these paleo-ecosystems, further sampling will almost assuredly reveal even greater diversity. For comparison, the mammalian paleobiota of Rancho La Brea includes at least five large felids (Panthera atrox, Panthera onca, Puma concolor, Smilodon fatalis, and Homotherium serum), three ursids (Ursus americanus, Ursus arctos, and Arctodus simus), and three canids (Aenocyon dirus, Canis latrans, and Canis lupus), to discuss only the highest trophic levels at which we might expect competitive exclusion to be most common.
This is to say nothing of the abundance of modern, easily observable examples of co-occurrence of modern species. A full survey is impossible to present here, but crocodylians present an instructive case study. Extant crocodylians are ecologically similar semiaquatic predators and are known to change prey choice as they grow—a phenomenon that Dodson (Reference Dodson1975b) specifically posited would preclude coexistence of multiple species with different body sizes (under the reasoning that juveniles of the larger species would fully overlap with the niche of the smaller). Nevertheless, coexistence of multiple, differently sized crocodylian species is the rule, rather than the exception; Crocodylus acutus (American crocodile) and Crocodylus porosus (saltwater crocodile) both share portions of their range with approximately a half-dozen other species. Nile crocodiles (Crocodylus niloticus) coexist with the sacred crocodile (Crocodylus suchus), which are so morphologically similar that the two species were mistakenly synonymized until recently (Schmitz et al. Reference Schmitz, Mansfeld, Hekkala, Shine, Nickel, Amato and Böhme2003; Hekkala et al. Reference Hekkala, Shirley, Amato, Austin, Charter, Thorbjarnarson, Vliet, Houck, Desalle and Blum2011; Brochu and Sumrall Reference Brochu and Sumrall2020), and coexisted with the extinct Voay robustus in Madagascar well into historical times (Hekkala et al. Reference Hekkala, Gatesy, Narechania, Meredith, Russello, Aardema and Jensen2021). This pattern is also evidenced in the Middle Miocene Amazon, where at least seven species of crocodylians are currently known (Salas-Gismondi et al. Reference Salas-Gismondi, Flynn, Baby, Tejada-Lara, Wesselingh and Antoine2015). A particularly sobering example is that reported by Marioni et al. (Reference Marioni, Araújo, Villamarin and Da Silveira2013), who caught individuals of four caiman species (Caiman crocodilus, Melanosuchus niger, Paleosuchus trigonatus, and Paleosuchus palpebrosus) at a single locality on the Purus River. Each was of a different ontogenetic stage, and when placed next to each other, it is easy to imagine a future paleontologist mistaking their remains as constituting a growth series of one taxon. A familiar mammalian corollary example are lions and tigers, which historically shared a large overlapping range from Anatolia to the Indian subcontinent and still coexist in the Gir Forest (despite extirpation of both taxa from much of their formerly shared range). Lions and tigers are reliably differentiated by only one cranial character (Williams et al. Reference Williams, Loveridge, Newton and Macdonald2015), despite not even being sister taxa among extant pantherines (Davis et al. Reference Davis, Li and Murphy2010; Mazák et al. Reference Mazák, Christiansen and Kitchener2011); lions are consistently placed closer to leopards, which coexist with both taxa. Put simply, sympatry plus similarity does not equal synonymy.
The assumption that only one species per loosely defined “clade” or “guild” should be present in any extinct fauna is not justifiable, but has led to a corollary epistemological principle: establishing that a specimen is a juvenile is often taken as equivalent to establishing that it is a juvenile of a previously named taxon. Clearly, this is a problematic position. Most studies that synonymize taxa as growth stages of others (Horner and Goodwin Reference Horner and Goodwin2009; Scannella and Horner Reference Scannella and Horner2010; Woodward et al. Reference Woodward, Tremaine, Williams, Zanno, Horner and Myhrvold2020) lack any detailed treatment of diagnostic traits or autapomorphies present in both the adult taxon and its putative juveniles; morphological evidence, if presented at all, mostly describes the differences between the hypothesized growth stages, rather than derived characters justifying the inclusion of the specimens under consideration within one species. This approach is obviously problematic in that it provides no positive evidence for the taxonomic identity of the specimen(s) of interest. When the possibility that juveniles pertain to distinct taxa is addressed, it is often dismissed with an appeal to parsimony (e.g., “the simplest explanation is that these are all members of the same species”), which again fails to provide positive evidence in favor of the conclusion (and it is unclear whether invoking extreme morphological change during ontogeny should even be considered more parsimonious than erecting a new taxon). The maturity of a specimen is a question separate from its identity, and these questions must be answered separately. Apomorphy-based identification of fossil material, in which the synapomorphies present in a specimen are used to justify referral to increasingly exclusive phylogenetic groups, may be employed in conjunction with osteohistological maturity assessment and stratigraphic placement of the specimen to test taxonomic hypotheses. While this approach does not always allow referral to the species level, it minimizes the possibility of inadvertently creating chimeric assemblages and leverages the greatest available positive evidence (Norell Reference Norell1989; Nesbitt et al. Reference Nesbitt, Irmis and Parker2007; Nesbitt and Stocker Reference Nesbitt and Stocker2008; Bell et al. Reference Bell, Gauthier and Bever2010; Brochu and Sumrall Reference Brochu and Sumrall2020; Napoli et al. Reference Napoli, Ruebenstahl, Bhullar, Turner and Norell2021). However, it remains true that juvenile animals lack the full suite of characters present in adult conspecifics, so it is understandable that many workers have placed less of a premium on morphological data and accordingly increased their emphasis on alternative lines of evidence. It is also important to note that monospecific assemblages have corroborated expectations of extreme ontogenetic change in some taxa, including the theropods Coelophysis bauri, which shows highly variable ontogenetic trajectories (Griffin and Nesbitt Reference Griffin and Nesbitt2016), and Limusaurus inextricabilis, which experiences a series of pronounced transformations, including a complete loss of teeth (Wang et al. Reference Wang, Stiegler, Amiot, Wang, Du, Clark and Xu2017). Therefore, apomorphy-based identification alone is clearly insufficient to resolve this problem without some a priori knowledge of which characters are ontogenetically variable.
Quantitative morphological analyses offer a potential solution. When large datasets are available, they can be studied with either linear or landmark-based morphometric methods (Dodson Reference Dodson1975b, Reference Dodson1976; Forster Reference Forster1996; Currie Reference Currie2003a; Campione and Evans Reference Campione and Evans2011; Hedrick and Dodson Reference Hedrick and Dodson2013; Maiorino et al. Reference Maiorino, Farke, Kotsakis and Piras2015; Evans et al. Reference Evans, Cullen, Larson and Rego2017; Wosik et al. Reference Wosik, Goodwin and Evans2018; Mallon et al. Reference Mallon, Bura, Schumann and Currie2020; Powers et al. Reference Powers, Sullivan and Currie2020). Species identity can be assessed by either the presence of multiple allometric trendlines (i.e., distinct ontogenetic trajectories) or, as is now more common, the presence or absence of multivariate morphospace clusters. Other workers prefer to emphasize discrete characters, analyzing them quantitatively under phylogenetic algorithms. This approach was developed by Brochu (Reference Brochu1996) for developmental staging of crocodylians and has been used to describe ontogenetic stages in a wide array of taxa (Carr and Williamson Reference Carr and Williamson2004; Tumarkin-Deratzian et al. Reference Tumarkin-Deratzian, Vann and Dodson2006; Carr Reference Carr2010, Reference Carr2020; Longrich and Field Reference Longrich and Field2012; Frederickson and Tumarkin-Deratzian Reference Frederickson and Tumarkin-Deratzian2014; Ezcurra and Butler Reference Ezcurra and Butler2015; Carr et al. Reference Carr, Varricchio, Sedlmayr, Roberts and Moore2017; Foster et al. Reference Foster, Brusatte, Carr, Williamson, Yi and Lü2022), including an explicit use by Zietlow (Reference Zietlow2020) to simultaneously test taxonomic hypotheses, search for sexual dimorphism, and describe ontogenetic transformations in mosasaurs. An extension of this method, ontogenetic sequence analysis (Colbert and Rowe Reference Colbert and Rowe2008), incorporates sequence polymorphism rather than only considering a consensus tree, and while rarely applied to systematic questions, it has yielded important insights into developmental variability in fossil taxa (Griffin and Nesbitt Reference Griffin and Nesbitt2016).
Despite the increasing adoption of quantitative approaches to taxonomic hypothesis testing, there have been few attempts to validate how such methods perform when applied to datasets in which all specimens have a known taxonomic identity (i.e., extant datasets). This is a major gap in the literature. It is intuitively appealing to suggest that every species should form its own unique allometric trendline, morphospace cluster, or clade in a cladistic analysis, but without empirical validation of these expectations we cannot be sure that our quantitative methods are fair tests of the hypotheses of interest. Furthermore, it is rare for taxonomic decisions to be made solely on the basis of quantitative optimality criteria (e.g., diagnosing the number of clusters in morphospace using clustering analysis, rather than visual examination)—and even when such methods are used, misapplication can bias results in favor of erroneous conclusions (Carr et al. Reference Carr, Napoli, Brusatte, Holtz, Hone, Williamson and Zanno2022; Paul et al. Reference Paul, Persons and Van Raalte2022). More commonly, results of quantitative analyses are interpreted visually to guide final taxonomic decisions, which reintroduces subjectivity and at worst may result in, as the saying goes, using statistics “like a drunk man uses a lamp post; more for support than illumination.”
The goal of this paper is twofold. First, I critically evaluate morphometric and cladistic approaches that have been employed to test taxonomic hypotheses incorporating ontogenetic series to determine whether they allow confident and repeatable quantitative species delimitation among species of known taxonomic identity. Second, I seek ontogenetically invariant characters that differ between closely related extant species and couple them with data from developmental biology to articulate a simple model to predict whether character differences are compatible with ontogenetic variation or are more likely to suggest that a pair of specimens pertain to different species.
Methods
Sampling and Study System
I use the genus Alligator as a study system. The genus Alligator contains two extant species—the American alligator (Alligator mississippiensis) and the Chinese alligator (Alligator sinensis). The American alligator is a “model archosaur” that is used frequently in paleobiological studies of non-avian dinosaurs due to its easy availability; live animals can be studied in vivo in zoos, and eggs and fresh animals are easily obtained commercially or from sources such as the Rockefeller National Wildlife Refuge. No comprehensive anatomical description of the American alligator yet exists, but thorough documentation of its cranial osteology, pneumatic sinus systems, and vasculature allows for detailed anatomical study (Witmer Reference Witmer1995, Reference Witmer1997; Dufeau and Witmer Reference Dufeau and Witmer2015; Porter et al. Reference Porter, Sedlmayr and Witmer2016; Schwab et al. Reference Schwab, Young, Walsh, Witmer, Herrera, Brochu, Butler and Brusatte2022). For these reasons, the American alligator forms a natural choice of model system. Its closest living relative is the Chinese alligator, a smaller and critically endangered species. The skull of this animal was described briefly by Mook (Reference Mook1923) and extensively by Cong et al. (Reference Cong, Hou, Wu and Hou1998). Only a summary of the latter is presently available in English, so many of my anatomical interpretations are based upon comparison with the American alligator. This pair of sister species is an ideal model for stress-testing paleontological approaches to species delimitation. The two taxa have never been suggested to be synonymous, and cryptic species have been identified in neither—establishing their monophyly with reasonable confidence. Chinese alligators are small relative to American alligators and retain more juvenile-like proportions (e.g., larger eyes) into adulthood, and so allow critical appraisal of the ability of these approaches to accommodate ontogenetic trajectories with different endpoints. Furthermore, any paleontological analysis runs the risk of including singletons or small samples of a taxon that is not recognized, and it is possible that an overriding signal of the ontogeny of better-sampled species would obscure the distinctiveness of these “interloper” specimens. Therefore, I also included a single spectacled caiman (Caiman crocodilus) in the dataset. Including a single spectacled caiman allows for an explicit test of our ability to detect and identify such interlopers within a dataset dominated by better-represented species
Data Acquisition
A total of 57 specimens (43 A. mississippiensis, 13 A. sinensis, and 1 C. crocodilus) were μCT scanned at the American Museum of Natural History Microscopy and Imaging Facility and incorporated into the present study. This sample included all scannable individuals of A. sinensis and the maximal growth series of both taxa obtainable from the AMNH Herpetology collections; only the largest (presumably male) A. mississippiensis could not be scanned, because they exceeded the size of the scanning chamber, and as such these specimens were not included in the present analysis. Wild-collected specimens were preferred, due to the well-documented tendency for captive animals to display aberrant morphology (O’Regan and Kitchener Reference O’Regan and Kitchener2005; Drumheller et al. Reference Drumheller, Wilberg and Sadleir2016). Several included individuals of A. sinensis are of unclear provenance—online collections records list the country of origin as “China,” but collections tags indicate that the specimens had been obtained from the New York Zoological Society—the organization that established the Bronx Zoo and now also manages the Central Park, Prospect Park, and Queens Zoos along with the New York Aquarium. Of these, two exhibited the “tooth splaying” that is characteristic of captive crocodylians (Drumheller et al. Reference Drumheller, Wilberg and Sadleir2016); I suspect these animals were captured in the wild, exhibited at the Bronx Zoo, and donated to the AMNH after their deaths. Given the restricted available sample of A. sinensis, I elected to include these specimens in my analyses. This decision is further justified by recent study of captive and wild A. mississippiensis, which found that captive individuals occupied a wider, but overlapping, morphospace with wild conspecifics and concluded that captive specimens need not be excluded from sampling (Drumheller et al. Reference Drumheller, Wilberg and Sadleir2016). While it is possible that this adds a slight bias to my morphometric analyses, I further note that discrete characters are not known to be aberrant in captive animals (and that the present study implies that such variation is unlikely). Scanning parameters (including voltage, current, exposure time, and resolution) varied depending on the size and density of the specimen, and were optimized for maximal X-ray penetration at the smallest feasible voxel size. Scans and associated metadata are reposited on MorphoBank. Scans were reconstructed and stitched (when necessary) into single 16-bit TIFF image stacks before being imported into VG Studio Max for segmentation and export as surface meshes for landmarking and character scoring. Four specimens, representing terminal end-members of the ontogeny of both species, were selected for full segmentation, during which every bony element of the cranium was isolated and exported as a separate 3D mesh to facilitate detailed anatomical study and character construction. These specimens included AMNH R 8011 (juvenile A. mississippiensis), AMNH R 8058 (adult A. mississippiensis), AMNH R 175172 (juvenile A. sinensis), and AMNH R 23899 (adult A. sinensis). Several scans were discarded a posteriori, because the specimens moved during scan acquisition (making the final scan dataset blurry or distorted) or due to then-unknown challenges within the specimens (e.g., the presence of metal wire within a skull that had presumably once been a teaching or display specimen).
Geometric Morphometrics
Geometric morphometrics (GM) is a widely used method for quantifying the shape of anatomical structures that has been leveraged for the study of myriad evolutionary and systematic questions in numerous study systems. Summarized briefly, the method uses Procrustes-aligned coordinates of anatomical landmarks in 2D or 3D space as variables for multivariate ordination analyses, reducing the dimensionality of the dataset to reveal a morphospace. Many recent paleontological studies have used landmark data to test taxonomic hypotheses and have gradually replaced univariate regression approaches. I therefore sought to test whether closely related modern species reliably form distinct morphometric clusters during ontogeny. My landmark sampling protocol includes 54 landmarks (Fig. 1), consisting of type I, type II, and type III landmarks (see Supplementary Table S1). Semilandmark curves or patches were not used. Landmark numbers and definitions are listed in Supplementary Appendix I and are shown graphically in Figure 1. Landmarks 1–12 were placed in dorsal view, 13–23 in lateral view, 24–32 in posterior view, 33–46 in ventral view, and 47–54 in nonstandard views; all landmarks were placed on only the left side (except those that lie on the midline). Palatal landmarks were placed on the left anterior element to allow landmarking in young juveniles with incompletely ossified palatal bones. Specimens were landmarked in Stratovan Checkpoint. In total, 56 specimens (43 A. mississippiensis, 12 A. sinensis, 1 C. crocodilus) were landmarked. Analyses were conducted in R using the packages geomorph (Baken et al. Reference Baken, Collyer, Kaliontzopoulou and Adams2021; Adams et al. Reference Adams, Collyer, Kaliontzopoulou and Baken2024) and Morpho (Schlager Reference Schlager, Zheng, Li and Székely2017), following a standard pipeline in which landmark data were Procrustes-transformed before analysis using principal components analysis (PCA). Missing landmarks were estimated using the estimate.missing() function. To assess the influence of incomplete sampling in the fossil record, I conducted multiple sensitivity analyses in which select individuals were deleted. One replicate included only one juvenile per taxon, one each with only juveniles of A. mississippiensis or A. sinensis, and one each with no adults of either taxon. All analyses included the single adult C. crocodilus.
Skull of Alligator mississippiensis (AMNH R 8058) in A, dorsal; B, ventral; C, posterior; and D, left lateral views. Numbers denote landmark identities, defined in Supplementary Table S1. Landmark 19 was digitized on the left side, but is shown on the right in ventral view for visibility. Landmark 48 is denoted as “est.” because this specimen lacks a complete pterygoid ala, and the landmark is placed in its approximate position. Landmark 52 is obscured by the jugal in lateral view.

Figure 1. Long description
The four panels are arranged vertically.
Panel A shows the dorsal view. Landmarks 1 and 3 are at the tip of the snout. Moving posteriorly along the midline and right side are landmarks 2, 4, 5, 6, 15, 16, 7, 8, 49, 9, 10, 12, 11, and 50 at the back of the skull.
Panel B shows the ventral view. Landmark 54 is at the anterior tip. Along the midline are 46, 45, 44, 36, 34, and 33. On the left side of the image are landmarks 13, 14, 42, 41, 39, 40, 43, 38, 37, 35, 30, 29, 31, and 32. Landmark 19 is isolated on the right side for visibility.
Panel C shows the posterior view. Landmarks are clustered around the foramen magnum and occipital region, including 26, 28, 27, 25, 24, 51, 47, and 48 which is marked as estimated.
Panel D shows the left lateral view. Landmarks 13 and 14 are on the upper jaw. Moving toward the back are 41, 47, 18, 17, 20, 52 which is noted as behind the jugal, 53, 23, 21, and 22 at the posterior-most point.
Determination of morphospace clusters is inherently subjective, so to objectively determine whether the GM analyses suggest the presence of distinct taxa, I subjected the PC scores for each taxon to agglomerative hierarchical clustering—a method that can search for clusters emergent within a multidimensional dataset and report the optimal number of clusters within a dataset, and is therefore potentially useful for paleontological studies attempting to test the monospecificity of a fossil assemblage. Agglomerative hierarchical clustering was implemented via the R package factoextra (Kassambara and Mundt Reference Kassambara and Mundt2020).
Cladistic Analysis of Ontogeny. Because cladistic analysis of ontogeny (cladistic ontogeny hereafter) is primarily employed by a small group of researchers, it warrants brief explanation here. Brochu (Reference Brochu1996) extensively surveyed the crocodylian postcranial skeleton and documented the sequential addition of characters throughout ontogeny. He scored these discrete characters in a phylogenetic matrix and analyzed it under parsimony-based phylogenetic methods to develop a staging scheme for determining the maturity of crocodylians that was, at least theoretically, independent of size (though given that size and maturity both increase during ontogeny, they are surely autocorrelated and are thus not truly independent). This method depends on an explicit analogy between ontogeny and evolution as proceeding from the sequential addition of characters over time. In cladistic ontogeny, shared ontogenetic characters that define successively mature growth stages are referred to as “synontomorphies,” rather than synapomorphies, with the equivalent of plesiomorphies usually simply called the “immature state.” The out-group is an artificial operational taxonomic unit (OTU) that bears only the immature state (identified a priori) for each character, which is often termed an “artificial embryo.” The resulting branching diagram represents not a cladogram but an “ontogram,” and diminishingly inclusive groups correspond to progressively mature growth stages.
The method was first applied to document ontogenetic development in extinct animals by Carr and Williamson (Reference Carr and Williamson2004) in their study of Tyrannosaurus rex ontogeny, and it was first used to address the ontogeny problem by Longrich and Field (Reference Longrich and Field2012), who scored individuals of both Torosaurus and Triceratops to establish that some individuals of the former were subadults at the time of death and thus logically could not represent fully mature individuals of the latter. Zietlow (Reference Zietlow2020) expanded the purview of cladistic ontogeny further in her study of three species of the mosasaurid squamate Tylosaurus from the Western Interior Seaway of North America. This study includes an attempt to combine ontogenetic and phylogenetic data into a single analysis and articulates explicit hypotheses regarding how an ontogram topology would reflect different scenarios. If two species have morphologically similar juveniles, Zietlow (Reference Zietlow2020) proposed that the least mature specimens would resolve as successive out-groups to an ontogram “split,” after which each taxon would form its own “clade” due to divergence of ontogenetic trajectories. If juveniles were morphologically distinct or undersampled, Zietlow (Reference Zietlow2020) further predicted that the ontogram would split near the root, with no individuals plotting outside clades corresponding to the different species. Finally, Zietlow (Reference Zietlow2020) predicted that the ontogram would show a single ladder-like topology if the two species broadly shared an ontogenetic trajectory, in which some characters would resolve as repeated “autontomorphies” of different individuals and thus provide evidence that these individuals pertained to one taxon. The same paper also proposes that these topological signals may also indicate sexual dimorphism. These expected topological signals were applied to interpretation of Zietlow’s (Reference Zietlow2020) Tylosaurus data, but have not been validated empirically, and I sought to test them here.
I compiled a discrete character matrix describing cranial ontogeny and phylogenetic variation in the genus Alligator. Character-state descriptions were based upon the four exemplar specimens subjected to full CT segmentation, which allowed the digital isolation and visualization of every bony element in the cranium, and permitted a detailed character search. To properly simulate a de novo search for ontogenetic characters in the fossil record, I avoided sourcing characters from the literature, although it is probable that I have independently identified characters incorporated into phylogenetic analyses of crocodylians. Character sampling was performed in the 3D modeling and animation program Blender. Each element was imported and rotated into a standardized orientation, scaled to the same size, and positioned so I could simultaneously compare all four exemplars of a particular element in orthographic projection. This approach completely eliminates distractions of size and parallax while conducting anatomical comparisons. First, I surveyed for differences between juveniles and adults of the two taxa, with the naïve assumption that they are of purely ontogenetic origin. I then compared the juveniles of the two species for character differences, and finally the two adults. After comparisons were made, I wrote character descriptions making sure to capture all states observed in the exemplar individuals. I followed the principles of contingent coding articulated by Brazeau (Reference Brazeau2011) to accommodate cases in which a structure appeared during ontogeny and required subsidiary characters to describe its morphology. The full character matrix includes 189 discrete characters (see Supplementary Information I).
Not all possible characters were constructed due to practical difficulty in scoring other specimens—for example, joint surfaces between crocodylian cranial bones tend to develop into highly interdigitate sutures during ontogeny, but external suture traces belie internal suture complexity, and thus complexity cannot be fully assessed without a full CT segmentation. The a priori identified immature state for each character generally corresponded to that shown by juvenile A. sinensis (the smallest exemplar juvenile), except in cases where the juvenile A. mississippiensis lacked a structure present in the other juvenile. This approach mimics the paleontological implementation of cladistic ontogeny, in which juvenile character states are usually determined by comparison of multiple individuals and summarized as a composite “artificial embryo.” I further tested additional out-group protocols to determine how they affected character polarity and the resultant ontogram topology. I ran further analyses using each juvenile exemplar as the out-group, one in which I used the adult C. crocodilus as an out-group (mirroring its phylogenetic relationship to the remaining study animals), and one in which the Caiman was excluded, leaving only specimens within the genus Alligator. I scored 32 specimens, avoiding repetitive scoring of a large sample of juvenile A. mississippiensis with sequential specimen numbers that I presume were collected from the same nest, which yielded largely identical scores. I analyzed the cladistic ontogeny dataset in TNT v. 1.5 (Goloboff and Catalano Reference Goloboff and Catalano2016) under the following search parameters: multiple replicates of new technology searches until 20 hits at the shortest tree length were obtained, after which the best trees were subjected to a final iteration of tree bisection and reconnection branch swapping and zero-length branches were collapsed. Strict, 50% majority rule, and Adams consensus topologies were used to summarize the results.
Survey for Ontogenetically Invariant Characters
The presence of ontogenetically invariant characters was first assessed via principal coordinates analysis (PCoA) of the discrete character matrix built for the prior step, based upon the pairwise Euclidean distances between specimens. PCoA is a distance-based multivariate ordination method that can accommodate discrete characters. Clear separation of specimens along taxonomic lines prompted manual scrutinization of the character matrix, noting any characters for which juveniles and adults of each taxon were scored identically and differently—making them ideal ontogenetically invariant diagnostic characters present in both juveniles and adults (see “Results”).I also noted characters that varied within taxa but did not show a clear ontogenetic signal, which I interpret as polymorphic traits that vary independently of ontogeny. Discovery of stable maxillary tooth counts prompted a targeted round of data collection from osteological specimens in the AMNH Herpetology collection, increasing sample size of A. mississippiensis, A. sinensis, C. crocodilus, and Caiman yacare. Skull size was measured as the width of the skull across the posterior extent of the quadratojugals, which is closely correlated with skull length in Alligator (Dodson Reference Dodson1975a).
Results
Geometric Morphometrics
Analysis of the full 3D landmark dataset finds that the first principal component (PC 1), summarizing the majority (63.49%) of variation, is tightly correlated with centroid size, suggesting that this axis is dominated by allometric morphological changes associated with changes in skull size (Fig. 2A). Visual exploration of this morphospace confirms that this axis represents a trend toward rostral elongation, occipital and skull table flattening, and posterior growth of the quadrates and paroccipital processes that are well-documented in crocodylian ontogeny; accordingly, both Alligator species occupy the full range of PC 1. PC 2 describes ~13% of shape variation, and generally separates the two Alligator species when plotted against PC 1 (Fig. 2B). PC 2 primarily corresponds to the height of the posterior skull, and the separation of the two Alligator species along PC 2 indicates that Alligator sinensis consistently has a taller posterior skull than A. mississippiensis. PC 3 describes less than 5% of shape variation and shows wide variation within both species that is not correlated with ontogeny (Fig. 2C) or skull height (Fig. 2D). Caiman crocodilus plots external to Alligator along PC 3, but within Alligator on PC 1 and PC 2. Despite visually obvious separation of A. mississippiensis and A. sinensis along PC 2, agglomerative hierarchical clustering fails to recover clusters corresponding to the taxa included (Fig. 3). Instead, this test suggests that the optimal solution is that there are 14 clusters within the dataset. The resultant cluster dendrogram suggests that most of these clusters correspond to an ontogenetic stage of a single taxon, but the deeper branching structure of the dendrogram does not separate species from one another and instead groups their growth stages. The Caiman individual is positioned within a cluster of A. sinensis adults. Removing PC 1 from the clustering analysis to remove the obviously overriding ontogenetic signal results in a cluster dendrogram (Fig. 4) that does separate the two Alligator species, but instead positions C. crocodilus within A. mississippiensis, and more importantly suggests that a single cluster is the optimal scenario—thus providing no statistical support for the distinction of the two Alligator species.
Results of geometric morphometrics (GM) analysis, including A, correlation of centroid size with principal component (PC) 1; B, PC 1 vs. PC 2; C, PC 1 vs. PC 3; and D, PC 2 vs. PC 3.

Figure 2. Long description
The figure consists of four panels labeled A through D. A legend at the top right of panel A identifies three species: Caiman crocodilus in red, Alligator mississippiensis in green, and Alligator sinensis in blue.
* Panel A: A scatter plot with Centroid Size on the x axis and P C 1 (63.49 percent) on the y axis. The data shows a negative non-linear correlation where P C 1 values decrease as centroid size increases. Green points are concentrated at low centroid sizes with high P C 1, while blue points cluster at mid-range centroid sizes.
* Panel B: A scatter plot with P C 1 (63.49 percent) on the x axis and P C 2 (12.67 percent) on the y axis. Green points are widely distributed across the top and right, while blue points cluster in the bottom left quadrant. A single red point labeled 137179 is located near the center-left.
* Panel C: A scatter plot with P C 1 (63.49 percent) on the x axis and P C 3 (4.79 percent) on the y axis. Blue points are primarily located in the top left and bottom left, while green points form a dense cluster on the right side of the graph. The red point 137179 is at the bottom left.
* Panel D: A scatter plot with P C 2 (12.67 percent) on the x axis and P C 3 (4.79 percent) on the y axis. Green points cluster in the center and right, while blue points are scattered on the left. The red point 137179 is isolated at the bottom center.
Throughout all panels, specific data points are labeled with five-digit or six-digit identification numbers, and some points are connected by thin lines of the same color.
Results of agglomerative hierarchical clustering analysis on principal components analysis (PCA) scores derived from the geometric morphometrics (GM) analysis, showing A, the cluster dendrogram; and B, gap statistic k indicating the optimal number of clusters in the dataset.

Figure 3. Long description
Panel A is a Cluster Dendrogram. The y-axis is labeled Height and ranges from negative 0.6 to 0.6. The tree structure branches downward from a black root at height 0.6 into several colored clusters. From left to right, the terminal branches are grouped into colored boxes: salmon, orange, olive, green, teal, light blue, dark blue, purple, and pink. Labels at the bottom include species names like mississippiensis, sinensis, and crocodilus accompanied by numerical identifiers.
Panel B is a line graph titled Optimal number of clusters method equals gap_stat. The x-axis is labeled Number of clusters k and ranges from 1 to 15. The y-axis is labeled Gap statistic k and ranges from 0.3 to 0.8. The data points show a sharp increase from k equals 1 to k equals 3, followed by a steady, gradual linear increase. Each data point includes vertical error bars. A vertical dashed blue line is positioned at k equals 14, indicating the optimal cluster count where the gap statistic reaches approximately 0.8.
Results of agglomerative hierarchical clustering analysis on principal components analysis (PCA) scores derived from the geometric morphometrics (GM) analysis with PC 1 (highly correlated with size) omitted, showing an optimal cluster number of one.

Figure 4. Long description
The x-axis is labeled Number of clusters k and ranges from 1 to 15 in increments of 1. The y-axis is labeled Gap statistic k and ranges from 0.55 to 0.70. A blue line with circular data points and vertical error bars represents the gap statistic for each k value. At k equals 1, the gap statistic is approximately 0.55. A vertical dashed blue line intersects the x-axis at 1, indicating the optimal number of clusters. The value drops slightly at k equals 2 to approximately 0.53, then shows a steady, near-linear increase from k equals 3 through k equals 15, where it reaches a peak value of approximately 0.70. The title above the plot reads Optimal number of clusters open parenthesis method equals gap underscore stat close parenthesis.
Removing all juvenile individuals from the analysis most significantly affects the morphospace by nearly doubling the variation summarized by PC 2, presumably because many specimens at one extreme of PC 1 are omitted (see Supplementary Information II for results of sensitivity analyses). Agglomerative hierarchical clustering suggests a single cluster, interspersing individuals of both species throughout the dendrogram topology. When ontogenetic change is removed from consideration, the clustering analysis does recover a two-cluster scheme corresponding to the two Alligator species, with C. crocodilus placed within A. mississippiensis. Removing all A. sinensis juveniles while retaining A. mississippiensis juveniles does not significantly affect the results of the initial analysis. Removing all A. mississippiensis juveniles, while retaining A. sinensis juveniles, results in a nine-cluster optimal scheme, and with PC 1 omitted a two-cluster solution that separates the two Alligator species but places C. crocodilus within A. sinensis. Removing adults of A. mississippiensis results in a 13-cluster arrangement, or a 1-cluster arrangement with PC 1 omitted, in which A. sinensis includes C. crocodilus. Finally, removing adults of A. sinensis yields a 13-cluster scheme, or a 2-cluster scheme without PC 1, again placing C. crocodilus within A. sinensis.
Cladistic Analysis of Ontogeny
A survey for ontogenetically and phylogenetically variable characters within Alligator yielded 189 discrete morphological characters. Under no out-group selection does cladistic analysis of ontogeny recover a correct taxonomy. With an artificial embryo as the out-group OTU, the analysis recovered three most parsimonious trees (MPTs) of length 786 (Fig. 5A). All topologies, and thus the strict consensus, indicate an obvious “split” like that predicted by Zietlow (Reference Zietlow2020) to suggest the presence of two species or sexual dimorphs of a single species. However, one of these “clades” includes only A. mississippiensis juveniles, while the other includes individuals of A. sinensis, C. crocodilus, and A. mississippiensis in a highly asymmetrical topology, in which size is correlated with an increasingly crownward position. The tree topology, therefore, clearly shows a mixture of phylogenetic and ontogenetic signal, but does not accurately reflect the known taxonomy of the sample. Importantly, the Caiman and the three most mature A. mississippiensis resolve in a small clade (hereafter referred to as “Clade A”) which is placed such that they appear to be the most mature A. sinensis individuals. The clade containing an apparent growth series of A. sinensis thus conveys both misleading phylogenetic signal (viz., it contains three different species) and a misleading ontogenetic signal (viz., inclusion of Clade A suggests ontogenetic changes that do not actually occur in A. sinensis).
Results of cladistic analysis of ontogeny, using A, an artificial embryo out-group; B, the juvenile exemplar Alligator sinensis as out-group; C, the juvenile exemplar Alligator mississippiensis as out-group; and D, the Caiman crocodilus adult as out-group. Blue highlights denote Clade A.

Figure 5. Long description
The figure consists of four panels, A, B, C, and D, each displaying a cladogram with vertical branches leading to a horizontal list of taxa at the top.
* Panel A uses an Artificial Embryo as the out-group on the far left. The tree splits into two main clusters. The left cluster contains various A. mississippiensis specimens. The right cluster contains A. sinensis specimens and a single C. crocodilus 137179. A blue rectangular highlight covers a sub-clade of A. sinensis and A. mississippiensis on the far right.
* Panel B uses A. sinensis 175172 as the out-group. The topology shifts, placing a large cluster of A. sinensis on the left and A. mississippiensis on the right. The blue highlight is positioned over the terminal branches of the left-most A. sinensis cluster.
* Panel C uses A. mississippiensis 8011 as the out-group. The structure is similar to Panel A but with internal branch reordering. The blue highlight is again on the far right, covering a mix of A. sinensis and A. mississippiensis specimens.
* Panel D uses C. crocodilus 137179 as the out-group. This tree shows a distinct nested structure where A. sinensis specimens form a central cluster flanked by A. mississippiensis groups. The blue highlight is located on the far right branches.
Taxa labels are color-coded: A. mississippiensis in green, A. sinensis in blue-grey, and C. crocodilus in orange-red. Each label includes a species initialism followed by a specific specimen number.
When the analysis is polarized based on the juvenile exemplar of A. sinensis, it yields two MPTs of length 761 (Fig. 5B). These trees differ only in the position of a single individual (AMNH R 23899) of A. sinensis; results are otherwise comparable to those obtained with an artificial embryo out-group, notably yielding Clade A as the most mature OTUs at the terminus of an A. sinensis growth series. AMNH R 23899 is also the only specimen to occupy more than one position when the juvenile exemplar A. mississippiensis is chosen as out-group (Fig. 5C). This trial also yields two MPTs of length 761, but these form one highly asymmetrical topology that positions A. sinensis in the middle of an A. mississippiensis growth series. The only evidence of a “split” occurs near the tip of the tree, where individuals of A. sinensis occur on both sides of the split, with one side also including Clade A at its terminus. When the C. crocodilus individual is used as the out-group, Clade A obviously cannot form, but again two trees of length 761 form, and AMNH R 23899 is the labile OTU (Fig. 5D). The notable feature of this topology is that successively small specimens are recovered at more “derived” positions; this is unsurprising, because the out-group OTU is an adult, and therefore this analysis optimizes the mature state as plesiomorphic. Despite the out-group being the true evolutionary out-group to the two Alligator species, this analysis does not recover any “split” between them, instead placing them within one chimeric growth series. Finally, omitting the C. crocodilus specimen while using an artificial embryo as the out-group OTU results in a single ontogram (length = 747) in which the two Alligator species form independent “clades,” with the smallest specimens at the base of the clades, and successively larger specimens occupying more “derived” positions (Fig. 6).
Results of cladistic analysis of ontogeny, excluding Caiman crocodilus and using either an artificial embryo out-group (A) or the juvenile exemplar Alligator sinensis as out-group (B).

Figure 6. Long description
Two cladograms, labeled A and B, show branching phylogenetic trees.
Panel A is on the left. At the far left base is the out-group labeled Artificial Embryo in black text. To the right of this out-group, the tree splits into two main clusters. The first cluster on the left contains 12 terminal taxa labeled in blue text as A dot sinensis followed by various specimen numbers. The second cluster on the right contains 18 terminal taxa labeled in green text as A dot mississippiensis followed by various specimen numbers. The branching within the A dot mississippiensis group shows a nested hierarchical structure with several sub-clades.
Panel B is on the right. The structure is similar but the out-group is now A dot sinensis 175172, which is the leftmost blue label. The tree branches from this point into a large clade containing the remaining 11 blue-labeled A dot sinensis specimens and the 18 green-labeled A dot mississippiensis specimens. The internal topology of the green A dot mississippiensis clade remains largely consistent with Panel A, showing a series of bifurcating nodes leading to the terminal tips.
Ontogenetically Invariant Characters
The presence of ontogenetically invariant characters was established by applying PCoA to the discrete character matrix. The resultant morphospace (Fig. 7A) clearly separated the two species of Alligator, with C. crocodilus plotting as intermediate between them (Fig. 7A). Both taxa formed linear groups that appear to correspond to parallel ontogenetic trajectories, and axis 1 shows a logarithmic correlation with increasing centroid size, suggesting that axis 1 primarily describes an ontogenetic trajectory and that showing a deceleration of character change near the terminus of the sampled series for both species. Despite the visually obvious separation of the two species, hierarchical clustering analysis suggests that the dataset is optimally divided into four clusters (Fig. 8). The same specimens that formed Clade A in the previous analysis clustered here within adult A. sinensis, and removing axis 1 from the analysis again yields a single cluster (data not shown).
Results of principal coordinates analysis (PCoA) ordination of discrete character data, including A, principal coordinate axes 1 and 2; and B, relationship between principal coordinate axis 1 score and centroid size from geometric morphometrics (GM) analyses.

Figure 7. Long description
Panel A is a scatter plot of Principal Coordinate Axis 1 on the horizontal axis ranging from negative 4 to 8 and Principal Coordinate Axis 2 on the vertical axis ranging from negative 4 to 8. Three species are color-coded. Caiman crocodilus in red has a single point near the center. Alligator mississippiensis in green forms a cluster on the left with negative axis 1 values and a few outliers in the upper right quadrant. Alligator sinensis in blue forms a cluster in the lower right quadrant with positive axis 1 values and negative axis 2 values. Individual data points are labeled with five-digit or six-digit identification numbers.
Panel B is a scatter plot showing the relationship between Centroid Size on the horizontal axis ranging from 0 to 600 and Principal Coordinate Axis 1 on the vertical axis ranging from negative 4 to 8. Two logarithmic growth curves are plotted. A blue curve for Alligator sinensis rises steeply from the bottom left and levels off toward the top center. A green curve for Alligator mississippiensis rises more gradually from the bottom left toward the middle right. Data points for both species follow these curved trajectories, with Alligator sinensis generally having higher axis 1 scores for a given centroid size compared to Alligator mississippiensis.
Results of agglomerative hierarchical clustering analysis on principal coordinates analysis (PCoA) scores derived from the character matrix, showing A, the cluster dendrogram; and B, gap statistic K indicating the optimal number of clusters in the dataset.

Figure 8. Long description
Panel A is a cluster dendrogram titled Cluster Dendrogram. The vertical y-axis is labeled Height with a scale from negative 20 to 20. The tree structure branches downward into four distinct color-coded groups. From left to right, the first group is salmon pink containing eight labels including 23901 underscore sinensis and 139673 underscore sinensis. The second group is olive green containing four labels including 137179 underscore crocodilus and 12572 underscore mississippiensis. The third group is teal containing five labels including 175172 underscore sinensis and 162584 underscore sinensis. The fourth group is purple containing fifteen labels including 67134 underscore mississippiensis and 38216 underscore mississippiensis.
Panel B is a line graph titled Optimal number of clusters method equals gap underscore stat. The x-axis is labeled Number of clusters k with a scale from 1 to 15. The y-axis is labeled Gap statistic k with a scale from 0.10 to 0.30. A blue line with circular data points and vertical error bars shows a steep logarithmic increase from k equals 1 to k equals 4. A vertical dashed blue line intersects the x-axis at k equals 4, where the gap statistic is approximately 0.25. From k equals 4 to k equals 15, the line continues to rise at a much shallower, nearly linear slope, reaching approximately 0.28 at k equals 15.
A manual search for ontogenetically invariant characters that were unique to a species of Alligator revealed that the following characters were both taxonomically informative and present throughout the ontogeny of each species, from the youngest to the oldest specimens studied (Fig. 9):
-
1. Composition of the subnarial foramen (C11). In all A. sinensis, the subnarial foramen is formed between the premaxilla and the maxilla (C11.0), but in A. mississippiensis this foramen is formed between the premaxilla and the nasal (which projects a strong subnarial process that laps over the maxilla anteriorly to exclude it from the subnarial foramen; C11.1).
-
2. Communication of lateral and caviconchal pneumatic recesses (C33). In A. sinensis, the lateral pneumatic recess does not anastomose with the caviconchal recess within the maxilla (C33.0); this connection is present in A. mississippiensis (C33.1)
-
3. Position of internal foramen for the palatal vasculature (C37). The internal foramen for the palatal vasculature (which leads into a canal that exits on the palatal surface of the maxilla) is positioned in a vertical strut of bone ventral to the lateral recess in A. sinensis (C37.0), but within the lateral recess in A. mississippiensis (C37.1).
-
4. Presence of a descending process of the prefrontal (C58). The prefrontal lacks a descending process in A. mississippiensis (C58.1) but has one in A. sinensis (C58.0).
-
5. Position of lateral postorbital foramen (C84). The foramen opens anteriorly in A. sinensis (C84.0) but opens laterally in A. mississippiensis (C85.1).
-
6. Length of ventral process of ectopterygoid (C111). The ventral process of the ectopterygoid extends about two-thirds of the length of the pterygoid ala in A. mississippiensis (C111.1), but only extends half the length of the pterygoid ala in A. sinensis (C111.0).
-
7. Accessory foramen/notch dorsal to the foramen aereum of the quadrate (C130). This foramen is absent in all A. mississippiensis (C130.0) and present in A. sinensis (C130.1). The foramen is not always fully enclosed (and so may be present as a notch), but no indication of one is found in A. mississippiensis.
-
8. Ventral palatine foramen. A. mississippiensis lacks neurovascular foramina on the ventral surface of the palatine medial to the suborbital fenestra (C178.0), but two foramina are present here in A. sinensis (C178.1).
-
9. Shape of anterior ramus of vomer. The vomer has a smoothly convex dorsal margin of the anterior ramus in A. mississippiensis (C179.1), but is concave with a distinct “step” in A. sinensis (C179.0)
-
10. Presence of a vomerine recess. A pneumatic recess is present in the vomer of all A. mississippiensis (C180.1) and is absent in all A. sinensis (C180.0).
Ontogenetically invariant diagnostic characters and character states showing A, left lateral view; B, medial view; C, ventral (above) and dorsal (below) views; D, posterior (left) and anterior (right) views; E, posterior view of left maxilla; F, posterior view of left laterosphenoid; and G, posterior view of left vomer. For all panels except C, Alligator sinensis AMNH R 175172 is above and Alligator mississippiensis AMNH R 8011 is below; Alligator sinensis is to the left in C. Character numbers denote those described in the “Discussion” and listed in Supplementary Appendix I; states denote states observed in these specimens. Small text numbers denote maxillary tooth count. Scale bar, 10 mm.

Figure 9. Long description
A multi-panel anatomical diagram labeled A through G. Panels A, B, D, E, F, and G show Alligator sinensis on top and Alligator mississippiensis on bottom. Panel C shows Alligator sinensis on the left and Alligator mississippiensis on the right.
Panel A shows left lateral views of the skulls. Top skull labels include 57.0, 45.1, 84.0, and 111.0. Bottom skull labels include 57.1, 45.0, 84.1, and 111.1. Small numbers 1, 14, and 16 indicate tooth counts.
Panel B shows medial views. Top skull labels are 58.0, 179.0, and 11.0. Bottom skull labels are 58.1, 179.1, and 11.1.
Panel C shows ventral views on top and dorsal views on bottom. Left skull labels include 17.0, 13.1, 178.1, 169.0, and 168.0. Right skull labels include 17.1, 13.0, 178.0, 169.1, and 168.1.
Panel D shows posterior views on the left and anterior views on the right. Top skull labels are 154.1, 84.0, 130.1, and 112.1. Bottom skull labels are 154.0, 130.0, and 112.0.
Panel E shows posterior views of the left maxilla in green. Top labels are 32.0, 33.0, and 37.0. Bottom labels are 32.1, 33.1, and 37.1.
Panel F shows posterior views of the left laterosphenoid in tan. Top label is 144.0 and bottom label is 144.1.
Panel G shows posterior views of the left vomer in purple. Top label is 180.0 and bottom label is 180.1.
A white scale bar in the top right represents 10 mm.
Another 10 characters consistently differed between the two species over ontogeny, but showed some degree of polymorphism (e.g., one or both species had at least one individual with the state typical of the other).
-
11. Length of palatal process of premaxilla (C13). Alligator mississippiensis always has a short palatal process of the premaxilla (C13.0), while A. sinensis has a long palatal process (C13.1) in all but one individual. This individual is a very small juvenile, providing potential evidence that the length of the palatal process establishes after hatching, but given its absence in other juveniles of this taxon, I provisionally consider it polymorphic.
-
12. Length of incisive foramen of premaxilla (C17). Alligator mississippiensis generally has a long incisive foramen (C17.1), but two individuals resemble A. sinensis, which has a short incisive foramen (C17.0).
-
13. Number of maxillary teeth (C23). All individuals of A. sinensis have either 13 (C23.0) or 14 (C23.1) maxillary teeth, while A. mississippiensis generally has 15 (C23.2) or 16 (23.3) teeth. A single individual of the latter taxon has 14 (C23.1) teeth on one side, and 15 (C23.2) on the other.
-
14. Size of lateral fenestra of maxilla (C32). In all A. sinensis, the lateral fenestra is small (C32.0), while in all but two A. mississippiensis, the lateral fenestra is large (C32.1).
-
15. Position of the ostium of the nasolacrimal canal (C45). In all A. sinensis, the ostium of the nasolacrimal canal is distinctly posterior (C45.1 or 45.2) to the posterior level of the orbital rim of the lacrimal; the ostium is anterior to this level in all but one A. mississippiensis (C45.0).
-
16. Presence of a subcristal process of the prefrontal (C57). The subcristal process is absent (C57.0) in A. sinensis and present in all but three A. mississippiensis (C57.1).
-
17. Presence of an accessory medial process of the ectopterygoid (C112). This process is absent in most A. mississippiensis (C112.0) but present in all A. sinensis (C112.1).
-
18. Composition of foramen for supraorbital branch of trigeminal nerve (C144). This foramen is formed entirely by the laterosphenoid (C144.1) in A. mississippiensis (variable left-to-right on a single specimen, but otherwise invariant) but is formed between the laterosphenoid and quadrate in A. sinensis (C144.0).
-
19. Presence of a vertical ridge on the supraoccipital (C154). All A. mississippiensis lack a ridge on the supraoccipital (C154.0), and all but one A. sinensis exhibit one (C154.1).
-
20. Size of lateral choanal ridges of pterygoid (C168). The lateral choanal ridges are large in most A. sinensis (C168.0) but small in most A. mississippiensis (C168.1) such that they do not produce a fossa posterior to them.
-
21. Presence of neurovascular foramina lateral to the choana (C169). These foramina are absent from the pterygoid of A. sinensis (C169.0) and present in all but one A. mississippiensis (C169.1).
In sum, 21 discrete characters showed no evidence of ontogenetic variation, and either absent or limited polymorphism within each species. These characters, therefore, do not fit widely accepted conceptual models in which diagnostic apomorphies are acquired throughout postnatal ontogeny, and if included in a phylogenetic analysis would be robust to stemward slippage. However, still other characters did show evidence of ontogenetic variability, but culminated in divergent adult morphologies that make them useful for identifying only more mature individuals (Fig. 10):
-
22. Palatal diverticulum of caviconchal recess (C34). This diverticulum is always absent (C34.0) in A. sinensis and is absent in young A. mississippiensis but present (C34.1) in mature A. mississippiensis.
-
23. Prefrontal recess (C53). This diverticulum is always absent (C53.0) in A. sinensis and is absent in the youngest A. mississippiensis but present (C53.1) in most A. mississippiensis.
-
24. Palatine bulla (C177). The palatine bulla is absent in A. mississippiensis (C177.0) and young A. sinensis but manifests in more mature A. sinensis as an inflated region of the palatines (C177.1).
Ontogenetically variable diagnostic characters of Alligator species, showing A, left maxilla in oblique posterodorsal view; B, left prefrontal in oblique ventrolateral view; and C, palatine in left lateral view. In all panels, Alligator mississippiensis is on top and Alligator sinensis is below. Bones are scaled to the same size for clarity.

Figure 10. Long description
A three-panel anatomical diagram labeled A, B, and C.
Panel A, top left, shows the left maxilla in green. The top specimen, Alligator mississippiensis, has a pointer labeled 34.1 indicating a deep recess. The bottom specimen, Alligator sinensis, has a pointer labeled 34.0 indicating a shallower, more enclosed recess.
Panel B, top right, shows the left prefrontal in light blue. The top specimen, Alligator mississippiensis, has a pointer labeled 53.1 at the posterior edge. The bottom specimen, Alligator sinensis, has a pointer labeled 53.0 at the corresponding posterior edge.
Panel C, bottom, shows the palatine in yellow. The top specimen, Alligator mississippiensis, has a pointer labeled 177.0 on a smooth dorsal ridge. The bottom specimen, Alligator sinensis, has a pointer labeled 177.1 on a more rounded and textured dorsal surface.
Maxillary tooth count in select extant alligatoroids, illustrating typical variation of ±1 maxillary tooth positions. Tooth counts are averaged from left to right sides, sometimes yielding fractional counts in individuals displaying asymmetrical variation.

Figure 11. Long description
The four panels share a vertical Y-axis labeled Mean Number of Maxillary Teeth ranging from 13 to 16 and a horizontal X-axis labeled Skull width in m m ranging from 0 to 300.
Top-left panel, Alligator mississippiensis (green dots). Data points are densely clustered around a mean of 15 teeth across the entire skull width range from approximately 25 to 330 m m. Outliers exist at 14, 14.5, 15.5, and 16 teeth.
Top-right panel, Alligator sinensis (teal dots). Data is concentrated at smaller skull widths between 25 and 120 m m. Tooth counts start at 14 for the smallest individuals and drop to a consistent 13 teeth as skull width increases beyond 50 m m.
Bottom-left panel, Caiman crocodilus (red dots). Data points are scattered between skull widths of 25 and 175 m m. The tooth counts fluctuate primarily between 14 and 15 teeth with no clear linear trend.
Bottom-right panel, Caiman yacare (purple dots). Data points span skull widths from 50 to 210 m m. Most individuals cluster at 14 teeth, with a few smaller individuals at 15 teeth and a small group of larger individuals at 14.5 teeth.
Discussion
Geometric Morphometrics
The results of my GM analyses do not support the use of the method for quantitative tests of taxonomic hypotheses. When the identities of the specimen are known a priori, it is trivial to visualize the two ontogenetic trajectories in PC space (Fig. 2) and to recognize that the taxa share occupy fully nonoverlapping shape spaces. However, agglomerative hierarchical clustering (a method that does not consider a priori classifications, only the data) fails to recover these morphospaces as “clusters” (Fig. 3), indicating that the species morphospaces are not statistically emergent (i.e., the data do not form discoverable clusters). With PC 1 included, the ontogenetic signal overwhelms any phylogenetic signal; while it is unlikely that the clusters would be interpreted as pertaining to many distinct taxa, due to their obvious differences in size and maturity, it would be impossible to quantitatively determine which individuals belonged to which taxon, and how many taxa were present. Excluding PC 1 from the clustering analysis (Fig. 4) effectively factors ontogeny out, but typically overcorrects to a single cluster solution, because the two Alligator species are, overall, quite similar—they are separated along PC 2, but there is more variation within each taxon along that axis than there is range separating them. The only instances in which the clustering algorithm came close to finding the correct taxonomy were those in which either the adult Alligator sinensis or the juvenile Alligator mississippiensis were excluded from the analyses. This is unsurprising, because these are the groups that come closest to each other along PC 2, which is the only axis that separates the two taxa. Elimination of one group thus inflates the apparent difference between the morphospaces occupied by each Alligator species. In sum, GM fails to empirically recover the known taxonomy of the trial dataset.
Furthermore, in all iterations of the GM analysis, the Caiman crocodilus individual clustered within a species of Alligator. The Alligator ontogenetic series dominate the variation in the sample and thus also dominate the signal inherent in the PC space. In a dataset like this, the singleton taxon would need to be radically different from all other specimens to fall clearly outside the morphospaces of the other taxa—but in this case, it seems unlikely that workers would mistakenly include it in the ontogenetic series in the first place. Despite the numerous character differences between Alligator and Caiman, nothing in the morphospace plots would suggest that the Caiman individual was not an alligator. Even large samples of both Alligator species were not statistically emergent, and this problem is only compounded when acknowledging the possibility that some specimens may pertain to an unexpected third taxon. We should expect that extinct ecosystems hosted multiple closely related species, just as modern ecosystems do today even at high trophic levels, and therefore this phenomenon is troubling. It is difficult to envision how a GM analysis of a fossil dataset could adequately account for the possibility that unsuspected new taxa are included, especially if only one or a paucity of the individuals sampled pertain to that new taxon. Given that the two Alligator species do clearly separate in PC space, it may appear that visual examination of morphospace plots is the most effective way to interpret the results of GM analyses. However, this practice is not repeatable or empirical and does little more than add a quantitative veneer to a fundamentally qualitative taxonomic assessment. The data must speak for themselves if we seek to draw species boundaries based on multivariate statistics alone.
The failure of the data to do so in the present analysis is concerning. While the two Alligator species are overall quite similar, they are morphologically distinguishable and have never been suggested to be synonymous. The failure of morphometric methods to recover obviously distinct groups in morphospace suggests that GM cannot effectively discriminate between anatomically similar species, especially when faced with ontogenetic and polymorphic variation within both. It is worth noting that GM analyses of closely related extant species often recover significant morphospace overlap between closely related species, and were their identities not known a priori, it is unclear how close an agnostic analysis would come to the accepted taxonomy (e.g., Ruane Reference Ruane2015; Ferreira-Cardoso et al. Reference Ferreira-Cardoso, Billet, Gaubert, Delsuc and Hautier2020; Baird et al. Reference Baird, Ernst, Waurick, Blom and Bibi2023; Viacava et al. Reference Viacava, Blomberg and Weisbecker2023). GM may be seen, then, as highly susceptible to type II error (false negatives, or failures to recognize species that are present in a dataset). Furthermore, sampling biases also introduce significant potential for type I error (false positives, or erroneous recognition of new taxa). No morphospace is free of gaps—individuals within populations vary independent of growth stage, sometimes significantly. If intermediate individuals are unknown, it is very possible that individuals from two extremes of a taxon’s morphospace would be mistaken for members of separate species, with the presence of a morphological gap between them taken as evidence in favor of separation. For example, two recent studies have suggested that one specimen of Velociraptor mongoliensis (Mongolian Academy of Sciences [MPC-D] 100/982) pertains to a new species due to an apparent gap in morphospace between it and other Velociraptor specimens (Powers et al. Reference Powers, Sullivan and Currie2020, Reference Powers, Fabbri, Doschak, Bhullar, Evans, Norell and Currie2022). While this is certainly plausible, with only four specimens included in the analysis, it remains possible that we are simply missing morphologically intermediate V. mongoliensis individuals and that this “gap” is a sampling artifact attributable solely to the low sample size. GM may, however, serve as an effective “first pass” to identify morphologically divergent specimens that may represent distinct species and to aid identification of diagnostic characters between species delimited under other criteria. Campione and Evans (Reference Campione and Evans2011) identified diagnostic characters for the two accepted species of Edmontosaurus in light of their morphometric analyses, and in the present study, GM revealed that A. sinensis is characterized by a dorsoventrally taller skull than A. mississippiensis throughout ontogeny. However, for the reasons noted, I do not consider morphometric analyses alone to be methodologically or epistemologically sufficient for testing taxonomic hypotheses.
Cladistic Analysis of Ontogeny
Four of my attempts at cladistic analysis of ontogeny fail to yield consensus topologies that indicate the correct phylogenetic and ontogenetic status of the specimens in my dataset (Fig. 5). None of these analyses corroborated the prediction by Zietlow (Reference Zietlow2020) that cladistic analysis of ontogeny would recover a clean divergence between the sampled species. While two out-group protocols did recover strict consensus trees with basal divergences, these divergences did not sort OTUs along clearly phylogenetic or ontogenetic lines. Instead, one clade comprised only juvenile A. mississippiensis, and the other an apparent growth series of A. sinensis, with C. crocodilus and adult A. mississippiensis placed as its most mature members (forming Clade A). Thus, these topologies have the dubious distinction of conveying both misleading phylogenetic signal and misleading ontogenetic signal. In a paleontological study where species identity is unknown (or the question of focus), it would be impossible to determine how many species are represented within the ontogram based on its topology alone. Two other protocols recover a highly asymmetrical strict consensus topology without a basal divergence, and in each, A. sinensis is placed within the A. mississippiensis growth series. Zietlow (Reference Zietlow2020) suggested that such a topology could also be consistent with multiple species, if terminal branches showed “homologous sets of intraspecific variation.” This tree would, presumably, represent one in which the ontogenetic signal is dominant (perhaps due to similar ontogenetic sequences in both taxa), forcing traits specific to one species to optimize as convergences at different points along the ontogenetic trajectory. However, this pattern does not manifest in the present analysis. Rather, putative ontogenetic characters (which are, actually, the phylogenetic characters that distinguish the two species) optimize with two state changes—one from the condition in A. mississippiensis to that in A. sinensis, followed by a reversal to the plesiomorphic state in adults of the former species. This is important to note, because apparent reversals of large suites of ontogenetic characters have been found in prior studies employing cladistic ontogeny—most notably, Carr (Reference Carr2020) reported many reversals to putatively juvenile states among adult Tyrannosaurus rex. My results suggest that these patterns warrant scrutiny. In summary, cladistic analysis of ontogeny did not recover a correct taxonomy, nor did it accurately describe the sequence of character changes that occur during ontogeny in either taxon in four of five analytical trials. One analytical protocol does, however, yield a result that conforms to expectations articulated by Zietlow (Reference Zietlow2020). When C. crocodilus is excluded from the analysis, and the analysis is rooted on the artificial embryo OTU, the single resultant ontogram topology does feature a basal bifurcation into two clades (Fig. 6A), each corresponding to a single species, and in which more “derived” positions are occupied by larger and presumably more mature specimens. While this may seem to validate use of cladistic analysis of ontogeny for paleontological datasets, I consider it to be essentially a “fluke” arising from ideal conditions. My artificial embryo OTU is a mosaic of scores derived from the juvenile exemplars of A. mississippiensis and A. sinensis; while most scores were identical to the A. sinensis exemplar (the smallest specimen), characters describing the presence or absence of features seen in A. sinensis but not A. mississippiensis were scored “absent” in the artificial embryo. This polarized the analysis such that autapomorphies of both taxa were treated as absent at the base of the tree, allowing the analysis to recover reciprocally monophyletic species “clades.” Basing the artificial embryo out-group solely on the exemplar juvenile of A. sinensis (mimicking the typical approach, in which the smallest specimen to preserve each character is used to score the artificial embryo), this result does not obtain (Fig. 6B). Indeed, with C. crocodilus excluded and the analysis rooted on that specimen, A. sinensis is not monophyletic, and the ontogenetic signal is partially obscured. The situation would only be worse in a case in which adults were overrepresented relative to juveniles, which is common in paleontological studies; if only adult A. mississippiensis were available for study, a researcher would have no reason to base scores for an artificial embryo on character states unique to these large specimens (and would, presumably, infer that those features are lost during ontogeny). Furthermore, this analytical iteration is predicated upon exclusion of an “interloper” specimen (C. crocodilus) from the dataset—in other words, it is based to some degree on a priori knowledge that is impossible to obtain for paleontological analyses. In sum, this iteration shows only that in an ideal case, cladistic ontogeny can work as predicted, but given the challenges posed by inclusion of a single specimen belonging to an unrecognized additional species and the practical reality that full ontogenetic series of all included species may not be represented by the fossil record, this is faint praise.
Beyond my own empirical tests, however, it is worth exploring cladistic ontogeny at a deeper level due to its apparent success when applied to fossil datasets. It is possible that my trial dataset differs in some fundamental way from those assembled for fossil datasets. As in exemplar uses of cladistic ontogeny such as those of Carr (Reference Carr2020) and Zietlow (Reference Zietlow2020), I compared specimens over a range of body sizes and presumed ontogenetic stages and strove to codify every morphological character difference that was anatomically unambiguous and repeatably scoreable. My analytical protocol, however, does differ from these previous approaches in three key respects. First, my dataset has a relative paucity of missing data compared with paleontological datasets, but having more data should, if anything, improve my analyses rather than hinder them. Second, Zietlow (Reference Zietlow2020) did not treat multistate characters as ordered. This is clearly problematic when considering ontogenetic characters, which we may expect to change gradually and unidirectionally—for example, several characters in Zietlow’s (Reference Zietlow2020) dataset described the absolute size of certain elements, and treating these characters as unordered did not penalize ontogram topologies that infer growth stages where bones grow quite suddenly without passing through intermediate character states or topologies in which a bone may actually shrink before growing again. Carr (Reference Carr2020) did, however, use ordered characters in his analysis, so my use of ordered characters is not at odds with all prior implementations of this method. More problematically, Carr (Reference Carr2020) reported an analytical protocol in which taxa were iteratively added to the ontogram search to determine which specimens induced the recovery of multiple MPTs; these specimens were considered wildcards and were removed from the analysis a priori. Treatment of wildcard specimens in phylogenetic analyses is a topic worthy of discussion in its own right; some OTUs may be so incomplete that they result in a net loss of information from the tree search, but this is an extreme case, and I concur with perspectives generally favoring inclusion of labile OTUs in the tree search, but removing them a posteriori to report reduced strict consensus tree topologies (Wilkinson Reference Wilkinson1995; Kearney and Clark Reference Kearney and Clark2003; Goloboff and Szumik Reference Goloboff and Szumik2015). In any case, identifying any OTU with multiple most parsimonious positions as a “wildcard” seems like an exaggeration, and the result is an analysis that purposefully eliminates alternative most parsimonious topologies and does not correctly communicate what ambiguity may exist within the dataset. My use of conventional tree search approaches and consensus trees, therefore, may not precisely mirror Carr (Reference Carr2020), but may be seen as indicating the kinds of alternative topologies that his analytical protocol eliminates from consideration.
A further consideration is the possibility that A. mississippiensis and A. sinensis are more dissimilar from one another than any undetected fossil species would be, and thus that Alligator is an unsuitable model system for assessing the efficacy of cladistic ontogeny. It is true that the two taxa differ in many characters, including many that are ontogenetically invariant and others that appear during growth. However, the presence of a “split” manifesting in an ontogram containing multiple taxa, as predicted by Zietlow (Reference Zietlow2020), would logically be more likely to occur in situations where the two taxa are differentiated by a large number of characters. The two species of Alligator diverged in the Eocene and have had about 50 million years of independent evolution to acquire autapomorphies (Wu et al. Reference Wu, Wang, Zhou, Zhu, Nie and Wang2003). If cladistic ontogeny cannot reliably detect the difference between two species that diverged shortly after the extinction of the non-avian dinosaurs, it is difficult to envision how it could possibly be a reliable means of delimiting shallowly diverged, possibly sympatric species that are known only from an incomplete fossil record.
Beyond my empirical failure to validate the method, there are several epistemological considerations that make cladistic analysis of ontogeny an unsuitable method for testing taxonomic hypotheses. The use of an “artificial embryo” as the out-group OTU is fraught with difficulty. The artificial embryo OTU is, in practice, a collation of the hypothesized immature states for each character, based upon the least mature specimens for which each character is preserved. This runs the obvious risk of inferring an “embryonic” condition that is actually informed by individuals that have already progressed significantly far along their ontogenetic trajectory. The most extreme case was a recent cladistic ontogeny analysis of growth among alioramin tyrannosaurids, in which the approximately 9-year-old holotype specimen of Alioramus altai was used as the sole source of “immature” characters and was scored identically to the artificial embryo (Foster et al. Reference Foster, Brusatte, Carr, Williamson, Yi and Lü2022). Determination of which specimens are “least mature” is typically made based on size, rather than osteohistological data—and indeed, several analyses include absolute size among their ontogenetic characters (Ezcurra and Butler Reference Ezcurra and Butler2015; Carr et al. Reference Carr, Varricchio, Sedlmayr, Roberts and Moore2017; Carr Reference Carr2020; Zietlow Reference Zietlow2020). This process results in the out-group OTU representing the character states observed in the smallest specimens to display each character, meaning that it is a composite that may not represent the true combination of characters at any stage of development, and thus forcing the analysis to interpret these states as “immature” and enforcing the ontogenetic trajectory that had previously been inferred based on size alone. Therefore, despite claims that cladistic ontogeny is advantageous in offering a size-independent means of maturity estimation (Brochu Reference Brochu1996; Carr Reference Carr2020; Zietlow Reference Zietlow2020), these analyses are not size independent in practice. It is perhaps unsurprising, then, that published analyses employing cladistic ontogeny typically find a robust correlation between size and maturity. If the ontogenetic character matrix includes multiple species, the artificial embryo will represent a combination of ontogenetic and phylogenetic information, making it very difficult to interpret the resultant ontogram topology. Any node may be supported by a mixture of ontogenetic and phylogenetic characters, making it difficult to determine which “clades” represent growth stages, which represent species, and which represent some combination of both (e.g., a valid species and immature members of a larger sister taxon). A similar problem has emerged in invertebrate paleontology through the use of “semaphoront coding” (Lamsdell and Selden Reference Lamsdell and Selden2013), which scores immature and adult members of species as separate OTUs, and thereby generates “phylogenetic trees” that do not actually contain a purely phylogenetic signal (Sharma et al. Reference Sharma, Clouse and Wheeler2017). Both semaphoront coding and cladistic ontogeny, then, produce “tree-shaped objects” (Wheeler and Pickett Reference Wheeler and Pickett2007) from mixed data sources that cannot be readily interpreted. Even if it were simple to distinguish between these data sources on an ontogram topology, published expectations for how different scenarios should manifest in an ontogram lack explicit criteria and include topologies both with and without deep divergences (Zietlow Reference Zietlow2020), essentially meaning that almost any conceivable topology could be interpreted in different ways by different workers. Most fundamentally, progressive ontogenetic change occurs within individual organisms and, as such, does not meet the assumption of hierarchical organization that is inherent to Hennig’s model of phylogenetic systematics (Sharma et al. Reference Sharma, Clouse and Wheeler2017), despite claims to the contrary (Brochu Reference Brochu1996; Zietlow Reference Zietlow2020). “Adult” is not a subgroup of “juvenile” in the way that species are subgroups of larger clades. Thus, it may be debated whether cladistic ontogeny is even philosophically appropriate for establishing ontogenetic sequences or staging criteria when the taxonomy is known a priori. In summary, a host of philosophical and practical challenges make cladistic ontogeny unsuitable for testing taxonomic hypotheses in the fossil record, and I suggest that the results of prior studies using the method be interpreted with healthy skepticism until they can be confirmed through other, more robust analytical protocols.
Ontogenetically Invariant Characters
Multivariate ordination of my discrete character matrix recovers two obvious linear clusters (Fig. 7A), which correspond to the two species of Alligator. Axis 1 correlates closely with centroid size (Fig. 7B) and can be interpreted as the primary ontogenetic trajectory; the two species have approximately parallel trajectories, suggesting broadly similar ontogenetic trends (as we may expect among closely related taxa). Axis 2, then, can be interpreted as the primary phylogenetic axis. Notably, the spectacled caiman individual plots between the two species of Alligator, and is approximately equally spaced from both along axis 2 and in the region of similarly sized Alligator individuals of both species along axis 1. Despite the visually obvious separation of these ontogenetic trajectories, hierarchical clustering analysis does not elucidate a correct taxonomy (Fig. 8); instead, the dendrogram clearly shows a primarily ontogenetic signal in which juveniles diverge from adults, after which each growth stage separates along taxonomic lines (excepting C. crocodilus, which clusters with A. mississippiensis). Removing PCoA axis 1 from the clustering analysis results in a single cluster scenario, so removing the influence of ontogenetic variation does not clarify the taxonomic composition of the sample.
In sum, 23 of 189 characters (~13%) were highly phylogenetically significant, and of these, 20 showed no signs of ontogenetic variation. Thus, we can affirm that closely related living species can and do possess ontogenetically invariant characters that allow confident determination of their identities from apomorphic evidence alone. Therefore, the repeated failure of existing multivariate methods might be of less concern than it would outwardly appear. While ontogenetic variation is predominant in my dataset, and some diagnostic characters do occur in adults only, it is also clear that individuals are born with characters that do not change during ontogeny. Importantly, these characters need not simply be general characters shared by every species in their clade, but can instead be highly diagnostic traits that distinguish close relatives and obviate the need for multivariate statistical approaches. Even very young Alligator displays a suite of ontogenetically invariant characters that show no evidence of polymorphism, and while the two species do become increasingly distinct during growth, this is encouraging evidence that fossils of young animals may similarly already possess important diagnostic characters. The question now becomes whether or not it is possible to predict which characters are ontogenetically invariant in extinct taxa—and therefore, which characters are “good” characters for testing taxonomic hypotheses.
Reviewing the this list of characters, it should be immediately evident that ontogenetically invariant characters are overwhelmingly associated with neurovascular foramina, pneumatic recesses, and the sutural topology of the skull. Characters associated with muscle scars, the shapes of bone margins, ornamental features, and overall proportions show far less tendency to be ontogenetically invariant and are in fact among the most ontogenetically variable character types in my dataset. The asymmetric distribution of ontogenetically invariant characters suggests that their invariance is not some evolutionary quirk unique to Alligator or a similarly exclusive clade; rather, I propose that these characters are invariant due to broadly conserved aspects of the vertebrate developmental program and are thus generally applicable to a range of study systems.
Despite the common lay perspective that bones are the “scaffold” or “foundation” for the soft tissues of the body, bones appear fairly late in development, and their patterning and ultimate morphology are shaped by the soft tissues that precede them. Of the most informative character types identified, two (cranial foramina and pneumatic recesses) relate to soft tissue systems that are laid down before the onset of cranial skeletogenesis. In human embryology, cranial nerve development occurs quite early—most cranial nerves appear between developmental days 26–38 (Carnegie Stages 12–15), and by day 53 (end of Carnegie Stage 20), all nerves are both present and have reached their target organs (Smit et al. Reference Smit, Jacobs, Bais, Meijer, Seinen, de Bree and Veldhuis2022). The cranial arteries also appear early in development (Takahashi et al. Reference Takahashi, Tanaka, Fujita and Tomiyama2012) and assume an adult branching pattern by approximately ~52 days of development (Paget Reference Paget1948). The onset of cranial bone development is far later—for example, in humans the sphenoid complex begins to form at 16 weeks (~112 days) of development (Mano et al. Reference Mano, Wood, Oladipupo, Reynolds, Taylor, Durham, Cray, Vinyard, DeLeon and Smith2021). Cranial foramina form not as a result of developing blood vessels and nerves “tunneling” through the bone to reach their targets, but because the developing bones envelop the preexisting neurovasculature as they condense from mesenchyme. Indeed, in black caiman (Melanosuchus niger) embryos, foramina for the hypoglossal nerve appear in the basal plate just as it begins to chondrify and long before ossification (Vieira et al. Reference Vieira, Santos, Hirano, Menezes-Reis, Mendonça and Sebben2019). The neurovascular structures are not passive participants in this process—in chicken (Gallus) embryos, chondrogenesis of the occipital bones is interrupted in the immediate vicinity of primordial jugular, carotid, and hypoglossal foramina, which presumably protects the contents of these foramina from being stenosed or severed by encroachment of the surrounding bone (Akbareian et al. Reference Akbareian, Pitsillides, Macharia and McGonnell2015). It has been suggested that the nerves and blood vessels themselves actually initiate the slowdown in chondrogenesis that leads to the development of a foramen to transmit them (Akbareian et al. Reference Akbareian, Pitsillides, Macharia and McGonnell2015). Cranial nerve foramina form during embryonic development in response to the position of nerves and blood vessels that are laid down very early in development, long before mesenchymal condensation and the later onset of chondro- or osteogenesis. Furthermore, dermal bone osteogenesis follows expansion of capillary networks within mesenchymal condensations, suggesting that these capillaries are a source of signals that promote ossification and that alterations to the vascular pattern can induce changes in skeletal morphology (Percival and Richtsmeier Reference Percival and Richtsmeier2013).
Pneumatic recesses in cranial bones are enigmatic structures of unclear function that show a high degree of variation. The epithelial sinuses housed in these recesses have a documented tendency to expand progressively during life, which has been noted in systems as diverse as Alligator (Witmer Reference Witmer1995; Dufeau and Witmer Reference Dufeau and Witmer2015) and humans (Scuderi et al. Reference Scuderi, Harnsberger and Boyer1993). The growth of cranial sinuses (and therefore the recesses they leave in the cranial skeleton) is often described as “opportunistic,” given the apparent tendency of these sinuses to expand as far as they can. Witmer (Reference Witmer1997) proposed the “epithelial hypothesis” of sinus growth, positing that sinus growth is driven by an intrinsic capacity of the epithelia to invade and excavate bone and is constrained only by the biomechanical integrity of the skull. This hypothesis explains much of the variability that is obvious in cranial sinuses, such as asymmetry and development of pathologic fistulae. Given the abundant observations of how ontogenetically and individually variable sinuses are, I and many of my colleagues have historically shied away from their use as taxonomic characters. And yet, my data for Alligator suggest that the basic pattern of pneumatic invasion of the cranial skeleton is highly diagnostic. While it is true that both Alligator species show progressive expansion of the cranial sinuses, the simple presence or absence of a pneumatic recess was consistent, as were large-scale patterns of pneumatization (such as confluence of the lateral and caviconchal recesses of the maxilla). Perhaps unsurprisingly, the precursors of cranial sinuses also appear early in development as nascent outpocketings of the respiratory cavity that are later enclosed by bone during condensation (Scuderi et al. Reference Scuderi, Harnsberger and Boyer1993; Witmer Reference Witmer1995). Unlike cranial nerves and blood vessels, not all cranial sinuses are present in embryo, but those that are not do appear quite early in postnatal ontogeny. In A. mississippiensis, all sinuses are present within a few months of hatching (Witmer Reference Witmer1995), and humans pneumatize the frontal sinus (the last sinus to form) by the second year of life (Scuderi et al. Reference Scuderi, Harnsberger and Boyer1993). It is possible that epithelial outpocketings are present as sinus precursors in embryo—if so, postnatal appearance of these sinuses may relate simply to the fact that a sinus cannot pneumatize before an animal takes its first breath and allows air to fill the space, or that pneumatization can be inhibited for some period of time due to other anatomical factors. In support of this hypothesis, the human frontal sinus appears to develop as an outgrowth of the anterior ethmoidal sinus (which is present at birth) and invades the frontal only after the red marrow that initially inhabits its space transitions to yellow marrow (Scuderi et al. Reference Scuderi, Harnsberger and Boyer1993). The consistency of which bones are pneumatized within species suggests that the “epithelial hypothesis,” as currently understood, is missing a component of higher-order governance that determines how many pneumatic diverticulae form, which bones they invade, and what terminal morphology they achieve. The similarity in cranial anatomy between the two Alligator species precludes explanation of their divergent pneumatization patterns (e.g., vomerine recess in A. mississippiensis, palatine bulla in A. sinensis) as solely reflecting differences in mechanical constraints on their skulls. While the intertympanic sinus system of crocodylians is not diagnostic in hatchlings, it has been demonstrated that the adult morphology of the intertympanic sinuses is diagnostic at low taxonomic levels (Perrichon et al. Reference Perrichon, Hautier, Pochat-Cottilloux, Raselli, Salaviale, Dailh and Rinder2023), despite overall similarity in cranial shape, which appears to corroborate this interpretation. In humans too, despite a high degree of variation in sinus size and extent, the basic pattern of pneumatization is highly constrained—humans develop sinuses in the maxilla, ethmoid, sphenoid, and frontal, and absence of any sinus is both rare and typically correlated with pathological development of the craniofacial skeleton (Jafari-Pozve et al. Reference Jafari-Pozve, Sheikhi, Ataie-Khorasgani and Jafari-Pozve2014; Grine et al. Reference Grine, Post, Greening, Crevecoeur, Billings, Meyer and Holt2024). The human palatines and vomers, despite being in direct apposition with the respiratory tract, do not pneumatize—and the presence of a pneumatic recess in the extremely thin vomer of Alligator suggests that this is not simply a consequence of their delicate construction. Further research is required to resolve the dichotomy between sinus distribution, which appears tightly regulated, and sinus expansion, which does appear to be fundamentally opportunistic and occasionally leads to pathology.
One further relevant point is that there is no evidence of any cranial sinus being lost during ontogeny by overgrowth of bone that obliterates its ostium. Nanotyrannus individuals have a pneumatic recess in the quadratojugal that is absent in T. rex (Witmer and Ridgely Reference Witmer and Ridgely2010; Carr Reference Carr2020). An apparent ontogenetic acquisition of this sinus was reported in Daspletosaurus horneri and interpreted as evidence that this feature is ontogenetically variable in tyrannosaurs (Carr et al. Reference Carr, Varricchio, Sedlmayr, Roberts and Moore2017), despite this being directly opposite to the pattern required for Nanotyrannus to grow into T. rex. More recently, it has been proposed that this feature is polymorphic in D. horneri (Coppock et al. Reference Coppock, Powers, Voris and Currie2025), and no evidence for ontogenetic acquisition or loss of this feature exists, but ontogenetic loss of a pneumatic recess is unknown in other species; another large theropod, Allosaurus, appears to have had a the same complement of pneumatic sinuses throughout posthatching ontogeny (Rauhut and Fechner Reference Rauhut and Fechner2005). Larson (Reference Larson, Parrish, Molnar, Currie and Koppelhus2013) similarly reported a “one-to-one” correspondence between pneumatic diverticulae in juvenile and adult Struthio camelus. Dufeau and Witmer (Reference Dufeau and Witmer2015) suggest that the laterosphenoid recess is lost during crocodylian ontogeny, but the pneumatic space within the bone persists in all specimens studied herein; only the ostium of this recess is lost, turning the laterosphenoid recess into a blind cavity. This recess is unique in that it enters the laterosphenoid via the laterosphenoid-prootic sutural surface, rather than an external ostium, and closure of this ostium is likely attributable to increased sutural interdigitation. “Typical” pneumatic recesses with external ostia are not documented to close during ontogeny, and even when the ostium is lost, the pneumatic cavity itself persists as proof that the bone is pneumatic. In sum, we can conclude that the topological distribution of pneumatic recesses is highly species specific and expect that only very young members of a species may lack pneumatic recesses present in the adults. The size and morphology of these recesses may readily change during growth, but growth appears to be unidirectional—we should not expect ontogenetic transformations in which pneumatic recesses shrink or close, as was required to justify Nanotyrannus specimens representing immature Tyrannosaurus specimens.
My data on Alligator also suggest that sutural topology of the cranial skeleton is ontogenetically invariant and shows little polymorphism. By this, I mean not the form of the joint surfaces between bones (which show an obvious ontogenetic trend toward interdigitation), but how the bones contact—which bones form joints with which others, the discrete processes, rami, or laminae of each bone, and how the bones relate to cranial openings. In the present dataset, presence of a subnarial process of the nasal is itself sufficient to identify a specimen as A. mississippiensis, and presence of a descending process of the prefrontal is likewise sufficient to identify a specimen as A. sinensis. The ossification of skull bones follows patterns laid down very early in development, which are dictated by gene expression in the embryonic brain and both sensory and ectodermal epithelia (Noden Reference Noden1988; Hanken and Thorogood Reference Hanken and Thorogood1993; Hu et al. Reference Hu, Marcucio and Helms2003; Wada et al. Reference Wada, Javidan, Nelson, Carney, Kelsh and Schilling2005; Brugmann et al. Reference Brugmann, Goodnough, Gregorieff, Leucht, ten Berge, Fuerer, Clevers, Nusse and Helms2007; Bhullar et al. Reference Bhullar, Morris, Sefton, Tok, Tokita, Namkoong, Camacho, Burnham and Abzhanov2015). While current research has so far allowed confident identification of the mechanisms responsible for mostly “coarse” morphological changes, such as the fusion of the avian premaxillae into a beak (Bhullar et al. Reference Bhullar, Morris, Sefton, Tok, Tokita, Namkoong, Camacho, Burnham and Abzhanov2015), there is no reason to think “finer” details such as the presence or absence of a bony process or the position of a bony contact relative to some landmark are not governed by similar signaling cascades. Indeed, embryos of different galloanseran bird species show distinct developmental trajectories from the first appearance of facial landmarks (Smith et al. Reference Smith, Percival, Young, Hu, Schneider, Marcucio and Hallgrimsson2015), leading the authors to propose that morphological differences among adults of closely related species can and do arise from modification to the early stages of development. The development of the vertebrate skull is complex and represents the influence of multiple soft-tissue systems in addition to pleiotropic interactions between skull bones themselves (Percival et al. Reference Percival, Green, Roseman, Gatti, Morgan, Murray and Donahue2018), and possibly (as described in the functional matrix hypothesis), a strong to potentially overriding influence of postnatal mechanical loading (e.g., Moss Reference Moss1997a,Reference Mossb,Reference Mossc,Reference Mossd). While we certainly lack a general predictive model for skull morphology, available evidence makes it clear that the topological architecture of the skull is governed by early developmental events and that we therefore should not expect architectural changes to the skull during postnatal ontogeny.
I also found no evidence for ontogenetic loss of maxillary tooth positions in modern crocodylians. Expanded data collection from alligatoroid specimens in the AMNH Herpetology collection suggests that variation, if present, is exclusively on the order of ±1 positions, and shows no consistent relationship with body size (Fig. 10)—therefore, I interpret this character as polymorphic, but not ontogenetic. Indeed, Brown et al. (Reference Brown, VanBuren, Larson, Brink, Campione, Vavrek and Evans2015) found a similar pattern in both crocodylians and the Komodo dragon (Varanus komodoensis), suggesting that macropredatory reptiles may be generally characterized by ontogenetically stable maxillary tooth counts; however, the presence of an ontogenetic increase in tooth count in many lizards, basal archosauriforms, basal sauropodomorphs, and ornithischian and perhaps basal theropod dinosaurs (Rauhut and Fechner Reference Rauhut and Fechner2005; Brown et al. Reference Brown, VanBuren, Larson, Brink, Campione, Vavrek and Evans2015; Ezcurra and Butler Reference Ezcurra and Butler2015; Chapelle et al. Reference Chapelle, Barrett, Botha and Choiniere2019) indicates that ontogenetically invariant tooth counts are not a general feature of tetrapods. Maxillary tooth count is also interesting in that it provides direct rebuttal of proposed tooth loss in theropod ontogeny. Carr (Reference Carr1999) partially justified a loss of several maxillary tooth positions during tyrannosaurid ontogeny by analogy to crocodylians, citing Mook (Reference Mook1921), Wermuth (Reference Wermuth1953), and Iordansky (Reference Iordansky, Gans and Parsons1973). However, Carr (Reference Carr1999) did not accurately characterize the ontogenetic tooth loss reported by these authors. Mook (Reference Mook1921) identified the number of maxillary teeth below the orbit as undergoing an ontogenetic reduction in crocodylians; this observation is correct, but does not involve loss of maxillary tooth positions, but simply positive allometry of the snout that draws the entire toothrow forward, causing fewer teeth to lie ventral to the orbit. Both Wermuth (Reference Wermuth1953) and Iordansky (Reference Iordansky, Gans and Parsons1973) describe loss of the second premaxillary tooth in mature crocodylians, not reduction in maxillary or dental tooth count. This observation is correct, but the second premaxillary tooth is lost due to overgrowth of the first dentary tooth, resulting in local resorption and eventual obliteration of the premaxillary alveolus (Wermuth Reference Wermuth1953); however, the space for the former tooth persists, making the original dental formula clear. Therefore, none of these authors document a progressive loss of maxillary tooth positions during ontogeny in living archosaurs. Carr (Reference Carr1999) was therefore mistaken in citing these papers as precedent for an ontogenetic loss of maxillary teeth in tyrannosaurids, and indeed other paleontological research does not corroborate this claim. Carr (Reference Carr1999) proposed an ontogenetic reduction from 15 maxillary teeth in “stage 1” juveniles to 13 in “stage 3” adults of the tyrannosaurid Gorgosaurus libratus based on a sample of only 10 specimens and without any quantitative analysis. Currie (Reference Currie2003a) found no statistical evidence for ontogenetic reduction in tooth count in Gorgosaurus, and two recently described individuals smaller than those studied by Carr (Reference Carr1999) both have 14 maxillary teeth (Voris et al. Reference Voris, Zelenitsky, Therrien, Ridgely, Currie and Witmer2022), which is the most common dental count for this genus. Furthermore, the youngest known individual of Tarbosaurus bataar has only 13 maxillary teeth, like most Tarbosaurus adults (Tsuihiji et al. Reference Tsuihiji, Watabe, Tsogtbaatar, Tsubamoto, Barsbold, Suzuki, Lee, Ridgely, Kawahara and Witmer2011). Carr et al. (Reference Carr, Varricchio, Sedlmayr, Roberts and Moore2017) proposed that another tyrannosaurid, Daspletosaurus torosus, gained and then lost teeth as it grew, but this observation is based upon a long-standing misidentification of a juvenile specimen, which is more convincingly interpreted as a young G. libratus (Voris et al. Reference Voris, Zelenitsky, Therrien and Currie2019). Without this specimen, all D. torosus individuals have between 14 and 16 maxillary tooth positions and thus are consistent with the range of variation seen in crocodylians and other tyrannosaurs. Therefore, the available evidence favors the interpretation that tyrannosaurids, like modern crocodylians, did not lose maxillary tooth positions during growth and instead showed limited variation about a modal tooth count that was particular to each species. Suggestions to the contrary were based upon small sample sizes, misidentified specimens, and erroneous citation of prior literature.
The ontogenetic invariance of dental count is of interest beyond Tyrannosauridae, however, for two main reasons. First, tooth count is a widely applicable and presumably homologous character among most tetrapods, allowing a rare example of directly comparable character states among a wide array of taxa. Second, the generation of teeth is yet another process mediated by epithelial–mesenchymal interaction during development. The first teeth in Alligator appear at approximately the same time as the cranial nerves and arteries, although the ultimate patterning of the toothrow and determination of the final number of functional tooth positions continues to hatching (Westergaard and Ferguson Reference Westergaard and Ferguson1990). While the first embryonic tooth generation is formed from cells derived from odontogenic placodes, an epithelial cell population termed the dental lamina replaces it and persists as a source of odontogenic stem cells throughout life (Tsai et al. Reference Tsai, Abdelhamid, Khan, Elkarargy, Widelitz, Chuong and Wu2016). The persistence of a dental lamina permits Alligator (and toothed amniotes generally) to undergo continuous tooth replacement (polyphyodonty), and this cell population plays a key role in patterning the toothrow, such as determining the number of tooth positions (Westergaard and Ferguson Reference Westergaard and Ferguson1990). Given the previously discussed tendency of epithelial tissues to maintain and create space for themselves, it seems plausible to hypothesize that the persistence of a dental lamina precludes ontogenetic loss of tooth positions. The early-diverging theropod Limusaurus inextricabilis is documented to lose tooth positions ontogenetically, and this appears to result from a complete cessation of tooth replacement that is consistent with degeneration of the dental lamina (Wang et al. Reference Wang, Stiegler, Amiot, Wang, Du, Clark and Xu2017). However, in Limusaurus, void spaces persist in the maxilla and dentary in the former positions of the dental alveoli, suggesting that the dental lamina alternatively may persist but become inactive. In any case, we can observe that, like the other character types described earlier, tooth patterning is a process that occurs early in development (long before the condensation of the eventual tooth-bearing bones) and shows no ontogenetic variation in my model system. This result may be broadly applicable, given that extant macropredatory reptiles also show no sign of ontogenetically variable tooth counts, but the phylogenetic distribution of ontogenetically stable dental counts requires further study (a goal of future work by myself and others).
In summary, characters that derive from patterns and topology laid down in early stages of embryonic development appear to be fixed throughout later ontogeny, irrespective of how the skeleton itself is later modified. The “architectural plan,” so to speak, is fixed from early embryology, and certainly by birth or hatching. While we lack a cohesive understanding of how increasingly granular cranial characters develop, known mechanisms make it clear that the architecture of the cranial skeleton is controlled by the soft tissues that are laid down long before the initiation of osteogenesis and are in fact active signaling centers governing osteogenesis itself. These developmental mechanisms are broadly conserved among vertebrates, so while I welcome further studies in other extant study systems, I am confident that this general principle will hold for species that have comparable developmental programs (e.g., metamorphic amphibians may not be subject to the same constraints). Anecdotal data from disparate systems corroborate my expectation. It is perhaps of note that the single consistent cranial character differentiating lions from tigers (a textbook example of osteologically similar living species) is an architectural character—the posterior level of the nasofrontal suture relative to the maxillofrontal suture (Williams et al. Reference Williams, Loveridge, Newton and Macdonald2015). Similarly, Voris et al. (Reference Voris, Zelenitsky, Therrien, Ridgely, Currie and Witmer2022) and Coppock et al. (Reference Coppock, Powers, Voris, Sharpe and Currie2024) found that an overwhelming majority of apparently ontogenetically invariant characters among derived tyrannosaurid dinosaurs related to the sutural relations of skull bones. The nasal capsule forms before skeletogenesis, perhaps explaining both the ontogenetic invariance of cranial pneumatization in Alligator and the ontogenetically invariant (and apparently autapomorphic) absence of an “S-loop” in the nasal passage of the ornithischian dinosaur Parasaurolophus, despite progressive growth of an elaborate cranial crest containing the nasal passage (Farke et al. Reference Farke, Chok, Herrero, Scolieri and Werning2013). In contrast, my results show that non-architectural characters such as the shape of bone contours, the gross proportions of the skull, dermal bone ornamentation, and muscle scar appearance are characterized by high degrees of ontogenetic variation. That is not to say that any of these characters cannot be diagnostic; for example, my data indicate that A. sinensis is distinguished by a taller posterior skull than A. mississippiensis throughout life, and the apomorphically broad snout of Caiman latirostris is similarly discernible, even in hatchling individuals (Fernandez Blanco et al. Reference Fernandez Blanco, Bona, Olivares and Desojo2015); however, my results do suggest that characters relating to the topological relationships of the cranial skeleton and organ systems are more reliable than characters such as skull proportions, muscle scar development, or degree of ornamentation. These traits have been identified as ontogenetic by generations of anatomists before me, including in work focused specifically upon crocodylians (e.g., Fernandez Blanco et al. Reference Fernandez Blanco, Bona, Olivares and Desojo2015; Morris et al. Reference Morris, Vliet, Abzhanov and Pierce2019); I consider the significant result of the present work identifying not which characters do vary during ontogeny, but rather the identification of those that do not.
I conclude that the answer to the final question posed in the introduction to this manuscript is “yes”—ontogenetically invariant characters both exist and occur following basic principles of embryonic development, even among sister species that are known to develop from a common embryonic morphology and remain superficially similar even in adulthood (Morris et al. Reference Morris, Vliet, Abzhanov and Pierce2019). The presence of differences in skull architecture, therefore, allows us to falsify the hypothesis that the character differences between two specimens are attributable to ontogenetic variation. I hope these results will prove relevant to continued investigations of the proposed “extreme ontogenetic changes” experienced by many extinct clades, most famously including non-avian dinosaurs, as well as taxonomic assessment of new discoveries and historical collections alike. It is certainly tempting to declare that many transformations involving “extreme” ontogenetic changes are invalid, and indeed some prior research has been criticized on developmental grounds—for example, Longrich and Field (Reference Longrich and Field2012) criticized the proposal that Torosaurus is the adult form of Triceratops partially on the grounds that such a hypothesis would require late ontogenetic addition of osteoderms, which is not observed in modern animals or in other ceratopsians (Farke Reference Farke2011). This principle would also cast doubt on the synonymy of Late Cretaceous pachycephalosaur genera, which is partially predicated on rearrangement of osteoderm ornaments (Horner and Goodwin Reference Horner and Goodwin2009; Goodwin and Evans Reference Goodwin and Evans2016). However, we cannot be sure that extinct species with anatomy unlike any modern animal did not have concomitant modifications to the developmental program without corroborating evidence from the fossil record itself. Here, “Rosetta Stone” specimens of potentially intermediate ontogenetic stage and exceptional preservational quality will have renewed importance, for they will allow us to test how applicable models derived from extant study systems are to extinct clades of interest. Several ceratopsians, for example, do appear to show an unexpected ontogenetic character change—exclusion of the supraoccipital from the foramen magnum (Horner and Goodwin Reference Horner and Goodwin2006; Currie et al. Reference Currie, Holmes, Ryan and Coy2016)—which is only recognizable due to plentiful fossil material and exceptional specimens of different ontogenetic stages. It is clear, however, that the results of the present study contrast sharply with prevailing interpretations of ontogeny as a “black box” that can be invoked to explain almost any character difference between specimens, and I predict that if “extreme ontogeny” proves to be real, we will find that it does not involve architectural modification to the skull and its soft tissues, but rather exaggeration of ontogenetic trajectories in proportion, shape, and ornamentation that exist in all amniotes.
Pursuant to the example that has formed a throughline in this paper: the “Dueling Dinosaurs” tyrannosauroid specimen (North Carolina Museum of Natural Sciences [NCSM] 40000) has now been demonstrated to be both somatically mature and apomorphically referable to Nanotyrannus lancensis (Zanno and Napoli Reference Zanno and Napoli2025), confirming that the controversial taxon is valid and not a juvenile form of T. rex and corroborating that characters such as absence of a subnarial foramen, presence of a sinus cavernosus, a laterally positioned vagus foramen, presence of a quadratojugal recess, and high maxillary and dentary tooth counts are phylogenetically informative and ontogenetically invariant in tyrannosauroids. It is worth noting that, as described earlier, continued research on juvenile tyrannosauroids has established that many of the ontogenetic trends required for Nanotyrannus to grow into Tyrannosaurus are not precedented in closely related taxa (Tsuihiji et al. Reference Tsuihiji, Watabe, Tsogtbaatar, Tsubamoto, Barsbold, Suzuki, Lee, Ridgely, Kawahara and Witmer2011; Voris et al. Reference Voris, Zelenitsky, Therrien and Currie2019, Reference Voris, Zelenitsky, Therrien, Ridgely, Currie and Witmer2022; Coppock et al. Reference Coppock, Powers, Voris, Sharpe and Currie2024; Raun et al. Reference Raun, Coppock, Badamgarav, Tsogtbataar and Currie2026), and that Nanotyrannus, contra Voris et al. (Reference Voris, Zelenitsky, Kobayashi, Modesto, Therrien, Tsutsumi, Chinzorig and Tsogtbaatar2025), shares no exclusive apomorphies with Tyrannosaurus (Currie Reference Currie2003b; Zanno and Napoli Reference Zanno and Napoli2025). It appears that the stratigraphic co-occurrence of these taxa and the (perceived) juvenile status of all previously reported specimens of Nanotyrannus were considered to supersede the abundant morphological evidence that they were distinct taxa; these lines of evidence are circumstantial and logically irrelevant to taxonomic hypotheses. To be a juvenile T. rex, a specimen must be both a juvenile and identifiable as T. rex; merely being a juvenile tyrannosauroid does not meet this burden of proof. The implausibility of the “juvenile T. rex hypothesis” is perhaps best evidenced by the fact that Carr (Reference Carr2020) described it as a “secondary metamorphosis” and compared it directly to the abrupt morphological transformations seen in sexual maturity among some teleost fish, rather than any other archosaur. It is difficult to see why the “simplest hypothesis” was that these specimens were juveniles of T. rex, despite sharing no unique characters with T. rex and mounting evidence that other tyrannosaurids did not show comparable ontogenetic trajectories. Perhaps Occam’s razor needs sharpening.
The “Dueling Dinosaurs” specimen provided a wealth of anatomical evidence about Nanotyrannus from an individual that was functionally somatically mature, meeting an exceptionally high burden of proof for the validity of Nanotyrannus. Griffin et al. (Reference Griffin, Bugos, Poust, Morris, Sombathy, D’Emic, O’Connor, Petermann, Fabbri and Colleary2025) independently followed this paper with evidence that the holotype of Nanotyrannus itself was mature, which suggests that the entire Nanotyrannus debate was built upon a false premise. But what if these specimens were, like the holotype (Burpee Museum of Natural History [BMRP] 2002.4.1) of the newly recognized species Nanotyrannus lethaeus , rapidly growing juveniles (Woodward et al. Reference Woodward, Tremaine, Williams, Zanno, Horner and Myhrvold2020; Zanno and Napoli Reference Zanno and Napoli2025)? Based upon the results presented herein, I argue that the anatomical evidence alone would have been inconsistent with ontogeny and allowed these specimens to be correctly identified. While osteohistology provides an invaluable wealth of information and can inform taxonomic hypothesis testing, it should not hold a premium over the actual morphological evidence that is used for taxonomy and systematics—especially given that, as I hope I have shown convincingly, ontogenetic character variation is predictable and juveniles do show diagnostic traits of their species from early ontogenetic stages. Ironically, the osteohistological evidence of maturity in Nanotyrannus specimens was needed to prove that such evidence is not required to resolve similar taxonomic debates in the future. The framework I have developed here holds promise to clarify many uncertainties in amniote taxonomy and systematics, especially as similar studies are completed over a greater phylogenetic and taxonomic scope.
The preceding discussion warrants a final word of caution. Establishing that a character is not ontogenetically variable is not equivalent to establishing that it is not intraspecifically variable. The overwhelming focus on ontogeny belies the numerous sources of intraspecific variation that may exist superimposed upon each other. Trait polymorphism is perhaps the most obvious, and as seen earlier can allow even ontogenetically invariant characters to vary within species. For example, the hypoglossal canal in the human skull is partly or fully divided by a bony septum in ~20% of individuals (Guarna et al. Reference Guarna, Lorenzoni, Franci and Agliano2023; Kalthur et al. Reference Kalthur, Padmashali, Bhattarai and Gupta2023). This occurs due to abnormal development of the neurovasculature traversing the canal and is therefore almost surely not ontogenetic variation, but normal polymorphism within Homo sapiens. Indeed, evolution cannot occur in the absence of intraspecific variation, so we should expect that every phylogenetically informative character was, at some point in evolutionary history, polymorphic within a single species. For this reason, I urge circumspection in applying my results to the fossil record. The presence of a putatively ontogenetically invariant difference between two specimens need not mean that the two specimens belong to different species—this difference could always represent polymorphism, especially if there is only one such difference. That said, the present dataset does suggest that polymorphism is uncommon in ontogenetically invariant characters. This is probably not coincidental. Modifying architectural traits necessarily involves alteration to early steps in the developmental program, which increases the risk that they render the embryo nonviable—therefore, we may expect that these changes are developmentally “harder” and would appear less frequently, making it most likely that such character changes are associated with deeper lineage divergences and thus that they are strong evidence of species distinction. If this model holds, these characters would also be those that are least likely to be homoplastic, and therefore they may be the strongest characters for both taxonomic hypothesis testing and phylogenetic analyses. The long-recognized importance of cranial arterial and venous anatomy in mammalian systematics (Wible Reference Wible1986, Reference Wible1987; MacPhee et al. Reference MacPhee, Gaillard, Forasiepi and Sulser2023; Crowell et al. Reference Crowell, Wible and Chester2024) corroborates this expectation, as do observations of a widely conserved topological correspondence between divisions of the tetrapod adductor musculature and branches of the trigeminal nerve (e.g., Holliday and Witmer Reference Holliday and Witmer2007). Recent research has demonstrated that within the appendicular skeleton, later-developing distal limb bones show greater variation than earlier-developing proximal elements and evolve more rapidly (Stepanova and Womack Reference Stepanova and Womack2020; Rothier et al. Reference Rothier, Fabre, Clavel, Benson and Herrel2023), lending further credence to this interpretation. At present, it seems safe to say that early-developing architectural characters are likely to both be ontogenetically invariant and show the least polymorphism, with the caveat that further research on polymorphism itself may modify how paleontologists accommodate it in the fossil record.
While polymorphism remains a potentially problematic unknown, the present results do allow me to articulate guidelines for vetting the possibility of fossil specimens representing an ontogenetic series:
-
1. Characters relating to the sutural topology of the skull, which is determined by patterns of gene expression in epithelia from early stages of embryonic development, are unlikely to change in posthatching ontogeny. This includes characters such as “bone X contacts bone Y,” “bone X has a distinct process overlapping part of bone Y,” “bone X reaches the posterior level of landmark Z,” and “process A of bone X is longer than process B of bone Y,” among potential others.
-
2. Characters relating to the pathway of major cranial blood vessels and nerves, which are laid down before and regulate osteogenesis, are unlikely to change during posthatching ontogeny. These include, for example, “foramen bounded by bones X and Y, between bones X and Z, or entirely within bones X, Y, or Z,” “foramen in bone X is single or divided,” “foramen in bone X is on the lateral or anterior surface of bone X,” or “foramen for neurovascular bundle A is present or not present.”
-
3. Characters related to the distribution of pneumatic recesses (osteological correlates of air sinuses, which begin to form before osteogenesis) are unlikely to vary during posthatching ontogeny, with the possible exception of the very earliest stages of posthatching life. Such characters may include “pneumatic recess present in bone X” and “pneumatic recesses A and B internally communicate,” potentially among others. While the ultimate adult morphology and size of pneumatic recesses may vary, we may also predict that such change will be unidirectional (and result in larger overall size), so shrinking or secondary closure of pneumatic recesses is also unlikely.
-
4. Tooth counts show clade-specific patterns in ontogenetic variability, but such tendencies either involve ontogenetic addition of tooth positions, or ontogenetically stable tooth positions. In the latter case at least, tooth count usually varies by ±1 from a modal value, fitting general observations that variation in biological systems tends to approximate a normal distribution and that ranges of dental counts have diagnostic utility despite the presence of intraspecific variation. No clade shows a tendency toward a loss of tooth positions, despite published claims to the contrary.
-
5. Ontogenetically invariant characters overwhelmingly represent characters that arise early in embryonic development. As such, they are also less likely to be polymorphic among species, although it is impossible to fully exclude the possibility that any one character varies among a sample due to polymorphic intraspecific variation.
-
6. Ontogenetically variable characters, such as bone surface ornamentation, suture fusion, muscle scar development, and proportional and shape changes, tend to show a unidirectional and predictable trend, allowing apparent trend reversals to be independent indicators of species distinction among sufficiently large datasets. For example, “bone X has an ornamental structure” may be on ontogenetically variable character state, but is unlikely to be the juvenile character state; conversely, “bone X lacks a muscle scar” is unlikely to represent the adult state.
Critical appraisal of these predictions both in a range of study systems and through finer resolution of molecular signaling pathways that ultimately generate skeletal morphology, clearly represent important topics for future research.
Conclusions
Despite benefiting from decades of methodological development and an increasingly rich body of fossil evidence, vertebrate paleontologists have encountered persistent difficulty with the ontogeny problem—which states, fundamentally, that ontogenetic character change may obscure the species identity of a specimen. In many cases, paleontologists have argued back and forth over the same suite of characters, because the ontogeny problem is fundamentally one of interpretation. Perhaps in response to this long-standing challenge, paleontologists have adopted a range of epistemological assumptions and analytical approaches that (implicitly or explicitly) attempt to avoid type I taxonomic error at the expense of a very high risk of type II error. In our effort to avoid recognizing species based on growth stages of one taxon, we have put ourselves at risk of not recognizing many species that are truly represented in the known fossil record. In general, only glaring differences between putative species are accepted as evidence that they are distinct (and, given recent proposals of “extreme ontogeny,” even major anatomical differences are not always interpreted as phylogenetic in origin). Regardless, such an approach ignores the reality that closely related and osteologically similar species coexist in modern faunas, a pattern that holds over a range of clades, trophic levels, and biomes. I have heard colleagues suggest in conversation that a paleontological species should be recognized as something fundamentally different from an extant species—a broader unit, perhaps more equivalent to a modern genus, or even a more inclusive group—to account for the fact that so many closely related modern species are difficult to tell apart from skeletal evidence alone.
I disagree. Species are the operational unit of evolutionary biology, and if paleontologists are to sit at the metaphorical “high table” (Maynard Smith Reference Maynard Smith1984) and bring their data to bear on major questions about the evolution of life on Earth, we must at least try to bring our species concept in line with the modern. Although we cannot apply any species concept predicated on either behavioral or genomic data, we can use those species concepts to develop explicit expectations for how members of a species should vary from one another due to ontogeny and other sources of individual variation (Tschopp et al. Reference Tschopp, Napoli, Wencker, Delfino and Upchurch2022). The modern can inform how we interpret the fossil record, and where we draw species boundaries. In short, we should test taxonomic hypotheses in fossil systems by quantifying not how different two specimens are, but by how those two specimens are different.
My study of ontogeny, polymorphism, and phylogenetic variation among Alligator reveals that even young juvenile animals can be confidently identified based upon a suite of ontogenetically invariant traits, many of which are not polymorphic. These invariant characters overwhelmingly reflect early events in embryonic development, potentially explaining both why they are so infrequently polymorphic and why they do not change later in ontogeny—the architecture, so to speak, of the skull is set early, with later ontogenetic modifications to shape, proportions, and bone surface features superimposed upon, but not altering, the preexisting plan of the tissues of the cranium. Ontogeny is perhaps best considered as analogous to remodeling a building, a process that may significantly alter the aesthetics and function of a space while preserving architectural features such as support beams, plumbing, and electrical wiring, rather than wholesale renovation. While a full survey of ontogenetic variation and polymorphism in living amniotes would require a field-wide effort, the sequence of the amniote developmental program is conservative, so I do consider my results applicable to the ontogeny problem writ large. Indeed, anecdotal data from other systems do suggest that architectural differences, when present, indicate that different individuals belong to different species, if not more inclusive clades.
Morphology results from development, and in my opinion, any anatomical trait must be considered in the context of how it develops. Evolutionary developmental biology has facilitated major breakthroughs in our understanding of vertebrate evolution, because it allows us to interpret the fossil record from a mechanistic perspective that is otherwise unattainable; however, explicit integration of these observations into more strictly “paleontological” research remains rare. Taxonomy is fundamental to all else in evolutionary biology, and taxonomic hypotheses, despite being derided as “boring” or “unimportant” by some contingents, have fundamental importance to virtually all other scientific questions—perhaps explaining why species delimitation has been, and continues to be, an active area of research. Integrating mechanistic insights derived from evolutionary developmental biology and documented ontogenetic variation among living species of known identity into the paleontological toolkit offers tremendous potential to resolve the “ontogeny problem” and to, at long last, put persistent taxonomic debates to rest.
Acknowledgments
This work represents a large portion of my Ph.D. thesis, written at the Richard Gilder Graduate School of the American Museum of Natural History. I am indebted to many, both at the AMNH and other institutions, who facilitated my development as a scientist by supporting me, challenging me, and teaching me so much I did not know when I started as a student. These individuals include M. Norell, J. Flynn, J. Meng, M. Hopkins, W. Harcourt-Smith, A. Turner, B-A. Bhullar, F. Burbrink, and A. Watanabe. My doctoral committee members in particular (M. Norell, J. Flynn, J. Meng, M. Hopkins, W. Harcourt-Smith, and A. Turner) deserve special thanks for reading and revising multiple prior versions of this article; their efforts significantly improved its quality. I further thank L. Zanno and the North Carolina Museum of Natural Sciences Paleontology research group, under whose guidance and in whose company both I and this article matured. I thank both L. Witmer and an anonymous reviewer for helpful reviews, and A. Farke, C. Brochu, and J. Silviria for helpful comments on a preprint version of this work. This work would not have been possible without the support of AMNH collections and facilities staff, including M. Chase, A. Smith (AMNH MIF), C. Mehling, C. Merrill, S. Goldberg (AMNH Paleontology), and D. Kizirian and L. Vonnahme (AMNH Herpetology). Science is honed by discussion and debate, and my friends and colleagues E. Tschopp, K. Chapelle, S. Johnston, M. Fabbri, M. Powers, J. Voris, H. Sharpe, A. Ruebenstahl, and D. Meyer have all played an important role in the refinement of the ideas presented herein. Of all my compatriots, however, none deserves more thanks than A. Zietlow, who was a constant source of support and friendship and a frequent sparring partner in debates that greatly improved the quality of the research described in this article—remaining supportive even when it became clear that my results opposed her own previously published work, as all scientists imagine they will, but few do. I further thank her for coining the wonderful turn of phrase “sympatry and similarity do not equal synonymy,” which I have used in this article with permission. Finally, I thank K. Williams and my family for their ceaseless support and encouragement. I could not have completed this work without them.
Data Availability Statement
Primary CT scan datasets are reposited and available on Morphosource.com, grouped under project ID 000854926, with data access managed by the AMNH Department of Herpetology. The 3D landmark data (Supplementary Data 1) and discrete character matrix (Supplementary Data 2) are reposited on Dryad, at the following address: https://doi.org/10.5061/dryad.wdbrv15zs.
Competing Interests
The author declares none.


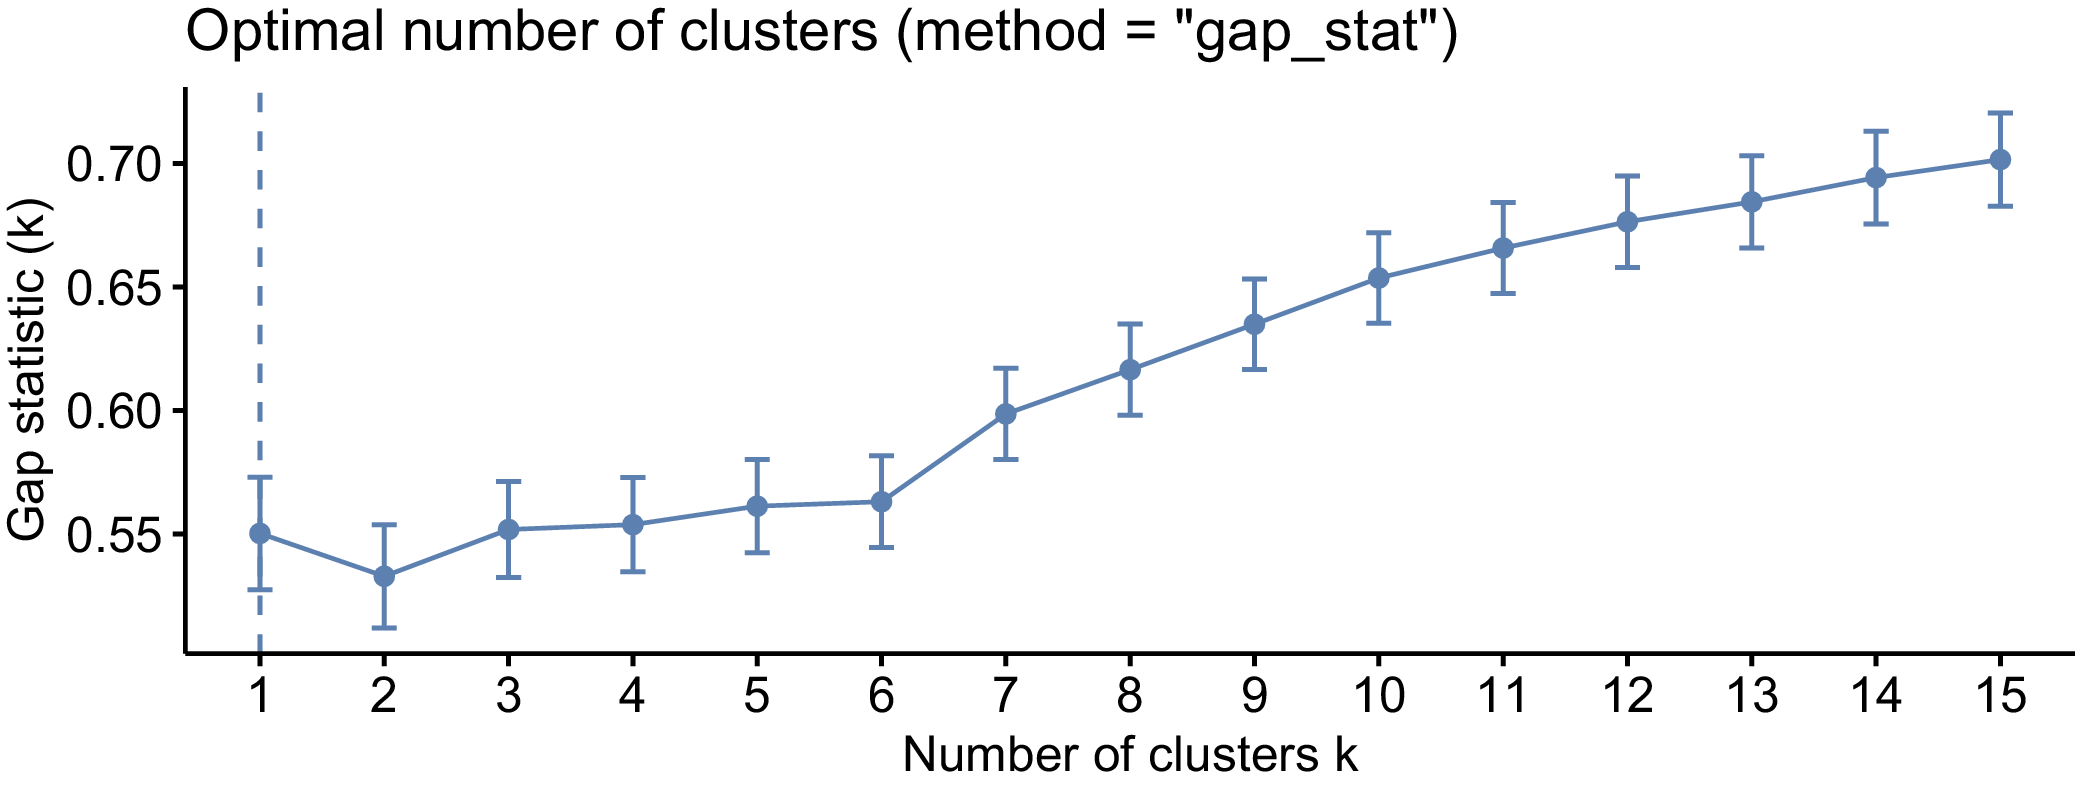

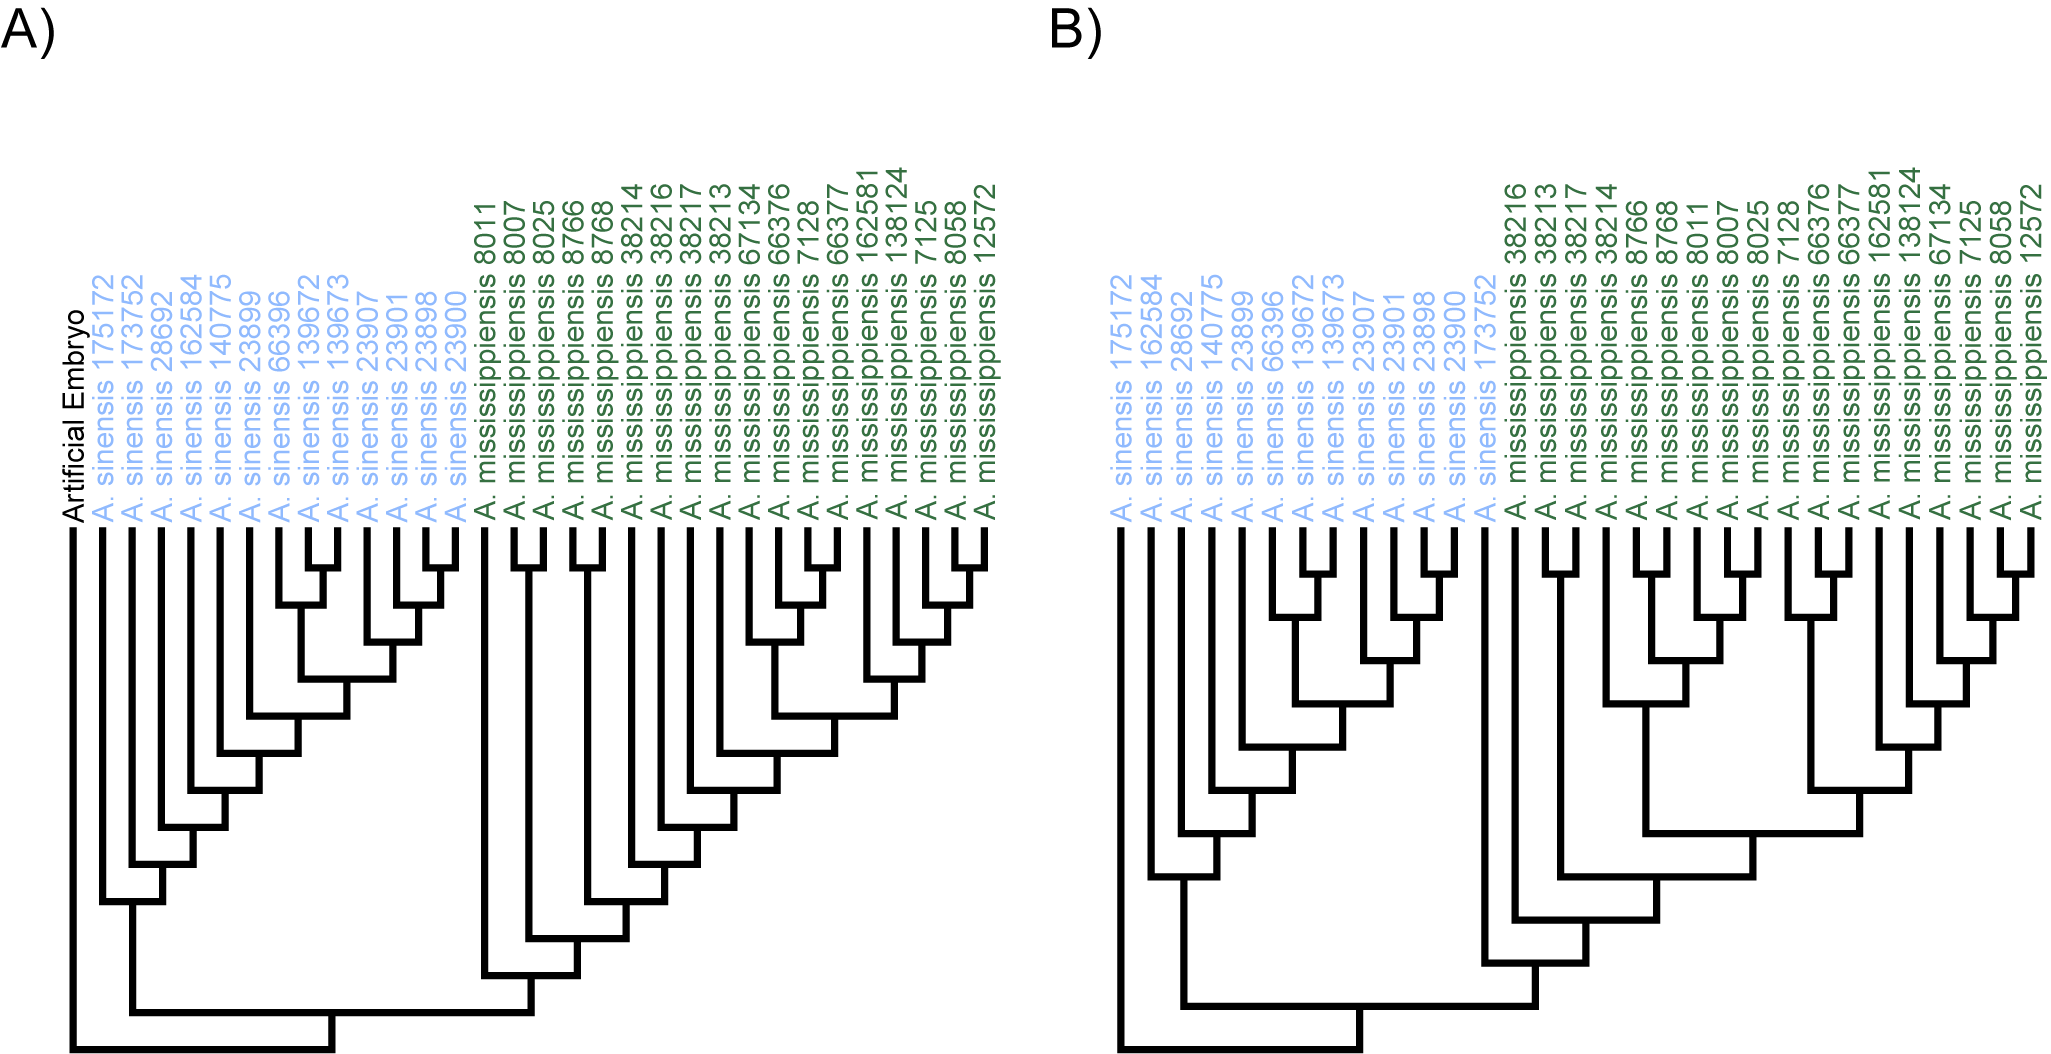
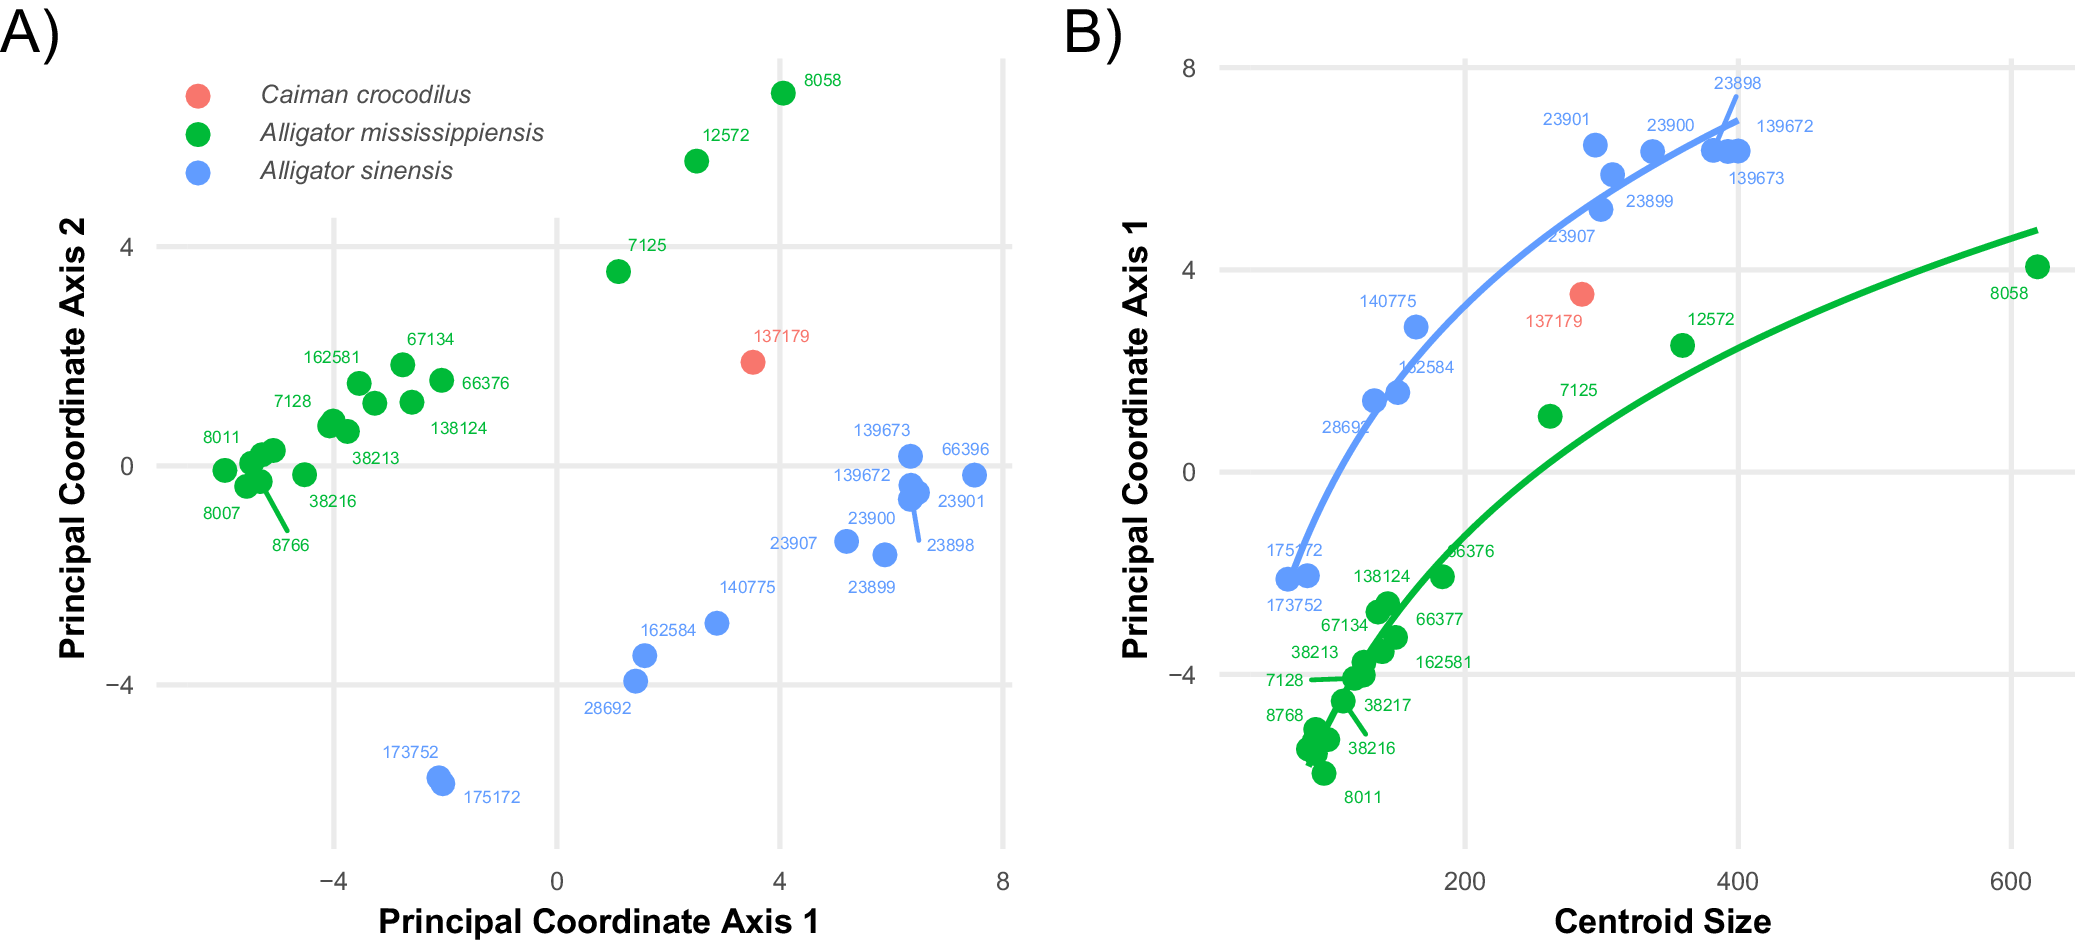
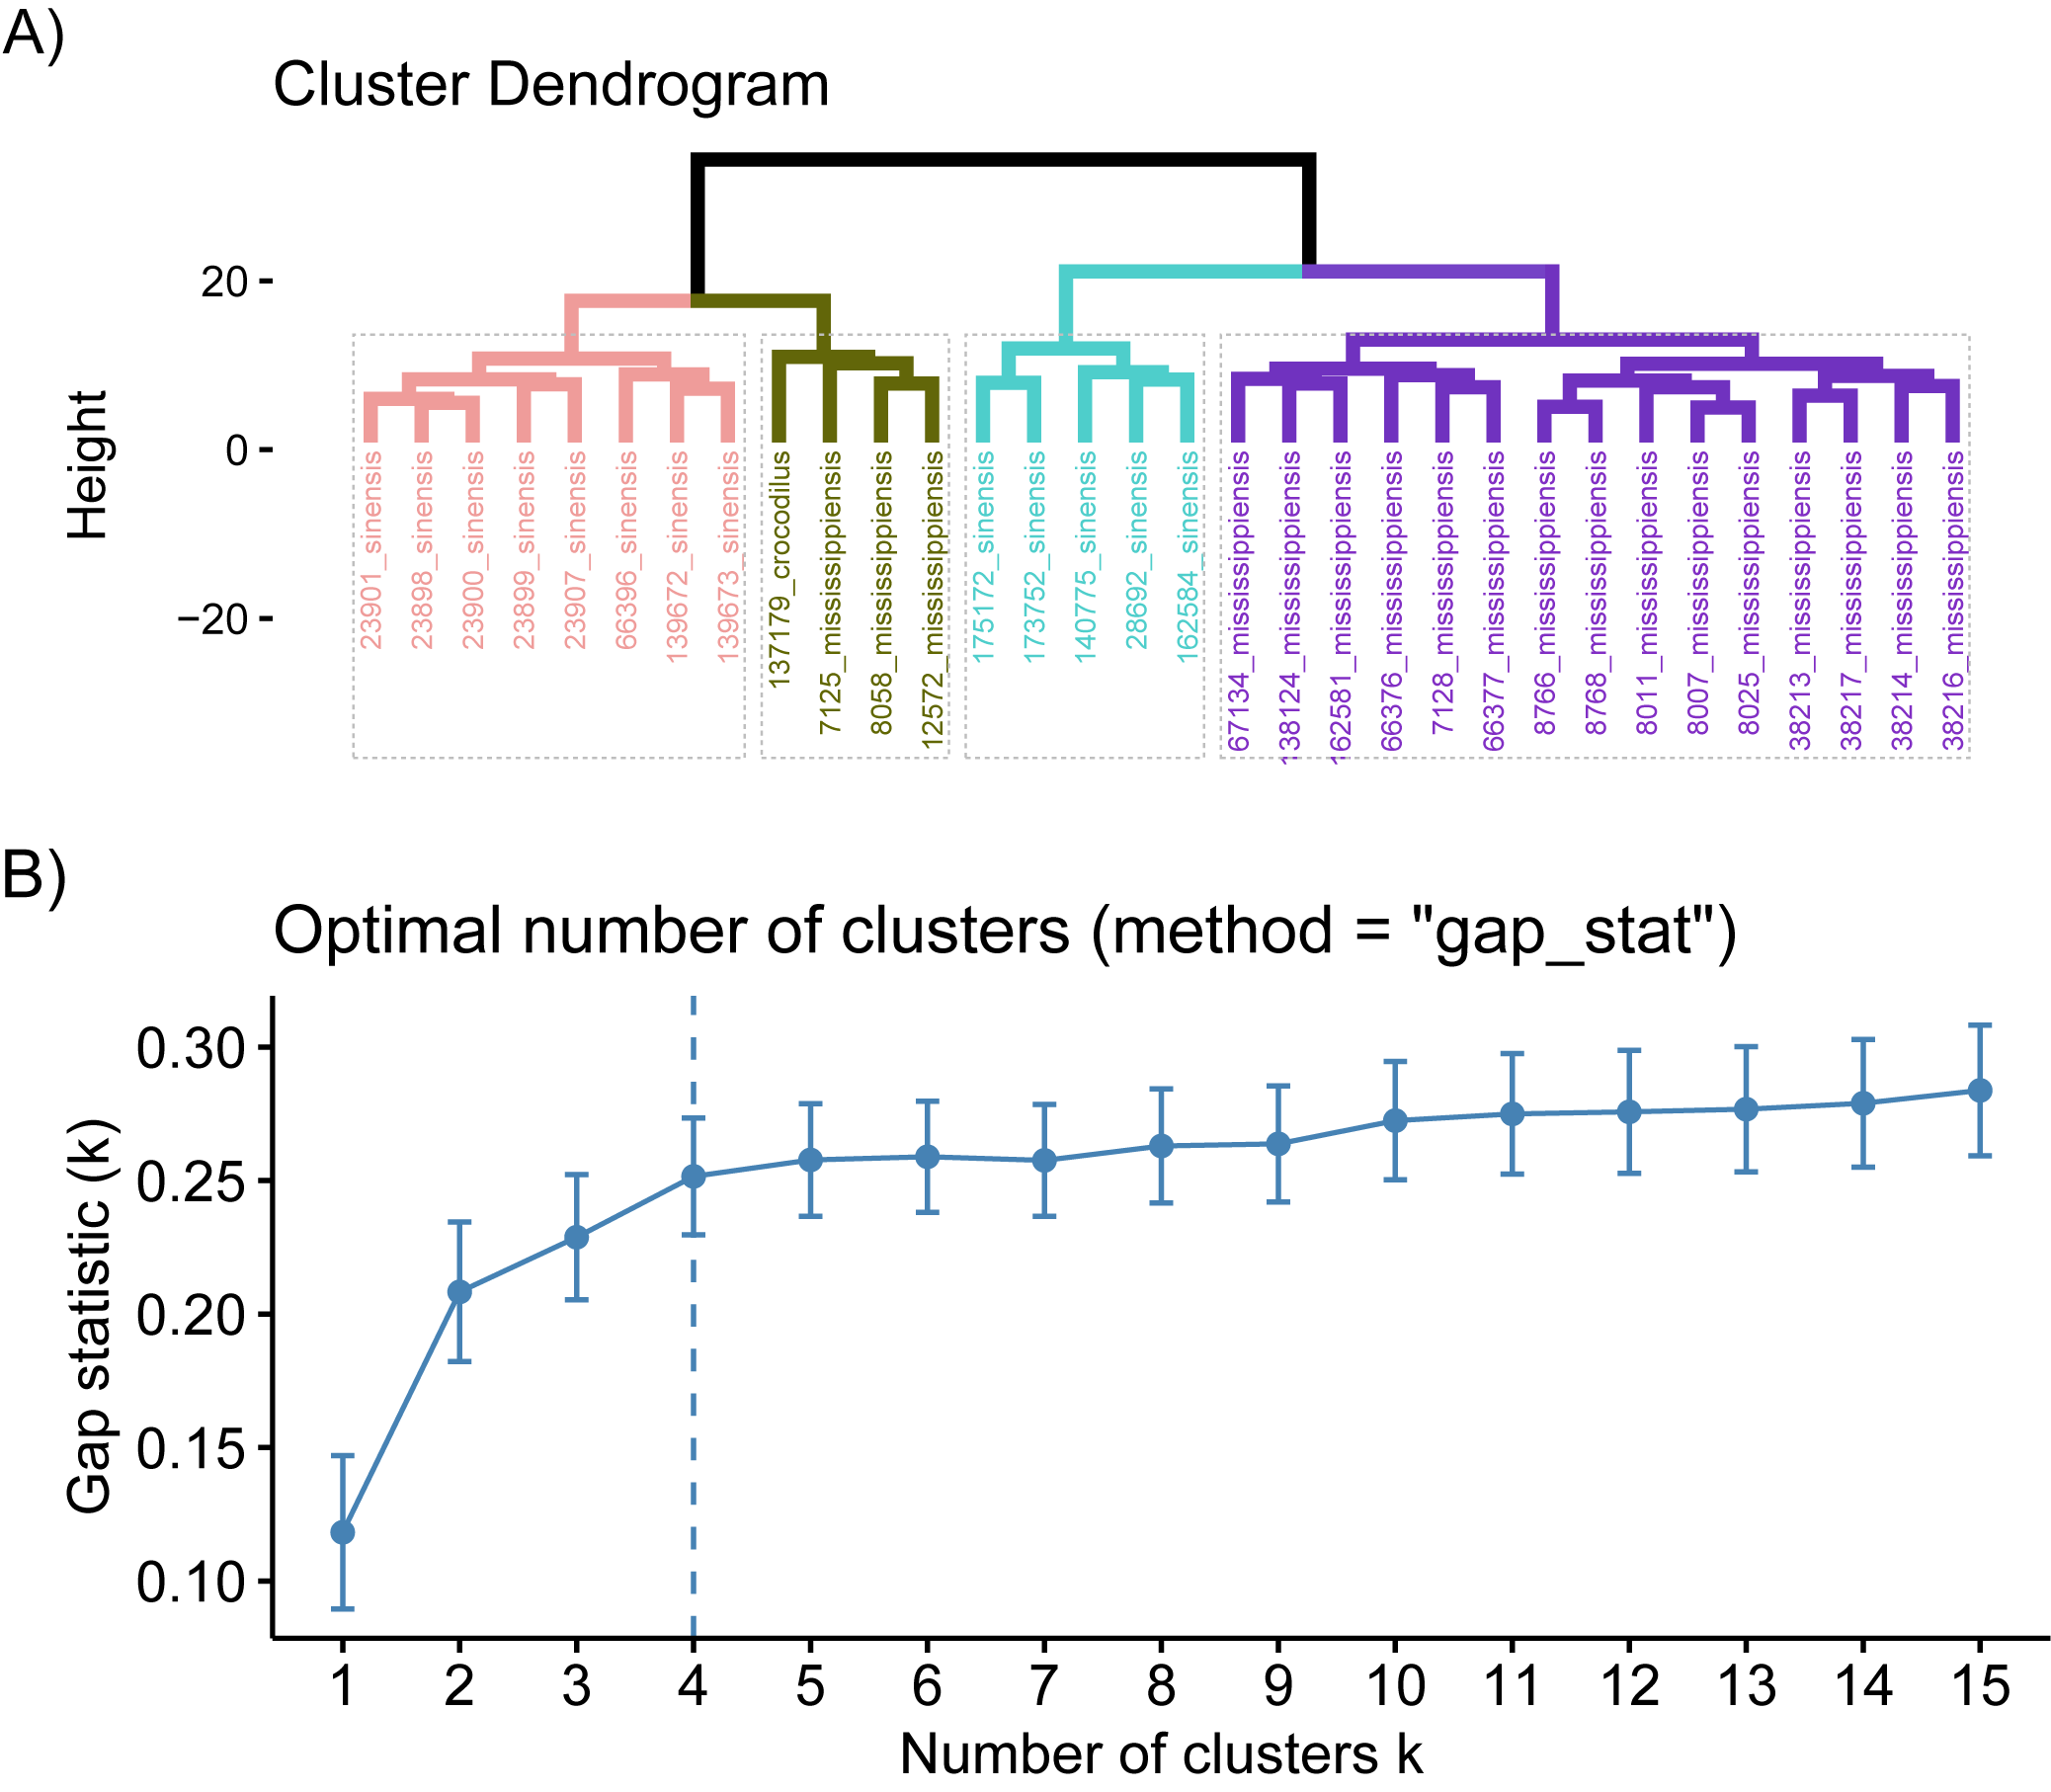


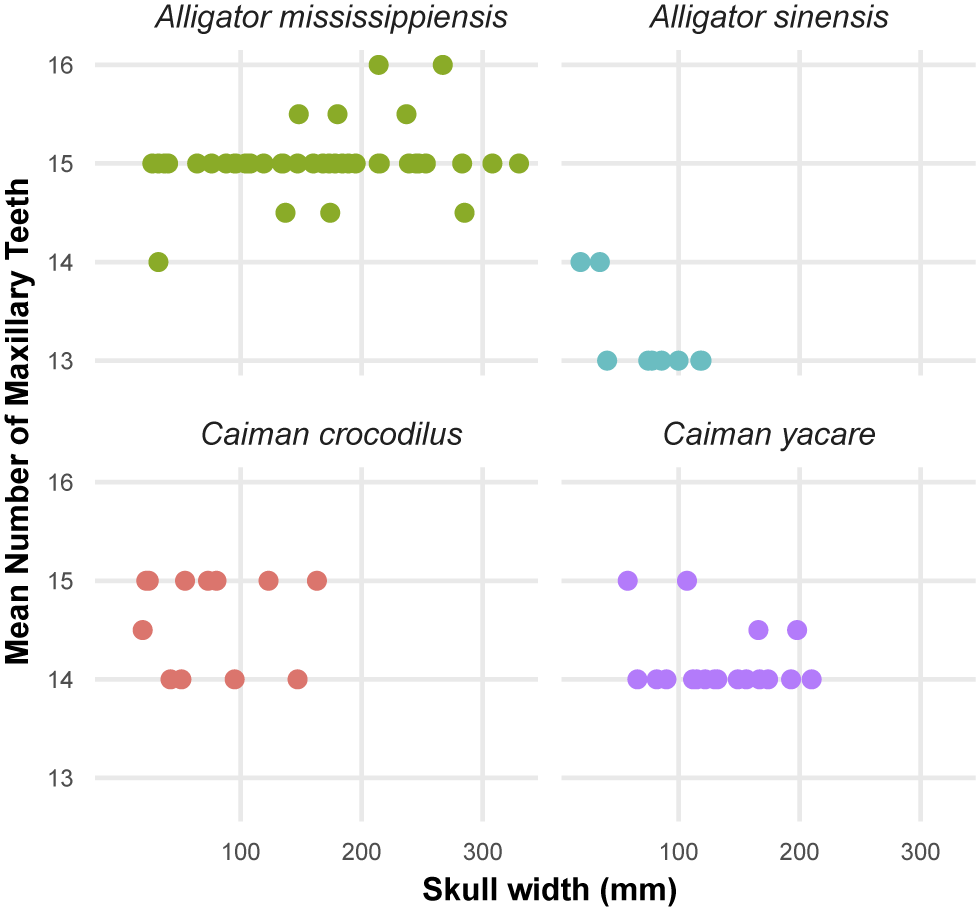

 Open access

