





Introduction
Plasticulture is a management technique that offers growers improved plant growth, quality, and weed control through fumigation, drip tape, raised beds, and plastic mulch (Dickerson Reference Dickerson2007; Sanders et al. 1996). For these reasons, mulch production has gained favorability among Georgia vegetable growers producing fruiting, cucurbit, and cole crops. Plastic mulch systems utilize low-density polyethylene mulch or totally impermeable film (TIF) stretched over aggressively tilled soils that have been formed into raised beds that range in width and height (Lamont 1996). In the U.S. Southeast, these systems are often used for three to five different vegetables (transplanted and seeded) over the course of 2 yr, spreading the cost of production for the plastic mulch, drip tape, and fumigation over multiple crops (Culpepper et al. Reference Culpepper, Grey and Webster2009; Nyoike and Liburd 2014; SEVEW 2020).
To keep the integrity of the mulch intact across multiple crops over time, adequate weed control and termination of the previous crop are crucial. Fumigation was the most effective approach to controlling weeds. However, eliminating methyl bromide reduced effectiveness and allowed for escapes, requiring additional measures (Gilreath and Santos 2004; Webster and Culpepper Reference Webster and Culpepper2005). Thus, herbicides have become integral in controlling the escapes of weeds and the previous crop. Nutsedge species (Cyperus spp.) are especially troublesome for crops grown on mulch, as they penetrate through, causing significant damage to the integrity of mulch (Johnson and Mullinix Reference Johnson and Mullinix2002; Webster 2002). However other weeds, such as Amaranthus spp., Portulaca spp., Ipomoea spp., and annual grasses are problematic, as they commonly infest row middles, crop transplant holes punched in the mulch, and holes in the mulch from degradation or animal damage (Wychen 2019). Even at low densities, these weeds can be extremely competitive and costly to vegetable production.
To control Cyperus spp. and other weed species from damaging the mulch, producers can apply herbicides on top of and under the mulch. Halosulfuron-methyl, glyphosate (Grey et al. 2009), glufosinate (Sharpe and Boyd 2019), and S-metolachlor (Cornelius et al. Reference Cornelius, Meggitt and Penner1985) are herbicides that have registrations or are being evaluated for potential use for over the top of plastic mulch to mitigate previous crop and weed escapes.
Halosulfuron-methyl is a sulfonylurea herbicide that is relied on for pre- and postemergence control of Cyperus spp. in a variety of cropping systems, including plasticulture vegetable production (Anonymous 2017b; Culpepper et al. Reference Culpepper, Grey and Webster2009; Grey et al. 2007; Shaner 2014; Vencill et al. Reference Vencill, Richburg, Wilcut and Hawf1995). Glyphosate and glufosinate are nonselective, contact herbicides that control a wide range of weed species (Anonymous 2017a, 2017b; Shaner 2014). Acetochlor and S-metolachlor are chloroacetamide herbicides that control annual grasses and several broadleaf weeds, including Palmer amaranth (Amaranthus palmeri S. Watson) (Anonymous 2020a, 2020b; Shaner 2014). Because these herbicides are applied broadcast over mulch and row middles to help manage troublesome weeds, their persistence on plastic mulch and movement into holes punched for crop transplants must be understood to avoid crop injury.
Determining the movement of herbicides from plastic mulch into the transplant crop hole has not been studied. Additional research to determine the influence of rainfall or irrigation in removing herbicides from plastic mulch is also needed. Thus, the objective of this experiment was to determine the concentration of five herbicides remaining on the surface of plastic mulch used for vegetable production and into a transplant hole after irrigation. Quantification of herbicides was conducted (1) on the plastic mulch before irrigation; (2) on the plastic mulch after irrigation; and (3) in water accumulated in the transplant hole.
Materials and Methods
Experimental Design
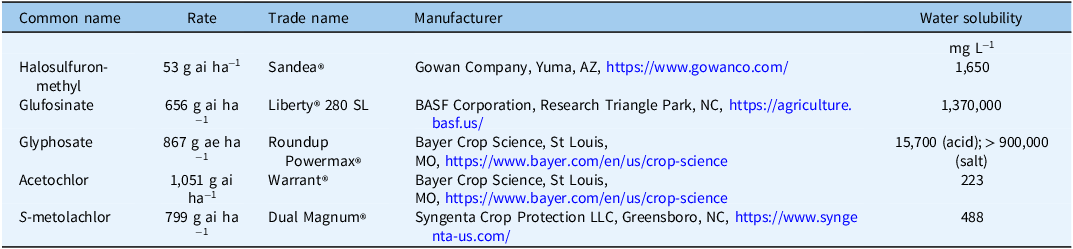
An experiment was conducted at the Coastal Plains Experiment Station, University of Georgia, Tifton, GA (31.475°N, 83.527°W) in 2020. The experiment was arranged as a two by five factorial (two irrigation volumes and five herbicide options) in a randomized complete block design with three replications and repeated twice in time. Halosulfuron-methyl, glufosinate, glyphosate, acetochlor, and S-metolachlor were applied over the top of the simulated mulch beds at field use rates for vegetable production (Culpepper Reference Culpepper2020) (Table 1). Applications of halosulfuron-methyl included non-ionic surfactant (0.25% v/v). All herbicide treatments were applied using a CO2-pressurized backpack sprayer, calibrated to deliver 140 L ha−1 at 150 kPa at 46 cm above the mulch. The spray boom was equipped with three TTI11002 nozzles with a 46-cm spacing (TeeJet® Technologies, Wheaton, IL). After application, the surface of the mulch was allowed to completely dry (1 to 4 h) before initiation of irrigation.
Irrigation treatments consisted of applications at either 0.63 cm or 1.27 cm. A stationary system was constructed using PVC pipe and a single sprinkler (Rainbird® Surepop Sprinkler, Azusa, CA) equipped with a high-efficiency variable arc nozzle with a 4.5-m radius. The simulated irrigation was maintained at 140 kPa using a pressure regulator via a municipal water source. Multiple volume tests were conducted to ensure uniformity of irrigation across the surface of each bed and even water distribution before the herbicide experiment was conducted (±0.7%).
Simulated Vegetable Bed Design
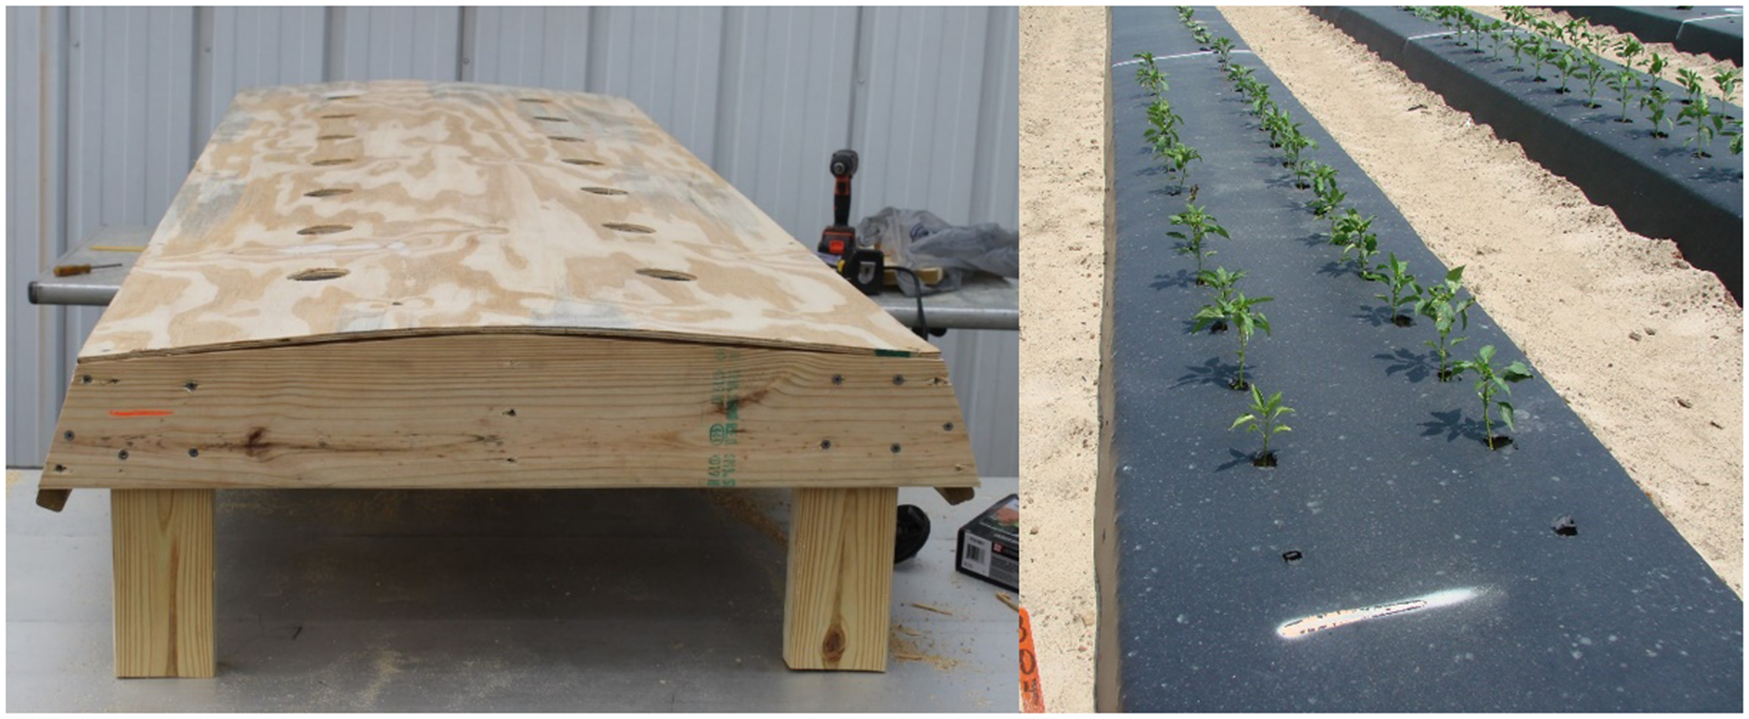
Figure 1 depicts a simulated bell pepper (Capsicum annuum L.) production bed made of plywood (2.44-m wide by 0.76-long, equaling 1.86 m2). A slope of 6.7% from the center of the bed to each outside edge was included to prevent water pooling, following standard field protocol. The soil was mimicked by adding a layer of carpet padding (Leggett & Platt®, Carthage, MO) on top of the plywood. Transplant holes (86-mm-diameter circumference) were cut into the 0.63-cm-thick plywood. Seven holes were placed on each side of the bed (14 total holes) with a spacing of 30.5 cm down the bed and 20.3 cm across the bed, following standard field production procedures. TIF (Guardian Agro Plastics, Tampa, FL) was secured to the simulated bed using staples down each side of the bed, with excess TIF removed. Transplant holes (25-cm2 area) were punched into the plastic mulch using a handmade 5 cm by 5 cm V-shaped wooden wedge, which is a standard size used for field production.
Left, Bed construction without carpet or plastic mulch covering. Design of the simulated bed was created to mimic a soil bed used in pepper production, including a slope of 6.7% from the middle to each side of the bed. Right, An actual field bed” meant? Phrase “in comparison to” seems redundant with “created to mimic.”
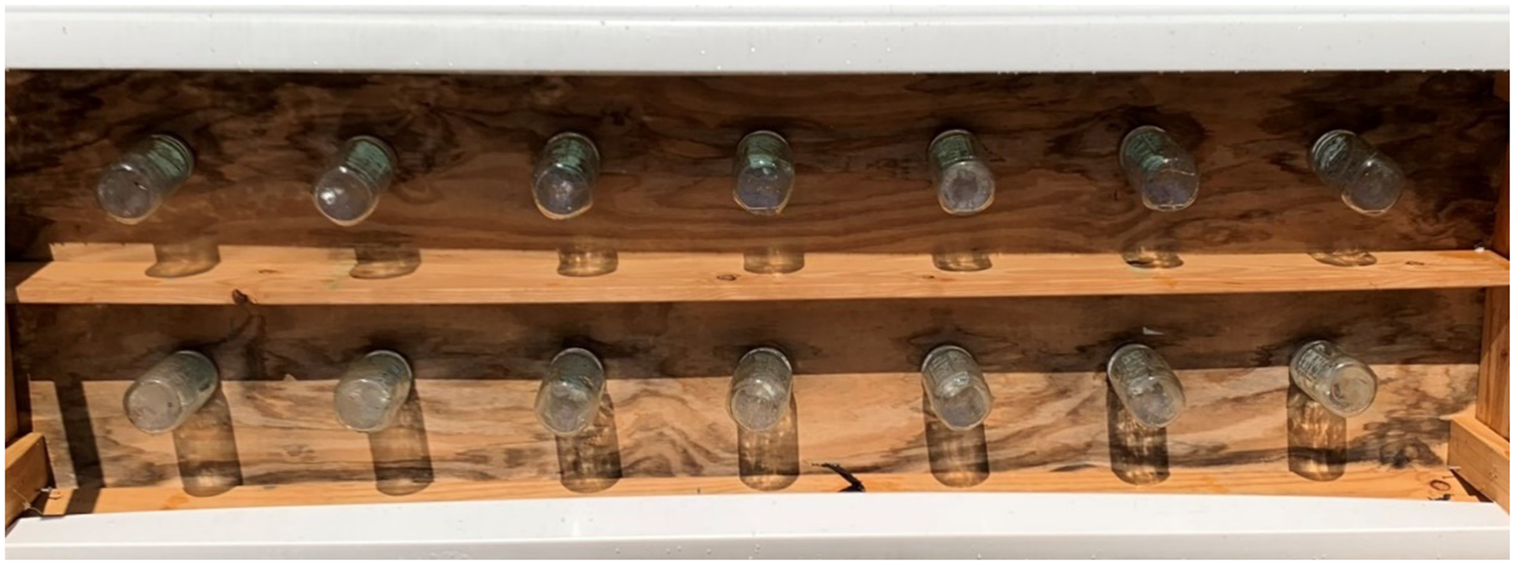
Silica mason jars (0.95 L) (Ball Corporation, Westminster, CO) were placed on the underside of each transplant hole using screw-on metal rings attached to the plywood (Figure 2). Plywood (0.76 m by 0.76 m) was placed at the end of each bed and covered with the same TIF. This section was used to sample TIF after the herbicide application for quantification but before irrigation, similar to Grey et al (2007, 2009).
Bottom view of the constructed simulated bed with 14 glass jars attached representing transplant crop holes. Top row are jars 1–7 (left side of bed) and the bottom row are jars 8–14 (right side of bed), with jars being opposite going down the length of the bed (i.e., jars 1 and 8 are across from each other). Holes were spaced 30.5 cm apart from the center of one hole to the center of another and 20.3 cm from the center of one hole to the edge of the plywood.
Data Collection
Environmental measurements of air temperature (C), wind speed (kph), relative humidity (%) at a height of 2 m, and cloud cover (%) were recorded at the time of each herbicide application (Table 2). Mulch samples after herbicide application but before irrigation were taken from the mulch-covered plywood (0.76 m by 0.76 m) adjacent to each bed, while samples after herbicide application and after irrigation were taken from a random location on the surface of the bed. Plastic mulch sampling procedures were adapted from previous literature (Grey et al. 2009, 2018). Mulch samples were collected within 30 min of irrigation cessation using an open-faced square frame (0.1-m2) and a box-cutting knife. Needle-nose pliers were used to place the individual mulch samples into sealable plastic bags, touching only the underside of the mulch, to prevent contamination between samples. The samples were immediately frozen upon collection at −10 C until analysis. The mulch used to cover the entire bed was removed after data collection was completed for each treatment and replaced with new plastic mulch.
Environmental measurements recorded at the time of each herbicide application a .
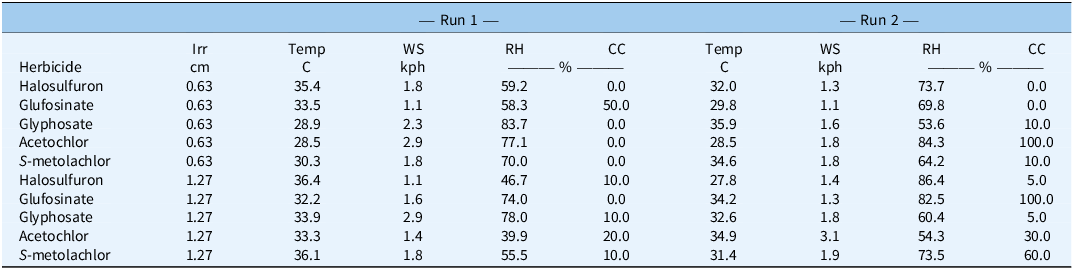
a Abbreviations: Irr, irrigation; Temp, temperature; WS, wind speed; RH, relative humidity; CC, cloud cover.
After herbicide application and irrigation, the 14 jars were removed from the beds. The water volume in each jar was recorded using a graduated cylinder. One cylinder was used per simulated bed, and individual cylinders were rinsed once with organic solvent and then triple-rinsed with water to ensure no cross-contamination between measurements. A 10-ml water sample was then taken from each jar and transferred into a 20-ml glass vial with a screw-on cap (Fisher Scientific, Waltham, MA), resulting in 14 subsamples per replication. Samples from the jars were collected to determine the respective herbicide concentration. The 20-ml vials were frozen immediately after collection at −10 C until analysis. The site of the experiment was 0.46 km from the freezers where samples were stored until analysis.
Preparation of Mulch Samples
Methods for herbicide extraction from plastic mulch were adapted from previous literature (Grey et al. 2009, 2018; Hand et al. 2021; Shaner 2014). Sample integrity was maintained throughout sample collection, preparation, and analysis (Mueller and Senseman 2015). Plastic mulch samples were removed from the freezer and allowed to equilibrate to room temperature before processing. Samples were placed into individual 125-ml volumetric flasks containing 100 ml of a methanol:water (Fisher Scientific) solution, with ratios of 50:50 v/v for halosulfuron-methyl, 90:10 v/v for acetochlor and S-metolachlor, and 20:80 v/v for glyphosate and glufosinate. Flasks were capped with a rubber stopper and then placed on a reciprocating shaker for 2 h at 200 rpm. Once the reciprocating shaker had completed the 2h at 200 rpm, an aliquot from each sample was transferred into high-performance liquid chromatography (HPLC) vials (Fisher Scientific) for analysis.
Preparation of Water Samples
Individual water samples in the 20-ml vials were removed from the freezer and allowed to acclimate to room temperature before analysis. Because soil was not a factor in these experiments, samples did not warrant further cleanup or filtering. An aliquot (1.0 ml) was then transferred into an HPLC vial.
Analytical Methods
Herbicide concentration was analyzed by a Waters Acquity Arc ultra–high performance liquid chromatography (UHPLC) system coupled with a Waters 2998 PDA and Waters QDa mass spectrometry (MS) detector (Waters Corporation, Milford, MA). The LC separation was performed on a Cortecs® C18 reverse-phase column (4.6 mm by 50 mm, 2.7 µm; Waters Corporation) for halosulfuron-methyl, an Anionic Polar Pesticide column (2.1 mm by 100 mm, 5 µm; Waters Corporation) for glyphosate and glufosinate, and a Symmetry C18 reverse-phase column (4.6 mm by 75 mm, 3.5 µm; Waters Corporation) for acetochlor and S-metolachlor. Each analysis was duplicated. The various herbicide amounts were quantified by correlating the peak area detected with those of analytical-grade standard solutions of various known concentrations. The limit of detection across herbicides was approximately 1.0 to 3.0 (± 2.0) µmol L−1. Selectivity was tested using blank samples, and no interfering peaks were detected.
For halosulfuron-methyl, the mobile phase was water plus 0.1% formic acid (A) and acetonitrile plus 0.1% formic acid (B). Formic acid was used to maintain ion strength (Nunez and Lucci Reference Nyoike and Liburd2014). The mobile phase followed a gradient, starting at 70% A, at 0.8 min was 10% A and held for 1.2 min, then increased to 70% A at 2.3 min and held for 1.0 min. Flow rate was maintained at 1.0 ml min−1 for 3.2 min, with an injection volume of 8.0 µl. The MS was run in ESI positive (+) mode using multiple reaction monitoring (MRM) from 50 to 600 Da and single ion recording (SIR) at 435 Da. The column was sustained at ambient temperature.
For glyphosate and glufosinate, the mobile phase was water plus 0.9% formic acid (A) and acetonitrile plus 0.9% formic acid (B). The mobile phase gradient started at 10% A, ramped up to 60% at 2.0 min, and increased to 90% A at 4.0 min. The flow rate was maintained at 0.75 ml min−1 for 3.5 min, with an injection volume of 7.5 µl. The column was sustained at 40 C. The MS was run in ESI negative (−) mode using MRM from 50 to 600 Da and SIR at 168 and 180 Da for glyphosate and glufosinate, respectively.
For acetochlor and S-metolachlor, the mobile phase was water plus 0.1% formic acid (A) and acetonitrile plus 0.1% formic acid (B). The mobile phase followed a gradient, starting at 90% A, decreasing to 10% at 2.1 min and held for 3.0 min, increasing to 90% A at 5.1 min and held for 2.0 min. The flow rate was maintained at 1.37 ml min−1 for 7.0 min, with an injection volume of 200 µl. The column was sustained at 25 C. The MS was run in ESI positive (+) mode using MRM from 50 to 600 Da and SIR at 270 and 284 Da for acetochlor and S-metolachlor, respectively.
Statistical Analysis
Data for herbicide concentration on the plastic mulch, herbicide concentration in the transplant hole, and the volume of water in the transplant hole were subjected to ANOVA using PROC MIXED in SAS v. 9.4 (SAS Institute, Cary, NC). For herbicide concentration and volume of water, there were no differences between jars on the same bed (subsamples), so data were combined (P = 0.32 and P = 0.25, respectively). There were interactions between herbicide and irrigation amount (P = 0.015); therefore, data for these variables were analyzed separately. With respect to the herbicides on the TIF, data from these samples were further analyzed for interactions between sample timings and irrigation volume. All data were then graphed using SigmaPlot v. 14.0 (Systat Software, San Jose, CA).
Results and Discussion
Plastic Wash-Off
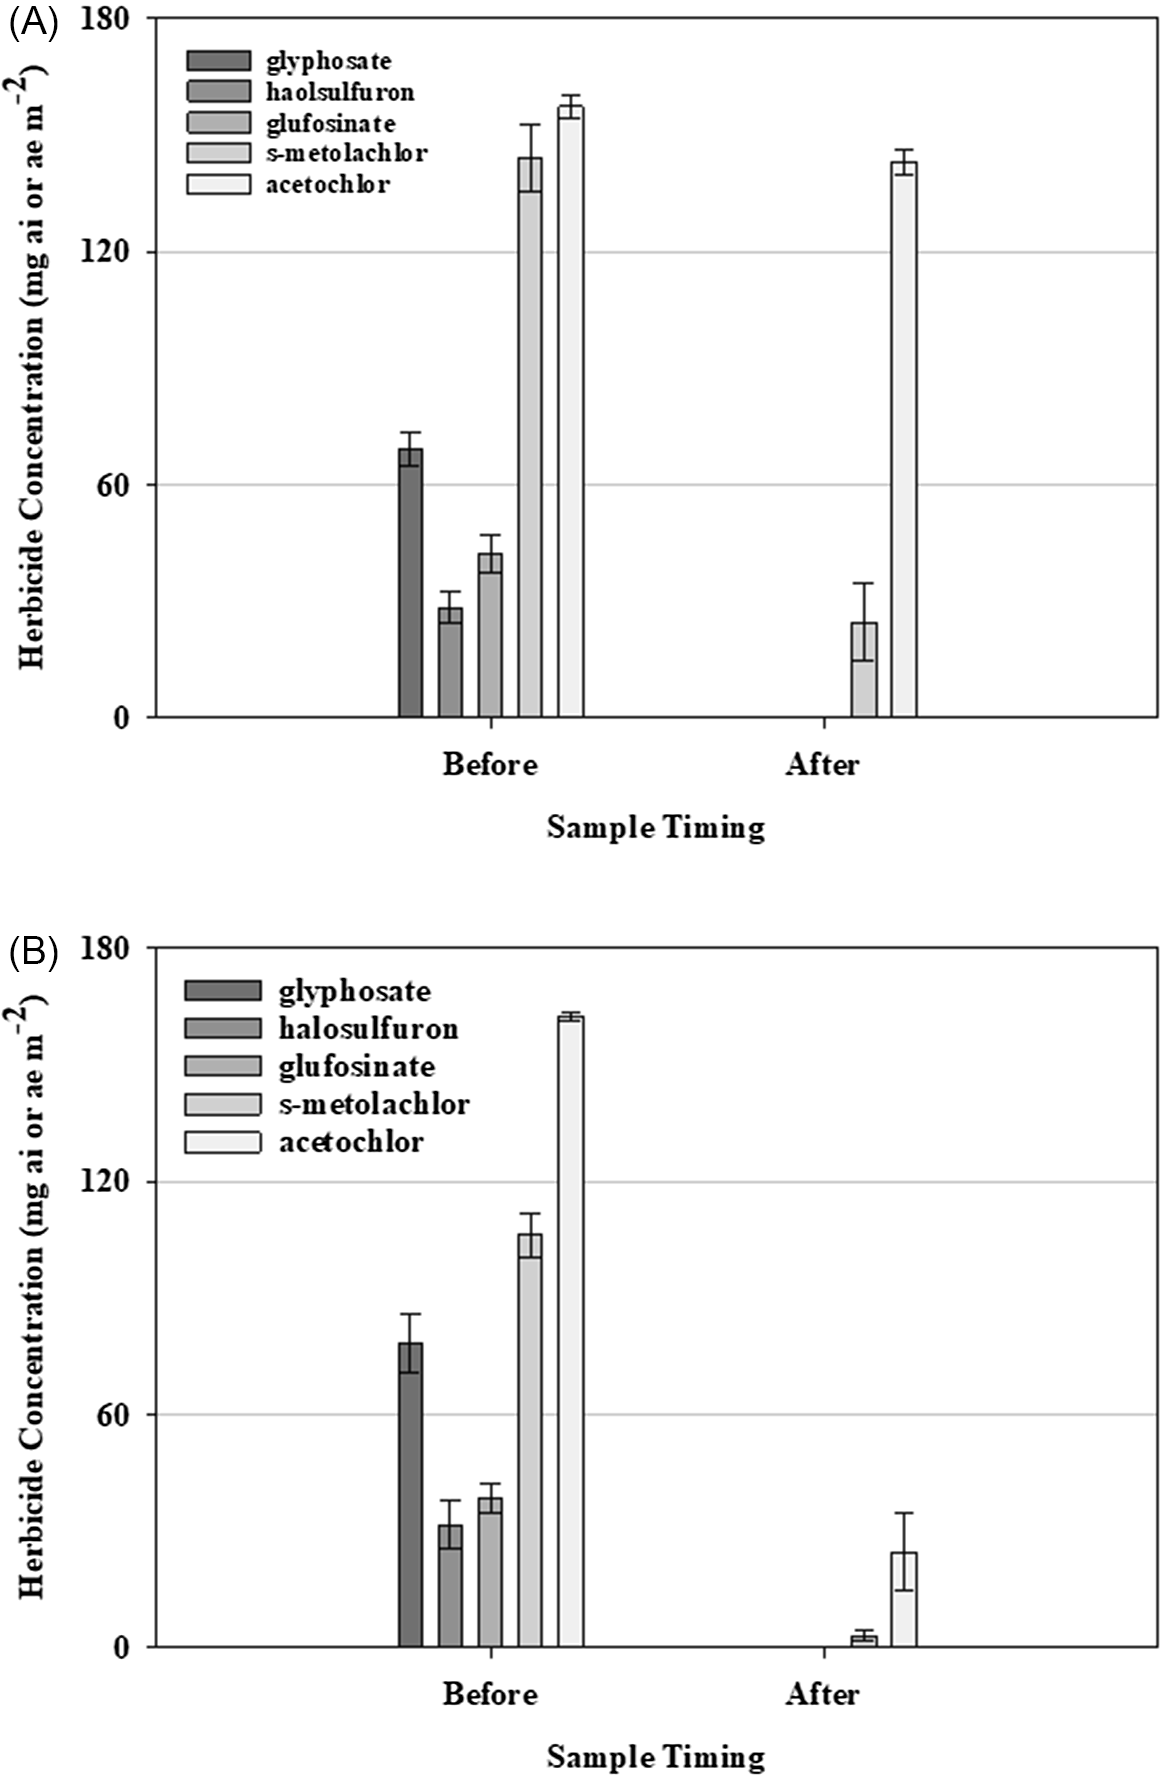
The ANOVA indicated interactions between herbicide and irrigation volume (0.63 and 1.27 cm) on the plastic mulch (% and mg ai/ae) (P = 0.01) and that irrigation volume did not influence the concentration of halosulfuron (P = 0.99), glufosinate (P = 0.35), and glyphosate (P = 0.85) removed from the mulch (Table 3; Figure 3).
Herbicide concentration (mg ai/ae m−2 and %) on plastic mulch as affected by sample timing a .
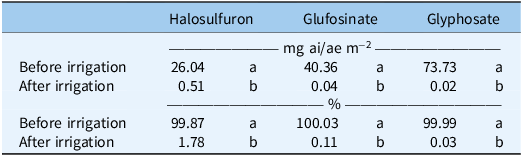
a Concentrations represents the mean of two irrigation volumes (0.63 and 1.27 cm) with the experiments conducted twice and combined. Values for each herbicide within the same column followed by the same letter are not significantly different at P < 0.05. Values (as %) were based on the average amount (mg ai m−2) on the plastic mulch before irrigation for each herbicide at each irrigation volume.
The concentration (mg ai/ae) of halosulfuron-methyl, glufosinate, glyphosate, acetochlor, and S-metolachlor detected on the plastic surface as affected by sample timing (before or after irrigation was applied) and irrigation volume: (A) 0.63 cm; (B) 1.27 cm. Bars represent the respective herbicide concentration remaining on the plastic surface (mg ai/ae m−2), averaged over three replications and combined over two runs. Error bars represent the standard errors of the means (P < 0.05).
Previous research has shown that glyphosate can be removed from the surface of plastic mulch with at least 1 cm of water (Grey et al. 2009). Grey et al. (2018) determined that after this volume of irrigation, the concentration of glyphosate remaining on the surface of plastic mulch was 2.66 mg ae m−2, which is greater than our determined concentration of glyphosate remaining on the plastic mulch (0.02 mg ae m−2) after irrigation. Hand et al. (2021) detected glyphosate at 1/1000th of a typical field rate applied over mulch after 3.5 cm of irrigation was applied. Similarly, Culpepper et al. (Reference Culpepper, Grey and Webster2009) reported that tomato (Solanum lycopersicum L.) and squash (Cucurbita pepo L.) could safely be planted into plastic mulch beds treated with glyphosate after at least 1 cm of irrigation was applied.
The relationship between glufosinate and plastic mulch is less understood than that of glyphosate and plastic mulch; however, previous research suggests that herbicides can be removed from mulch with irrigation. Smith et al. (2017) noted that applying glufosinate over the top of mulch at 670 g ai ha−1 and 1,340 g ai ha−1 and transplanting bell pepper, tomato, watermelon [Citrullus lanatus (Thunb.) Matsum. & Nakai], squash, and cucumber (Cucumis sativus L.) without applying irrigation resulted in injury ranging from 5% to 75%, respectively, while the addition of an 0.83-cm irrigation event after application but before planting eliminated crop injury.
Grey et al. (2009) determined that after 1 cm of irrigation, the concentration of halosulfuron remaining on the surface of plastic mulch was 1.7 mg ai m−2 (17 g ai ha−1). Randell et al. (2020) noted injury and yield reductions from halosulfuron applied over mulch 1 to 21 d before transplanting various vegetable crops. Additionally, the authors determined that halosulfuron can remain active while binding to the mulch surface and slowly release when rainfall or irrigation is applied. The amount of halosulfuron required to reduce the growth of squash varieties commonly grown in Georgia ranges from 8.2 to 45.0 g ai ha−1 (equivalent to 0.82 to 4.5 mg ai m−2). While the concentration of halosulfuron on the mulch before irrigation was enough to cause injury to squash, the concentration was detected to be well below this range (0.04 mg ai m−2) once irrigation was applied (Table 3). The behavior of halosulfuron on mulch, as determined from this experiment, is not supported by the aforementioned previous literature. A major difference in experimental design between studies includes the length of time between herbicide application and irrigation event (Grey et al. 2018; Randell et al. 2020). While halosulfuron was allowed to completely dry on the mulch, further research is warranted to explore the impact of this drying time on the removal of halosulfuron from the surface of plastic mulch.
Acetochlor and S-metolachlor were more difficult to remove from the mulch. The volume of irrigation did influence herbicide concentration remaining on the mulch (P = 0.04 and P < 0.001, respectively) (Table 4). Acetochlor had the highest concentration remaining on the plastic when compared with the other herbicides, with 90.89% (143.10 mg ai m−2) and 15.16% (24.66 mg ai m−2) after 0.63-cm and 1.27-cm irrigations, respectively. For acetochlor, the concentration detected on the plastic mulch after 0.63 cm of irrigation was not different from the concentration detected on the plastic mulch before irrigation was applied (Table 4). The quantity of S-metolachlor remaining on the mulch after 0.63 cm and 1.27 cm of irrigation was 17.09% (24.66 mg ai m−2) and 2.84% (3.03 mg ai m−2), respectively. While there is no information in previous literature on the movement of the chloroacetamide herbicides from the surface of plastic mulch, injury to various crops and behavior in soil when applied directly to soil has been studied (Ferebee et al. Reference Ferebee, Cahoon, Besancon, Flessner, Langston, Hines, Blake and Askew2019; Grey and Vencill 2011; Mueller et al. 1999; Song et al. 2006).
Concentration (mg ai m−2 or %) of acetochlor and S-metolachlor on plastic mulch as affected by irrigation volume and sample timing a .
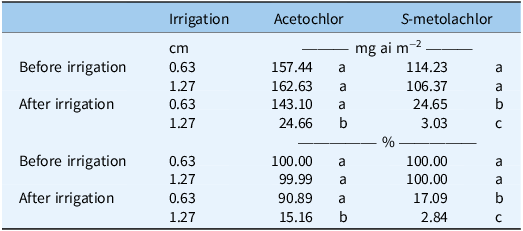
a Sample timings are before or after irrigation was applied to the simulated vegetable beds. Irrigation volumes were 0.63 and 1.27 cm. Concentrations represent the mean of two irrigation volumes, with the experiment conducted twice and combined. Values (as %) were based on the average amount (mg ai m−2) on the plastic mulch before irrigation for each herbicide at each irrigation volume. Values for each herbicide within the same column followed by the same letter are not significantly different at P < 0.05.
The movement of the herbicides from the surface of the plastic mulch was directly related to water solubility (Table 1). Glyphosate and glufosinate removal from the surface of the mulch was as expected, given that both herbicides are very water soluble and experience negligible photodegradation losses (Culpepper Reference Culpepper2020; Culpepper et al. Reference Culpepper, Grey and Webster2009; Grey and Vencill 2011; Isaac et al. 2006). The concentration of halosulfuron removed from the surface of plastic mulch was less than that of glyphosate and glufosinate but greater than that of the chloroacetamide herbicides. Halosulfuron is less water soluble than contact herbicides, with a water solubility of 1,650 mg L−1 (Shaner 2014). S-metolachlor removal was greater compared with acetochlor but less than removal of the aforementioned herbicides. Acetochlor has the lowest water solubility (223 mg L−1) and subsequently has the lowest concentration removed from the surface of the plastic mulch (Wolejko et al. 2017). Previous research has demonstrated that damage could occur to subsequent crops from contact with herbicide residue left on plastic mulch (Culpepper et al. Reference Culpepper, Grey and Webster2009; Gilreath et al. 2006).
Wash-Off into Transplant Hole
The average volume of water that ran into each individual jar, or transplant hole, was equivalent to 62 (± 2.03 ml) and 134 ml (± 6.81 ml) for the 0.63-cm and 1.27-cm irrigation treatments, respectively. There was uniformity of irrigation and even distribution of water across replications and experimental runs. The ANOVA indicated interactions between herbicide and irrigation volume (0.63 cm and 1.27 cm) for total concentration in the transplant hole (P = 0.03). All herbicides were detected below 1.0 mg ai/ae in the transplant hole, despite irrigation volume (Table 5; Figure 4).
Herbicide concentration in the transplant hole as affected by irrigation volume a .

a Concentrations represent the mean of 14 jars per bed and three replications per treatment, with the experiment conducted twice and combined. Concentrations were individually adjusted for the volume of water (ml) caught in the jar before statistical analysis. Values for each herbicide within the same column followed by the same letter are not significantly different at P < 0.05. Concentrations as g ai/ae ha−1 are on a surface basis; assumptions: hole surface area = 25 cm2.
b Field rate (g ai/ae ha−1) is based on 1× of: halosulfuron, 53; glufosinate, 656; glyphosate, 867; acetochlor, 1,051; S-metolachlor, 799.
The concentration (mg ai/ae) of halosulfuron-methyl, glufosinate, glyphosate, acetochlor, and S-metolachlor detected in the transplant hole (25 cm2) and water (ml) caught in the transplant hole at each irrigation volume: (A) 0.63 cm; (B) 1.27 cm. Concentration is based on the volume of water (L) recorded in each respective jar. Round data points represent the average volume of water (ml) caught in the hole. Both the bars and round data points represent the mean of 14 jars per replication over three replications. The experiment was conducted twice and combined. Error bars represent the standard errors of the means (P < 0.05).

While 1.0 mg ai/ae in the transplant hole seems low, correlating these values to grams per hectare (g ai/ae ha−1) highlighted how herbicide movement into the transplant hole can cause concentrations greater than the applied field rate. Table 5 presents the total mass of herbicide washed into the transplant hole compared with the field rate applied (as described in Table 1).
After 0.63-cm and 1.27-cm irrigation volumes were applied, halosulfuron was detected at 8.9× and 5.3× field rates (Culpepper Reference Culpepper2020). The concentrated mass of halosulfuron that washed into the transplant hole supports the earlier notion that halosulfuron was not given adequate time to dry and subsequently adsorb onto the surface of the mulch, allowing it to move with a single irrigation event into the transplant hole. The amount of glyphosate that washed into the transplant hole after 0.63-cm and 1.27-cm irrigations was equivalent to 3.3× and 1.9× field rates. Glufosinate was the only herbicide for which the total amount of herbicide in the transplant hole was not different between the 0.63-cm and 1.27-cm irrigation volumes (Table 5). Concentrations of glufosinate in the transplant hole were equivalent to a 1.3× field rate or approximately 844 g ai ha−1. The mass of S-metolachlor in the transplant hole ranged from 0.10 to 0.17 mg ai, which is equivalent to a 0.39× to 0.66× field rate. Acetochlor had the lowest concentration despite irrigation volume, with 0.01 to 0.03 mg ai or a 0.03× to 0.09× field rate washing into each transplant hole. The low mass of acetochlor washing into the transplant hole is promising; however, further research is needed to determine its potential for use in vegetable production.
Figure 4 represents the average herbicide concentration in the transplant hole after 0.63-cm (Figure 4A) and 1.27-cm (Figure 4B) irrigations were applied, along with the average volume of water caught per jar for each respective herbicide. In Figure 4, the volume of water caught per jar is similar (within the same irrigation volume), while herbicide concentrations vary. This could be attributed to each herbicide’s ability to move from the plastic mulch surface with the irrigation water, as the more water-soluble herbicides were detected in greater amounts (Tables 1 and 5; Figure 4).
Overall Herbicide Movement
To quantitate herbicide concentration moving from a treated plastic mulch into vegetable transplant holes when rainfall or irrigation occurs, simulated vegetable beds were designed and constructed. The simulated vegetable bed design adds a level of mobility and controllability that could not be achieved in field experiments and allows for rapid testing of numerous herbicides.
Halosulfuron, glufosinate, and glyphosate were detected below 2% on the surface of the plastic mulch after irrigation volumes of 0.63 cm or 1.27 cm were implemented. Irrigation was less effective in removing the chloroacetamide herbicides from the surface of the plastic mulch. Acetochlor was the most stable, with 91% and 15% of the herbicide remaining on the mulch after 0.63-cm and 1.27-cm irrigations were applied, respectively. For S-metolachlor, 17% and 3% remained on the mulch at the aforementioned irrigation volumes, respectively.
All herbicides were detected below 1.0 mg ai/ae in the transplant hole despite irrigation volume. Correlating the total amount of herbicide that washed into the transplant hole (mg ai/ae) with the field rate applied highlighted how herbicide movement into the transplant hole can cause concentrations to be greater than the applied field rate. Ranking the herbicides based on the amount of herbicide in the transplant hole across irrigation volume, as well as water solubility, gives glyphosate > glufosinate > halosulfuron and S-metolachlor > acetochlor. However, ranking the herbicides based on the field rate detected in the transplant hole gives halosulfuron > glyphosate > glufosinate > S-metolachlor > acetochlor. Further research is needed to replicate these results in the field and determine the implications of injury from the determined field rates detected in the transplant hole.
Acknowledgments
The authors would like to thank Sidney Cromer, Samantha Bowen, Nicholas Hurdle, and Juliana de Souza Rodrigues for their technical support.
Funding statement
This research received no specific grant from any funding agency or the commercial or not-for-profit sectors.
Competing interests
The authors declare no conflicts of interest.


 Open access

