

1 Introduction
The study of shock dynamics and shock collision in laser-generated plasmas has recently received much attention in the scientific literature. Collisionless shocks in plasmas, are important in many astrophysical events and, with the recent advances in ultrahigh-intensity lasers, can be investigated in laboratory environments. In particular, they are important as origin of particle acceleration in the astrophysical context and they are also relevant to the study of laser-driven particle sources in the context of inertial confinement fusion[ Reference Henis, Eliezer and Raicher 1 – Reference Goswami, Chandra, Sarkar, Chaudhuri and Ghosh 3 ]. Collisional shocks are also very important because they allow producing extreme states of matter[ Reference Batani 4 ] with pressures of the order of tens megabars or more. This subject is of interest for many branches of science including astrophysics and planetology (for the development of realistic models of planets and stars)[ Reference Chen, Na, Curry, Liang, French, Descamps, DePonte, Koralek, Kim, Lebovitz, Nakatsutsumi, Ofori-Okai, Redmer, Roedel, Schrner, Skruszewicz, Sperling, Toleikis, Mo and Glenzer 5 , Reference Koenig, Vinci, Benuzzi-Mounaix, Ozaki, Ravasio, Boireau, Michaut, Bouquet, Atzeni, Schiavi, Peyrusse, Batani, Drake and Reighard 6 ], and inertial confinement fusion[ Reference Wang, Zhang, Jiang, Duan, Zhang, Li, Yang, Liu, Li, Sun, Liu and Wang 7 ], including advanced ignition schemes such as fast ignition[ Reference Norreys, Batani, Baton, Beg, Kodama, Nilson, Patel, Perez, Santos, Scott, Tikhonchuk, Wei and Zhang 8 ] and shock ignition[ Reference Batani, Baton, Casner, Depierreux, Hohenberger, Klimo, Koenig, Labaune, Ribeyre, Rousseaux, Schurtz, Theobald and Tikhonchuk 9 , Reference Shang, Betti, Hu, Woo, Hao, Ren, Christopherson, Bose and Theobald 10 ]. The study of collisional shocks is even important for partial applications such as micromachining[ Reference Zhai, Wang, Mei, Wang and Yang 11 ] or elemental analysis[ Reference Zakuskin, Popov, Zorov and Labutin 12 ].
A particular aspect of shock dynamics is the collision between shocks, which can bring to the formation of new shocks at higher pressures. The study of shock collisions is again relevant for astrophysics[ Reference Terasaki, Sakaiya, Shigemori, Akimoto, Kato, Hironaka and Kondo 13 ], including the study of radiative shocks[ Reference Suzuki-Vidal, Clayson, Stehlé, Swadling, Foster, Skidmore, Graham, Burdiak, Lebedev, Chaulagain, Singh, Gumbrell, Patankar, Spindloe, Larour, Kozlova, Rodriguez, Gil, Espinosa, Velarde and Danson 14 , Reference Singh, Stehle, Suzuki-Vida, Kozlova, Larour, Chaulagain, Clayson, Rodriguez, Gil, Nejdl, Krus, Dostal, Dudzak, Barroso, Acef, Cotelo and Velarde 15 ], for getting off-Hugoniot states of matter at extreme pressures[ Reference Jakubowska, Mancelli, Benocci, Trela, Errea, Martynenko, Neumayer, Rosmej, Borm, Molineri, Verona, Cannatà, Aliverdiev, Roman and Batani 16 , Reference Aliverdiev, Batani, Antonelli, Jakubowska, Dezulian, Amirova, Gajiev, Khan and Pant 17 ], and for inertial confinement fusion. The shock ignition approach[ Reference Cristoforetti, Antonelli, Mancelli, Atzeni, Baffigi, Barbato, Batani, Boutoux, D’Amato, Dostal, Dudzak, Filippov, Gu, Juha, Klimo, Krus, Malko, Martynenko, Nicolai, Ospina, Pikuz, Renner, Santos, Tikhonchuk, Trela, Viciani, Volpe, Weber and Gizzi 18 , Reference Batani, Antonelli, Barbato, Boutoux, Colaïtis, Feugeas, Folpini, Mancelli, Nicolai, Santos, Trela, Tikhonchuk, Badziak, Chodukowski, Jakubowska, Kalinowska, Pisarczyk, Rosinski, Sawicka, Baffigi, Cristoforetti, D’Amato, Koester, Gizzi, Viciani, Atzeni, Schiavi, Skoric, Gus’kov, Honrubia, Limpouch, Klimo, Skala, Gu, Krousky, Renner, Smid, Weber, Dudzak, Krus and Ullschmied 19 ] is largely based on the pressure amplification following the collision of an igniting shock, with the shock formed by the compression beams reflected at the target center.
In this context, we have realized an experiment to investigate the compression dynamics induced by double shocks created by two separate laser spots focused on simple aluminum foils or on layered foam/aluminum targets. The two spots were realized by splitting the laser beam in two equal parts using a prism. In this way we have identified several effects in foam layered targets as compared with simple Al foils: (i) the shock breakout was delayed with respect to Al foils, (ii) the pressure distribution had a different spatial profile, and (iii) we obtained experimental evidence of collision between shocks producing a strong increase in pressure.
In our experiment we also wanted to test the behavior of different kinds of foams with respect to the interaction with the laser beam and to shock dynamics. For this reason, we tested three different kinds of foams. The material was TMPTA (trimethylolpropane triacrylate) with gross chemical formula C15H20O6 and molar mass 296.319 g·mol−1. The first foam used in the experiment had a density of 50 mg/cm3; the second 5 mg/cm3; and the third was doped with Au nanoclusters.
Calculating the total electron density for foam density 50 mg/cm3 gives 1.6 × 1022 cm−3, whereas for 5 mg/cm3 we obtain an electron density of 1.6 × 1021 cm−3. The critical density for the 0.44 μm wavelength used in our experiment is 5.6 × 1021 cm−3. Therefore, we see that the 50 mg/cm3 foam is overcritical and in this case the laser beam will deposit its energy at the critical surface of the plasma. Instead, the 5 mg/cm3 foam is undercritical to the laser wavelength even assuming full ionization. In this case, the laser beam is expected to be able to penetrate deeply in the material. The third type of foam has a total mass density also of 50 mg/cm3, but it is doped with Au nanoclusters. Hence, owing to the presence of gold, we expect a much larger impact of radiative phenomena.
2 Experimental setup and simulation code
The experiment was realized using the PALS (Prague Asterix Laser System) iodine laser[ Reference Jungwirth, Cejnarova, Juha, Kralikova, Krasa, Krousky, Krupickova, Laska, Masek, Mocek, Pfeifer, Präg, Renner, Rohlena, Rus, Skala, Straka and Ullschmied 20 ]. The scheme of the experimental setup is presented in Figure 1.
Scheme of the experimental setup.

The laser had wavelength 0.44 μm (the third harmonic of iodine laser) and was Gaussian in time with a full width at half maximum (FWHM) of about 300 ps. A blue filter before the vacuum interaction chamber cut out ω and 2ω light. The energy on target used in our experiment ranged between 50 and 120 J. No phase plate was used in order to obtain smaller focal spots and higher intensities. By splitting the laser beam in two equal parts with a prism (glass wedge), we could obtain two focal spots with a diameter of about 70 μm (FWHM) separated by about 200 μm, thus producing two different interaction points from which two laser-driven shocks originated.
As diagnostics, we relied on the time-resolved self-emission from the rear side of the target for the detection of the shock breakout (this is an SOP, ‘streaked optical pyrometry’, but in our case we did not perform an absolute calibration in order to try to recover rear side matter temperature and we used it as a shock chronometry diagnostics). A photographic objective was employed to image the target rear side onto a streak camera Hamamatsu C7700 with S-1 photocathode. A red RG60 filter before the streak camera cut out any 3ω light. The streak camera was coupled to a 512 × 512 pixel 8-bit CCD. A time fiducial was obtained by sending a small fraction of the incoming laser beam to the streak camera slit with an optical fiber. This was used to control the time of arrival of the laser beam on the target front side.
The target front side was monitored by an X-ray streak camera (XRSC – ‘Kentech Low Magnification X-ray streak camera’, by Kentech Instruments Ltd.) equipped with a pin-hole for imaging and coupled to a 1024 × 1024 pixel 8-bit CCD. This was positioned exactly above the vertical of the target.
The targets used in the experiment were either simple Al foils (10 μm thick) or double-layer targets made of foam (50 μm thick, on the laser side) and Al (10 μm thick, on rear side). We used foams with density of 5 g/cm3 and 50 g/cm3. Finally, we also used 50 mg/cm3 foams doped with Au nanoparticles 10% in weight.
The simulations of laser shock compression were realized using the 1D and 2D radiative hydrocode MULTI[ Reference Ramis, Meyer-ter-Vehn and Ramírez 21 ] with multi-group radiation transport coupled with Lagrangian hydrodynamics based on a fully implicit numerical scheme. We assumed LTE conditions. Equations of state were taken from SESAME[ Reference Lyon and Johnson 22 ] or calculated by MPQEOS[ Reference Kemp and Meyer-ter-Vehn 23 ]. The opacities were derived from Refs. [Reference Murakami, Meyer-ter-Vehn and Ramis24,Reference Rickert, Eidmann, Meyer-ter-Vehn, Serduke and Iglesias25] or from a model implemented in the code SNOP[ Reference Eidmann 26 – Reference Eidmann, Schwanda, Foeldes, Sigel and Tsakiris 28 ]. The foam was simulated as a uniform material at reduced density. This is a quite crude modellization of the foam and clearly this approximation will hold only once the material has had the time to ionize and expand to produce a uniform plasma. This clearly depends on the velocity of the ionization waves, as described for instance in Refs. [Reference Nicolaï, Olazabal-Loumé, Fujioka, Sunahara, Borisenko, Gus'kov, Orekov, Grech, Riazuelo, Labaune, Velechowski and Tikhonchuk29,Reference Gus’kov, Limpouch, Nicolaï and Tikhonchuk30]. Typically, a time of the order of a few to 10 ps is needed to ionize the foam and obtain uniform plasma. Recent experimental results and theories also suggest that the velocity of the shock wave in the foam material may be different from that of an equivalent uniform material[ Reference Cipriani, Yu. Gus’kov, De Angelis, Consoli, Rupasov, Andreoli, Cristofari and Di Giorgio 31 , Reference Cipriani, Gus’kov, Consoli, De Angelis, Rupasov, Andreoli, Cristofari, Di Giorgio and Salvadori 32 ]. On the other side, the results of several experiments on shock propagation in foams have been analyzed successfully[ Reference Temporal, Atzeni, Batani and Koenig 33 , Reference Batani, Balducci, Nazarov, Löwer, Koenig, Faral, Benuzzi and Temporal 34 ] using the usual scaling laws for shock velocity used for uniform materials. In conclusion, the question of modellization of foams in hydrodynamics simulations is complex and still not completely cleared. While this could indeed have some quantitative consequences on the results of our numerical simulations, the main physical discussion remains qualitatively valid.
3 Experimental results
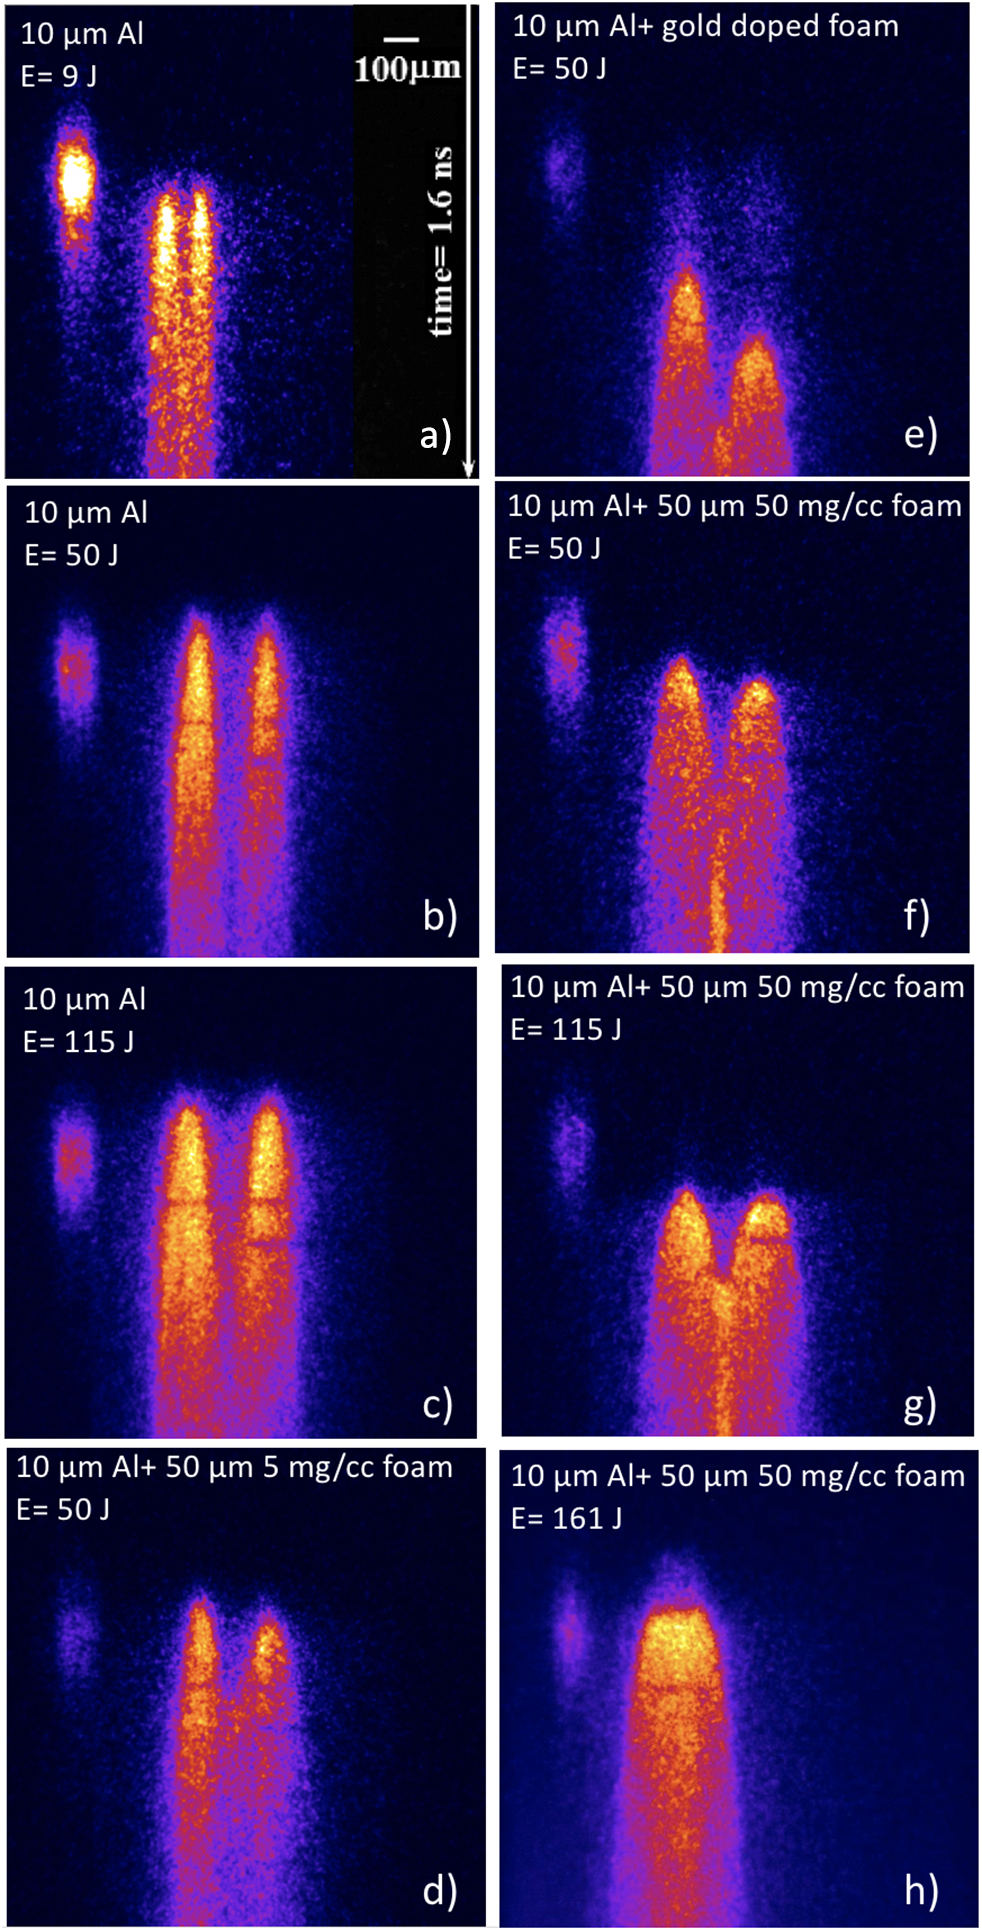
Time-resolved images of rear-side self-emission obtained with the streak camera are shown in Figure 2. The time window is 1600 ps (vertical) and the imaged region is 1330 μm wide (horizontal). These correspond to 3.12 ps/pixel and 2.6 μm/pixel, respectively. Time flows from top to bottom. The signal on the upper left side of the image is the time fiducial indicating the arrival of the laser pulse on the front side of the target. In each streak-image (Figure 2) we observe two separated breakouts originating from the two focal spots. We also observe that the size of the shock breakout region for the foam–Al targets is larger than for the pure Al targets, and the shock breakout is delayed.
Examples of time-resolved images of target rear-side self-emission obtained with the streak camera: (a) shot 30165, E ∼ 9 J, simple Al target; (b) shot 30142, E ∼ 50 J, simple Al target; (c) shot 30141, E ∼ 115 J, simple Al target; (d) shot 30150, E ∼ 50 J, Al + foam 5 g/cm3; (e) shot 30151, E ∼ 50 J, Al + foam 50 mg/cm3 with embedded Au nanoparticles; (f) shot 30147, E ∼ 50 J, Al + foam 50 mg/cm3; (g) shot 30148, E ∼ 115 J, Al + foam 50 mg/cm3; (h) shot 30167, E ∼ 161 J, Al + foam 50 mg/cm3. For the case of (a) and (h), the separation between the two spots was 100 μm instead of the nominal 200 μm.
In order to obtain the absolute delay between the fiducial signal and the arrival of the laser on target front surface, we performed some calibration shots without targets (see Figure 3), in which the main beam arrived directly at the streak camera after being attenuated by appropriate optical densities to avoid damage to optics and the streak. Such filters had total thickness of about 10.8 cm, which for a glass refraction index of 1.5 implied a delay of 180 ps. This implies that the main laser arrives at target front side 180 ps before the fiducial signal (here, for convenience, we assume the maximum of fiducial and of the main pulse as references). In order to improve the precision, we interpolated the fiducial signals with a Gaussian profile so as to obtain the ‘true’ position of the maximum of the fiducial.
Streak images for the shots for fiduciary calibration: shot 30138 (left) and 30139 (right).

Typical laser shots performed during experiment are summarized in Table 1. This gives the difference between the arrival of the laser on target front and the shock breakout time. Here we used as references the (interpolated) maximum of the fiducial and the half-rise time of the shock breakout signal. In addition, in these shots, we used some filters to reduce the energy of the main beam of target (their thickness is also reported in Table 1). Since they delay the arrival of the main pulse on target front side, their presence was also taken into account in the calculation of shock breakout times. The delay was finally corrected for 180 ps related to fiducial. In order to be coherent with the hydrodynamics simulations (shown later), here we assume that the time zero corresponds to an FWHM of the laser pulse (300 ps) before the maximum of the laser intensity. Please note that for shot 30141, the shock breakout takes place before the maximum intensity arrives at target on the front side.
Summary of shot conditions and experimental results. The values of intensity are the average values calculated over the focal spot size (70 μm) and the laser pulse duration (300 ps) taking into account approximately $40\%$
losses due to the use of various filters and the split into two different spots. The time Δt corresponds to the difference between shock breakout at target rear side and the arrival of laser beam on target front. The shock breakout time is measured at half of rise for the left and the right spots. We also report the time at which the luminosity in the central region begins to rise. Time zero is taken 300 ps (FWHM of the laser pulse) before the arrival of the maximum of the laser on target front side, in agreement with that used in hydro-simulations.
$40\%$
losses due to the use of various filters and the split into two different spots. The time Δt corresponds to the difference between shock breakout at target rear side and the arrival of laser beam on target front. The shock breakout time is measured at half of rise for the left and the right spots. We also report the time at which the luminosity in the central region begins to rise. Time zero is taken 300 ps (FWHM of the laser pulse) before the arrival of the maximum of the laser on target front side, in agreement with that used in hydro-simulations.

In Table 1, we report the shock breakout time measured for the left and for the right spot for a few selected shots. The time at which the luminosity in the central region begins to rise is also presented in the table for the shots where it is clear.
From Table 1 and Figure 2, we see that the shock breakout time is different for the left and the right spot, something which is particularly clear for foam-layered targets. Indeed, a small difference, of the order of 30–40 ps, in the arrival of the laser beam on left and right is already visible in the calibration shots of Figure 3, as due to the fact that half of the laser beam travels through the thick glass wedge. This effect is amplified by the fact that in foam layered targets, the breakout time is longer due to the bigger thickness, and it is quite large in the case of foam containing Au nanoparticles (see Figure 2(e)). Possibly, the large asymmetry with gold-doped foams is also due to a defect of production (i.e., a different concentration of gold nanoparticle in the two sides). Possibly a small energy unbalance between the two spots could also be present (in part due to the presence of the wedge); however, we do not expect that this can effectively play any role in the observed time difference between the left and the right spots since the dependence of shock velocity on deposited energy is very weak. Indeed, classically shock pressure scales as intensity to the 2/3 and shock velocity scales as the square root of pressure so the observed differences could be justified only by a very large difference in energy.
In Figure 2(e), we also note a significant preheating caused by the presence of gold doping (high-Z material). Such preheating is expected to be synchronous with the arrival of the laser pulse on target, and indeed it starts exactly at the same time for both left and right spots. These results are interesting since they show that, with high-Z doped foams, the shock is much delayed as compared with the case of pure foams with the same total density, and there is strong preheating.
We also can see that the shock breakout region in the case of foam–Al targets is larger than in pure-Al targets. In order to evaluate such effect quantitatively, we have considered the images in Figure 2(b) (simple Al, 50 J) and in Figure 2(f) (foam/Al, 50 J) and we have measured the size D of the emitting region at approximately 300 ps after shock breakout. For simple Al targets we find D ∼ 85 μm which is compatible with the size of the focal spot, whereas for foam/Al targets we find D ∼ 150 μm. This is obviously related to the different total thickness of used targets. Indeed, in the case of pure Al, the thickness (10 μm) is much less than the focal spot size (70 μm), so there are practically no 2D effects in shock propagation. Instead in the case of foam-layered targets the total thickness (60 μm) is comparable to the spot size and we do expect 2D effects to have an impact on shock dynamics.
Finally, Figure 4 shows some X-ray streak images obtained on target front side. The X-ray streak camera, coupled to a pin-hole for space resolution, was looking at the target front side almost at 90° with respect to the arrival of the laser beam, so as to look at plasma expansion in vacuum (unfortunately, such images are not available for all shots).
X-ray streak-camera images on target front side. Time goes from left to right with time window 2 ns.

4 Analysis of results: dynamics of single shocks
In this section, we focus on the dynamics of single shocks generated by each focal spot separately.
Figure 5 shows the shock breakout time versus laser energy in simple Al targets and in targets with a 50 mg/cm3 foam layer. Figure 6 shows instead the shock breakout time as a function of target structure at a fixed laser energy of approximately 50 J.
Shock breakout time versus laser energy for simple Al 10-μm targets and for foam-layered Al targets (foam density 50 mg/cm3).

Shock breakout time versus target structure for laser energy of 50 J.

As we already noted before, the result in Figure 5 shows that the shock breakout region for the foam-Al targets is delayed with respect to pure Al targets.
The dependences of shock characteristics on the foam thickness and pulse energy are well described by a simple hydrodynamic model of shock reverberation from the foam–Al interface[ Reference Temporal, Atzeni, Batani and Koenig 33 , Reference Batani, Balducci, Nazarov, Löwer, Koenig, Faral, Benuzzi and Temporal 34 ]. With the assumption of perfect gas for both aluminum and the foam, the shock polar and the shock velocity can be written as
 $$ \begin{align} P=\frac{\gamma +1}{2}\;\rho {u}^2,\kern2.04em D=\sqrt{\frac{\gamma +1}{2}\kern0.24em \frac{P}{\rho }}, \end{align} $$
where u is the fluid velocity, ρ is the density of considered material, and γ is the adiabatic factor, assumed equal to that of a monoatomic perfect gas (γ = 5/3) for both aluminum and the foam.
As the impedance of aluminum is much higher than the impedance of foam, the propagation of the shock via the foam–metal interface generates two shocks: one is transmitted to the aluminum layer and the other reflected back into the foam[ Reference Zeldovich and Raizer 35 ]. By assuming that the curve for the reflected shock into the foam is simply the mirror curve of the principal Hugoniot of the foam (an assumption which is rigorous for weak shocks)[ Reference Zeldovich and Raizer 35 ] and by assuming that the shock reaches the interface when it is already stationary we can calculate the pressure in aluminum P Al as[ Reference Batani, Balducci, Nazarov, Löwer, Koenig, Faral, Benuzzi and Temporal 34 ]
 $$\begin{align}{P}_{\mathrm{Al}}=\frac{4{\rho}_{\mathrm{Al}}\left({\gamma}_{\mathrm{Al}}+1\right){P}_{\mathrm{Al}}}{{\left(\sqrt{\gamma_{\mathrm{Al}}+1}\;\sqrt{\rho_{\mathrm{Al}}}+\sqrt{\gamma_{\mathrm{foam}}+1}\;\sqrt{\rho_{\mathrm{foam}}}\right)}^2}.\end{align}$$
Here ρ Al and ρ foam indicate the unperturbed metal and foam density, respectively, and P abl is the ablation pressure, which can be estimated as[ Reference Batani, Stabile, Ravasio, Desai, Lucchini, Desai, Ullschmied, Krousky, Juha, Skala, Kralikova, Pfeifer, Kadlec, Mocek, Präg, Nishimura and Ochi 36 ]
 $$\begin{align}{P}_{\mathrm{abl}}=8.6\;{\left(\frac{I}{10\;\lambda}\right)}^{2/3}{\left(\frac{A}{2Z}\right)}^{1/3},\end{align}$$
where I is the laser intensity on target in W/cm2, λ is the laser wavelength in μm, and A, Z are the mass number and the atomic number of the ablator material.
Assuming γAl = γfoam = 5/3, Equation (2) can be simplified as
 $$\begin{align}M=\frac{P_{\mathrm{Al}}}{P_{\mathrm{abl}}}=\frac{4{\rho}_{\mathrm{Al}}}{{\left(\;\sqrt{\rho_{\mathrm{Al}}}+\sqrt{\rho_{\mathrm{foam}}}\right)}^2}.\end{align}$$
The ablation pressure for both kinds of targets is practically the same. Therefore, the shock pressure in the Al layer of a double-layer target is increased due to impedance mismatch as predicted by Equation (4), according to which, for foam and aluminum densities of 50 mg/cm3 and 2.7 g/cm3, respectively, the multiplication factor is M ∼ 3.1. Hydro-simulations confirm an increase of about 3, in a good agreement with the simple analytical model. For the case of 5 mg/cm3 the multiplication factor is M ∼ 3.7.
Now, concerning the shock breakout time from simple Al targets, we can write (assuming for simplicity a flattop temporal profile of laser irradiation) that
 $$\begin{align}{t}_{\mathrm{Al}}=\frac{d_{\mathrm{Al}}}{D_{\mathrm{Al}}},\kern2.16em {D}_{\mathrm{Al}}=\sqrt{\frac{\gamma +1}{2}\kern0.24em \frac{P_{\mathrm{Al}}}{\rho_{\mathrm{Al}}}}.\end{align}$$
For the case of foam-layered targets instead the shock breakout time will be given by
 $$\begin{align}\kern-6pt t={t}_{\mathrm{foam}}+t^{\prime}_{\mathrm{Al}}=\frac{d_{\mathrm{foam}}}{D_{\mathrm{foam}}}+\frac{d_{\mathrm{Al}}}{D^{\prime}_{\mathrm{Al}}},\kern0.8em {D}_{\mathrm{foam}}=\sqrt{\frac{\gamma +1}{2}\kern0.24em \frac{P_{\mathrm{abl}}}{\rho_{\mathrm{foam}}}}.\end{align}$$
Here $t^{\prime}_{\mathrm{Al}}$
and
$t^{\prime}_{\mathrm{Al}}$
and $D^{\prime}_{\mathrm{Al}}$
correspond to the pressure increased due to the impedance mismatch effect at the foam layer interface (Equation (1)). As, in our case, the pressure increases by a factor M ∼ 3, we can say that the travel time in Al will be reduced by a factor
$D^{\prime}_{\mathrm{Al}}$
correspond to the pressure increased due to the impedance mismatch effect at the foam layer interface (Equation (1)). As, in our case, the pressure increases by a factor M ∼ 3, we can say that the travel time in Al will be reduced by a factor $\sqrt{3}\sim 1.7$
. With some simple algebra we can then write
$\sqrt{3}\sim 1.7$
. With some simple algebra we can then write
 $$\begin{align}\frac{t_{\mathrm{foam}}}{t_{\mathrm{Al}}}=\frac{d_{\mathrm{foam}}\sqrt{\rho_{\mathrm{foam}}}+{d}_{\mathrm{Al}}\sqrt{\frac{\rho_{\mathrm{Al}}}{M}}}{d_{\mathrm{Al}}\sqrt{\rho_{\mathrm{Al}}}},\end{align}$$
where M is the pressure amplification factor. The delay induced by the presence of the foam is a factor of approximately 1.25 for the case of the 50 mg/cm3 foam. This is indeed in qualitative agreement with our experimental data. Note that the increase of the shock breakout time for targets with foam ablation layer was noted in other experimental studies[ Reference Benuzzi, Koenig, Krishnan, Faral, Nazarov, Temporal, Batani, Muller, Torsiello, Hall and Grandjouan 37 , Reference Hall, Batani, Nazarov, Koenig and Benuzzi 38 ] and qualitatively explained in Ref. [Reference Batani, Balducci, Nazarov, Löwer, Koenig, Faral, Benuzzi and Temporal34].
Indeed, for less-dense foams the shock may even break out earlier than in pure-Al targets (the crossing time in Al is small owing to the pressure increase due to impedance mismatch and the shock velocity in the foam is very high due to the low density). The simple calculation based on Equation (7) would say that with 5 mg/cm3 foam the shock breakout should take place earlier than in simple Al targets. However, our experimental results show that the shock breakout times are practically the same for a simple Al target and for a target with 5 mg/cm3 foam. Indeed, we must be careful about the applicability of this model in our case for the 5 mg/cm3 foam density. The impedance mismatch effect is correctly described but, with our target configuration, the laser is directly incident on the undercritical 5 mg/cm3 foam. Therefore (after the ionization wave crosses the foam layer)[ Reference Nicolaï, Olazabal-Loumé, Fujioka, Sunahara, Borisenko, Gus'kov, Orekov, Grech, Riazuelo, Labaune, Velechowski and Tikhonchuk 29 , Reference Gus’kov, Limpouch, Nicolaï and Tikhonchuk 30 ], the laser can penetrate deeply into the target and a part of the laser energy is directly deposited into the Al layer. It is therefore not surprising that the shock breakout time for a layered target with the 5 mg/cm3 foam is about the same as that for a pure-Al target since in both cases a shock is generated at the Al surface and travels the same Al thickness.
The other experimental result shown in Figure 5 concerns the increase of shock breakout time when the laser energy is increased. This was at first surprising since normally the shock breakout time is expected to decrease when the laser energy increases since a higher energy means a larger intensity, a larger ablation pressure, and finally a higher shock velocity. This effect is due to the quite large laser intensity used in the experiment (up to 3 × 10¹⁵ W/cm2) as a result of the small focal spot size. At such laser intensities, parametric instabilities such as stimulated Raman scattering (SRS) and stimulated Brillouin scattering (SBS) are expected to be very severe. They can cause the reflection of a substantial part of the induced laser energy, thereby inducing a significant difference between the nominal and the real laser intensity on target. In addition, the SRS and two plasmon decay (TPD) parametric instabilities will produce copious amounts of hot electrons which can penetrate deeply into the target and cause its expansion. Such expansion induces two effects: first the shock velocity increases, and second the distance to be crossed also increases. However, the scaling is different: D ∼ ρ −1/2 while for the thickness increment Δx ∼ ρ −1. Therefore, the competition between these two effects results in an increase of the shock breakout time. In turn, if this effect is not taken into account, an ‘apparent’ lower shock velocity will be measured, inferring a lower shock pressure.
This issue was already evidenced in experiments performed on the same laser facility in a similar intensity range[ Reference Batani, Antonelli, Atzeni, Badziak, Baffigi, Chodukowski, Consoli, Cristoforetti, de Angelis, Dudzak, Folpini, Giuffrida, Gizzi, Kalinowska, Koester, Krousky, Krus, Labate, Levato, Maheut, Malka, Margarone, Marocchino, Nejdl, Nicolai, O'Dell, Pisarczyk, Renner, Rhee, Ribeyre, Richetta, Rosinski, Sawicka, Schiavi, Skala, Smid, Spindloe, Ullschmied, Velyhan and Vinci 39 ] in the context of the studies on the shock ignition approach to inertial confinement fusion. In this work, the apparent shock velocity corresponded to a maximum ablation pressure of approximately 90 Mbar. Using the well-known scaling laws for shock pressure[ Reference Batani, Stabile, Ravasio, Desai, Lucchini, Desai, Ullschmied, Krousky, Juha, Skala, Kralikova, Pfeifer, Kadlec, Mocek, Präg, Nishimura and Ochi 36 ] this would imply an intensity of target of approximately 1.5 × 10¹⁵ W/cm2 instead of the intensity really used in the experiment of approximately 2 × 10¹⁶ W/cm2. The difference has indeed been explained by performing detailed simulations using the advanced hydrocode CHIC which takes into account self-consistently the generation of parametric instabilities, the generation of hot electrons, their energy deposition in the target and its effects on hydrodynamics[ Reference Nicolaï, Feugeas, Nguyen-bui, Tikhonchuk, Antonelli, Batani and Maheut 40 , Reference Colaïtis, Duchateau, Ribeyre, Maheut, Boutoux, Antonelli, Nicolaï, Batani and Tikhonchuk 41 ].
In our case, 2D hydrosimulations performed with the code MULTI did not take into account all such effects. In this case, the described delay in shock breakout corresponds to an apparent lower shock velocity and shock pressure. For instance, in the case of shot 30141 (simple Al 10 μm target), the simulation could reproduce the shock breakout time using a reduced laser intensity of 1.25 × 10¹⁵ W/cm2 instead of the real intensity on target used in the experiment (3 × 10¹⁵ W/cm2). Such reduced intensity does not have any real physical meaning; it is just a way to reproduce the experimental shock breakout time. In addition, as noted previously, owing to the increase of shock breakout time with energy (Figure 5), an increase of the real intensity corresponds to a decrease of the reduced intensity used in MULTI simulations to reproduce experimental results.
MULTI 2D simulations also allowed to study the influence of the spatial profile of the single spot on shock propagation. We either used a flat-top profile with 70 μm diameter or a Gaussian profile with the same 70 μm FWHM diameter. In all cases the FWHM pulse duration was 300 ps, and the pulse maximum is at 300 ps. Results were comparable in the two cases, only as expected, the same energy deposited on target implied that the peak laser intensity was slightly higher in the case of Gaussian profile. Results are presented in Figure 7, which shows the evolution of temperature of target rear side as a function of space and time.
(a) Experimental results for 10 μm Al target (from Figure (c)). (b) Temperature of the target rear side versus space and time from 2D simulations and a 10 μm Al target. (c) The same for a target of 10 μm Al + 50 μm foam. In both cases the focal spot FWHM was 70 μm, the time profile of the laser pulse was Gaussian, and the peak intensity was 1.25 × 10¹⁵ W/cm2.
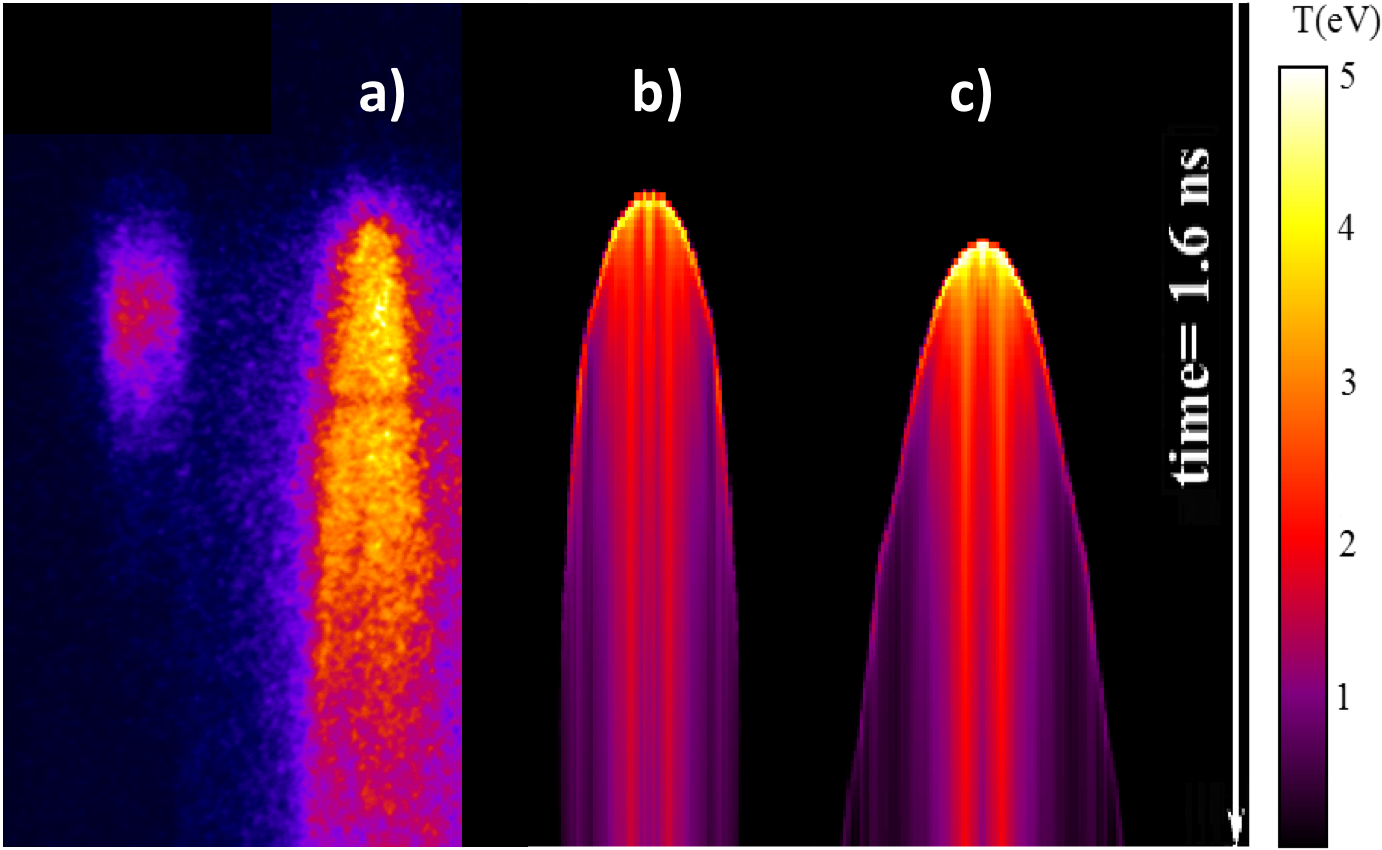
We compared the experimental results related to shock breakout on target rear side to the temperature spatial and temporal profile provided by simulations (see Figure 7 as an example). It is important to note that the experimental signal corresponds to target emissivity convoluted with the spectral sensitivity of the streak camera and with the transmission of the optics. Therefore, a complete simulation of target rear side emission would require post-processing of the hydrodynamics data in order to obtain the emissivity from the temperature and density profiles in the target. However, although the total radiated power from the target rear side approximately follows the blackbody Stefan–Boltzmann’s law (∼σT 4 ), the diagnostic spectral window is limited, and once we convolute the blackbody spectrum with the actual spectral sensitivity, we find that the dependence of brightness on the surface temperature is close to linear for a quite large interval of temperatures, and this is enough for a qualitative comparison. Therefore, we can directly compare the simulation results in Figure 7 with the experimental streak camera images.
Concerning the experimental observation that the shock breakout region in the case of foam–Al targets is larger than in pure-Al targets, this is well reproduced in hydrodynamic simulations (see Figure 8). As we have written previously, this is obviously related to the different total thickness of used targets. However, in order to see whether this effect is simply due to the different target thickness or there is also an influence coming from the presence of the foam, we have performed simulations using 60 μm Al targets and compared the result with those for 50 μm foam + 10 μm Al (see Figure 8). Results show that the shock breakout spot size is larger in the case of foam-layered targets as compared with 60 μm Al targets. This effect can be explained due to the low density of the foam which implies a longer electron mean free path, i.e., a higher thermal conductivity, and the effect is on the basis of the idea of using foams for smoothing of energy deposition in laser–plasma experiments[ Reference Batani, Nazarov, Hall, Löwer, Koenig, Benuzzi, Faral and Gradjouan 42 ]. From Figure 8 we also see, as expected, the shock breakout time is strongly delayed in the case of 60 μm Al targets.
Temperature of target rear side versus space and time. Results of 2D simulations for Gaussian profile, peak laser intensity 1.25 × 10¹⁵ W/cm2 and spot diameter 70 μm (FWHM): (a) 10 μm Al target; (b) 10 μm Al + 50 μm foam; (c) 60 μm Al target. Note: in case (c), the shock breakout image appears much more elongated simply because of the slower shock velocity which increases the time delay between the breakout at the center of the focal spot and at the edges of the focal spot.

5 Shock collision: target rear side
In this section, we focus on the interaction between the two shocks originating from the two laser spots. In simple Al targets, due to the small thickness, this interaction is absent. The two shocks remain well separated (as shown in Figures 2(a), 2(b), and 2(c)), and we identify two distinct shock breakout signals, which are separated at all times. For the shots with foam, the situation is different. We see that the two emission regions merge with each other, and that the central part becomes even brighter than the regions corresponding to the two focal spots (see Figures 2(d)–2(g) and 9). In addition, while the luminosity of the two lateral regions decays within approximately 0.4 ns (see Figure 9), the luminosity of the central region, after a sharp peak, remains quite high and indeed it even seems to increase in time.
We can explain this effect on the base of 2D hydro-simulations. In this case, the real geometry is really 3D, and 2D simulations do not completely reproduce the situation of the experiment. In addition, the lateral energy losses, because of the geometry, are larger in the case of a circular spots as compared with a ring or stripe configuration used in 2D simulations. However, in first approximation the collision between the two tangential shocks will be similar to the collision between two planar shocks, so these simulations can be used to give a clear qualitative explanation of the observed phenomena.
Time evolution of the rear-side self-emission (arbitrary units) for right (blue solid line) and left (red solid line) spots and for the middle area (dashed black curve). Shot 30148 foam–Al, 50 mg/cm3, E = 115 J. To reduce noise, the displayed signal corresponds to space integration with a width of 25 pixels around the central positions.

Figure 10 shows the temperature of the rear side (the last cell of the target) as a function of time and radial direction obtained by 2D MULTI simulations for simple-Al and foam–Al targets and a laser pulse of 50 J. The corresponding experimental streak-camera images for the same shots are also presented in the right part of Figure 10 and show good agreement.
The temperature of the rear side obtained in 2D MULTI simulation for: (a) 10 μm Al; (b) 10 μm Al+ 50 mg/cm3 foam. For these simulations, we used a laser pulse with spatial flat-top profile and a Gaussian time profile, duration 300 ps (FWHM), wavelength 0.44 μm (simulations with Gaussian spatial profile yield the same results). (c) and (d) Experimental rear-side self-emission streak images from Figure 2 (shots 30142 and 30147).

Figure 11 shows the detailed history of shock dynamics in the target (in the case of 50 mg/cm3 foam). The plots show the value of pressure in the target represented in Lagrangian coordinates (the initial cell position).
The spatial pressure profiles from simulations in foam (50 mg/cm3)–Al targets. The plots are shown in Lagrangian coordinates, i.e., R and z correspond to the initial position of each cell in the simulation mesh. In the images, the blue line and the blue rectangle show the position of the target (foam) surface and the position of the 10 μm Al foil, respectively.

We see that at the beginning the two shocks proceed well separately. They reach the Al/foam interface at 0.28 ns. After this moment, a shock is transmitted into Al and a reverse shock is reflected back into the foam at high velocity.
At 0.4 ns the two shocks almost reached the rear side of Al and the reversed shock has almost gone back to the ablation front. At this time, the two shocked regions (regions at high pressure) remain well separated except very near to the laser side where they begin to merge. At 0.45 ns the shocks emerge on target rear side (shock breakout time). At this time, the shocks begin to merge (collide) in the foam but still are far from the Al/foam interface. The region where they collide has a slightly bigger pressure than the region around (i.e., it is darker in the used color scale).
Only at 0.53 ns does the ‘merging’ reach the Al/foam interface and at 0.65 ns it reaches the target rear side. In all these cases the merging region has higher pressure (it is darker) than surrounding regions because the collision between the two shock fronts (moving radially) implies a pressure amplification. Thus, we see that shock breakout takes place on shorter time scales than shock collision in the central region.
The collision between the two shocks increases the pressure and the temperature, which explains the fact that the central region in experimental streak camera images is brighter than the single shocks and it is maintained for longer times. After shock breakout both pressure and temperature rapidly decrease due to the relaxation of the material. Instead, the central region continues to be much hotter than the rest of the target for several nanoseconds.
For the lower foam density (5 mg/cm3) the central region corresponding to shock collision also appears but it is less bright and its duration seems to be shorter. The hydrodynamics seems to be similar apart from the fact that, as we already said, the foam is undercritical which implies that a part of the laser energy can penetrate deep into the target.
The evolution of hydrodynamics and the effect of pressure amplification can be more clearly seen in the following figures which show the pressure profile along different ‘radial’ cuts at different times.
The situation at t = 0.4 ns is shown in Figure 12. The shock has reached the Al and it is propagating in Al (almost shock breakout). The reverse shock at higher pressure (due to impedance mismatch) is propagating back in foam. In the first layers, the two radial shocks have already collided and there is a further pressure increase. The pressure profiles along the two lines at 18 and 47 μm (dashed lines ‘A’ and ‘B’ in Figure 12(a)) are shown in Figure 12.
Time t = 0.4 ns: (left) hydro-simulations (as in Figure 11 but rotated by 90°); (right) pressure profiles at z = 18 and 47 μm (dashed lines A and B in the figure on the left). Here (I) is the forward shock travelling in Al, (II) is the reverse shock travelling back in the foam, (III) is the forward shock, still expanding radially in the foam, and (IV) is the region where the two radially expanding shocks have collided.

Figure 13 shows the situation at t = 0.45 ns when the forward shock has already broken out on the Al rear side. The reverse shock has practically already reached the ablation front on the foam side (located at about z = 50 μm).
Time t = 0.45 ns: (left) hydro-simulations (as in Figure 11 but rotated by 90°); (right) pressure profiles at z = 18 and 41 μm (dashed lines A and B on the left). Here (I) to (IV) are the same as in Figure 12. Note: in position A, the radial forward shocks (II) and the reverse shocks (III) have practically merged.

At 0.52 ns (see Figure 14) the forward shock has already broken out on the Al rear side and we see the relaxation wave coming back in Al. The reverse shock has reached the ablation front on the foam side (located at about z = 55 μm). Along the line A in the middle, we see the collision of the shocks.
Time t = 0.52 ns: (left) hydro-simulations (as in Figure 11 but rotated by 90°); (right) pressure profiles at z = 18 and 45 μm (dashed lines A and B on the left). Here (I) to (IV) are the same as in Figure 12, except for (V) which here represents the relaxation wave travelling back into Al after shock breakout on rear side. Again, in position A, the radial forward shocks (II) and the reverse shocks (III) have practically merged.

By looking at Figure 14 (center) we note that the pressure in the central region exceed by a factor of six the pressure at the edges. We know[ Reference Zeldovich and Raizer 35 ] that in the classical case of symmetric collision of two shocks the pressure increases up to a factor of four. In our case, we have a higher amplification factor because in the central region we have the collision of more shocks: not only the forward shocks propagating laterally but also the backward shocks generated at the foam/Al interface. In this case, the pressure increase is much higher than that given by the simple collision of the forward shocks and also that given by impedance mismatch effect at the foam/Al interface. Therefore, we can conclude that our experimental setup allows the generation of very strong pressures, in excess of what could be obtained by direct laser irradiation but also of what could be obtained by a simple symmetrical shock collision.
6 Plasma expansion on target front side
Let us now analyze the X-ray streak images from target front side (Figure 4). Figure 4(b), corresponding to 50 J on a simple 10 μm Al target, initially shows two separate emission spots, corresponding to the points of incidence of the two laser beams, but then a brighter and longer-duration emission emerges in the center. This indeed corresponds to the interaction between the two expanding plasma flows from target front side. Using a similar experimental arrangement, several authors have studied such plasma flow interactions, especially in the context of laser-driven magnetic field reconnection (see, e.g., Refs. [Reference Nilson, Willingale, Kaluza, Kamperidis, Minardi, Wei, Fernandes, Notley, Bandyopadhyay, Sherlock, Kingham, Tatarakis, Najmudin, Rozmus, Evans, Haines, Dangor and Krushelnick43,Reference Li, Séguin, Frenje, Rygg, Petrasso, Town, Landen, Knauer and Smalyuk44]). In our experiment, the central emission corresponding to the plasma flow interaction is also visible in Figure 4(e) corresponding to the same energy on a target with 50 mg/cm3 foam. In this case, the image is much fainter due to the lower emission of softer X-rays from the plastic material as compared with Al.
In the shots at lower energy (Figures 4(a) and 4(d)), plasma expansion is smaller (as is also evidenced by the extension of the emission plume) and the two emission regions remain well separated. This is also true for the case of the 5 mg/cm3 foam (Figure 4(c)). In this case, the laser can penetrate to the Al foil through the undercritical foam. Emission is then comparable to that of simple Al targets but the two regions do not merge, probably due to the confinement effect owing to the presence of the foam. Finally, Figure 4(f) shows that, in the case of gold-doped foam, the emission is quite stronger, as expected owing to the higher emissivity of gold.
In a way such images are therefore ‘mirroring’ the emission images from target rear side. In simple 10 μm Al targets there is no shock collision within the target and correspondingly it is not seen in the image on the target rear side. Instead, on the front we observe the collision and merging between the two expanding plasmas. In the case of foam-layered targets, plasma collision on the front side is much weaker or absent but there is shock collision on the rear side. The collision region is not visible in the front images because these are sensitive to soft X-rays (above ∼1 keV) while the SOP diagnostics is sensitive to photons in the near-visible region of the electromagnetic spectrum.
By looking in detail at the image of Figure 4(b), we see that the central emission starts about 180–190 ps after the beginning of laser irradiation (i.e., after the beginning of emission from each of the two spots). As the two spots are separated by approximately 200 μm and have a diameter of approximately 70 μm, then we can estimate the plasma expansion velocity
 $$\begin{align*}{c}_s\approx 65\;\unicode{x3bc} \mathrm{m}/180\;\mathrm{ps}\approx 3.6\times {10}^7\,\mathrm{cm}/\mathrm{s}.\end{align*}$$
The expansion velocity corresponds to the ion sound velocity in the plasma[ Reference Max 45 ]
 $$\begin{align*}{c}_s=9.79\times {10}^5\;\sqrt{\frac{\gamma {Z}^{\ast }{T}_e}{\mu }}\kern0.24em \mathrm{cm}/\mathrm{s},\end{align*}$$
where γ is the adiabatic constant, $\mu$
the atomic number, Te
the electron temperature in electronvolts, and Z* is the ionization degree, which can, for instance, be calculated according to Ref. [Reference Colombant and Tonon46] and correspond to full ionization of Al in our case.
$\mu$
the atomic number, Te
the electron temperature in electronvolts, and Z* is the ionization degree, which can, for instance, be calculated according to Ref. [Reference Colombant and Tonon46] and correspond to full ionization of Al in our case.
By inverting this formula, we can estimate a plasma temperature ${T}_e\approx 3\;\mathrm{keV}.$
It is significant that this is of the same order as the temperature which can be evaluated for an irradiation intensity of approximately
${T}_e\approx 3\;\mathrm{keV}.$
It is significant that this is of the same order as the temperature which can be evaluated for an irradiation intensity of approximately $1.3\times {10}^{15}\;\mathrm{W}/{\mathrm{cm}}^2$
, corresponding to a shot energy of 50 J. Indeed, by using simple analytical formulas[
Reference Max
45
], we obtain
$1.3\times {10}^{15}\;\mathrm{W}/{\mathrm{cm}}^2$
, corresponding to a shot energy of 50 J. Indeed, by using simple analytical formulas[
Reference Max
45
], we obtain ${T}_e\approx 4\;\mathrm{keV}.$
Figure 15 shows a simulation of the plasma expansion on the target front side performed with MULTI. This shows the beginning of interaction between the two plumes at t = 180 ps, and temperatures which agree with our estimation based on sound velocity.
Plasma expansion on target front side at t = 0.18 ns showing the collision of the two plasma plumes. Here the target is 10 μm Al irradiated by the laser with 50 J energy.

7 Conclusions
The results obtained in foam–Al targets show several interesting effects, namely: (i) delay of shock breakout time, (ii) spatial redistribution of pressure, (iii) increase in shock breakout time when the laser energy is increased, and (iv) evidence of collision between the two shocks.
The delay in shock breakout time is due to the presence of the additional foam layer to be crossed. However, for very tenuous foams, the delay might not be present. Indeed, for undercritical foams the laser beam can directly penetrate to the Al layer (the delay being due only to the short time needed to ionize the foam and produce a uniform underdense plasma).
The bigger target thickness also implies that 2D effects in hydrodynamics expansion are more important. In comparison, the 10 μm thickness of pure-Al foil is much smaller than the focal spot size (∼70 μm) and the shock dynamics is completely 1D. This results in the observed spatial redistribution of pressure, i.e., the shock breakout region is larger in foam/Al targets than in simple Al foils. However, this is not just a purely 2D geometrical effect, but it is also due to the presence of the foam which induces some smoothing and contributes to enlarging the shock breakout region.
Concerning the unexpected increase of the breakdown time with the laser pulse energy, the most probable reason is the preheating of the target by hot electrons and XUV radiation (as was discussed in recent papers[ Reference Nicolaï, Feugeas, Nguyen-bui, Tikhonchuk, Antonelli, Batani and Maheut 40 , Reference Colaïtis, Duchateau, Ribeyre, Maheut, Boutoux, Antonelli, Nicolaï, Batani and Tikhonchuk 41 , Reference Honrubia, Dezulian, Batani, Koenig, Benuzzi, Krishnan, Faral, Hall and Ellwi 47 ]).
In addition, in foam/Al targets we could observe the rise of emissivity in the central region between the two spots giving the evidence of shock collisions. The two expanding shocks’ front collides in the radial direction producing a big increase in pressure and temperature (and, hence, in emissivity). In addition to the two original forward shocks, the collision process may also involve the shocks reflected from the Al/foam interface due to impendence mismatch. Such multiple shock collision is able to produce an increase in pressure beyond the classical value of four expected for the collision of two symmetric shocks.
Finally, it is also interesting to compare the dynamics of shocks generated by a ‘double-spot’ (same geometry, size, and laser intensity) in the case when a gas jet is placed before the Al target[
Reference Benocci, Batani, Dezulian, Redaelli, Lucchini, Canova, Stabile, Faure, Krousky, Masek, Pfeifer, Skala, Dudzak, Koenig, Tikhonchuk, Nicolaï and Malka
48
,
Reference Benocci, Batani, Dezulian, Redaelli, Lucchini, Canova, Stabile, Faure, Krousky, Masek, Pfeifer, Skala, Dudzak, Koenig, Tikhonchuk, Nicolaï and Malka
49
] with the present case of a foam-layered target. The main difference between the two experiments is that the gas layer before Al was much thicker than the foam layer ( $\approx 1$
mm against 50 μm of the foam) and that it was undercritical to the laser. Hence, the beam was smoothed as it was propagating through the layer by ionization effects. Therefore, the laser directly interacting at the front Al surface was already smoothed in a single spot. Thus, no ‘collision’ was observable in that experiment.
$\approx 1$
mm against 50 μm of the foam) and that it was undercritical to the laser. Hence, the beam was smoothed as it was propagating through the layer by ionization effects. Therefore, the laser directly interacting at the front Al surface was already smoothed in a single spot. Thus, no ‘collision’ was observable in that experiment.
Acknowledgments
This work has been carried out within the framework of the EUROfusion Consortium and has received funding from the Euratom research and training programme 2014–2018 and 2019–2020 under grant agreement No. 633053. The views and opinions expressed herein do not necessarily reflect those of the European Commission. The involved teams have operated within the framework of the Enabling Research Project: ENR-IFE19.CEA-01 “Study of Direct Drive and Shock Ignition for IFE: Theory, Simulations, Experiments, Diagnostics Development”.
The work was also supported by the European Union under the Laserlab program, by the Competitiveness Program of NRNU MEPhI, Russia, and by the Czech Ministry of Education, Youth and Sports (CMEYS), projects LTT17015 and LM2018114. A.A. also acknowledges the support of the CNRS visit program (2017) for his stay in France. Finally, the authors are grateful to Philippe Nicolai, CELIA, for the enlightening discussions and to the PALS staff for help in running the experiments.


 Open access