


Introduction
Reference Scambos, Hulbe, Fahnestock, Domack, Burnett, Leventer, Conley, Kirby and BindschadlerScambos and others (2003) produce a compelling argument that the presence of standing bodies of surface meltwater and their sudden drainage via englacial conduits into the sub-ice-shelf ocean drove the explosive collapse of the Larsen B ice shelf, Antarctica, in 2002. The presence of surface meltwater bodies and their propensity to drain, forming dry lake beds and dolines, is further documented by Reference Van den BroekeVan den Broeke (2005) and by Reference Glasser and ScambosGlasser and Scambos (2008). In this paper we investigate the response of ice-shelf flexure stresses to surface water loads and, most particularly, to the sudden changes in surface loading that accompany lake drainage. We use the term doline, as defined by Reference MooreMoore (1993), to refer to a drained lake. (The term ‘ice caldera’ was used by Reference Stephenson and FlemingStephenson and Fleming (1940).) The purpose of our investigation is to establish a preliminary understanding of flexure stresses induced by surface lakes and dolines, and to further understand why such ablation features contribute to catastrophic fragmentation and break-up of various ice shelves along the Antarctic Peninsula. Figure 1 is an aerial photograph showing both the complex patterns of surface lakes, and a raised doline surrounded by a meltwater moat.
Aerial photograph of surface meltwater lake patterns and a doline on the George VI Ice Shelf (photograph courtesy of Dominic Hodgson, 2011, British Antarctic Survey). The doline is located at ∼71 71 °07’ S, 67°58’ W. The dimensions of the doline are ∼950 m × 550m.

The field settings of lakes and dolines on Antarctic ice shelves are extensively described for the Larsen B ice shelf (Reference Glasser and ScambosGlasser and Scambos, 2008, and references therein) and, most notably, for the George VI Ice Shelf, where observations have been compiled for more than 70 years (e.g.Reference WagerWager, 1972; Reference ReynoldsReynolds, 1981; personal communication from T.O. Holt and others, 2011). Similar observations are reported for Arctic ice shelves (Reference Hattersley-SmithHattersley-Smith, 1957). These observations lead to the realization that surface lakes are incised into the ice-shelf surface by a process of local ablation enhancement associated with reduced albedo of standing water (Reference TedescoTedesco and others, 2012). As the lakes accumulate, they begin to flex the ice shelf downward, causing further deepening and attraction of surrounding meltwater runoff patterns (Reference Hattersley-SmithHattersley-Smith, 1957; Reference SergienkoSergienko, 2005). Spatial patterns of dolines are reported by Reference Glasser and ScambosGlasser and Scambos (2008). Sometimes dolines are clustered in groups, as was evident on the portion of the Larsen B ice shelf within the downstream extent of Crane Glacier (fig. 3b of Reference Glasser and ScambosGlasser and Scambos, 2008).
The first field description of an ice-shelf doline we are aware of was in the report of the initial sledging exploration of the George VI Ice Shelf in 1936 (Reference Stephenson and FlemingStephenson and Fleming, 1940). This report describes the encounter by a sledging team of an unusual ‘rising’ ice-shelf surface where it is normally smooth and level, with a ‘bowl-shaped basin, nearly a mile across, bordered by ice-cliffs 100 feet high, … [i]n the bottom of [which] were several mounds of angular ice-blocks piled up to a height of 30 or 40 feet above the general level of the floor’. While it is not possible to specifically identify the doline observed by this sledging team, their description fits with the impression given by the dolines present today on the George VI Ice Shelf (e.g. Fig. 1).
While surface lakes can grow to large horizontal scales, exceeding several kilometers (e.g. fig. 3 of Reference Glasser and ScambosGlasser and Scambos, 2008), they are more typically sub-kilometer in horizontal scale and occur in arrays or patterns that can be very complex (Reference ReynoldsReynolds, 1981; Reference Reynolds and HambreyReynolds and Hambrey, 1988; personal communication from T.O. Holt and others, 2011). The vertical scale of lakes and dolines is less well constrained by observation. Reference Bindschadler, Scambos, Rott, Skvarca and VornbergerBindschadler and others (2002) used IKONOS satellite image photoclinometry to deduce doline depth for a variety of examples on the Larsen B ice shelf in the years prior to its break-up. They reported vertical dimensions ranging from 5 to 20 m in ice that was 250 m thick. In some of the deepest dolines, Reference Bindschadler, Scambos, Rott, Skvarca and VornbergerBindschadler and others (2002) reported a conspicuous floor, suggesting a shallow remnant of the original lake with an ice lid filling the base of the doline. Dolines significantly deeper than the freeboard elevation were not reported.
Elastic or Viscous Ice Response?
Ice-shelf response to changing surface meltwater loads is a problem that can involve both viscous and elastic deformation. The most common approach in the literature is to treat ice-shelf flexure as a problem in elastic bending (e.g. Reference ReehReeh, 1968; Reference Scambos, Sergienko, Sargent, MacAyeal and FastookScambos and others, 2005). Reference Sayag and WorsterSayag and Worster (2011), who formulate ice-shelf flexure at grounding lines in terms of elastic deformation, argue that the deciding factor determining whether to use fluid or elastic deformation is whether the timescale of the phenomena causing the deformation is short compared with the time required to create significant viscous deformations.
A common approach to deciding whether to use viscous or elastic rheology in a given problem is to determine whether the timescale of the forcing is long or short compared with the Maxwell time (Reference MaxwellMaxwell, 1867), r = μ,/E, where μ, is a characteristic viscosity and E is a characteristic spring constant (we use Young’s modulus of elasticity). This timescale is the e-folding timescale associated with the response of a simple spring (with spring constant determined by E) connected in series with a simple dashpot (with viscosity μ). Using μ, = 106GPas, and taking E = 10GPa, gives T 106s 10 days. Insofar as melting seasons along the Antarctic Peninsula can persist for >60 days (Reference Scambos, Hulbe, Fahnestock and BohlanderScambos and others, 2000), the response of the ice shelf to lake growth probably invokes a combination of both viscous and elastic deformation. However, under the assumption that lake drainage is very rapid, on the order of minutes to hours, an elastic treatment of flexure stresses induced immediately following is valid. In the present study, we restrict ourselves to treatment of ice as an elastic medium, and make note of the fact that possible viscoelastic treatment may be needed to refine the treatment of flexure induced by surface lake development over multiple years. It is important to stress that the analysis we present below, where we treat the ice shelf as an elastic medium, will estimate stresses that are likely to be upper bounds on what will actually exist in nature. This is because viscous relaxation will tend to reduce stresses associated with the elastic response.
Isolated Surface Lake and Doline
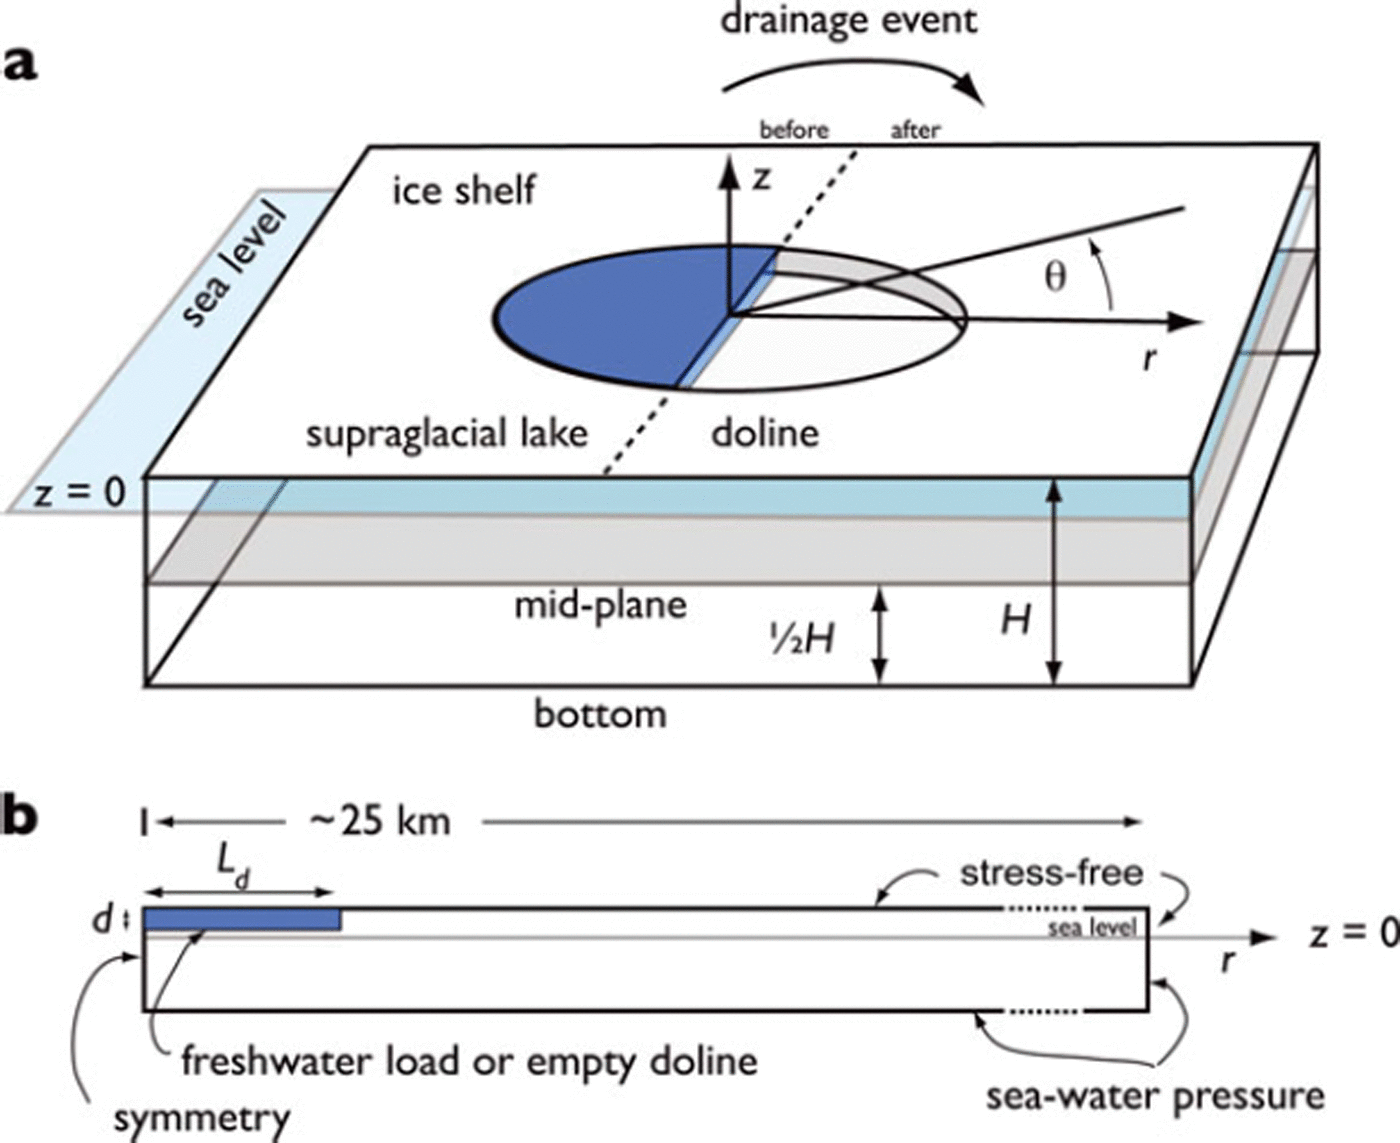
We begin the analysis with an examination of an isolated lake/doline that is perfectly circular with azimuthal symmetry, and where the surrounding ice shelf is of uniform thickness, H (Fig. 2). The center of the lake/doline forms the origin of a cylindrical coordinate system, where r, 0 and z are the coordinates (with z = 0 at sea level).
Idealized geometry of an isolated supraglacial lake/doline feature. (a) Before and after drainage view of the lake/doline. (b) Cross section of the idealized geometry with annotation of boundary conditions.
Analytic solutions
Analytic solutions describing the flexure and stress regime of the isolated circular lake and doline can be adapted from the thin-plate treatment of various lithospheric flexure problems associated with oceanic plate volcanism. Following Reference Brotchie and SilvesterBrotchie and Silvester (1969) and Reference Lambeck and NatibogluLambeck and Natiboglu (1980), we consider an infinite elastic plate of rigidity D, given by
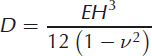
where H is the ice thickness and v = 0.3 is the Poisson ratio. The lake (or doline) is represented by adding an azimuthally symmetric and spatially uniform surface load (or upward force) to the plate within a disk-shaped region centered at r = 0, and with a radius equal to Ld. Shear deformation and stretching in the plate is disregarded, and the flexural rigidity (which depends on ice thickness) is assumed uniform for simplicity. The equation governing the vertical displacement, η(r), of the elastic plate is the familiar biharmonic equation

where F(r) is the surface load given by
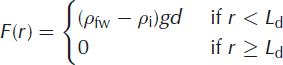
for the filled lake, and for the doline:
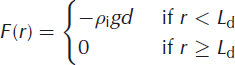
where g is the acceleration due to gravity, and pi, pw and psw are the densities of ice, fresh water and sea water, respectively. Boundary (at r = 0, ∞) conditions are (Reference Brotchie and SilvesterBrotchie and Silvester, 1969; Reference Lambeck and NatibogluLambeck and Natiboglu, 1980)

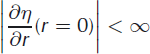

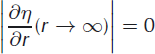
Continuity constraints are additionally applied at r = Ld:

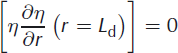


where [∙] = 0 indicates a no-jump (continuity) condition, 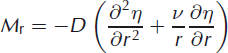 is the radial bending moment and
  is the radial shear. For both the filled lake and the doline, the actual load is applied to a patch of the plate surface, and no attempt is made to resolve the variability of the deformation within the plate. This will constitute one of the main reasons why the analytic solution will differ from numerical solutions, which feature full treatment of z-variation in the geometry, to be shown below. Variation of radial stress, Trr, within the infinitesimally thin plate addressed by the analytic solution is assumed to be linear, achieving maximum absolute values, max|Trr|, at the upper and lower surfaces of the ice.
Reference Brotchie and SilvesterBrotchie and Silvester (1969) and Reference Lambeck and NatibogluLambeck and Natiboglu (1980) developed the analytic solution of the above problem, which we adapt to represent the forcing of the filled lake or doline. This solution is written in terms of Kelvin-Bessel functions (see Appendix)

for r ≥ Ld,
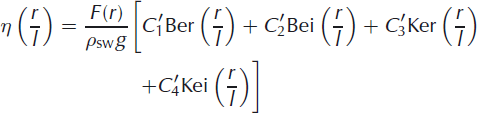
for r ≥ Ld, where I4 = D/(ρswg) is the radius of flexural stiffness defined by Reference Lambeck and NatibogluLambeck and Natiboglu (1980). The various constants Ci and C′i (I = 1,…,4) are determined from the boundary (regularity) and transmission conditions, Eqn (6), and are listed in the Appendix; they are the same as eqn (3c) of Reference Lambeck and NatibogluLambeck and Natiboglu (1980).
Numerical solutions
We present numerical solutions for the flexural response to an isolated lake or doline, because we anticipate that numerical methods will be required to handle complexities of geometry arising from lakes and dolines in natural settings. The governing equations in the numerical model are the familiar stress-balance equations for an elastic medium written in terms of the elastic displacement, u:

where nz is an upward-pointing unit vector in the cylindrical coordinate system used to study isolated lakes/dolines with azimuthal symmetry (and for comparison with the analytic solutions described above).
For the analytic solution, the horizontal extent of the ice shelf is infinite. For the numerical solutions, the radial extent, R, of the ice shelf is 20 km, and is sufficiently large to separate the flexural regime of the lake/doline from any that may be introduced by far-field boundary conditions, such as an ice front. The choice R = 20 km is ∼10 times the horizontal wavelength, A, of the damped sinusoid that develops at an ice front due to bending moments introduced by sea-water pressure (e.g. Reference SergienkoSergienko, 2005, Reference Sergienko2010). For future reference,

For the analytic solution, the thin-plate approximation is used, so there is no z dimension to resolve. In the numerical model, variations of stress and strain within the finite-thickness geometry of the ice shelf are treated explicitly. In the far field, the thickness of the ice shelf is assumed to be uniform at H = 250 m for the experiments in which the results are compared with the analytic solution described above. The depth of the lake or doline is also treated as uniform, with depth, d, equal to the distance from the ice-shelf surface to sea level. This choice is arbitrary, but seems reasonable given that dolines with depth exceeding the freeboard height of the ice shelf are not observed. After examining the solutions associated with a sharp, step-like boundary at the edge of the lake or doline (Fig. 2), a smoother profile was adopted to avoid a discontinuity in radial stress that would occur at the lake/doline boundary as a result. A hyperbolic tangent profile with a scale width, Ls, of 100 m is adopted for the surface profile of the ice shelf, S(r), in the vicinity of the lake or doline:

Sensitivity experiments were performed to establish that Ls in the range 100-250 m would eliminate the discontinuity without significantly changing the solution at locations of maximum tensile stress away from the lake or doline edge.
To assess the performance of the numerical model, we construct two numerical solutions: a ‘reduced’ and a ‘full’ ice-shelf solution. The reduced solution is intended to display only the effects associated with the lake or doline in isolation from the background effects associated with the far-field conditions of an ice shelf (e.g. pressure forces at an ice front) and with the hydrostatic balance. The reduced solution is composed as a test of the numerical methods, since it is most comparable with the analytic solution where the thin-plate approximation eliminates all but the most simple resolution of stress variation, specifically pressure, within the vertical dimension of the ice shelf. The full solution represents the combination of the lake or doline with the effects that arise within the ice shelf as a result of its hydrostatic equilibrium in the surrounding water and bending moments introduced at the ice front. Since the problem is treated as linear (the nonlinearity introduced by the fact that boundary strains will slightly alter the boundary conditions is artificially suppressed), the full solution can be viewed as the linear combination of the reduced solution, involving just the lake or doline, with a solution to a flat-plate ice shelf where only far-field effects are in play. The full solution is compared to the analytic solution only to assess how strong the effects of the lake or doline are, relative to the background elastic state of an ice shelf.
Reduced problem boundary conditions
To produce the reduced numerical solution, the ice-front boundary condition is specified to be stress-free, the gravitational body force term is removed from Eqn (9), and the boundary condition on the bottom surface of the ice shelf, z = B(r), is specified in terms of a perturbation pressure associated with displacement of the bottom boundary from a reference rest position:

For the lake, we apply a surface pressure to the ice surface, z = S(r), that represents the reduced load (dependent on the density difference between ice and water) associated with filling the surface depression between z = d and z = S(r) with fresh water:

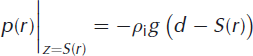
For the doline, we apply an upward surface force to the ice-shelf surface that represents the gravitational load of the ice that is missing between z = d and z = S(r):
At the origin, r = 0, in both the reduced and the full (see below) solutions, an axial symmetry condition is applied. Note that S(r) → d when r > Ld, so the loads associated with the lake and doline are spatially confined.
Full problem boundary conditions
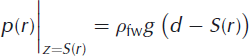
The full numerical solution involves the same geometry as the reduced numerical solution, but without the simplifications associated with removing the gravitational body force and the pressure of sea water at the base and at the far-field ice front (r = L). For the lake, the full pressure of fresh water is specified, as is necessary for the ice to achieve hydrostatic equilibrium under the influence of the gravitational body force:
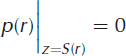
For the doline, the upper surface free:
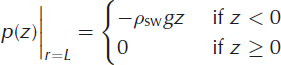
The pressure at the ice front (r = L) is given by
Comparison of solutions
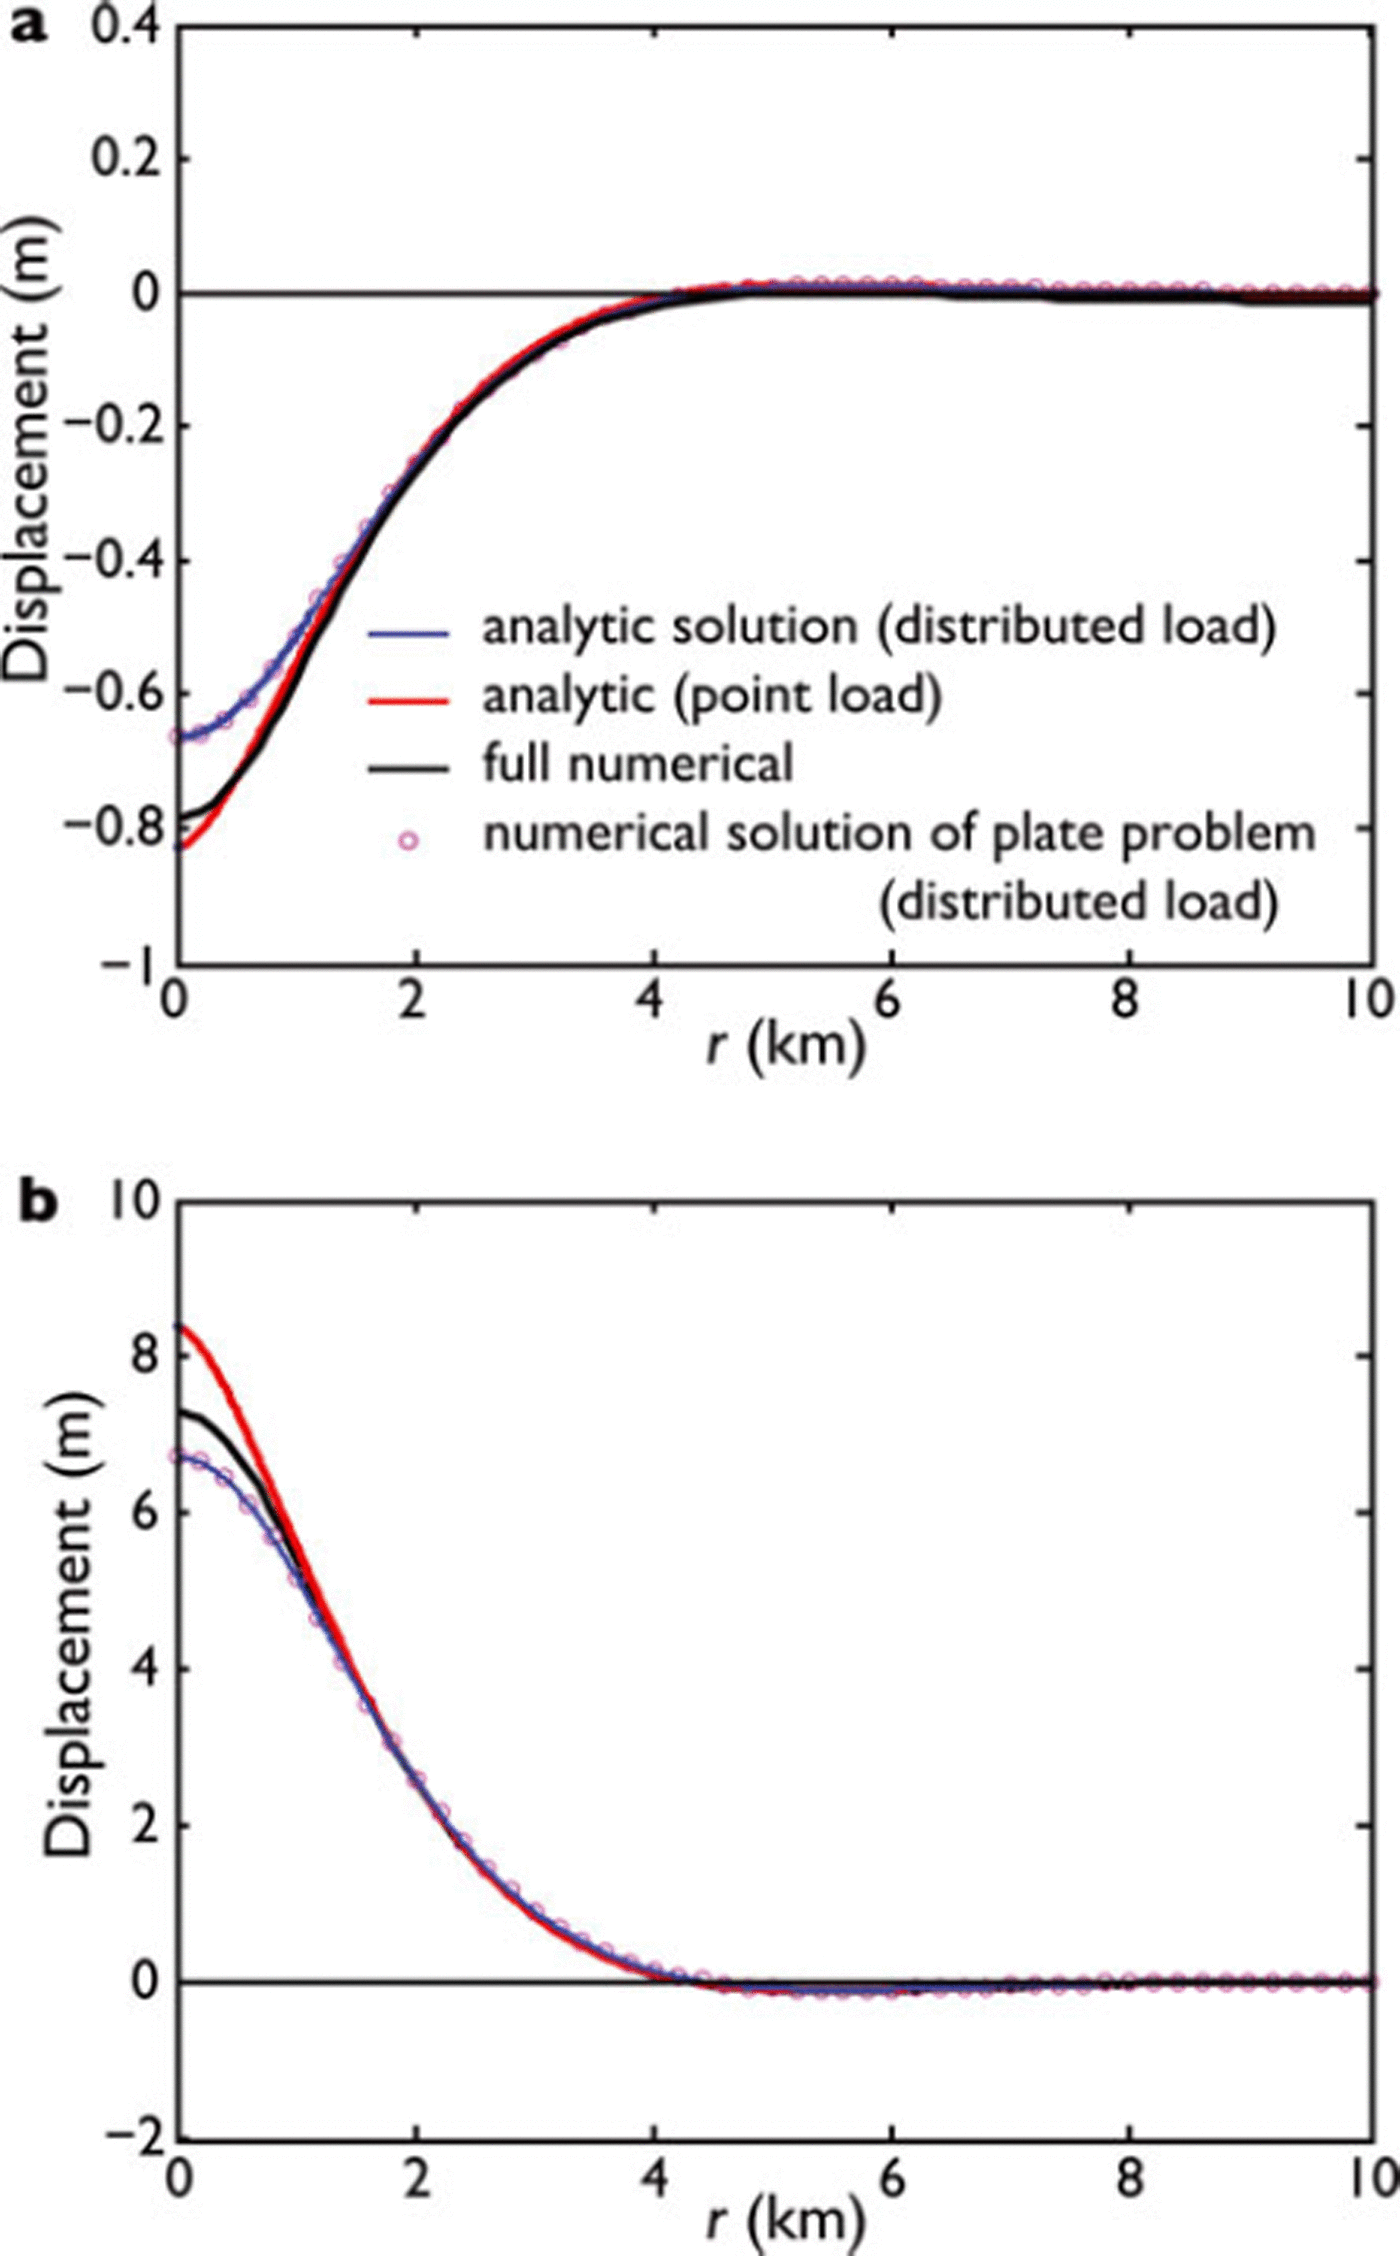
Comparisons of numerical solutions with analytic solutions are presented in Figures 3-5. The comparisons are made for parameter values suggested by the observations of Reference Bindschadler, Scambos, Rott, Skvarca and VornbergerBindschadler and others (2002) just prior to the collapse of the Larsen B ice shelf: H = 250 m, Ld = 1000 m and d = (1 — ρ i/ρsw)H = 28.7m, with ρ i = 910kgm-3, ρsw = 1028kgm-3, ρfw = 1000kgm-3 and g = 9.81 ms-2. Vertical displacement of the ice-shelf mid-plane for the full numerical solution, η (r), is shown in Figure 3. The full numerical solution is bracketed by the analytic solutions for the distributed load and for the effective point load, respectively, for both lake and doline cases. This suggests that the effect of finite thickness associated with the numerical solution tends to reduce the effective radius of a distributed load, because of the separation between the mid-plane of the ice shelf and the upper surface where the lake/doline is placed. Additionally, the resolved vertical geometry of the numerical solution accounts for changes in the flexural rigidity, which depends on the ice thickness. As an additional test of the numerical solver, we computed the solution to the same thin-plate problems described by the analytic solutions. The circles which overlay the blue curves in Figure 3 show the agreement.
Comparison of numerical and analytic solutions for the vertical displacement of the ice-shelf mid-plane for (a) isolated lake and (b) doline. Circles denote a numerical solution of the same thin-plate problem as the analytic solution.
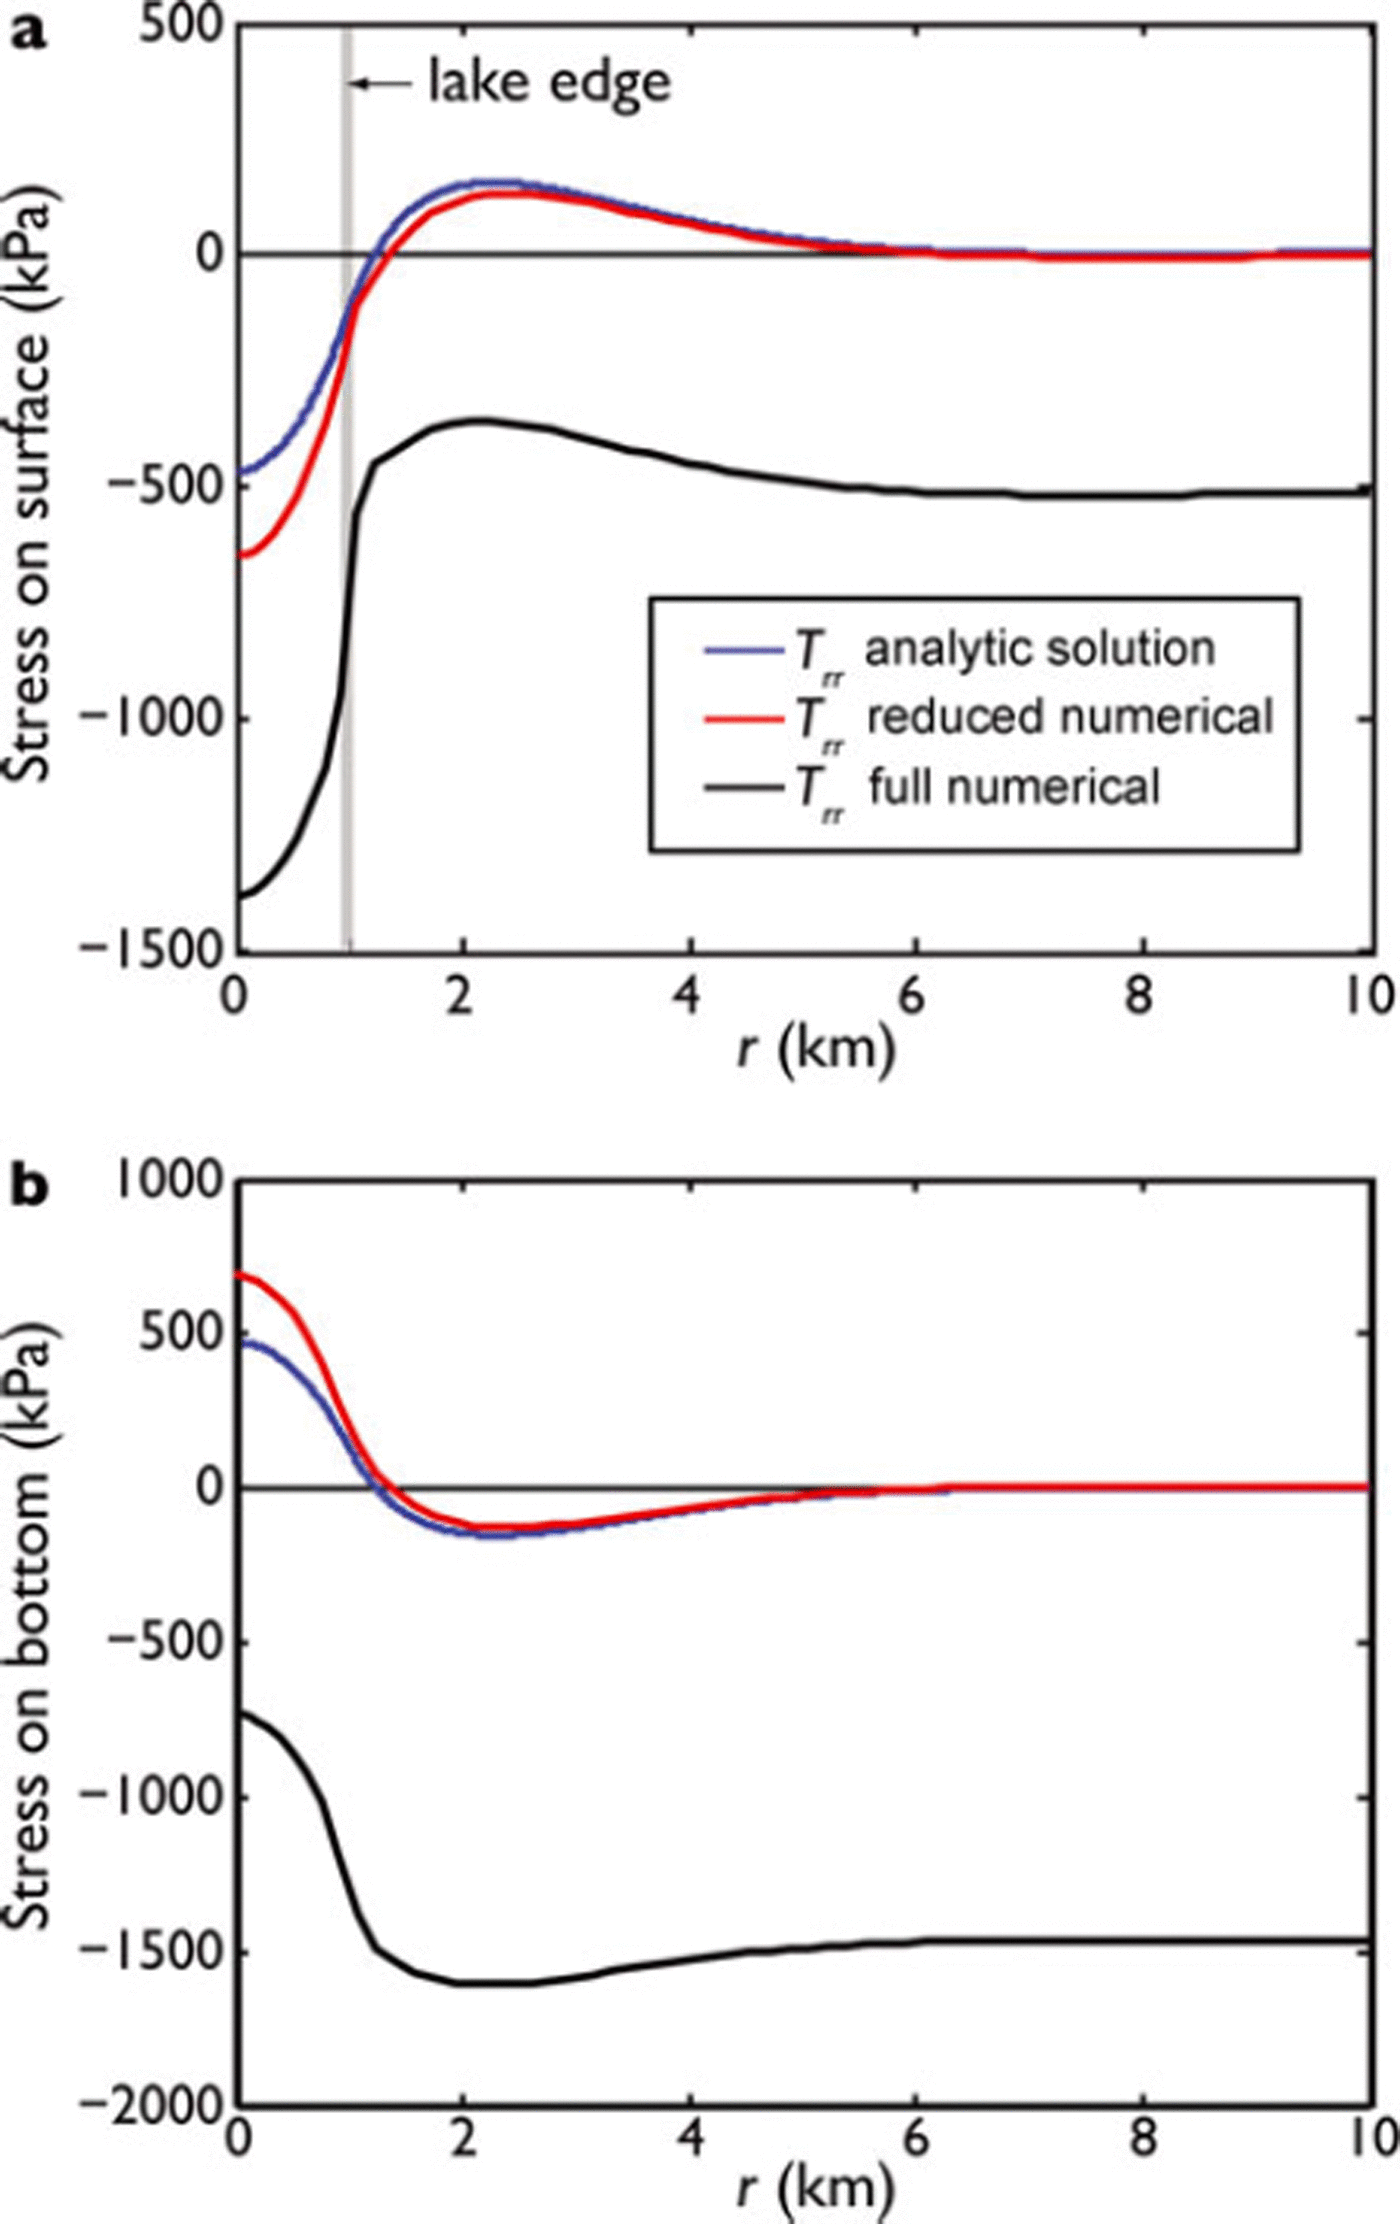
Comparison of numerical (full and reduced solutions) and analytic radial stress, Trr , for the azimuthally symmetric isolated lake. Stresses are evaluated at (a) the surface of the ice shelf, z = S(r), and (b) the base of the ice shelf, z = B(r).
Comparison of numerical (full and reduced solutions) and analytic radial stress, Trr , for the azimuthally symmetric isolated doline. Stresses are evaluated at (a) the surface of the ice shelf, z = S(r), and (b) the base of the ice shelf, z = B(r).

Comparisons of radial stresses, Trr , between the numerical solutions, both full and reduced, and the analytic solution for the distributed load are evaluated at the ice-shelf surface and base, z = S(r) and z = B(r), respectively, and are presented in Figures 4 and 5 for the case of a lake and doline, respectively. For the analytic solution, the radial stress, Trr , is given by

with z = ±H/2. For the full numerical solution, the radial stress is given by:

where err , eθθ and ezz are the strain tensor components, evaluated at appropriate locations in the cylindrical coordinate system.
The radial stresses of the reduced numerical solution (red curves in Figs 4 and 5) fit the analytic solution closely, but not exactly, because the analytic solution does not explicitly resolve the variations of ice thickness associated with the reduced numerical solution. In the far field, as r > Ld, both the analytic and reduced Trr, for both lake and doline cases, asymptote to zero. The radial stresses for the full numerical solution in both lake and doline cases (black curves in Figs 4 and 5) are comparable in shape to the analytic solution near the origin, but are offset by a constant negative value in the far field. This difference reflects the fact that the gravitational body force, in concert with the compressive pressure of water on the ice-shelf bottom and ice front, creates a compressive elastic strain in the ice shelf and thus a reference elastic stress that is compressive.
Parameter Sensitivity, Isolated Lake/Doline
From these considerations, we restrict our parameter sweep of d and Ld to the ranges [0 m → (1 — ρi/ρsw)H] and [100 m → 2000 m]. For H, we sweep the range [100 → 500m], because this range includes the ice thickness values of the two most prominent examples of ice-shelf disintegration (the Wilkins and Larsen B ice shelves, estimated to be ∼175m and ∼220m thick, respectively).
Using the same finite-element package used to develop the full numerical solutions described above for isolated lakes and dolines (the structural mechanics module of COMSOL), we conducted a parameter sweep on three parameters, the ice thickness, radial extent and depth, H, Ld and d, respectively, to determine where, and by what magnitude, tensile radial stresses (assuming an elastic ice shelf) would develop in response to lakes and dolines. We computed the stress regime over the entire ice shelf and examined the results to determine where tensile radial stresses, Trr > 0, would develop in the portions of the ice shelf nearest to the lake or doline feature. Results of the parameter sweep on H, Ld and d are summarized in Figures 6-9. Our working assumption is that positive (tensile) radial stress will be a necessary condition for ice fracture. We leave a more definitive analysis of the connection between the stress regime of lakes and dolines and fracture for future study.
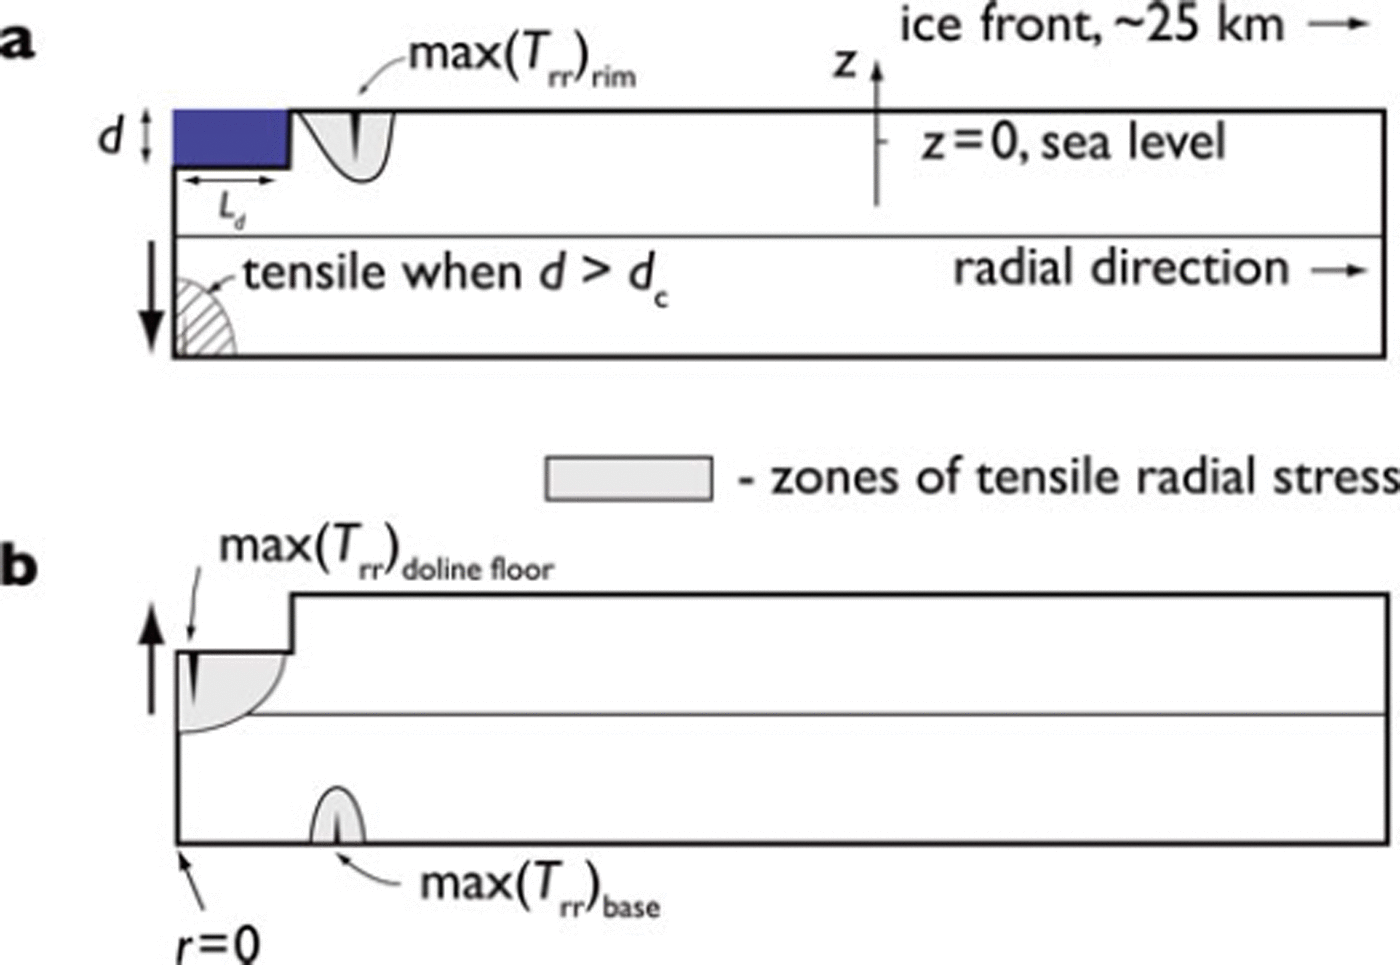
Regions where tensile radial stress develops in response to (a) lakes and (b) dolines, i.e. Trr > 0 (shaded or cross-hatched regions). Maximum values of positive (tensile) Trr are achieved at the ice/water or ice/air boundaries in all cases, and the numerical values of these maxima are given as a function of parameters H and Ld in Figures 7 and 8. In the case of a filled lake, tensile Trr does not develop on the ice-shelf bottom directly beneath the center of the lake until d > dc, where dc is a critical depth (determined numerically) shown in Figure 9. The vertical arrows on the left-hand side of the ice shelf indicate the relative elastic displacement of the ice-shelf mid-plane, which is comparable to the displacement of the neutral axis of an elastic plate in analytic solutions, η. The small V-shaped symbols in the tensile regions represent a schematic view of how fractures would develop from the elastic flexure stresses displayed. The depth of the lake and doline depicted in this schematic diagram is exaggerated for clarity. In our simulations, we do not consider depths which exceed the freeboard of the ice shelf.
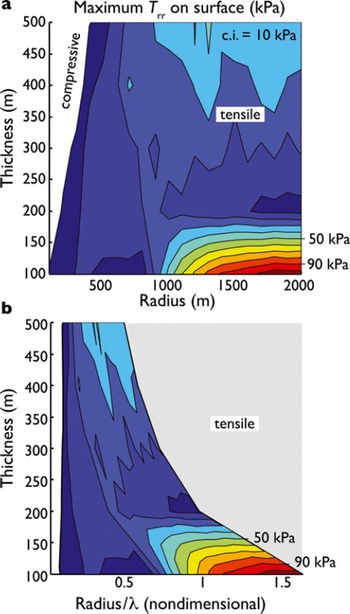
Maximum positive (tensile) radial stress, max(Trr )rim, generated by the elastic flexure at the surface of the ice shelf (at the surface location depicted in Fig. 6a) in response to an azimuthally symmetric lake filled with fresh water. (a) The maximum tensile stress values as a function of H and Ld. (The contour interval, denoted by c.i., is 10 kPa.) (b) The maximum tensile stress values as a function of H and Ld/λ, where λ is the flexural wavelength given by Eqn (10). The gray region in (b) denotes the region of parameter space not filled by the parameter sweep shown in (a). The max(Trr )rim is expected to be tensile in this region, however. White areas in (a) and (b) denote the parameter range where max(Trr )r im is compressive (negative).
Maximum positive (tensile) radial stress, max(Trr )base, generated by the elastic flexure at the base of the ice shelf (at the basal location depicted in Fig. 6b) in response to an azimuthally symmetric doline. (a) The maximum tensile stress values as a function of H and Ld. (b) The maximum tensile stress values as a function of H and Ld/λ, where λ is the flexural wavelength given by Eqn (10). The gray region in (b) denotes the region of parameter space not filled by the parameter sweep shown in (a). The max(Trr )base is expected to be tensile in this region, however. White areas in (a) and (b) denote the parameter range where max(Trr )base is compressive (positive).

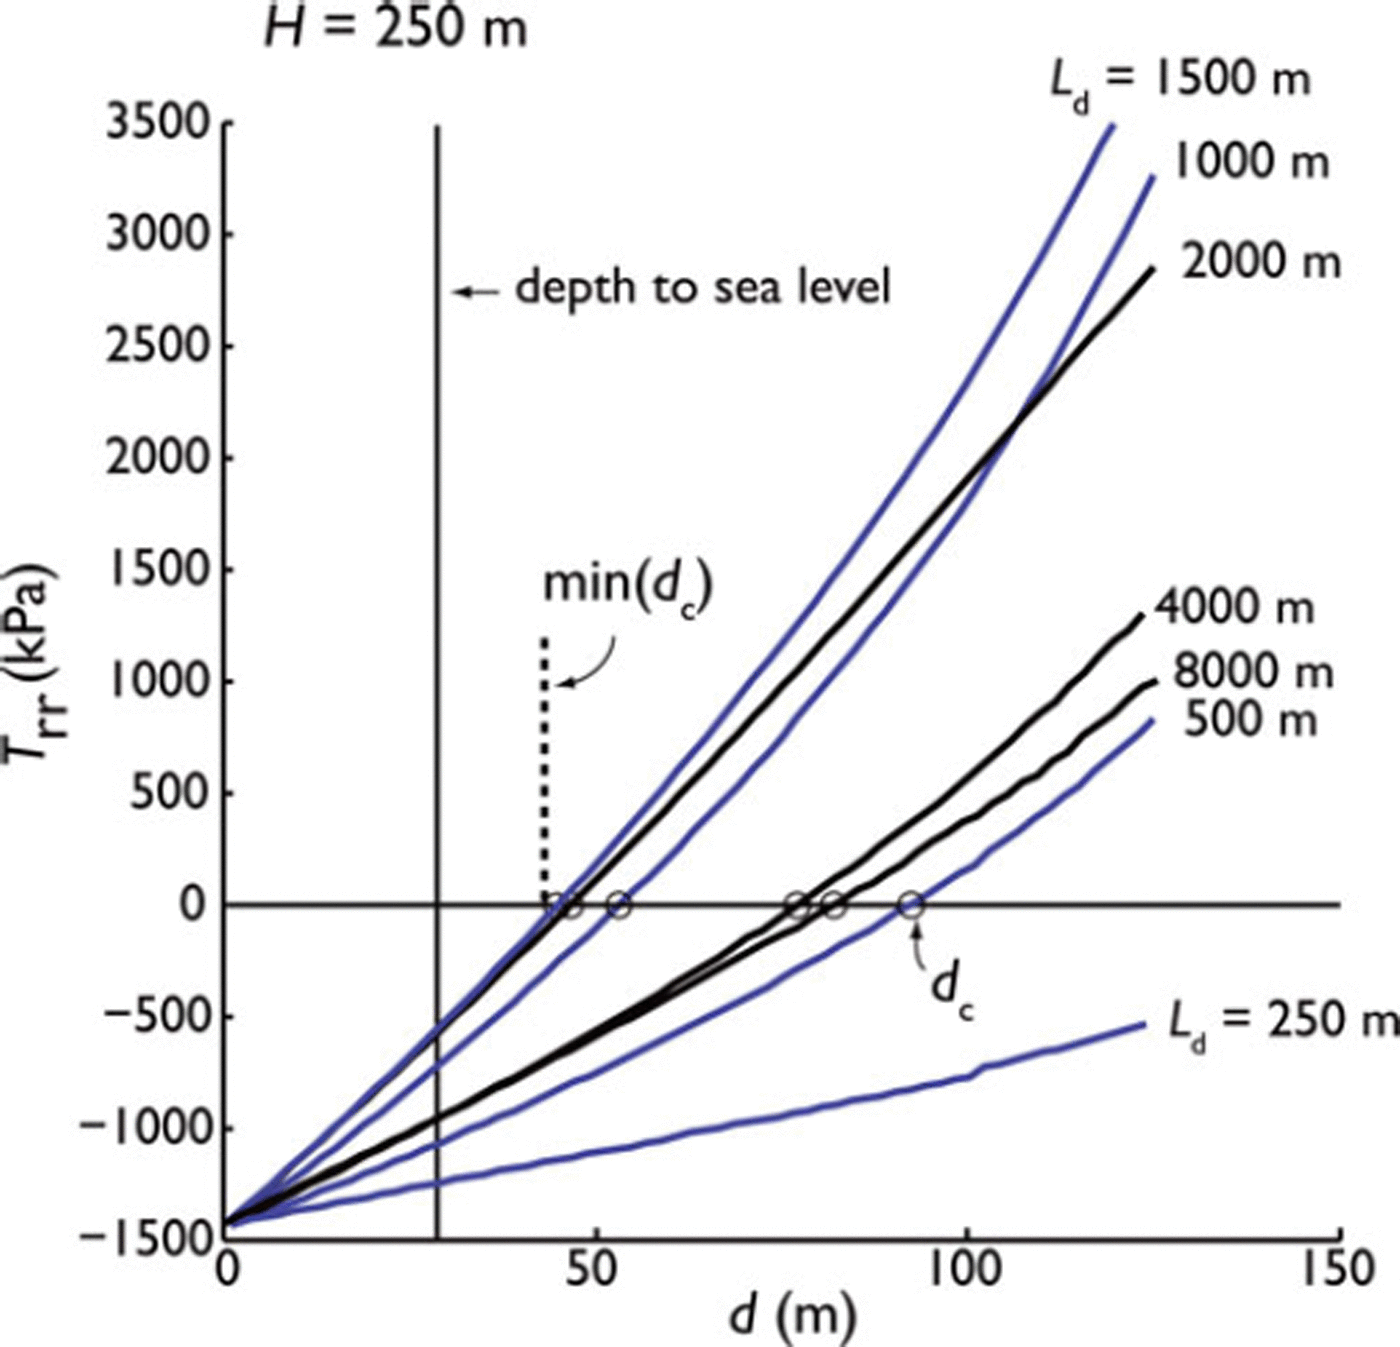
Maximum radial stress as a function of d on the base of the ice shelf directly beneath the filled lake, max(Trr )base, (see crosshatched region in Fig. 6a) for various lake diameters, and with H = 250 m. Blue curves are results for lakes with Ld < 1500 m. Black curves are results for lakes with Ld > 1500 m. Curves for all values of Ld lie (approximately) to the right of the curve with Ld < 1500 m. The lake depth, dc (denoted by circles), where max(Trr )base becomes positive (tensile) is a function of Ld. For Ld between 250 and 8000 m, dc lies below the dashed vertical line at d 45 m.
For filled lakes, tensile radial stress, Trr, develops in two regions depending on the values of H, Ld and d. At the surface of the ice shelf immediately adjacent to the lake’s rim, a zone of weak (<100kPa) tensile stress develops for virtually all values of H and Ld when the doline depth, d, is set at the sea-level reference value of (1 — ρi/ρ sw)H, recommended by the observations of Reference Bindschadler, Scambos, Rott, Skvarca and VornbergerBindschadler and others (2002). For H = 250 m, the approximate thickness of the Larsen B ice shelf prior to its collapse, tensile radial stress failed to develop at the base of the ice shelf immediately beneath the lake at r = 0 unless d was significantly larger than the sea-level reference value (Fig. 9).
Tensile radial stress is more prominent in the case of a drained lake, or doline, than in the case of a filled lake. As shown in Figure 8, tensile radial stress develops at the ice-shelf base immediately adjacent to the downward projection of the rim of the former lake when Ld > 4H. This relationship between Ld and H is a result derived empirically, and is apparent from the plots in Figure 8. The fact that Trr quickly exceeds several hundred kilopascals when Ld crosses this threshold suggests that drainage of lakes that have developed to a large radius will be a strong source of fracture in an ice shelf.
To address the question of what might limit lake depth, we conducted a parameter sweep of d and Ld for a fixed thickness, H = 250 m. As shown in Figure 9, tensile radial stress, Trr > 0, develops on the bottom of the ice shelf directly under the lake when Ld > 500m. As the size of the doline increases to 1500 m, this tensile stress develops for increasingly shallow values of d. The shallowest value for d for which tensile stress is developed is 45 m, and occurs for lake widths of 1500 m. As lakes get larger than this radius, the value of d required to obtain tensile radial stress increases, eventually converging on a value of 75 m. Given that lakes and dolines are generally observed to have depths of (1 - ρi/ρsw)H or less, the process of developing tensile radial stress beneath the center of the lake appears not to be responsible for what determines maximum lake depth before drainage.
Parameter Sensitivity, Lake/Doline Arrays
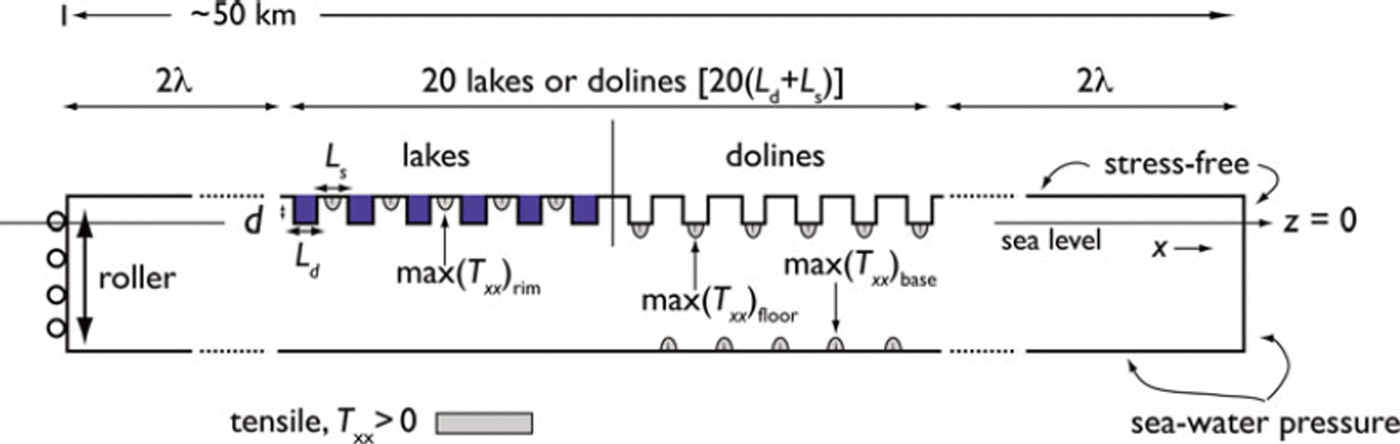
In the previous section, we presented the flexure-induced stress regime of a single, idealized lake or doline. In this section, we consider an array of 20 identical lakes or dolines imbedded in a two-dimensional ice shelf. The domain represents an idealized cross section of uniform initial thickness (H = 250 m, prior to the placement of lakes or dolines), within the x-z plane, under the assumption of plane strain. This array of supraglacial features represents a simplified representation of the lakes and dolines observed by Reference Glasser and ScambosGlasser and Scambos (2008) on the Larsen B ice shelf prior to its collapse. As shown in Figure 10, 20 lakes or dolines are placed in a linear array separated by Ls from each other. The total length of the ice shelf between a simplified grounding line at x = 0 (represented by a ‘roller’ boundary condition, u = 0, w is free, where u and w are the x and z displacements) and an ice front at the extreme right-hand end is 4λ + 20(Ld + Ls), and thus expands or contracts as parameters Ld and Ls are varied. Boundary regions of length 2λ that are free of lakes or dolines are placed at either end of the array of supraglacial features so as to isolate them from the effects of the ice front or grounding line. Analysis of the resulting flexural effects is restricted to the neighborhood of the 10th and 11th lakes/dolines to avoid effects associated with the two ends of the array. (Typically, stresses become slightly more tensile at the ends of the array.)
Geometry, boundary conditions and definitions associated with numerical experiments addressing an idealized ice shelf with periodic surface lake/doline array. Location of maximum tensile stresses shown by shading.
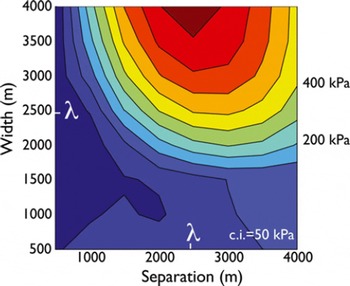
For arrays of supraglacial lakes (Fig. 11) zones of tensile stress extend downward from the surface of the ice shelf within the areas of the ice shelf that are between the lakes, for all values of Ld and Ls between 500 and 4000 m (the parameter ranges are motivated by the observations of Reference Glasser and ScambosGlasser and Scambos, 2008). The value of the maximum stress gets up to 600 kPa for lakes of very large width (∼4000 m) and separations of Ls λ.
Maximum tensile stress, max(Tzz )rim, developed at the surface of the ice shelf between surface lakes in the middle of the array of 20 lakes (measured between the 10th and 11th lakes, as pictured in Fig. 10). This stress is maximized when lake separation, Ls, is approximately equal to the flexural wavelength, λ, when lake width exceeds 2500 m.
For arrays of dolines, as shown in Figure 12, tensile stresses extending toward the central plane of the ice shelf develop on the doline floors and on the ice-shelf bottom directly under the segments of ice shelf that separate the dolines. In agreement with the results of a single, isolated lake/doline, the zones of tensile stress in the array of dolines have 5 to 10 times higher tensile stress than in the case of the array of lakes. Tensile stresses exceed 9 MPa on the floor of the dolines when Ld λ; and exceed 9 MPa on the bottom of the ice shelf when Ls λ.
Maximum tensile stresses, max(Tzz )floor and max(Tzz) fig 8, developed either (a) on the floor of the doline or (b) on the base of the ice shelf. The values are extracted from the solution in the middle of the array of 20 lakes (measured between the 10th and 11th lakes, as pictured in Fig. 10). The floor stress is maximized when lake separation, Ls, is approximately equal to the flexural wavelength, λ; and the bottom stress is maximized when lake width, Ld, is also approximately equal to the flexural wavelength.

Discussion
The very compelling argument for standing surface water as the immediate proximal trigger of catastrophic ice-shelf disintegration (e.g. Reference Scambos, Hulbe, Fahnestock and BohlanderScambos and others, 2000, Reference Scambos, Hulbe, Fahnestock, Domack, Burnett, Leventer, Conley, Kirby and Bindschadler2003, Reference Scambos, Sergienko, Sargent, MacAyeal and Fastook2005; Reference Van den BroekeVan den Broeke, 2005; Reference Glasser and ScambosGlasser and Scambos, 2008) has strong observational support, but is based on only one aspect of surface water’s influence on ice-shelf fracture. This argument (Reference Scambos, Hulbe, Fahnestock and BohlanderScambos and others, 2000, Reference Scambos, Hulbe, Fahnestock, Domack, Burnett, Leventer, Conley, Kirby and Bindschadler2003) focuses on how meltwater assists vertical crevasse penetration (e.g. based on concepts articulated by Reference Van der VeenVan der Veen, 1998a,Reference Van der Veenb, and references therein). The tensile stress required to initiate crevassing, as argued by Reference Scambos, Hulbe, Fahnestock and BohlanderScambos and others (2000), comes from the steady background stresses in the horizontal plane (Txx , Tyy and Txy ) that cause viscous-like ice-shelf spreading (albeit with Glen’s flow law).
The results of our study show that the presence of surface meltwater in supraglacial lakes and, most notably, the absence of surface meltwater from dolines that suddenly drain (most likely by the meltwater-assisted crevasse mechanism outlined by Reference Scambos, Hulbe, Fahnestock, Domack, Burnett, Leventer, Conley, Kirby and BindschadlerScambos and others, 2003) can significantly contribute to the tensile stresses in the horizontal plane that are required to initiate crevassing. The background tensile stress of the Larsen B ice shelf in a configuration several years before its break-up, estimated by Reference Scambos, Hulbe, Fahnestock and BohlanderScambos and others (2000) from an ice-shelf flow model, is 20 kPa (fig. 10 of Reference Scambos, Hulbe, Fahnestock and BohlanderScambos and others, 2000). Our study shows that the presence of meltwater, and its sudden drainage, produces tensile flexure stresses that are 10–100 times larger at a variety of locations, including the surface and base of the ice shelf.
A simple explanation for why dolines are more likely to produce ice-shelf fracture than the lakes from which the dolines originate can be found by considering Archimedes’ principle. For each meter of ice removed from the upper surface of the ice shelf, the Archimedes principle requires that the remaining, underlying ice move (via flexure) 90 cm upward to achieve hydrostatic balance. In comparison, for each meter depth of a freshwater lake on the surface, only 10 cm of downward movement is required to achieve hydrostatic balance. The upward flexure induced by lake drainage is always a factor of 10 larger than the downward flexure induced by the surface meltwater loads that create the doline basin.
We thus argue that the well-recognized relationship between the presence of surface water on ice shelves and their sudden instability includes two important processes: the water-assisted crevasse propagation process, as articulated by Reference Scambos, Hulbe, Fahnestock, Domack, Burnett, Leventer, Conley, Kirby and BindschadlerScambos and others (2003), and the process we describe here, the creation of strong flexure-induced tensile stresses, especially when lakes drain to become dolines. Our results suggest that supraglacial lakes, particularly when arrayed in patterns similar to that observed prior to the break-up of the Larsen B ice shelf (Reference Glasser and ScambosGlasser and Scambos, 2008), induce tensile stress at the ice-shelf surface approaching 100 kPa. Even more significant, when these surface lakes drain, much larger tensile stresses, i.e. exceeding 9 MPa for parameters similar to those on the Larsen B ice shelf, develop at both the ice-shelf surface (on the floors of the dolines) and at the ice-shelf base, adjacent to the point below the rims of the dolines. Thus, we have found a mechanism where standing surface meltwater, and more specifically its sudden drainage, such as observed immediately prior to the break-up event of the Larsen B ice shelf (Reference Scambos, Hulbe, Fahnestock, Domack, Burnett, Leventer, Conley, Kirby and BindschadlerScambos and others, 2003), is capable of adding to the tensile stress regime that contributes to ice-shelf break-up.
What remains to be done in future research is to examine the process of fracture propagation in light of the flexural stresses we have illustrated here. Previous work (e.g. Reference Van der VeenVan der Veen, 1998a,Reference Van der Veenb; Reference Scambos, Hulbe, Fahnestock and BohlanderScambos and others, 2000; Reference Plate, M uller, Humbert and GrossPlate and others, 2012, and references therein) on ice-shelf fracture mechanics has established that water-assisted crevassing can, and does, penetrate the full thickness of ice shelves under circumstances where the only tensile stress is associated with the background spreading stress of the ice shelf, generally <100 kPa. While the flexure stresses described in the present study are sufficiently large in magnitude to create starter fractures on both the ice-shelf surface and base, depending on loading conditions, flexure stress is a strong function of z. Ultimately, even the strongest tensile stress on one surface is coupled with an equally strong compressive stress on the opposite surface. We postulate, based on intuition, that fractures created by ice-shelf flexure will ultimately propagate through the neutral surface (typically the mid-plane of the ice shelf) and continue to grow through the full thickness of the ice shelf, because the z-variation of the flexure-induced stress will follow the interval of unbroken ice, either below the crevasse tip or above. Also, it is possible that fractures started by flexure stresses may continue to propagate via the background stress within the ice shelf, once flexure has been relieved by water-load redistribution and viscous creep. Thus, the background stress regime considered by Reference Scambos, Hulbe, Fahnestock and BohlanderScambos and others (2000) may continue to determine ice-shelf instability, in spite of the presence of temporally varying flexure stresses that can have much larger tensile values. These issues require careful consideration within the context of a fracture-mechanics study.
Conclusion
Reference Scambos, Hulbe, Fahnestock, Domack, Burnett, Leventer, Conley, Kirby and BindschadlerScambos and others (2003) attributed the collapse of the Larsen B ice shelf to a hydrofracturing mechanism enabled by the sudden drainage of many surface meltwater lakes. The results of our study suggest that there is additional significance to the sudden disappearance of surface lakes. In particular, during the brief time (determined by the viscous relaxation of elastic response, 10 days) following the onset of drainage, the ice shelf will likely experience strong tensile flexure stress induced from the hydrostatic rebound caused by the removal of surface meltwater. The tensile flexure stress magnitudes that we estimate in our study can exceed the background spreading stress by orders of magnitude, can occur on both the ice-shelf surface and base, and can produce multiple fractures on the ice shelf if associated with arrays of draining lakes. Our study thus leads to the speculation that the causal connection between ice-shelf surface lake drainage and subsequent ice-shelf break-up may involve more than just the hydrologically assisted fracture process. Drainage of surface lakes by any means, regardless of whether the englacial transit of the water induces fracture, may induce fracture by flexural dynamics.
Acknowledgements
This work is is supported by the US National Science Foundation under grants ANT-0944248, ANT-0838811 and ARC-0934534. We thank Martin O’Leary, Kristopher Darnell and Mac Cathles for valuable discussion. Comments by two anonymous referees and by the scientific editor produced substantial improvements to the scientific quality of the work and to the clarity of the manuscript.
Appendix
Constants used to express the analytic solution for a lake/doline load on an ice shelf under the thin-plate approximation, Ci and Cj in Eqns (7) and (8), are given as follows (Reference Brotchie and SilvesterBrotchie and Silvester, 1969; Reference Lambeck and NatibogluLambeck and Natiboglu, 1980):
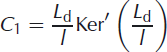
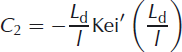

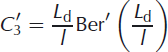
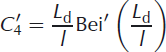
where Ker’(), Kei’(), Ber’() and Bei’() are complex-valued functions given by




and where




and, finally, where Jn(x) is a Bessel function of the first kind, Kn(x) is a modified Bessel function of the second kind and where  .
.



