

CVD is the leading cause of death, with strokes and heart attacks being responsible for approximately 80 % of CVD deaths in the developing world( 1 ). Towards this direction, current guidelines have underlined the importance of early risk estimation, as the first step in identifying individuals at high risk( Reference Eckel, Kahn and Robertson 2 , Reference Marino, Li and Pencina 3 ), so that patients can receive appropriate counselling and treatment. Dietary habits have long been associated with cardiovascular health( Reference Panagiotakos, Pitsavos and Polychronopoulos 4 ), and different dietary strategies have been proposed for reducing the burden of CVD( Reference Mathers 5 ). In the past, the vast majority of studies were focused on single nutrients or foods consumed, instead of adopting a holistic approach by assessing dietary patterns. However, the use of single foods or nutrients is accompanied with two major methodological problems. First, there is a great chance of high level of collinearity among food variables; collinearity tends to inflate the variance of the estimated regression coefficients, as some of the independent variables are totally predicted by the other independent variables. This situation affects the effect size of the regression estimates, producing high standard errors in the related independent variables, thus leading to less robust results. A second problem that may occur in the single-food/nutrient approach is the unknown or unmeasured synergistic effect of specific foods on the investigated health outcome, as foods and nutrients more likely act in synergy, reaching a point where the joint effects of the foods and nutrients work on something other than a simple additive manner( Reference Jacobs and Steffen 6 ). Thus, dietary patterns have been extensively studied in the past years in relation to a variety of health outcomes, including CVD( Reference Mikkila, Rasanen and Raitakari 7 ), whereas pattern recognition analysis has frequently been used in nutritional epidemiology. Two methodologies have been mainly proposed: the a priori and the a posteriori dietary pattern analysis. In brief, in the a priori methodology already known dietary patterns, such as the Mediterranean diet, are used as the ‘gold standard’, and various diet indices (e.g. MedDietScore, Mediterranean Adequacy Index and so on) are used to measure the level of adherence to these predefined patterns. On the other hand, the a posteriori analysis is usually derived through multivariate statistical techniques, such as cluster, principal components or factor analysis( Reference Panaretos, Tzavelas and Vamvakari 8 ).
Apart from the classical statistical approaches for extracting patterns, an alternative approach has been proposed as a pattern recognition and classification methodology, the machine learning (ML)( Reference Mitchell 9 ). ML is a sub-area of artificial intelligence, whose ultimate goal is to devise learning algorithms to do the learning automatically from available data without human intervention or assistance. This area comprises numerous different types of algorithms that can process large amounts of data, such as nutrition information, and ultimately transform data into knowledge, further used to infer some intelligent action or decision. It must be noted that ML is –for the time – being used as an adjunct, to help experts increase their knowledge in a wide range of data and problem fields( Reference Murphy 10 – Reference Svetnik, Liaw and Tong 12 ) and help in decision-making rather than replacing them.
To the best of our knowledge, the use of ML methodologies in assessing nutrition-related disease risk has never been performed. Moreover, until now, no comparative analysis has been performed neither between food and nutrient factors’ predictive ability on disease risk estimation nor between ML methodologies and the statistical approaches. Thus, and under the context of the ATTICA study, the aim of this work was a between-method comparison, that is, statistical v. ML methodologies, as regards their classification ability on evaluating long-term cardiometabolic risk through nutrition patterns’ assessment. Two commonly used ML methodologies were applied: the k-nearest-neighbor’s algorithm and the random-forests (RF) decision tree. The secondary goal was to compare the predictive accuracy of the food patterns with the nutrient patterns’ approach, as well as the accuracy between the ML methods used on cardiometabolic risk.
Methods
Baseline sampling procedure (2001–2002)
The ATTICA study is a large-scale, prospective cohort study carried out in the province of ATTICA, where Athens is a major metropolis (78 % urban and 22 % rural regions)( Reference Pitsavos, Panagiotakos and Chrysohoou 13 ). During 2001–2002, 4056 inhabitants were randomly selected to participate; those with a history of CVD and other atherosclerotic disease, having chronic viral infections or living in institutions were excluded from participation. Of them, 3042 individuals completed the baseline assessment: 1514 were men (18–87 years, 46 (sd 14) years) and 1528 were women (18–89 years, 45 (sd 14) years). All participant interviews were carried out by trained personnel (i.e. cardiologists, general practitioners, dietitians and nurses), who administered standard questionnaires. The study was conducted according to the Declaration of Helsinki guidelines; all procedures involving human subjects were approved by the ethics committee of the First Cardiology Department of the University of Athens. Written informed consent was obtained from all individuals.
Measurements (2001–2002)
Information about socio-demographic characteristics (age, sex and years of school), history of hypertension, hypercholesterolaemia and diabetes, anthropometrics, smoking status, dietary habits and physical activity was collected through face-to-face interviews. Smoking status was evaluated through pack-years of smoking, and those who reported current smokers or have stopped smoking during the preceding year were defined as smokers in this analysis. Physical activity was evaluated using The International Physical Activity Questionnaire, an index of weekly energy expenditure using frequency (times/week), duration (in min) and intensity of sports or other habits (in expended energy content per time); according to this score, participants were classified as at least moderately active during a substantial part of the day or inactive( Reference Papathanasiou, Georgoudis and Papandreou 14 ). Weight (in kg) and height (in m) were measured using standardised procedures, and BMI was calculated as the ratio of weight:height squared.
The dietary evaluation was based on a validated semi-quantitative FFQ, the European Prospective Investigation into Cancer and Nutrition (EPIC)-Greek questionnaire, which was kindly provided by the Unit of Nutrition of Athens Medical School( Reference Katsouyanni, Rimm and Gnardellis 15 ). The questionnaire included questions on the average consumption of 156 food items or beverages commonly consumed in Greece, within the previous year. On the basis of this information, eighteen common food groups were created, based also on their macronutrient composition. Alcohol consumption was measured by daily ethanol intake, in wine glasses (100 ml and 12 % ethanol concentration), whereas coffee intake was measured in cups of coffee (1 cup=250 ml). Using food composition tables and standard portion sizes, the following nutrients were calculated: total fat; MUFA; PUFA, calculated as the sum of n-3 and n-6 fatty acids; SFA, carbohydrates and protein. Ethanol was also calculated.
The 10-year follow-up evaluation (2011–2012)
During 2011–2012, the 10-year follow-up was performed. Of the 3042 participants, 2583 completed the follow-up (85 % participation rate), but a detailed evaluation of the participants’ cardiometabolic status was available in 2020 individuals, who comprised the working sample of this work. For the participants who died during the follow-up, the information was achieved from their relatives, and/or death certificates. The definition of the investigated outcomes was based on International Coding Disease (ICD)-10 version. In particular, information about participants’ health status concerned development of the following: (a): myocardial infarction, angina pectoris, other identified forms of ischaemia (ICD-9 coding (or 10th edition) (410–414.9, 427.2, 427.6 (I20–I25)), and coronary revascularisation (414.01) (i.e. coronary artery bypass surgery and percutaneous coronary intervention); (b) heart failure of different types (400.0–404.9, 427.0–427.5, 427.9, 428.– (I50.2–)) and chronic arrhythmias (I49.–); (c) development of stroke (430–438 (I63.–)); and (d) development of hypertension, hypercholesterolaemia and diabetes. Both at baseline and at the 10-year follow-up, hypercholesterolaemia was defined as total cholesterol levels >5·2 mmol/l or the use of lipid-lowering agents, diabetes mellitus (type 2) as fasting blood glucose≥7 mmol/l or the use of anti-diabetic medication, and hypertension as an average of three consecutive blood pressure measurements ≥140/90 mmHg or use of anti-hypertensive medication. The working sample size was adequate to achieve 92 % statistical power to evaluate the relative risk of 0·70 between the null and the alternative two-sided hypothesis, when the exposure variable was increased by 1 unit and with a significance level (α) of 0·05.
Further details about the baseline procedures and the 10-year follow-up of the ATTICA study can be found elsewhere( Reference Panagiotakos, Georgousopoulou and Pitsavos 16 ).
Development of a combined 10-year ‘Cardiometabolic Health Score’
To quantify the overall 10-year cardiometabolic risk of the participants – that is, incidence of CVD, hypertension, diabetes mellitus and/or hypercholesterolaemia – the Item Response Theory (IRT), using a Rasch model, was applied. By IRT method, a single score was developed using as ‘items’ individuals’ information about their health status (i.e. ‘response’) during the 10-year follow-up. More details about IRT can be found elsewhere( Reference Ximming and Yiu-Fai 17 ). Latent scores were obtained for each participant and then transformed into a 0–100 scale, with higher values indicating lower 10-year cardiometabolic risk (i.e. better health status, which means less likely to have developed a CVD event or another cardiometabolic disorder, hypertension, diabetes or hypercholesterolaemia).
Food and nutrient factors’ derivation
Factor analysis, using the principal component method, was applied in order to identify dietary patterns based on foods or nutrients. The correlation matrix (instead of the covariance) was preferred in order to account for the variety in food or nutrient measurements’ scale. The Kaiser–Meyer–Olkin test (a measure of sampling adequacy for performing factor analysis) was relatively high, that is, 0·61 (greater than the cut-off point of 0·6), indicating a relatively good inter-relationship between the food/nutrient variables that permits to apply factor analysis( Reference Venables and Ripley 11 ). Food groups (see Table 2) that entered in the analysis were coded as servings per month. The orthogonal rotation (with varimax option) was used to derive optimal non-correlated factors (food patterns). The information was rotated to increase the representation of each food to a factor. Parallel analysis was used in order to determine the number of factors retained; this analysis is an alternative technique that compares the scree plots of factors of the observed data with those of a random data matrix of the same size as the original. On the basis of the principle that higher absolute values indicate that the food variable contributes most to the construction of the factor, the patterns were named according to loadings of the foods that correlated most with the factor (i.e. those with loadings >0·3).
For the nutrient factors derivation, the same methodology was applied. Seven major nutrients were selected and studied (see Table 2).
Statistical analysis
Linear regression analysis was performed to investigate the associations of factors (food and nutrient patterns) on Cardiometabolic Health Score, taking into consideration sex, age, BMI, physical activity and smoking (presented as b-coefficients, standard errors and standardised β-coefficients). The assumptions of linearity for the continuous independent variables and constant variance of the standardised residuals were assessed through plotting the residuals against the fitted values; collinearity between the independent variables was evaluated using the variance inflation factors. R 2 was calculated to find how well each fitted model predicted the dependent variables (the higher the R 2, the better the model fits the data), and is indicative of the percentage of the variance in the dependent variable that the independent variables explain collectively. Akaike information criterion (AIC) was used to compare the accuracy of statistical modelling, with lower values indicative of a more predictive model. All reported P values were based on two-sided tests. R software (version 3.4.3, 2017) was used for all statistical calculations.
Machine-learning analysis
ML techniques, that is, k-NN and RF algorithms, were applied to computationally extract information from ATTICA database; thereafter, a food model and a nutrient model were created for each examined ML algorithm. The k-NN algorithm is one of the most efficient classifiers with various applications, from text mining( Reference Bijalwan, Kumar and Kumari 18 ) to bioinformatics( Reference Ge 19 ). Mathematically, k-NN classifies a sample to a specific class, by using its k nearest neighbors; thus, each sample is placed among its k ‘closest’ samples and is assigned a class based on the majority of the neighbours. RF, on the other hand, is the least prone to over-fitting( Reference Breiman and Cutler 20 ), ‘tree-based’ classifier, which classifies a sample by creating multiple trees, with each tree giving an independent classification. The final classification is the one having the most votes. Each sample was categorised into one out of five disjoint classes based on the developed Cardiometabolic Health Score. ML analysis was started by dividing the available data into two non-overlapping sets: the first set (training) was used for the training of the models, whereas the second (testing) was kept in order to evaluate the model performance. To ensure that the data categorisation into training and testing sets was representative, multiple holdout samples were used. To ensure the single use of each record, k-fold cross-validation (k-fold CV) was used, dividing the data into k completely separate random partitions, called folds. Owing to the fact that k-NN is based on the Euclidean distance and some of the data set’s numeric variables were in a larger scale than others, it was necessary that all numeric values be normalised to 1, so that each variable has the same impact on the multi-dimensional feature space. Next, 10 different folds were created, each containing 10 % of the total data. For each fold, the k-NN model was built from 90 % of the fold data, and the remaining 10 % was used to evaluate the produced model. For RF classifier, no normalisation was necessary. Similarly, the same ten different folds were used. For each fold, an ensemble of trees (called forest) was created and the model decided on the categorisation of a sample, through voting. The accuracy of each ML method was calculated as the ratio of the sum of true positive and negative calls divided by the number of samples. For both classifiers, as 10-fold CV was used, once all ten models were produced and evaluated, the average of all accuracies for each fold gave the overall classifier accuracy. All the implementations were carried out in R language, using in-house scripts and the R-packages ‘Class’, ‘Random Forest’ and ‘Caret’. The procedure of creating the folds and using each different fold to train and evaluate the classifier is computationally expensive. However, each fold evaluation is independent of all the other ones, and thus original specialised code was written to parallelise it into different computer cores, retaining the time cost of the ML procedure significantly low.
Results
The baseline characteristics of the participants, as well as the 10-year incidence of CVD, hypertension, diabetes and hypercholesterolaemia, overall and by Cardiometabolic Health Score tertile, are presented in Table 1. The mean Cardiometabolic Health Score was 59·8 (sd 36·3) for men and 61·2 (sd 35·7) for women, suggesting a better 10-year cardiometabolic health status of women compared with men (P<0·001).
Baseline characteristics and 10-year incidence of CVD, hypertension, diabetes mellitus and hypercholesterolaemia of the ATTICA study’s participants according to the Cardiometabolic Health Score tertilesFootnote *(Numbers and percentages; mean values and standard deviations)
* The calculated percentages refer to the actual number of participants for each variable; therefore, in some cases they may decline from the total sample owing to missing information).
† Incidence of type 2 diabetes mellitus was calculated based on 1096 participants who were free of diabetes at baseline with available blood glucose measurements or medication use at follow-up.
‡ Incidence of hypertension was calculated based on 866 participants who were free of hypertension at baseline with available blood pressure measurements or medication use at follow-up.
§ Incidence of hypercholesterolaemia was calculated based on 746 participants who were free of hypercholesterolaemia at baseline with available total cholesterol measurements or medication use at follow-up.
Linear regression (food v. nutrient patterns) and cardiometabolic risk estimation
Factor analysis extracted five food patterns that explained 54 % of the total variation in intake. The loadings of the five food patterns are presented in Table 2. According to the extracted loadings (values >0·3) and their signs (positive or negative), factors were characterised by predominantly higher consumption of the following food groups:
(1) Factor 1: fruit, vegetables, cereals, legumes and fish.
(2) Factor 2: meat and poultry.
(3) Factor 3: sweets, dairy products, potatoes and eggs, but lower consumption of soft drinks.
(4) Factor 4: butter, and alcohol, but lower consumption of other added fat.
(5) Factor 5: seed oil, but lower consumption of olive oil.
Factor loadings of foods and nutrients consumed by the ATTICA study participants (n 2020) as derived from the factor analysis using the principal component method

* Loadings are similar to the correlation coefficients, with higher absolute values indicative of higher correlation between the (food) variable and the respective factor. According to the calculated loadings of each factor, the food patterns were mainly characterised by increased consumption of fruit, vegetables, cereals, legumes and fish (factor 1); increased consumption of total meat, red meat and poultry (factor 2); increased consumption of sweets, dairy products, potatoes and eggs and decreased soft drinks consumption (factor 3); increased consumption of butter and alcohol, but decreased consumption of other added fat (i.e. margarine) (factor 4); increased seed oil, but decreased olive oil consumption (factor 5). The nutrient patterns were mainly characterised by increased intake of SFA and protein (factor 1), increased intake of MUFA and PUFA, but decreased intake of carbohydrates (factor 2), and increased intake of ethanol and total fat (factor 3).
† Values with loadings >0·3 represent the foods/food groups that correlate most with each factor.
Factor 1 was the most dominant food pattern and explained 13 % of the total variation. Each of the remaining four factors explained 8 % (factor 5) to 12 % (factor 2) of variation in intake. Regression analysis revealed that only age and BMI were inversely associated with Cardiometabolic Health Score; that is, increased age and BMI were associated with worsened health status at the 10-year follow-up, with age having the strongest effect (highest β-coefficient) ( Table 3).
Results from multiple linear regression models that evaluated the associations between food and nutrient factors and the 10-year Cardiometabolic Health Score (the higher the score the better the health status), among the 2020 ATTICA study participants

AIC, Akaike information criterion.
*Food patterns were mainly characterised by increased consumption of fruit, vegetables, cereals, legumes and fish (factor 1); increased consumption of total meat, red meat and poultry (factor 2); increased consumption of sweets, dairy products, potatoes and eggs and decreased soft drinks consumption (factor 3); increased consumption of butter and alcohol, but decreased consumption of other added fat (i.e. margarine) (factor 4); increased seed oil, but decreased olive oil consumption (factor 5). The nutrient patterns were mainly characterised by increased intake of SFA and protein (factor 1), increased intake of MUFA and PUFA, but decreased intake of carbohydrates (factor 2), and increased intake of ethanol and total fat (factor 3).
Similarly, factor analysis using nutrients (i.e. total fat, MUFA, PUFA, SFA, protein, carbohydrates) was performed. The analysis resulted in the extraction of 3 factors that explained 65 % of the total variation in intake (Table 2). The predominant nutrients for each derived factor were the following:
∙ Factor 1: higher intake of SFA and protein.
∙ Factor 2: higher intake of MUFA and PUFA, but lower intake of carbohydrates.
∙ Factor 3: higher intake of ethanol and total fat.
Specifically, factor 1 was the most dominant nutrient pattern and explained 26 % of the total variation in intake, whereas factors 2 and 3 explained 23 and 16 % of variation, respectively. Similarly with regression analysis of foods, in this case as well, only age and BMI were inversely associated with Cardiometabolic Health Score (Table 3). From the regression analysis, it was also revealed that both models (using food or nutrient patterns) were similar in terms of their explanatory ability (adjusted R 2=9·6 % v. adjusted R 2=8·3 %, P<0·01). In addition, the AIC, which was used to evaluate models’ predictive accuracy, was almost equal in both models (AIC=20 102 v. AIC=20 105, respectively).
Machine learning (k-NN v. random forest methods) and cardiometabolic risk estimation
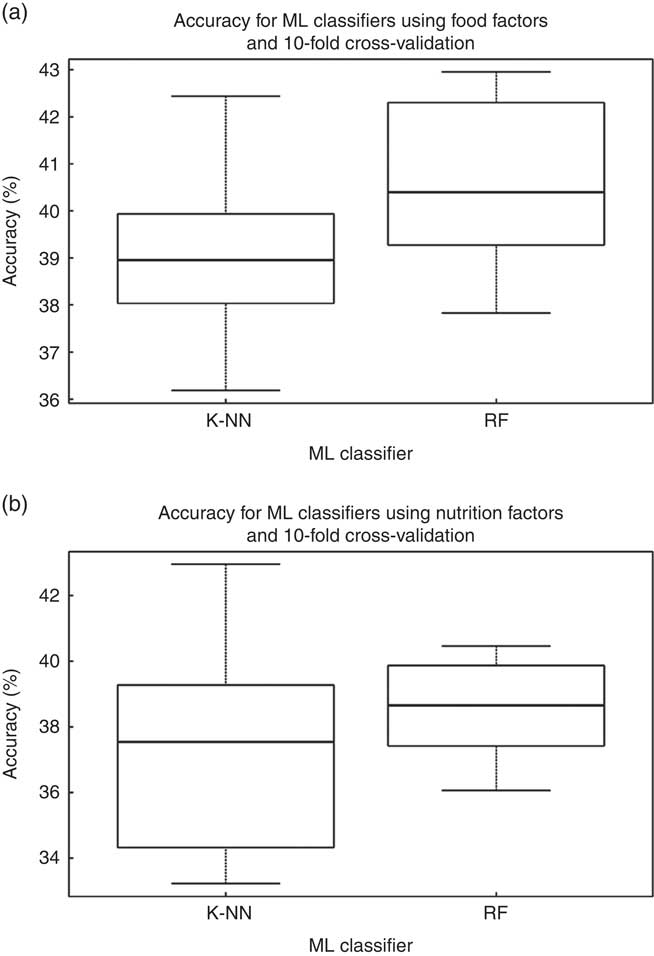
Using the Cardiometabolic Health Score as the outcome, the two different ML classifiers of k-NN and RF were tested against all samples, twice (i.e. using as input data set the dominant food factors and once more using the nutrient factors). The mean accuracy for the k-NN model based on food patterns was 40 % (i.e. 40 % of the members of the evaluation subset were assigned by the ML classifier the same tertile as the one assigned by the Cardiometabolic Health Score) (Fig. 1). The mean accuracy using the RF classifier was 41 %. For models based on nutrient patterns, k-NN model was 37 % accurate and the RF was 38 % accurate, respectively (Fig. 2). Moreover, the true positive scores, as a percent of the total population, for the food patterns were 39 % for the k-NN model and 40 % for the RF classifier, whereas for the nutrient patterns they were 37 % for the k-NN model and 37 % for the RF classifier. The true negative scores for the food patterns were 82 % for the k-NN model and 82 % for the RF classifier, and for the nutrient patterns they were 79 % for the k-NN model and 79 % RF classifier.
Accuracy for the two different classifiers presented (k-NN and random forest (RF)), using as input for the model construction (a) the food factors and (b) the nutrition factors. ML, machine learning.
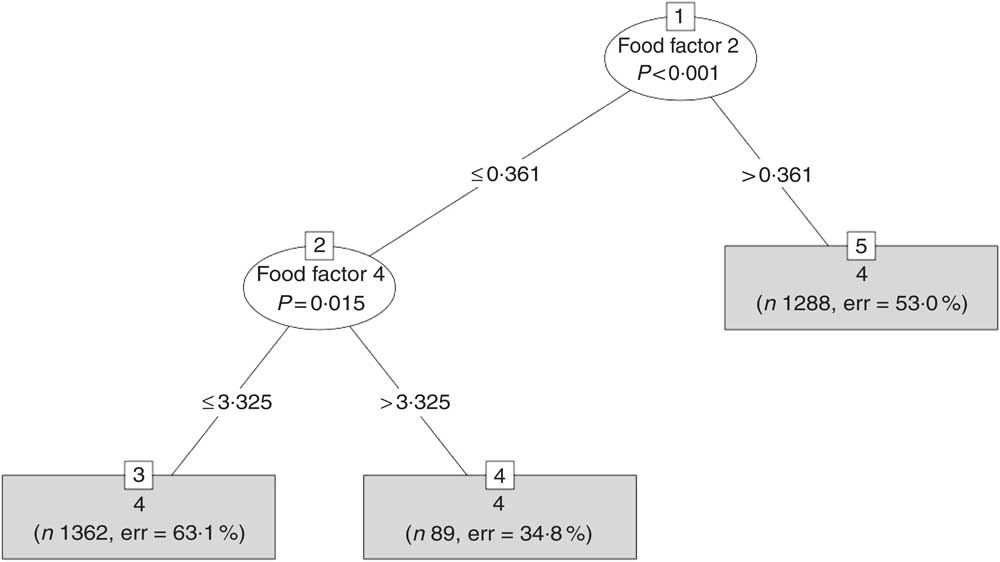
A typical tree created by the random forest (RF) method for the model using the food factors. RF creates an ensemble of trees and each one has one vote and the model decides on the classification of each sample using the majority rule.
Linear regression v. machine learning and cardiometabolic risk estimation
The comparison between linear regression and ML was based on the accuracy of the derived models using the tertiles of the Cardiometabolic Health Score. Specifically, each individual was assigned to a tertile according to the predicted Health Score values derived from the two linear regression models (the one that was based on the food patterns and the other that was based on the nutrient patterns), as well as through the ML methods. The accuracy (i.e. classification of an individual to the correct Cardiometabolic Health Score tertile) of each regression model was 22 % for the food patterns and 16 % for the nutrient patterns model, which was much lower as compared with the aforementioned accuracy rates (i.e. 37–41 %) observed using the ML methods.
Discussion
In this work, the 10-year combined cardiometabolic risk was evaluated in relation to dietary patterns, using both statistical and ML methodologies. On the basis of factor analysis, food and nutrient pattern were derived and showed similar accuracy in correctly classifying the individuals at CVD risk classes, suggesting that either approach is suitable and can be used depending on each study’s goals. The comparison of the two ML methodologies (k-NN and RF) also yielded similar results about the predictive accuracy of diet-pattern approaches. However, the between-method comparison (statistical v. ML techniques) revealed that the computer intelligence method (i.e. ML) surpasses that of the typical linear regression in correctly classifying individuals to the cardiometabolic risk score class. This can be attributed to the fact that ML techniques create more ‘complex’ models, as they take into consideration all available information from a part of the data, understand more adequately their intra-relationships and more accurately predict information about the remaining data. Despite the limitations of the present observational study, the large, representative sample, the prospective design and follow-up of 10 years, as well as the detailed assessment of dietary and other lifestyle and clinical information, may guarantee that the reported findings are robust, and of considerable public health and clinical importance, as they shed light into different methodologies that are used or may be used in diet pattern analysis and health risk evaluation.
Applying factor analysis, separately for foods and nutrients, five and three factors were derived, respectively, which were studied in relation to the overall cardiometabolic risk of the participants. The derived patterns highlighted common dietary habits of people, like for example the food pattern that described factor 1, which reflected a ‘healthy’ diet rich in fruit, vegetables, legumes, cereals and fish, or the food pattern of factor 5 that characterised individuals who preferred to use seed oil instead of olive oil, which is also a common dietary behaviour. As regards nutrients, the pattern that described factor 1 highlighted another common dietary behaviour – that of increased SFA and increased protein intake too (Table 2). However, in this work no significant associations were revealed for any of the derived food/nutrient factors, a fact that may be attributed to the synergies that occurred of foods and nutrients on the combined cardiometabolic risk when building the factors. Generally, dietary pattern approach has been suggested as superior compared with single-food/nutrient approach, by capturing overall dietary habits and potential synergistic/antagonistic effects of foods and nutrients, and by this way for giving the true ‘picture’ about the diet–disease association( Reference Hu 21 – Reference Waijers, Feskens and Ocké 23 ). To the best of our knowledge, this is the first comparative analysis regarding the predictive accuracy of nutrient and food patterns on a health outcome, with the two models – that is, the one used food patterns v. the other used nutrient patterns – showing similar ability to predict cardiometabolic risk. Similar predictive accuracy between the two diet pattern approaches was also reported for the ML methodologies.
With regard to the comparison between the different methodologies (regression models v. ML), ML methods outperformed the statistical methods in terms of correct classification. Similar to our findings, Kim et al.( Reference Kim, Merrill and Arvind 24 ) found ML techniques more accurate than benchmark ASA scores for identifying risk factors of developing complications following posterior lumbar spine fusion. The two approaches, statistical and ML, can be considered somehow as the two sides of the same coin, as they both aim at classifying data (i.e. individuals in health status classes). However, the underlying models are different. In the statistical approach, a probabilistic model is built, based on the assumption that the provided data are a subset of a larger population that can be described by a model. First, a simple model is preferred over a complex one as long as there is an acceptable performance. Moreover, human intervention is considered essential in every stage of the overall build of the model. On the other hand, ML emphasises more on predictions, and thus the efficiency is evaluated by prediction performance. The main target of ML is to create a model, usually more complex compared with statistical approaches, that can be used to classify the data. However, in ML, the model construction and overall operation is assumed to be as ‘free’ as possible from human intervention. Unfortunately, ML methodology does not provide any statistical metrics of significance in order to evaluate the association of the input variables with the outcome (e.g. the combined cardiometabolic score), such as in the regression analysis. The input variables, that is, food/nutrient patterns, entered in the ML classifiers and each individual were classified into one of the Cardiometabolic Health Score classes, but no indication of the role of each input variable on the outcome could be provided.
However, some limitations of the study should be acknowledged. The baseline nutritional evaluation was performed once and may be prone to measurement error or influenced by seasonal variation and reproducibility of the collected information. However, the FFQ has been found reproducible and reliable, while the sampling took over a year, and therefore included, on average, food choices during all seasons. The rate of loss to follow-up was about 15 % and mainly attributed to the wrong or missing contact information at baseline, which, however, has not influenced the findings (no significant differences in the baseline characteristics were observed between those who participated in the 10-year follow-up and those who were lost). The lack of a direct statistical comparison between statistical v. ML techniques may also limit the interpretation and generalisation of the results. Finally, residual confounding owing to unmeasured factors always exists in epidemiological analyses.
Conclusion
In nutritional epidemiology, food or nutrient pattern recognition analysis has emerged as a cornerstone method when examining the relationship between diet and disease, taking into consideration the impact of diet as a whole. With respect to the predictive accuracy of the two dietary assessment approaches, they were found equal in cardiometabolic risk estimation. The same was reported when comparing ML methodologies using both food and nutrient factors; however, when ML approaches were compared with benchmark statistical techniques, they achieved better accuracy in sample classification, suggesting that ML methods may emerge as a valuable and helpful tool in the field of nutritional epidemiology, leading to a more accurate disease risk estimation, the first and most important step before intervention.
Acknowledgements
The authors would like to thank the filed investigators of ‘ATTICA’ study: Natassa Katinioti, Akis Zeimbekis, Spiros Vellas, Dina Massoura and Lambros Papadimitriou for their assistance in physical examination; Charalabos Papageorgiou and Efi Tsetsekou for their assistance in psychological evaluation; Marina Toutouza, George Dedoussis, Carmen Vassiliadou, Constadina Tselika and Sia Poulopoulou for their assistance in biochemical and genetic evaluation; Manolis Kambaxis for the nutritional evaluation; and Maria Toutouza for the database management.
The ATTICA study was supported by research grants from the Hellenic Cardiological Society (HCS2002). This paper has been conducted within the Ageing Trajectories of Health: Longitudinal Opportunities and Synergies (ATHLOS) project. The ATHLOS project has received funding from the European Union’s Horizon 2020 research and innovation programme under grant agreement no. 635316. This research has been financially supported by the General Secretariat for Research and Technology and the Hellenic Foundation for Research and Innovation.
E. K. and D. P. performed data analysis. A. C. D. performed machine-learning analysis. G.-M. K. reviewed the paper. E. K., D. P. and A. C. D. interpreted the results. C. P., M. V. and G. T. supervised statistical analyses. D. B. P. designed the ATTICA study. C. P., M. V., G. T. and D. B. P. critically reviewed the manuscript. E. K., D. P., A. C. D., G.-M. K., C. P., M. V., G. T. and D. B. P. approved the final version of the manuscript. All authors state that they take the responsibility for all aspects of the reliability and freedom from bias of the data presented and their discussed interpretation.
None of the authors has any conflicts of interest to declare.


