




1. Introduction
Lexical stress in English is phonemic, and a shift of the stressed syllable can change a word’s part‑of‑speech and semantic meaning. For instance, CONduct (noun) and conDUCT (verb) only differ in stress placement: trochaic contours implicate nouns, while iambic contours are found in verbs. It has been well‑documented that native English speakers use multiple acoustic cues for implementing such contrasts in production (Fry Reference Fry1955, Reference Fry1958): stressed syllables have more prominence as they tend to have higher pitch (F0), greater intensity, longer duration, as compared to unstressed syllables. Beyond these three suprasegmental cues, stressed syllables tend to have a full vowel quality, while the vowels in unstressed syllables often have a reduced quality, which could be transcribed using a schwa. Research has shown that listeners actively attend to multiple cues for determining the placement of stress (Chrabaszcz et al. Reference Chrabaszcz, Winn, Lin and Idsardi2014; Payne et al. Reference Payne, Maxwell, Fuchs and Wang2023; Zhang and Francis Reference Zhang and Francis2010). For instance, American English speakers show high sensitivity to vowel quality alternation (e.g., [mabə] vs [məba]) and tend to interpret the syllable with a full vowel as stressed (Chrabaszcz et al. Reference Chrabaszcz, Winn, Lin and Idsardi2014); at the same time, differences in pitch, duration, and intensity also affect speakers’ stress assignment when other variables are controlled, e.g., in [ma :ba] vs [maba:], where the long vowel is more likely to be interpreted as signalling the stressed syllable.
For second language (L2) or English as a second language (ESL) speakers, stress‑based minimal pairs can be challenging especially when the listener’s native language (L1) does not have an English‑like stress system, which leads to potential first language interference (Best Reference Best and Strange1995; Flege Reference Flege and Strange1995), and a well‑documented example is the stress‑deafness in L1 French listeners (Dupoux et al. Reference Dupoux, Peperkamp and Sebastián–Gallés2001; Tremblay Reference Tremblay2009): since French phonology does not implement lexical stress contrasts, L1 French listeners show poor performance in auditory discrimination and phoneme recall experiments for stress‑based minimal pairs, and this poses a challenge for language learning of stress languages such as English or Spanish. Even when L2 listeners show a level of differentiation, they do not necessarily attend to the same set of acoustic cues as native speakers do, e.g., L1 Mandarin Chinese listeners could also differentiate different stress patterns based on vowel quality changes and pitch levels, but they showed less sensitivity to intensity and duration cues; L1 Russian listeners showed sensitivity to vowel quality, intensity and duration differences, but not necessarily pitch levels (Chrabaszcz et al. Reference Chrabaszcz, Winn, Lin and Idsardi2014). It is worth pointing out that sensitivity to acoustic cues in perception experiments does not mean that speakers (especially ESL speakers) also implement these cues in speech production.
Mandarin Chinese is sometimes argued to have a stress system correlated with pitch reduction in unstressed syllables (Duanmu Reference Duanmu2007) and there are contrastive items such as [taːHL.iːHL] ‘main idea’ vs [taːHL.i∅] ‘careless’ (both written as大意) for some speakers, where HL indicates a falling tone, and ∅ indicates a reduced/neutral tone. The unstressed syllables also have vowels with shorter durations compared to stressed syllables, but the vowel quality is generally stable. However, Mandarin Chinese does not have iambic contours as in English. These phonological differences may contribute to L2 production via first language interference. A body of research has been carried out to investigate the phonetic implementation of English lexical stress in experienced Chinese ESL speakers (Chrabaszcz et al. Reference Chrabaszcz, Winn, Lin and Idsardi2014; Guo Reference Guo2022; Kim et al. Reference Kim, Bishop and Whalen2025; Li and Grigos Reference Li and Grigos2023; Qin at al. Reference Qin, Chien and Tremblay2017; Zhang et al. Reference Zhang, Nissen and Francis2008; Zhang and Francis Reference Zhang and Francis2010). For instance, Zhang et al. (Reference Zhang, Nissen and Francis2008) investigated Chinese ESL speakers’ production in words in isolation after giving explicit instruction for the speakers to intentionally shift between trochaic and iambic contours, e.g., CONtract vs conTRACT. Under this setting they reported that Chinese ESL speakers successfully implemented pitch, intensity, and duration, as all three cues showed significant differences between the two contours (or parts‑of‑speech, PoS). For vowel qualities, Chinese ESL speakers sometimes showed a lack of reduction in the first syllable of some words (e.g., con‑ in contract, and ob‑ in object) and sometimes showed unexpected reduction in second syllables (e.g., ‑tract in contract, and ‑mit in permit). Despite the fact that vowel quality was more variable in their production data, other studies find that Chinese EFL listeners generally show sensitivity to vowel quality features in perception, similar to native speakers (Chrabaszcz et al. Reference Chrabaszcz, Winn, Lin and Idsardi2014; Zhang and Francis Reference Zhang and Francis2010), indicating that accurate perception does not guarantee native‑like production for lexical stress.
In a more recent study, Guo (Reference Guo2022) used a similar method to investigate the production of stress‑based minimal pairs in isolation by Chinese ESL speakers with different additional dialect backgrounds. As such, speakers produced minimal pairs (e.g., PREsent vs preSENT) with the help of context sentences (for indicating part‑of‑speech) as well as the stress shifting‑rule in English. The results from this study largely replicated the findings in Zhang et al. (Reference Zhang, Nissen and Francis2008), showing that Chinese ESL speakers, irrespective of their additional dialect background, displayed significant differences between nouns and verbs for implementing pitch, intensity, and duration cues. The overall pattern in ESL speakers was consistent with a group of native American English speakers, although the absolute values showed some differences across language groups as well as Chinese dialect groups. Another recent study (Li and Grigos Reference Li and Grigos2023) used a nonword repetition paradigm, where Chinese ESL speakers were instructed to repeat a pseudoword (e.g., /ˈpʌpəp/ vs /pəˈpʌp/) in isolation. It was not mentioned whether the stress‑shifting rule was explained to the participants, but under this setting it was very likely that the speakers were aware of the main purpose of their study. The authors analysed the ratio scores between the first and second syllables for pitch, intensity, and duration, and again found sharp differences between the trochaic and iambic versions (which correspond to nouns and verbs in English minimal pairs), suggesting that Chinese ESL listeners successfully implement these three cues for stress‑based minimal pairs in English. However, a clear limitation of these studies is that the ecological validity of production is compromised for analytical simplicity in the elicitation procedure: when speakers are instructed to produce a shift between iambic and trochaic contours, it is likely that they will follow the instruction, but data collected from these experiments do not reflect their authentic language use. For this reason some researchers suggest that sentence reading tasks might be more appropriate for elicitation; indeed, a recent report suggests that when Chinese ESL speakers produce these minimal pairs in sentences, they show differences in suprasegmental features but not vowel quality modifications (Kim at al. Reference Kim, Bishop and Whalen2025). To address the research gap mentioned above and to offer new evidence from a task with more ecological validity, we tested stress production in a sentence reading task with minimal instructions (without telling the participants the purpose of the analysis). More specifically we explore two research questions:
• RQ 1: Which suprasegmental cues do Chinese ESL speakers implement in producing English stress minimal pairs during sentence reading?
• RQ 2: Do Chinese ESL speakers show evidence of vowel quality modification in producing English stress minimal pairs during sentence reading?
2. Study
2.1 Participants
Fourteen female native Mandarin Chinese speakers participated in the current study. All spoke English as a second language (ESL). Their ages ranged from 23 to 30 years old (M = 24.57, SD = 2.44). At the time of the study, all were residing in Melbourne, Australia. All participants had taken an IELTS test (International English Language Testing System) within one year prior to the study, and their scores ranged from 6.0 to 7.5 (M = 6.96, SD = 0.46), indicating that they were relatively proficient users of English. On average, they had an average length of English learning of 14.93 years (SD = 3.32). All were born and raised in China and spoke Mandarin Chinese as their first language/L1, and they had not been exposed to English environments until receiving formal English education in public schools in China. None of them had had immersive English learning before moving to Australia. Additionally, Mandarin was the only language used in their families, and Mandarin Chinese and English were the only two languages they could speak fluently. Another female monolingual Australian English speaker (age = 22) was recruited as a native speaker demonstrator, although we did not aim to directly statistically compare Chinese ESL speakers and the Australian English variety given the scope of the current study.
2.2 Stimuli and procedures
The stimuli used in the current study were eight English words, including conflict, permit, suspect, object, subject, conduct, extract and contract. Each stimulus word created a noun‑verb minimal pair with a trochaic or iambic contour. We created total of 16 sentences as the reading material for Chinese ESL speakers, and the list of sentences are available in Appendix 1. Participants completed a sentence‑reading task in a quiet room. Speech was recorded using a Tascam DR‑40 digital recorder at a 44.1 kHz sampling rate and 16‑bit mono resolution. A unidirectional microphone was positioned approximately 20 cm from the participant’s lips at a 45° horizontal angle. Participants were given instructions on the task procedure but were not informed about the rules of stress alternation between the first and second syllables of the noun‑verb pairs. Sixteen experimental sentences were compiled into a list, with each sentence presented individually on a MacBook laptop slide. One researcher manually advanced the slides: once a participant produced the sentence in full, the next sentence appeared. Sentences were presented in pseudorandom order, with identical items prevented from occurring consecutively. No explicit instruction was provided regarding English stress placement. The entire sentence list was read three times. This yielded a total of 672 tokens from the Chinese speakers (16 sentences × 14 participants × 3 repetitions). Following the production task, participants completed a language background questionnaire, which gathered demographic details, language history and learning experiences.
2.3 Measurement and data analysis
Acoustic analysis was conducted in Praat v6.3 (Boersma and Weenink Reference Boersma and Weenink2023). For each target word, the onset and offset of each vowel were manually segmented based on the periodic waveform. If a syllable began with a plosive, the vowel onset was marked at the release following the closure. The vowel offset was defined at the point where the complex waveform ended and the energy of the second formant (F2) diminished. Pitch (F0), intensity, and formant values were extracted at the temporal midpoint of the vowel. The following acoustic measures were obtained: F0 (Hz), intensity (initially in dB, then converted to power amplitude), duration (ms), F1 (Hz), and F2 (Hz). Following Li and Grigos (Reference Li and Grigos2023), a stress ratio (first/second syllable) was calculated for each acoustic parameter. Ratios greater than 1.0 generally indicated a trochaic (strong‑weak) pattern, whereas ratios close to or below 1.0 suggested an iambic (weak‑strong) pattern. Data from the native Australia English speaker were used as a benchmark to validate the task and confirm that the procedure elicited expected English stress patterns. Statistical analyses were carried out in R and R Studio (R Core Team 2023). Linear mixed‑effects models were fitted using the lmerTest package (Kuznetsova et al. Reference Kuznetsova, Brockhoff and Christensen2017). No outliers were identified, resulting in a dataset of 672 tokens. Separate models were constructed for each dependent variable (duration, pitch, intensity, vowel quality ratio). Fixed effect was from the part of speech (PoS, noun vs. verb) category, and random intercepts were specified for both participants and target words, as well as the location of the word in the sentence.
3. Results
3.1 Pitch, intensity and duration ratios
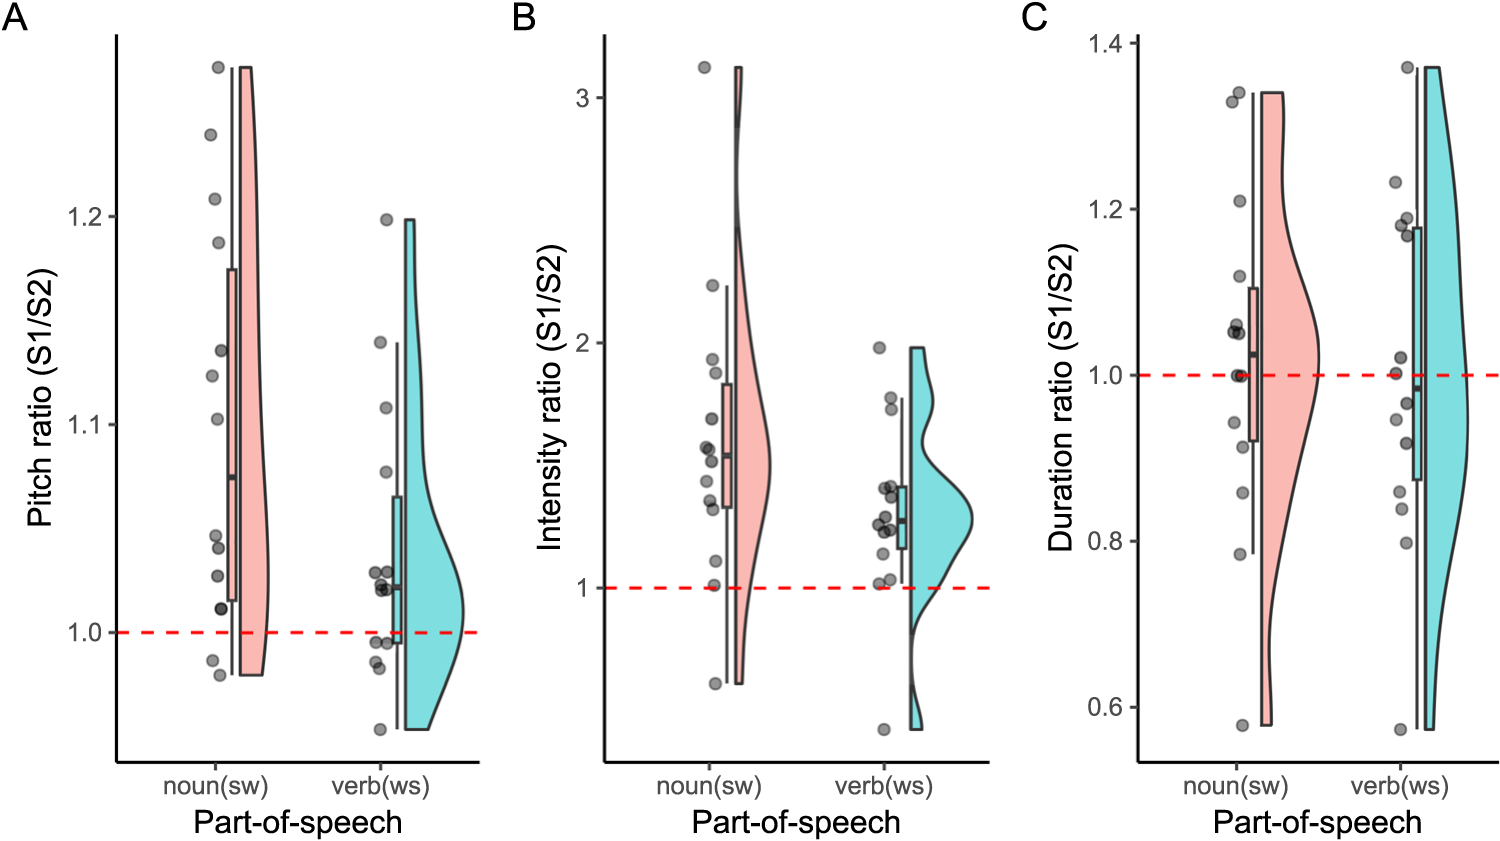
The descriptive result of the acoustic measurement is presented in Table 1, including the mean, standard deviation, and range of ratio scores of pitch, intensity and duration in trochaic and iambic minimal pairs (e.g., CONduct vs conDUCT). We also reported the ratio scores from productions of a female Australian English speaker for a comparison, although we do not aim to directly compare these two varieties. For Chinese speakers, the individual values and their distribution are also visualised in the box‑violin plots in Figure 1, where the horizontal line at 1.0 on the y‑axis indicates equal values between the first and second syllables. For each ratio score of the three acoustic correlates, we fitted a linear mixed‑effects model (LMM; Ratio ∼ Part‑of‑speech + [1 + Part‑of‑speech | Speaker] + [1 | Word] + [1 | Location]), which captured the Part‑of‑speech (PoS) effect whilst controlling the random effects from speaker and word items.
Box-and-violin plots of ratio scores in Chinese speakers’ phonetic implementation in English minimal pairs. Nouns have trochaic, strong-weak contours, while verbs have iambic, weak-strong contours. Red line at 1.0 indicates no difference.

Figure 1 Long description
The image A showing a box-and-violin plot with the vertical axis label “Pitch ratio (S1/S2)” and tick labels 1.0, 1.1 and 1.2. A dashed horizontal line is drawn at 1.0. The horizontal axis label is “Part-of-speech” with two category labels: “noun(sw)” and “verb(ws)”. Each category has a violin shape, a box with a median line and multiple circular data points. The “noun(sw)” distribution and box are positioned mostly above the dashed line at 1.0, with points extending above the 1.2 tick. The “verb(ws)” distribution and box are centered close to the dashed line at 1.0, with points extending above the 1.1 tick. The image B showing a box-and-violin plot with the vertical axis label “Intensity ratio (S1/S2)” and tick labels 1, 2 and 3. A dashed horizontal line is drawn at 1. The horizontal axis label is “Part-of-speech” with two category labels: “noun(sw)” and “verb(ws)”. Each category has a violin shape, a box with a median line and multiple circular data points. The “noun(sw)” distribution and box are positioned above the dashed line at 1, with points extending above the 3 tick. The “verb(ws)” distribution and box are positioned above the dashed line at 1, with points extending to around the 2 tick. The image C showing a box-and-violin plot with the vertical axis label “Duration ratio (S1/S2)” and tick labels 0.6, 0.8, 1.0, 1.2 and 1.4. A dashed horizontal line is drawn at 1.0. The horizontal axis label is “Part-of-speech” with two category labels: “noun(sw)” and “verb(ws)”. Each category has a violin shape, a box with a median line and multiple circular data points. The “noun(sw)” distribution and box are centered around the dashed line at 1.0, with points extending down near the 0.6 tick and up above the 1.2 tick. The “verb(ws)” distribution and box are centered around the dashed line at 1.0, with points extending down near the 0.6 tick and up near the 1.4 tick. Across A, B and C, the same two part-of-speech categories are compared against a dashed reference line at 1.0 and the circular points show individual observations overlaid on the box-and-violin shapes.
Descriptive means of the ratio scores of pitch, intensity, and duration in Chinese speakers and an Australian speaker

Table 1 Long description
The table reports ratio means with standard deviations and ranges for pitch, intensity, and duration, split by speaker group (Chinese EFL and Australian) and part of speech (noun trochaic, verb iambic). For pitch, Chinese EFL ratios are similar for nouns and verbs (noun 1.100, verb 1.040), while the Australian speaker shows a clearer drop from noun 1.091 to verb 0.903. For intensity, Chinese EFL values are higher and more variable (noun 1.600 with SD 1.360; verb 1.310 with SD 0.883) than the Australian values, which cluster near 1 with very small variability (noun 1.034 with SD 0.020; verb 0.968 with SD 0.016). For duration, Chinese EFL ratios are near 1 for both parts of speech (noun 1.020; verb 1.000) with wide ranges, whereas the Australian speaker shows a strong contrast, with longer nouns (1.354) and shorter verbs (0.754). Across measures, the Australian speaker tends to show more consistent noun–verb differentiation, especially for duration, while Chinese EFL speakers show larger spread in several ranges. Interpret comparisons cautiously because one group represents multiple Chinese EFL speakers while the Australian data appear to come from a single speaker, and some intensity ranges look inconsistent with their reported means.
For pitch ratio, we carried out a Type II Wald F tests with Kenward‑Roger correction, which revealed a significant effect of PoS [F(1, 12.24) = 7.14, p = .0200], indicating that nouns (e.g., CONduct; M = 1.10) had higher pitch ratios than verbs (e.g., conDUCT; M = 1.04). The difference had a relatively small effect size, Cohen’s d = 0.290. Next, we also tested each distribution against the baseline at 1.0 using estimated marginal means. This time, the pitch ratio of nouns was significantly higher than 1.0 [t(15.4) = 3.416, p = .0037], but the pitch ratio of verbs was not [t(12.4) = 1.787, p = .0982]. For a post hoc and indirect comparison, the Australian speaker produced a slightly different pattern: nouns had a pitch ratio over 1.0 (M = 1.091), while verbs had a pitch ratio under 1.0 (M = 0.903).
As for intensity ratio, we again found a significant effect of PoS [F(1, 16.99) = 5.67, p = .0293], with nouns having higher intensity ratios than verbs (M = 1.61 and M = 1.33, respectively), and the difference again had a small effect size, Cohen’s d = 0.252. As with pitch scores, we also tested the distribution of the intensity ratio against the baseline at 1.0 using estimated marginal means. The results suggest that nouns have intensity ratios higher than 1.0 [t(16) = 3.093, p = .0070]; the effect did not reach the significant level but with a very small p‑value for verbs [t(11) = 2.068, p = .0630], indicating that the first syllable was often louder than the second syllable, irrespective of PoS, although there was still a relative difference between nouns and verbs. In the Australian speaker’s production, the intensity ratio showed a similar pattern to pitch (M = 1.034 and M = 0.968), with nouns higher than 1.0, and verbs lower than 1.0. Lastly, we examined duration ratios in Chinese speakers. This time, the difference between nouns and verbs was not significant as the model detected a null effect of PoS [F(1, 12.48) = 0.0936, p = .7647], indicating that duration was not used as an acoustic cue in their production and nouns and verbs had similar duration ratios (M = 1.020 and M = 1.000). In contrast, the Australian English speaker demonstrated a clearer pattern (M = 1.354 and M = 0.754).
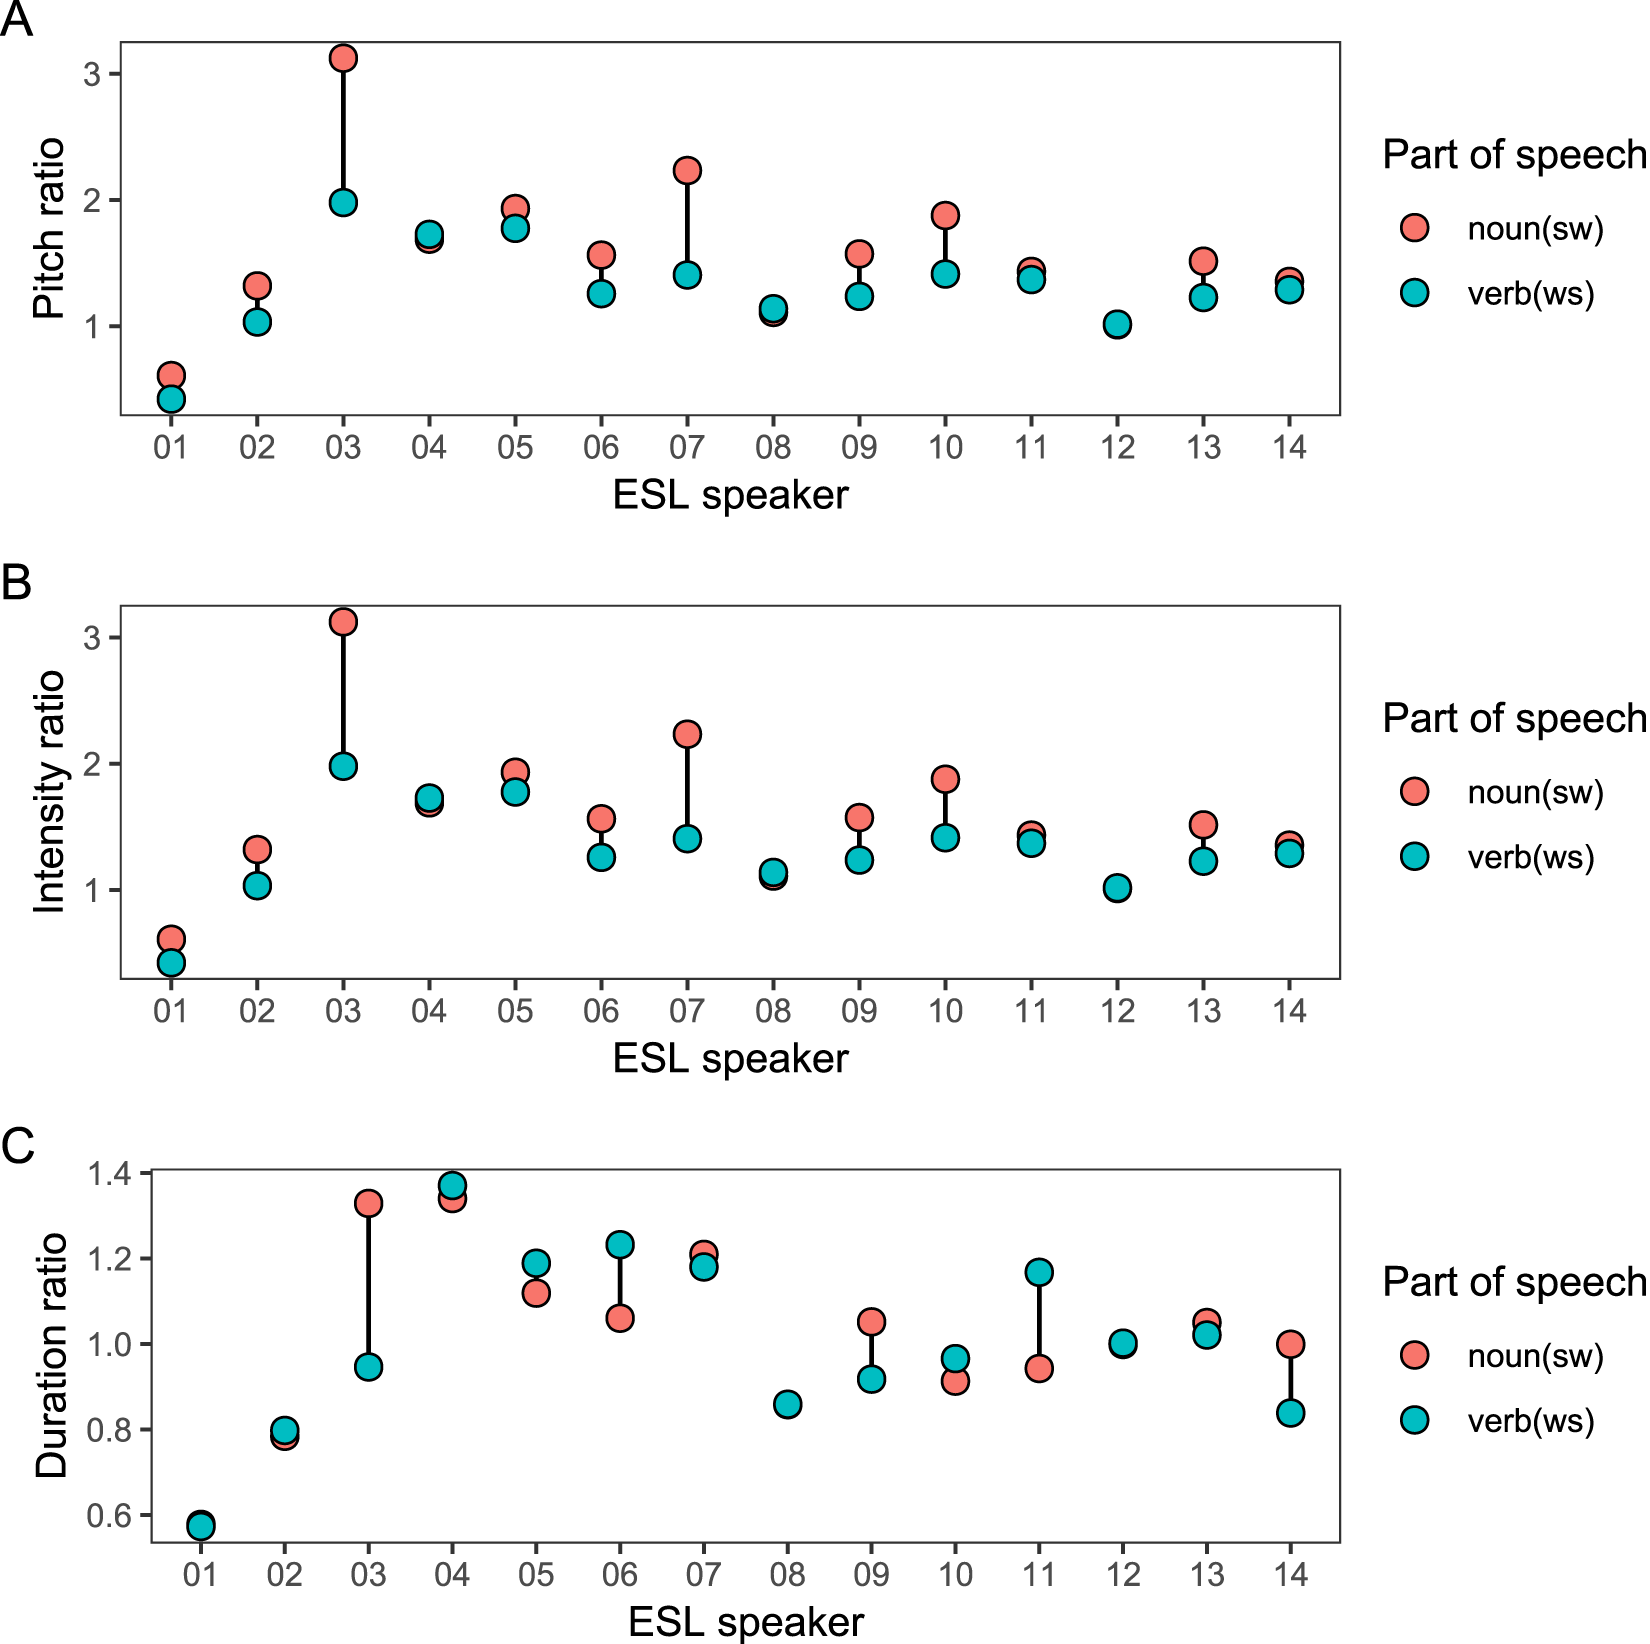
To further investigate the individual variations across the sample, we present the individual means in Figure 2. As can be easily inspected, the individual patterns are consistent with the group level statistics, such that the PoS effect was more consistent for pitch and intensity ratios, but not as much for duration. In each panel in the figure, it was expected that the nouns (red dots) should have a higher value than verbs (blue dots). For pitch ratio, this pattern was observed in the majority (10/14) of the speakers; for intensity ratio, the pattern was also observed in the majority (11/14); but for duration, only 5 out of 14 speakers showed the expected pattern, and some speakers had very similar values in producing nouns and verbs, indicated by the overlapping dots. The “first‑syllable bias” was seen in a number of speakers where the absolute ratio scores for verbs above 1.0 were observed. At the same time, ESL speakers could use an exaggerated trochaic contour for distinguishing nouns from verbs. In other words, statistically significant differences in pitch and intensity ratios should not be directly interpreted as “native‑like” pronunciation, but as functionally contrastive realisations.
Individual variation of pitch, intensity, and duration ratio across Chinese ESL speakers.

Figure 2 Long description
The image A showing a dot plot with the vertical axis label Pitch ratio and tick labels 1, 2, 3. The horizontal axis label is ESL speaker with tick labels 01, 02, 03, 04, 05, 06, 07, 08, 09, 10, 11, 12, 13, 14. A legend title reads Part of speech with entries noun(sw) and verb(ws). Two dot series are shown, one for noun(sw) and one for verb(ws). Some speakers have the two dots connected by a vertical line. Data points by ESL speaker: 01: near 0.5 and near 0.4. 02: near 1.3 and near 1.0. 03: near 3.1 and near 2.0, connected by a vertical line. 04: near 1.7 and near 1.7. 05: near 1.9 and near 1.8. 06: near 1.5 and near 1.3. 07: near 2.2 and near 1.4, connected by a vertical line. 08: one dot near 1.1. 09: near 1.5 and near 1.2. 10: near 1.8 and near 1.4. 11: near 1.4 and near 1.4. 12: one dot near 1.0. 13: near 1.5 and near 1.2. 14: near 1.3 and near 1.3. Highlights within this plot: the highest plotted value is near 3.1 at ESL speaker 03; the largest visible separation with a connecting line is at ESL speaker 03 (near 3.1 versus near 2.0) and ESL speaker 07 (near 2.2 versus near 1.4). Many values fall between 1.0 and 2.0. The image B showing a dot plot with the vertical axis label Intensity ratio and tick labels 1, 2, 3. The horizontal axis label is ESL speaker with tick labels 01, 02, 03, 04, 05, 06, 07, 08, 09, 10, 11, 12, 13, 14. A legend title reads Part of speech with entries noun(sw) and verb(ws). Two dot series are shown, one for noun(sw) and one for verb(ws). Some speakers have the two dots connected by a vertical line. Data points by ESL speaker: 01: near 0.6 and near 0.4. 02: near 1.3 and near 1.0. 03: near 3.1 and near 2.0, connected by a vertical line. 04: near 1.7 and near 1.7. 05: near 1.9 and near 1.8. 06: near 1.5 and near 1.3. 07: near 2.2 and near 1.4. 08: one dot near 1.1. 09: near 1.5 and near 1.2. 10: near 1.8 and near 1.4. 11: near 1.4 and near 1.4. 12: one dot near 1.0. 13: near 1.5 and near 1.2. 14: near 1.3 and near 1.3. Highlights within this plot: the highest plotted value is near 3.1 at ESL speaker 03; many values fall between 1.0 and 2.0. The image C showing a dot plot with the vertical axis label Duration ratio and tick labels 0.6, 0.8, 1.0, 1.2, 1.4. The horizontal axis label is ESL speaker with tick labels 01, 02, 03, 04, 05, 06, 07, 08, 09, 10, 11, 12, 13, 14. A legend title reads Part of speech with entries noun(sw) and verb(ws). Two dot series are shown, one for noun(sw) and one for verb(ws). Some speakers have the two dots connected by a vertical line. Data points by ESL speaker: 01: one dot near 0.6. 02: near 0.8 and near 0.8. 03: near 1.3 and near 1.0, connected by a vertical line. 04: near 1.35 and near 1.38. 05: near 1.1 and near 1.2. 06: near 1.05 and near 1.22. 07: near 1.2 and near 1.18. 08: one dot near 0.85. 09: near 1.05 and near 0.92. 10: near 0.92 and near 0.98. 11: near 0.95 and near 1.18, connected by a vertical line. 12: one dot near 1.0. 13: near 1.05 and near 1.02. 14: near 1.0 and near 0.85, connected by a vertical line. Highlights within this plot: the highest plotted values are near 1.38 at ESL speaker 04 and near 1.35 at ESL speaker 04; the lowest plotted value is near 0.6 at ESL speaker 01. Many values fall between 0.8 and 1.2. Across the three dot plots, the same ESL speaker labels 01 to 14 are used on the horizontal axis and the legend entries noun(sw) and verb(ws) are repeated. The pitch ratio and intensity ratio plots include values up to near 3.1, while the duration ratio plot values are within about 0.6 to 1.4.
3.2 Vowel quality modification
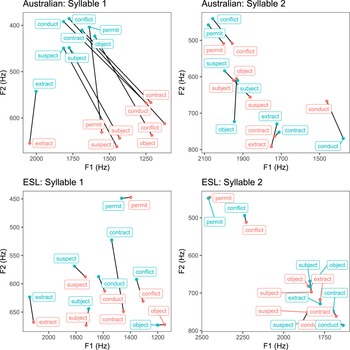
To answer the second research question about vowel modification in word production between the nouns and verbs of interest, we calculated the mean frequency values for the first and second formants (F1, F2) in both syllables, see Figure 3. In the Australian speaker, we observed an expected pattern that the first syllable showed very clear evidence of vowel quality reduction to schwa [ə] in most word items (except for the verb extract, produced as [ɪk.ˈstɹækt], with a high front vowel). In Chinese ESL speakers, similar patterns can be inspected, but the pattern is less consistent. In the second syllable, the reduction was not expected as much. For instance, one would not expect the noun subject to be pronounced as [ˈsʌb.dʒəkt], but [ˈsʌb.dʒɛkt], with a front vowel in the second syllable. Therefore, we primarily expect the differences to be detected in the first but not the second syllable.
Vowel quality in first and second syllables in nouns (red) and verbs (blue) produced by the Australian speaker and Chinese ESL speakers.

Figure 3 Long description
The image presents four scatter plots arranged as two pairs, one pair for the Australian speaker and one pair for Chinese ESL speakers, each pair covering Syllable 1 and Syllable 2. In all four plots, the horizontal axis represents F1 in Hertz and the vertical axis represents F2 in Hertz. Data points are labeled with individual word items such as conduct, conflict, permit, object, suspect, subject, contract and extract. Nouns and verbs are distinguished by separate point markers, with lines connecting paired noun and verb tokens for the same word item. In the plot labeled Australian: Syllable 1, the horizontal axis extends from approximately 1000 to 2000 Hertz and the vertical axis from approximately 400 to 650 Hertz. The noun and verb tokens for most word items are positioned close together in the higher F1 range, roughly between 1250 and 1750 Hertz, with F2 values clustered between 400 and 500 Hertz. The connecting lines between noun and verb pairs are generally short, indicating small differences. The word extract stands apart with a notably higher F1 value near 2000 Hertz and a lower F2 near 580 Hertz, making it a visible outlier from the main cluster. In the plot labeled Australian: Syllable 2, the horizontal axis extends from approximately 1400 to 2100 Hertz and the vertical axis from approximately 450 to 800 Hertz. Points are more spread across the F1 range. The word conduct shows the widest separation between its noun and verb tokens, with the noun positioned near F1 1500 Hertz and F2 800 Hertz and the verb near F1 2000 Hertz and F2 690 Hertz. Other word pairs such as contract and subject show moderate separation. The overall distribution is more dispersed compared to Syllable 1. In the plot labeled ESL: Syllable 1, the horizontal axis extends from approximately 1100 to 2100 Hertz and the vertical axis from approximately 450 to 660 Hertz. The data points are more spread out across the F1 range than in the Australian Syllable 1 plot. Noun and verb tokens for many word items show larger separations, with connecting lines that are longer and more varied in direction. The word permit shows a notable spread, with tokens positioned near F1 1400 Hertz at F2 values around 455 Hertz. The word extract again appears at a higher F1 near 2050 Hertz with F2 near 625 Hertz, consistent with its outlier position in the Australian plot. In the plot labeled ESL: Syllable 2, the horizontal axis extends from approximately 1700 to 2500 Hertz and the vertical axis from approximately 450 to 800 Hertz. Points are densely concentrated in the lower F1 region between approximately 1750 and 2000 Hertz, with F2 values ranging from about 620 to 800 Hertz. Several word items including conduct, contract, suspect and subject are clustered closely in this region. The word permit appears as a clear outlier, positioned at a much higher F2 near 460 Hertz and lower F1 near 2250 Hertz, well separated from the main cluster. Noun and verb pairs in this plot show varying degrees of separation, with some pairs having short connecting lines and others showing moderate divergence.
In the first syllable, we fitted an LMM for the F1 values in the Australian speaker (formula: F1 ∼ Part‑of‑speech + [1 | Word] + [1 | Location]). A Type II Wald F test with Kenward‑Roger method revealed a significant effect of PoS, [F(1, 26.3) = 335.63, p < .0001], showing a clear F1 modification pattern (M = 622 and 435 for nouns and verbs, Cohen’s d = 4.04, large effect). Then we fitted a similar LMM for the F2 values, which again showed a significant effect of PoS [F(1, 35.9) = 54.55, p < .0001], showing modifications of F2 (M = 1416 and 1764, Cohen’s d = ‑1.56, large effect). Together, these results suggest that the Australian speaker showed quality modification in the first syllable when producing the minimal pairs. For Chinese ESL speakers, we also fitted an LMM for F1 (formula: F1 ∼ Part‑of‑speech + [1 + Word | Speaker] + [1 | Location]), which showed also a significant effect of PoS [F(1, 407.58) = 57.89, p < .0001], suggesting evidence of F1‑modification (M = 555 and 505 for nouns and verbs, respectively, Cohen’s d = 0.229, small effect). Similarly, we checked F2 values and also found a significant effect of PoS [F(1, 52.28) = 24.31, p < .0001], but only with a very small difference between nouns and verbs (M = 1687 and 1734, Cohen’s d = ‑0.144, negligible effect). Taken together, Chinese ESL speakers also showed some evidence of vowel quality modification, but they did not reduce the vowel as much as the native Australian speaker.
Finally, we carried out the same set of analyses on the F1 and F2 values in the second syllable, and the F‑test results confirmed that no clear modification was detected in either the Australian speaker or the ESL group (p’s > 0.65 for four tests), supporting the view that vowel modification occurred in the first syllable but not the second syllable in the selected word items.
4. Discussion
4.1 Phonetic implementation of lexical stress
The present results suggest that Chinese ESL implement predominantly pitch and intensity, with duration playing little role, when producing lexical stress. This pattern is consistent with prior research that identified F0 is the most consistent correlate in Chinese ESL stress production (Guo Reference Guo2022; Kim et al. Reference Kim, Bishop and Whalen2025; Zhang et al. Reference Zhang, Nissen and Francis2008). A plausible explanation is that since Mandarin is a tonal language and pitch (including height and contour) is the primary cue to lexical tones (Chao Reference Chao1968; Duanmu Reference Duanmu2007), Chinese ESL speakers potentially transfer this reliance into their L2 English, often producing stressed syllables with exaggerated pitch rises (Zhang et al. Reference Zhang, Nissen and Francis2008). In the present study, nouns exhibited significantly higher pitch ratios (syllable 1 vs syllable 2) than verbs, as expected, but verbs did not reliably show the expected second‑syllable pitch prominence (e.g., the pitch ratio in verbs was still higher than 1.0), suggesting a pattern of phonetic implementation that is different from native varieties. Intensity also emerged as a significant marker, consistent with the role of amplitude in Mandarin tone contrasts (Whalen and Xu Reference Whalen and Xu1992), but ESL speakers showed a strong first‑syllable bias where the initial syllable was consistently louder across both nouns and verbs (e.g., the intensity ratio in verbs was still higher than 1.0), paralleling Guo’s (Reference Guo2022) observation of pervasive initial prominence in Chinese‑accented English. This may derive from Mandarin’s prosodic template, where the first syllable of disyllabic words is often strong (Duanmu, Reference Duanmu2007), thereby limiting acquisition of iambic stress. By contrast, duration did not distinguish nouns and verbs in the present data, contradicting previous studies that reported Mandarin learners could lengthen stressed syllables (Guo Reference Guo2022; Kim et al. Reference Kim, Bishop and Whalen2025; Li and Grigos Reference Li and Grigos2023; Zhang et al. Reference Zhang, Nissen and Francis2008), though those often involved explicit instruction or imitation. The lack of durational contrasts aligns with evidence that duration is secondary to pitch and largely conditioned by lexical tone type rather than word stress (Whalen and Xu Reference Whalen and Xu1992). Overall, our findings support the view that Chinese learners can use familiar suprasegmental resources (pitch, intensity) into L2 stress production, but they underuse the duration cue, consistent with some prosodic transfer models (Major Reference Major2001; Qin et al. Reference Qin, Chien and Tremblay2017).
4.2 Limited vowel reduction in iambic contours
Another important finding of this study is the limited reduction of vowel quality modification in Chinese ESL speakers’ production: in iambic contours, we found some evidence of F1 and F2 modification between nouns and verbs, but only with small to negligible effect sizes; in contrast, the Australian speaker showed clear reductions to schwa‑like qualities with large effect sizes in the first syllable for iambic contours (verbs). Our results also support the view that vowel reduction remains a challenging correlate for Chinese ESL learners (Kim et al. Reference Kim, Bishop and Whalen2025; Zhang et al. Reference Zhang, Nissen and Francis2008). This result stands in contrast with perception studies, which have consistently shown that vowel quality is the most salient and reliable cue to stress for both native and non‑native listeners (Chrabaszcz et al. Reference Chrabaszcz, Winn, Lin and Idsardi2014; Sluijter and van Heuven Reference Sluijter and van Heuven1996; Zhang and Francis Reference Zhang and Francis2010). In perception tasks, Mandarin listeners demonstrate sensitivity to vowel centralization and often weight it highly in stress judgments. However, perception experiments typically use highly controlled materials, e.g., synthetic stimuli with isolated cue manipulation, which allow participants to mobilise metalinguistic knowledge. Much like the imitation or explicit instruction used in production studies (Guo Reference Guo2022; Li and Grigos Reference Li and Grigos2023; Zhang et al. Reference Zhang, Nissen and Francis2008), these tasks may inflate learners’ apparent reliance on vowel quality. In real‑time production, however, speakers must allocate attention across multiple linguistic processes, and what can be perceived is not necessarily aligned with what is implemented behaviourally (Major Reference Major2001). Our findings underscore this divergence: despite perception studies highlighting vowel quality as critical, Mandarin speakers in a sentence‑reading task do not spontaneously reduce vowels as much as native speakers do. We argue that our task has better ecological validity than prior designs. By embedding stress minimal pairs in contextualised sentences with minimal instruction, we reduce opportunities for conscious rule application and elicit speech closer to everyday language. The limited vowel quality modification may be explained by the fact that the unstressed vowel schwa [ə] is an ‘unfamiliar’ phoneme in English that does not have a close equivalent in Mandarin Chinese phonology. In Figure 3, the Australian speakers used similar vowel qualities for different word items (i.e., the green dots form one category, schwa), but the Chinese ESL speakers have various qualities that may still be described as ‘reduced’ or ‘centralised’, but not as consistent as a phonemic category. This difference also reflects the absence of vowel reduction in Mandarin, where weak syllables are marked by neutral tones but not necessarily reduced vowels (Duanmu Reference Duanmu2007). The small and negligible effects also highlight the interaction between segmental and suprasegmental features: since reduced vowels normally co‑occur with shorter duration and weaker intensity (Beckman and Edwards Reference Beckman, Edwards and Keating1994), the limited nature of vowel centralisation may constrain learners’ ability to produce robust durational contrasts.
4.3 Conclusion, limitations and future directions
In summary, our study showed that Mandarin ESL speakers distinguished English noun‑verb stress contrasts primarily through pitch (F0) and intensity, but they did not reliably use duration while they showed a persistent first‑syllable bias. Crucially, they exhibited limited vowel quality reduction as compared to native speakers, underscoring a production‑perception mismatch and highlighting schwa‑production as the central bottleneck in their acquisition of English lexical stress.
At the same time, there are some important limitations of the present study requiring further research. First, the present study focused on relatively experienced Mandarin ESL speakers, but proficiency is inherently gradient and best characterised as a continuum. Without data from lower‑proficiency learners, it is difficult to determine the exact trajectory of L1 transfer: whether the same reliance on pitch and lack of vowel reduction would be magnified at earlier stages, or whether certain cues (e.g., duration) might emerge only as proficiency grows. Future work should compare speakers across proficiency levels to capture how stress production evolves and to better isolate the role of transfer versus learning effects. Second, although we contrasted our findings with previous perception studies, the discussion on the association between production and perception remains indirect. A crucial next step is to obtain both perception and production data from the same participants, enabling the exploration of individual differences, e.g., whether learners who show greater perceptual sensitivity to vowel quality also produce more reduced vowels, or whether those who rely on pitch in perception mirror that weighting in production. Such within‑subject comparisons would clarify whether perception precedes production, as models like the Speech Learning Model predict (Flege Reference Flege and Strange1995), or whether the two domains can diverge in interlanguage phonology.
Lastly, the role of metalinguistic knowledge requires more systematic investigation. We argued that some studies overestimate learners’ vowel reduction ability by providing explicit instructions or model imitations, and that perception tasks may similarly invite rule‑based strategies rather than reflect spontaneous processing. To tease apart genuine linguistic knowledge from instruction‑driven artefacts, future research should contrast learners’ performance in both naturalistic tasks (e.g., sentence reading or spontaneous speech) and controlled, explicitly instructed conditions. Such a design would further explore the extent to which observed effects represent automatized knowledge or task‑induced performance, advancing our understanding of how learners internalise and deploy stress cues in real‑life communication.
Acknowledgements
We would like to thank the Chinese ESL speakers as well as the Australian English speaker for participating in the current study. This study has not been supported by any grant or funding. We declare that we used generative artificial intelligence (Chatgpt‑4o) for literature search and text editing, e.g., error correction, word choices and paraphrasing in earlier drafts.
Appendix 1. Sentence stimuli used in the present study
1. The vanilla extract added flavour to the dessert.
2. Their schedules often conflict with mine.
3. We cannot permit such behaviour anymore.
4. His conduct during the event was good.
5. The fragile object is displayed in the museum.
6. They suspect he knows the truth.
7. Don’t subject yourself to excessive stress.
8. Metals naturally contract in the cold water.
9. They plan to extract oil from the site.
10. You might object to the new policy.
11. The police questioned the suspect in the room.
12. We must conduct a detailed analysis.
13. You need a parking permit to park here.
14. The subject of the lecture was fascinating.
15. He signed the contract this morning.
16. The conflict lasted for several years.

JIUHONG ZHANG completed a Master’s degree in Applied Linguistics at the University of Melbourne. Her research interests lie in L2 phonetics and phonology, with a particular focus on how L1 Mandarin speakers produce English prosodic features. Her work explores how Mandarin’s tonal system may shape the acquisition of English sound patterns, contributing to broader understandings of cross‑linguistic transfer, L2 intelligibility and phonological development.

YIZHOU WANG is a lecturer in linguistics and applied linguistics at the School of Languages and Linguistics, the University of Melbourne, Australia. His research interests include psycholinguistics, applied linguistics, and the phonetics and phonology of non‑mainstream English varieties, including L2 learner varieties (ESL, EFL) and contact varieties such as Australian Aboriginal English. Email: yizwang3@unimelb.edu.au


 Open access

