

As the burden of chronic non-communicable diseases in the UK remains high(Reference Craig and Mindell1–Reference Haines, Wan and Lynn3), diet and nutrition continue to be important public health issues because of their role in prevention(Reference Knowler, Barrett-Connor and Fowler4–Reference Wilson, D'Agostino and Sullivan6). Cross-sectional UK surveys assessing dietary intake have shown that in all age groups intakes of SFA and non-milk extrinsic sugars (NMES) are above recommended levels(Reference Gregory, Lowe and Bates7, Reference Swan8) and that younger adults are more likely than older adults to have low micronutrient intakes(Reference Swan8), for example Fe and Ca. Fe intake is especially important in women of child-bearing age, as Fe deficiency in pregnancy is associated with low birth weight(Reference Scholl and Hediger9), which is associated with an increased risk of CVD in later life(Reference Barker10). Ca intake is a determinant of peak bone mass(11) and for ages 11–18 years the recommended intake is higher than that in adults, as it is a period when the rate of bone mineral deposition is highest(12). Osteoporosis risk is partly determined by peak bone mass; therefore, the proportion of individuals not meeting recommended Ca intakes presents a potential public health issue. In order to address any nutrition issue at the population level and implement intervention strategies, it is vital that we have a reliable and up-to-date picture of the nation's diet. The current National Diet and Nutrition Survey (NDNS) is a cross-sectional survey of people aged 1·5 years and above, designed to be representative of the UK population, which gathers information on food consumption, nutrient intakes and nutritional status(Reference Bates, Lennox and Swan13). It aims to provide data on UK dietary intakes and nutritional status in order to estimate the proportion of individuals meeting recommendations and the proportion with compromised nutritional status. The data feed into policy and are used by the Government to track progress towards existing dietary targets and identify areas that need to be addressed. The data also form the base from which further research or intervention programmes can develop. The NDNS was first set up in 1992 and comprised a series of surveys over the next decade across different age groups(Reference Gregory, Lowe and Bates7, Reference Gregory, Collins and Davies14–Reference Finch, Doyle and Lowe16). Following a review of this series of surveys(Reference Ashwell, Barlow and Gibson17), it was decided that a rolling programme covering all age groups from 1·5 years and above should be introduced in order to identify and analyse trends more rapidly.
Current dietary guidelines on food consumption set in England and Wales by the Department of Health, in Northern Ireland by the Public Health Agency, and in Scotland by the Scottish Government include recommendations to consume more starchy foods, wholegrain where possible, more fruit and vegetables and less fatty and sugary foods(18–20). Guidelines also exist at the nutrient level based on the 1991 Committee on Medical Aspects of Food Policy (COMA) report(12) and state, for example, that intakes of NMES and saturated fats should each contribute no more than 11 % food energy. They also state that the population average for NSP intake in adults should be 18 g/d.
Over the past 10 years there have been a number of programmes aiming to improve diet quality and make an impact on nutrient intakes, such as the Food and Health Action Plan(21) and the Food in Schools Programme(22) in England and the Scottish Diet Action Plan(23) and Hungry for Success(24) school meals policy in Scotland. The Department of Health's ‘5 a day’ programme began in 2000 with a goal to increase fruit and vegetable consumption in the population to at least five 80 g portions per d, and improve public awareness about the need to increase fruit and vegetable consumption(25). Against the backdrop of campaigns and healthy eating messages, how has the nation's diet changed over time and what further action is needed? The objective of the present paper is to identify and describe food consumption and nutrient intakes in the UK and compare data from the first year of the rolling programme (2008–09) with those from the 2000–01 NDNS of adults aged 19–64 years and the 1997 NDNS of young people aged 4–18 years to ascertain what changes have occurred over the past decade and compare these with UK recommendations(12, 18–20).
Methods
Subjects and study design
The NDNS rolling programme is carried out by a consortium of three organisations: the National Centre for Social Research (NatCen), MRC Human Nutrition Research, and the Department of Epidemiology and Public Health at the University College London Medical School. Fieldwork for the first year of the NDNS rolling programme was carried out between February 2008 and March 2009. Fieldwork in England, Scotland and Wales was carried out by NatCen; in Northern Ireland it was carried out by the Northern Ireland Statistics and Research Agency (NISRA) in conjunction with NatCen. The sample included 1131 participants aged 1·5–94 years and was designed to be representative of the UK population. The survey design and sampling methods are described in detail elsewhere(Reference Bates, Lennox and Swan13). Briefly, a sample of addresses was taken from the UK Postcode Address File of small users (less than twenty-five items of mail per d). Addresses were clustered into primary sampling units, small geographical areas based on postcode sectors, randomly selected from across the UK. From each primary sampling unit twenty-seven addresses were randomly selected and contacted by an interviewer to arrange a face-to-face interview and place a food diary. For nine of these addresses an adult (defined as those aged 19 years and above) and a child (defined as those aged 1·5–18 years) were selected if available; for the other eighteen addresses only children were selected to ensure a large enough sample of children.
The present study was conducted according to the guidelines laid down in the Declaration of Helsinki and all procedures involving human subjects were approved by the Oxfordshire A Research Ethics Committee. Informed consent was obtained from all subjects.
Dietary records
Data were collected using 4 d estimated food diaries, including both weekend days. Participants were asked to describe portions using household measures and the diaries included pictures of life-size spoons and a life-size glass to aid accurate recording. Trained interviewers reviewed the diaries with the participants and probed for extra information when necessary. Children aged 12 years and over were encouraged to complete the diaries themselves, while for children below this age the parent/carer was asked to complete the diary. Participants were asked to record food and drinks consumed both at home and away from home, and were therefore asked to take the diary with them when away from home. For young children, a teacher or friend's parent might then complete parts of the diary for the child. In these situations, carer packs consisting of extra diary pages and an introductory letter were provided for parents to place with other carers of their child. For specific foods consumed in schools where extra details were required for accurate coding, school caterers were contacted for information about recipe information and portion size of dishes.
Of the eligible individuals, 55 % completed three or four dietary recording days. Participants aged 65 years and over were not included in the comparison, as the total number of participants in this age group in the 2008–09 data was limited. Participants aged under 4 years were also not included, as the 1997 NDNS of young people only covered those aged 4–18 years. In total, 896 participants from the rolling programme aged 4–64 years were included in the analysis. The 2000–01 NDNS of adults aged 19–64 years included 1724 participants and the 1997 NDNS of young people aged 4–18 years included 1701 participants.
Food and nutrient intakes were calculated using DINO (Diet In Nutrients Out), a dietary assessment system developed at the MRC Human Nutrition Research, incorporating the Food Standards Agency's (FSA) NDNS nutrient databank(Reference Smithers26), which was also used in previous NDNS. The databank is based on McCance and Widdowson's Composition of Foods series(27), FSA food portion sizes(28), and manufacturers' data where applicable. Since the NDNS rolling programme began the databank has been updated by the FSA each year as part of the Department of Health rolling programme of analytical surveys. Between the previous surveys and the NDNS rolling programme, in order to bring the databank up to date, thousands of foods were removed as they were no longer available. Amendments to the nutrient databank are made regularly as a result of queries raised during coding of NDNS diaries and may involve the creation of new food codes for novel or fortified food products, updates to existing food codes relating to manufacturer reformulation, or deletion of food codes due to certain products becoming unavailable. When participants did not know what type of food they had consumed (for example, when food was consumed outside the home), default foods were used; for example, for milk this was semi-skimmed, for fat spread this was reduced fat spread (not polyunsaturated).
Foods were grouped into hierarchical categories and the components of each category are given in Supplementary Appendix Table 1 (available online at http://www.journals.cambridge.org/bjn). The groupings were checking against those from previous surveys to ensure equivalence and were combined where necessary. Nutrient intakes were compared with dietary reference values(12). As in previous NDNS, within the dataset reference nutrient intake (RNI) and lower reference nutrient intake (LRNI) values were added for each participant according to their age and sex(12) and corresponding variables for reporting RNI and percentage below LRNI were created. With regard to micronutrient intakes it should be noted that the data used represented the contribution from food only and did not include intake from supplements. Intake from fortified foods was included, as fortified foods are treated in the same ways as all other foods in the nutrient databank, in that they have specific food codes within the databank so that vitamin and mineral values are captured accurately.
Statistical analyses
Food consumption and nutrient intake were analysed by sex and age group (4–10 years, 11–18 years and 19–64 years). Fatty acids were not included in this analysis in detail as they have been analysed and discussed in more detail elsewhere (GK Pot, CJ Prynne, C Roberts, et al., unpublished results).
The data were weighted to account for non-response bias and bias due to differences in the probability of households and individuals being selected to take part; this method is described in detail elsewhere(29). In brief, the weighting factor corrected for known sociodemographic differences between the composition of the survey sample and that of the total population of the UK, in terms of age by sex and government office region. The percentage of participants consuming each particular food group was also calculated. Records of outliers and potential under-reporters were checked for coding errors but were not excluded.
In order to compare intakes from the rolling programme with those from previous surveys, which used 7 d food diaries, the 2000–01 and 1997 dietary data were converted to 4 d(30), using the bootstrapping with replacement method which was run 100 times to reduce potential error caused by variability among participants. Within the sampling frame, the data were re-sampled at random to keep the distribution of the population intact. Each day of the week was equally represented, and consecutive days were chosen for each respondent. Median daily intakes of foods and nutrients were compared using Mann–Whitney U tests. The percentages of participants consuming particular foods were compared using χ2 tests. The proportions below the LRNI(12) for selected micronutrients were compared using χ2 tests. Data analysis was carried out using SPSS for Windows (version 14; SPSS Inc., Chicago, IL, USA) and a significance level of P < 0·001 was used throughout to take into account multiple testing of dependent variables.
Results
Study population
Characteristics of the study population such as BMI, socio-economic status, education level, housing tenure and smoking status are described in detail elsewhere(Reference Bates, Lennox and Swan13). Of the 896 participants, eleven provided 3 d rather than 4 d of dietary data. However, there was no difference in the pattern of intake in these individuals when compared with participants who provided 4 d.
Cereals and cereal products
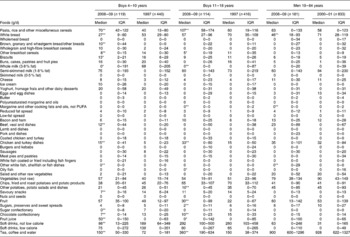
Tables 1 and 2 show the median daily consumption of foods (including non-consumers) in males and females for all age groups, by survey year. ‘Non-consumers’ refers to participants whose intake for a particular food was 0 g and they are included in the calculation of average daily intake. Of all bread consumed, ‘white bread’ remained the largest component and had the largest proportion of consumers in all surveys. However, ‘white bread’ consumption was significantly lower in 2008–09 in boys aged 4–10 years (P < 0·0001), men (P < 0·0001), girls aged 11–18 years (P < 0·0001) and women (P = 0·0004) than in previous surveys. In adults there were no other changes in consumption of cereals and cereal products. Consumption of ‘pasta, rice and other cereals’ (including pizza) was higher in 2008–09 than in 1997 in boys aged 4–10 years, girls aged 4–10 years and boys aged 11–18 years (all P < 0·0001). Median daily consumption of ‘all other breads’ (which includes brown, granary and wheatgerm breads, and 50:50 mixed white and wholemeal breads) was higher in 2008–09 than in 1997 in boys and girls aged 4–10 years (both P < 0·0001), and girls aged 11–18 years (P = 0·0002) but remained a small proportion of all bread consumed. The percentage of children aged 4–18 years consuming ‘all other breads’ in 2008–09 was significantly higher compared with previous surveys (all P < 0·0001), increasing from 24 % to 54 % in children aged 4–10 years and from 31 % to 42 % in children aged 11–18 years (data not shown). The median daily consumption of non-high-fibre breakfast cereals was significantly lower in 2008–09 than in 1997 in boys aged 4–10 years (P < 0·0001) and boys aged 11–18 years (P = 0·0003). The percentage of children aged 4–10 years consuming ‘wholegrain and high-fibre breakfast cereals’ was higher in 2008–09 than in 1997 (P < 0·0001, data not shown), rising from 49 % to 62 %. Biscuit consumption was significantly lower in 2008–09 than in 1997 in boys aged 4–10 years (P = 0·001).
(Median values and interquartile ranges (IQR))
Median value was significantly different from that in the previous survey: * P < 0·001, ** P < 0·0001.
† Median intakes are for the total population (i.e. including participants whose median intake is 0 g).
(Median values and interquartile ranges (IQR))
Median value was significantly different from that in the previous survey: * P < 0·001, ** P < 0·0001.
† Median intakes are for the total population (i.e. including participants whose median intake is 0 g).
Milk and milk products
‘Semi-skimmed milk’ remained the most commonly consumed milk, consumed by 64–75 % of participants over the recording period. There was no change in median daily consumption of semi-skimmed milk in any group. ‘Whole milk’ consumption was significantly lower in 2008–09 than in 1997 in boys aged 4–10 years (P = 0·0004), boys aged 11–18 years (P < 0·0001) and women (P < 0·0001) and in these groups represented 44, 46 and 21 %, respectively, of all milk consumed; this can be attributed to a decrease in the percentage of consumers, from 50 % to 34 % in boys aged 4–18 years and from 31 % to 17 % in women (both P < 0·0001). There were no changes in median daily consumption of ‘cheese’, ‘ice cream’ and ‘yoghurt, fromage frais and other dairy desserts’.
Fats (spreads)
There was little change in median daily consumption of fat spreads and the most popular remained ‘reduced fat spreads’ (62–75 % fat). The percentage consumers of ‘reduced fat spreads’ was significantly higher in children aged 11–18 years and adults in 2008–09 than in previous surveys, increasing from 50 % to 60 % in children aged 11–18 years (P = 0·0007) and from 46 % to 54 % in adults (P = 0·0006) (data not shown).
Meat and meat products and dishes
The most commonly consumed meat food group remained ‘chicken and turkey dishes’, and the median daily consumption was significantly higher in 2008–09 in boys and women, rising from 5 g to 15 g in boys aged 4–10 years (P < 0·0001), from 15 g to 33 g in boys aged 11–18 years (P < 0·0001), and from 23 g to 33 g in women (P = 0·0003). ‘Beef, veal and dishes’ was the second most commonly consumed meat group. In women, median daily consumption of ‘beef, veal and dishes’ (P < 0·0001), ‘lamb and dishes’ (P = 0·0006) and ‘sausages’ (P < 0·0001) was significantly higher in 2008–09 compared with 2000–01.
Fish and fish dishes
‘Coated or fried white fish (which includes fish fingers)’ was the most commonly consumed fish group in children aged 4–10 years. ‘Other white fish, shellfish or fish dishes’ (including canned tuna) was the most commonly consumed fish group in children aged 11–18 years and adults. No significant changes were seen in the consumption of ‘coated or fried white fish’ in any age group. Since the previous surveys, canned tuna has been reclassified from the food group ‘oily fish’ to the food group ‘other white fish, shellfish or fish dishes’, so it is not possible to assess whether consumption in these groups has changed.
Fruit and vegetables
For girls aged 4–10 years, fruit consumption was significantly higher in 2008–09 than in 1997 (P < 0·0001), with median daily consumption rising from 55 g to 84 g. Consumption was also significantly higher in boys aged 11–18 years (P < 0·0001), with median daily consumption rising from 22 g to 30 g. In all groups the percentage of participants consuming fruit was higher compared with previous surveys and this change was greatest in boys aged 4–10 years, increasing from 77 % to 91 %, and in boys aged 11–18 years, increasing from 56 % to 71 %, bringing the percentage of boys consuming fruit in line with that in girls (92 % girls aged 4–10 years; 71 % girls aged 11–18 years). No significant changes were seen in fruit consumption in adults. There were also no significant changes in vegetable consumption or percentage of consumers of vegetables in all age groups, apart from in women where median daily consumption of ‘salad and other raw vegetables’ was significantly higher in 2008–09 than in 2000–01 (P = 0·0009).
Potatoes
Median daily consumption of ‘other potatoes, potato salads and dishes’ was significantly lower in 2008–09 than in previous surveys in boys aged 11–18 years and women (both P < 0·0001). No other changes were seen in potato consumption.
Sugar, preserves and confectionery and savoury snacks
Significantly lower consumption was seen in 2008–09 compared with 1997 in a number of these foods, particularly in the 4–10 years age group. ‘Chocolate confectionery’ consumption was significantly lower in all children (boys aged 4–10 years and 11–18 years, both P < 0·0001; girls aged 4–10 years and 11–18 years, both P = 0·0002). Consumption of ‘savoury snacks’ was significantly lower in boys and girls aged 4–10 years (both P < 0·0001). Consumption of ‘sugar, preserves and sweet spreads’ (including table sugar) was significantly lower in boys and girls aged 11–18 years (both P < 0·0001). In boys aged 4–10 years, consumption of biscuits (P < 0·001) and sugar confectionery (P < 0·0001) were also significantly lower in 2008–09 than in 1997. No changes in adults were seen for any of these foods.
Beverages
In all groups the percentage of participants consuming fruit juice was higher in 2008–09 compared with previous surveys; most substantially in boys aged 4–10 years, from 41 % to 64 %. However, median daily consumption of fruit juice remained considerably lower than consumption of other beverages, at below 50 g/d. In children aged 4–10 years consumption of ‘soft drinks (not low calorie)’ was significantly lower in 2008–09 than in 1997 (boys and girls, both P < 0·0001) while consumption of ‘fruit juice’ in boys aged 4–10 years (P < 0·0001) and 11–18 years (P = 0·0001), and of ‘tea, coffee and water’ in children (all P < 0·0001) and women (P = 0·0002) was significantly higher in 2008–09 than in 1997. For children aged 4–10 years and 11–18 years in 2008–09, the largest contributor to the ‘tea, coffee and water’ group was water.
Macronutrients
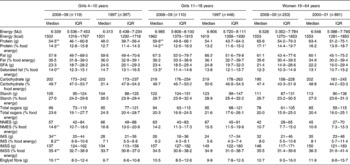
Tables 3 and 4 show the median daily intakes of macronutrients from food sources only in males and females for all age groups, by survey year. There were no significant differences in energy intake in any age or sex group compared with previous surveys. As in the previous surveys total energy intakes were below the estimated average requirements(12).
(Median values and interquartile ranges (IQR))

NMES, non-milk extrinsic sugars; IMS, intrinsic and milk sugars; IMSS, intrinsic and milk sugars, and starch.
Median value was significantly different from that in the previous survey: * P < 0·001, ** P < 0·0001.
(Median values and interquartile ranges (IQR))
NMES, non-milk extrinsic sugars; IMS, intrinsic and milk sugars; IMSS, intrinsic and milk sugars, and starch.
Median value was significantly different from that in the previous survey: * P < 0·001, ** P < 0·0001.
In all age groups, protein as a percentage of food energy was significantly higher in 2008–09 compared with previous surveys (all children P < 0·0001; men P = 0·0003; women P = 0·0004). As a percentage of food energy, no changes were seen in total fat or carbohydrate intake, with intakes remaining around the dietary reference values(12) of 35 and 50 %, respectively. A significant decrease in SFA as a percentage of food energy was seen in all age groups of children (boys aged 4–10 years and 11–18 years, and girls aged 4–10 years, all P < 0·0001; girls aged 11–18 years, P = 0·0001), but this, and changes in intakes of other fatty acids are discussed in detail elsewhere (GK Pot, CJ Prynne, C Roberts, et al., unpublished results). Intakes of total sugars as a percentage of food energy were significantly lower in boys aged 4–10 years in 2008–09 than in 1997 (P = 0·0008). In children aged 4–10 years, median daily intakes of NMES as a percentage of food energy were lower in 2008–09 than in 1997 (boy and girls, both P < 0·0001), while intakes of intrinsic and milk sugars, and starch (IMSS) as a percentage of food energy were higher (boys and girls, both P < 0·0001). No significant changes in NMES or IMSS intake were seen in children aged 11–18 years or adults.
Englyst fibre (NSP) intake was significantly higher in 2008–09 than in 1997 in children aged 4–10 years (boys and girls, both P < 0·0001), increasing from 9·4 to 10·8 g/d in boys and from 8·7 to 10·1 g/d in girls. No significant changes in NSP intake were seen in children aged 11–18 years and adults.
Micronutrients
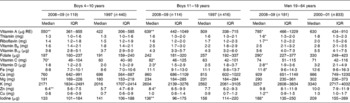
Tables 5 and 6 show median daily intakes of micronutrients from food sources only, in males and females by age and survey year. Changes observed varied among the three age groups. The most consistent change across all age groups was the significantly higher intake of vitamin A in 2008–09 than in previous surveys (all children and women P < 0·0001; men P = 0·0004). Fig. 1(a) and (b) show the median daily intakes of selected micronutrients as a percentage of the RNI(12) for children aged 4–10 years and 11–18 years, by sex and survey year. The figures show that for a number of micronutrients, children aged 11–18 years have median daily intakes less than 100 % of the RNI, whereas for children aged 4–10 years median daily intakes are greater than or equal to 100 % of the RNI for the micronutrients shown. In general, adults also had median daily intakes greater than or equal to 100 % of the RNI, apart from intakes of Fe, Mg, K and Cu in women (data not shown). The 4–10 years data are shown as a comparison with the 11–18 years data. Median daily intakes of Ca and Zn in girls aged 11–18 years, as a percentage RNI, were higher than in 1997. While median Ca intake was significantly higher in girls aged 4–10 years in 2008–09 compared with in 1997, rising from 653 to 746 mg/d (P < 0·0001), it was significantly lower in women in 2008–09 compared with in 2000–01, falling from 761 to 682 mg/d (P = 0·0005) (Table 6). Median daily iodine intake was significantly lower in 2008–09 compared with previous surveys in children aged 11–18 years and adults (boys aged 11–18 years, P < 0·0001; girls aged 11–18 years, P = 0·0006; men, P = 0·0009; women, P < 0·0001).
(Median values and interquartile ranges (IQR))
RE, retinol equivalents.
Median value was significantly different from that in the previous survey: * P < 0·001, ** P < 0·0001.
(Median values and interquartile ranges (IQR))
RE, retinol equivalents.
Median value was significantly different from that in the previous survey: * P < 0·001, ** P < 0·0001.
(a) Daily intakes of selected micronutrients from food sources only as a percentage of reference nutrient intake (RNI) in children aged 4–10 years, by sex and survey year. Values are medians (![]() ), Boys 1997 (n 440); (
), Boys 1997 (n 440); (![]() ), boys 2008–09 (n 199); (
), boys 2008–09 (n 199); (![]() ), girls 1997 (n 397); (
), girls 1997 (n 397); (![]() ), girls 2008–09 (n 119). (b) Daily intakes of selected micronutrients from food sources only as a percentage of RNI in children aged 11–18 years, by sex and survey year. (
), girls 2008–09 (n 119). (b) Daily intakes of selected micronutrients from food sources only as a percentage of RNI in children aged 11–18 years, by sex and survey year. (![]() ), Boys 1997 (n 416); (
), Boys 1997 (n 416); (![]() ), boys 2008–09 (n 114); (
), boys 2008–09 (n 114); (![]() ), girls 1997 (n 448); (
), girls 1997 (n 448); (![]() ), girls 2008–09 (n 110).
), girls 2008–09 (n 110).
For most age and sex groups, there were fewer than 10 % of participants below the LRNI for most micronutrients, in both the 2008–09 data and data from previous surveys. However, in the 11–18 years age group the proportions below the LRNI were more marked, especially in girls. Fig. 2(a)–(d) show the proportion of boys and girls aged 11–18 years, and men and women aged 19–64 years below the LRNI for selected micronutrients from food sources only, by survey year. The proportions of children aged 11–18 years below the LRNI for Ca in 2008–09 were significantly lower than in 1997 (boys and girls, both P < 0·0001), falling from 13 % to 6 % in boys and from 23 % to 12 % in girls. The proportions of children aged 11–18 years below the LRNI for Zn in 2008–09 were also both significantly lower than in 1997 (boys and girls, both P < 0·0001), falling from 15 % to 10 % in boys and from 26 % to 15 % in girls. In men, proportions below the LRNI were slightly higher in 2008–09 compared with in 2000–01 for a number of micronutrients (folate, Ca, Zn and iodine; all P < 0·0001), although all remained no higher than 10 %. Conversely, in women, proportions below the LRNI were slightly lower in 2008–09 compared with in 2000–01 for a number of micronutrients (vitamin A, folate, Zn and Mg; all P < 0·0001). In 2008–09 the proportion of women with intakes below the LRNI for all micronutrients analysed was less than 10 %, apart from for Fe and K, where more than 20 % remained below the LRNI. As in 1997, more than 40 % of girls aged 11–18 years were below the LRNI for Fe. Also as in 1997, in all children aged 11–18 years, a substantial proportion was below the LRNI for Mg (boys 20 %; girls 40 %).
(a). Proportion of boys aged 11–18 years with mean daily intakes of selected micronutrients from food sources only below the lower reference nutrient intake (LRNI), by survey year. (![]() ), 1997 (n 416); (
), 1997 (n 416); (![]() ), 2008–09 (n 114). Proportion was significantly different from that in the 1997 survey: *P < 0·001, **P < 0·0001. (b). Proportion of girls aged 11–18 years with mean daily intakes of selected micronutrients from food sources only below the LRNI, by survey year. (
), 2008–09 (n 114). Proportion was significantly different from that in the 1997 survey: *P < 0·001, **P < 0·0001. (b). Proportion of girls aged 11–18 years with mean daily intakes of selected micronutrients from food sources only below the LRNI, by survey year. (![]() ), 1997 (n 448); (
), 1997 (n 448); (![]() ), 2008–09 (n 110). ** Proportion was significantly different from that in the 1997 survey (P < 0·0001). (c). Proportion of men aged 19–64 years with mean daily intakes of selected micronutrients from food sources only below the LRNI, by survey year. (
), 2008–09 (n 110). ** Proportion was significantly different from that in the 1997 survey (P < 0·0001). (c). Proportion of men aged 19–64 years with mean daily intakes of selected micronutrients from food sources only below the LRNI, by survey year. (![]() ), 2000–01 (n 833); (
), 2000–01 (n 833); (![]() ), 2008–09 (n 181). ** Proportion was significantly different from that in the 2000–01 survey (P < 0·0001). (d). Proportion of women aged 19–64 years with mean daily intakes of selected micronutrients from food sources only below the LRNI, by survey year. (
), 2008–09 (n 181). ** Proportion was significantly different from that in the 2000–01 survey (P < 0·0001). (d). Proportion of women aged 19–64 years with mean daily intakes of selected micronutrients from food sources only below the LRNI, by survey year. (![]() ), 2000–01 (n 891); (
), 2000–01 (n 891); (![]() ), 2008–09 (n 253). ** Proportion was significantly different from that in the 2000–01 survey (P < 0·0001).
), 2008–09 (n 253). ** Proportion was significantly different from that in the 2000–01 survey (P < 0·0001).
Discussion
The NDNS is a cross-sectional survey that gathers data on the food consumption, nutrient intakes and nutritional status of people in the UK aged 1·5 years and above in order to track progress towards dietary targets and to identify areas that need to be addressed. This analysis has identified changes in food consumption and nutrient intake over the past decade by comparing data from the 2008–09 NDNS rolling programme with data from the 2000–01 NDNS of adults aged 19–64 years and the 1997 NDNS of young people aged 4–18 years. It has shown that for a number of foods and nutrients, there has been little change over time, despite initiatives aimed at improving the nation's diet, such as the FSA's public awareness campaign website, ‘Eat Well’(18), and Consumer Focus Scotland's Healthy Living Award for caterers(31). However, for some foods and nutrients there has been a statistically significant change and this has been in the direction of UK dietary recommendations. These changes were most marked in children aged 4–10 years; for this group, the analysis showed higher intakes of fruit and lower intakes of crisps and savoury snacks, chocolate confectionery and soft drinks (not low calorie). Some changes were seen in children aged 11–18 years but these were not as consistent across the sexes as in children aged 4–10 years. Changes in food consumption are reflected in the nutrient intake data: in younger children the reduction in intakes of NMES, and the higher intakes of NSP, move intakes towards dietary reference values. For micronutrient intakes, children aged 4–10 years continued to meet recommendations at the population level, while intakes in children aged 11–18 years in general remained below the recommendations – this was especially true for girls, while there was some improvement in boys. However, it is important to point out that micronutrient intakes in girls aged 11–18 years are no worse than in the previous survey; although severely inadequate intakes of micronutrients such as Fe were highlighted in this group in 1997, no further reduction has occurred(Reference Gregory, Lowe and Bates7).
The strengths and limitations of the present study must be taken into account. The NDNS is the only survey producing nationally representative data on food consumption and nutrient intake in the UK. There are no other similar UK data with which to monitor and investigate dietary trends at the population level. As this is the first year of the rolling programme, the sample size of the year 1 data is smaller than the sample sizes for the previous surveys. However, once year 1 and year 2 data are combined, the sample size will be larger and it is possible that some changes that were not detected as significant when analysed for year 1 only may be evident when data are analysed at the end of year 2. While the data were weighted it should be noted that the application of non-response weights is not guaranteed to reduce bias for all of the many outcomes and behaviours measured as part of the survey, as weighting is equivalent to replacing members of a subgroup that failed to respond with replicates of responding members of the same subgroup(29).
A limitation inherent to self-reported dietary assessment methods is under-reporting or over-reporting(Reference Macdiarmid and Blundell32), and this may have introduced bias to the data in all of these surveys. Whether the degree of under- and over-reporting is the same in all surveys included here is uncertain. It has been suggested that as awareness of healthy eating increases as a result of public health campaigns, under-reporting of the intake of certain foods may also increase. For example, Heitmann et al. (Reference Heitmann, Lissner and Osler33) hypothesised that observed trends for reductions in fat intakes were actually a result of an increasing trend for under-reporting and that this may be due to an increase in healthy eating campaigns. They found that the degree of under-reporting of total energy in groups of Danish participants was significantly higher in 1993–94 (29 %) than in 1987–88 (15 %) (P < 0·0001). In the present study, if a participant's intake was flagged as an outlier, their diary was checked against the coded data. If there was a data entry error, then this was corrected; otherwise the data were left to reflect what had been recorded in the diary and the participant was not excluded, as it was not considered possible to separate under-reporters from under-consumers (for example, those who were unwell, for example). Therefore under-reporting has not been accounted for in the present study.
Some of the changes in dietary intake identified could have been a product of the study design, for example, the inclusion of two weekend days in the 2008–09 data. Previous research has shown that haem:non-haem Fe ratios have been reported to be higher on Sundays than on Saturdays, particularly in adolescents, which suggests a higher level of meat consumption on Sundays(Reference Thane and Stephen34). The increase in vitamin A seen in most groups in 2008–09 compared with previous surveys may be due to the higher meat consumption seen in most groups. Vitamin A reported as retinol equivalents includes β-carotene, and, although vegetable consumption has also been shown to be highest on Sundays(Reference Thane and Stephen35), no changes were seen in vegetable consumption in comparison with previous surveys and hence the increase seen is unlikely to come from vegetable sources. As well as significant day-to-day variation in consumption of certain foods(Reference Thane and Stephen35), the percentage of those consuming a particular food group is also affected by the number of diary days: the longer the recording period the more chance there is that a participant will consume a certain food. The impact of the different recording periods between surveys has been accounted for through the use of the bootstrapping method, which means that the direct comparison of percentage consumers is reliable. Selection of diary days in subsequent years of the rolling programme has been adjusted, so that when data from year 1 and year 2 are combined, each day will be equally represented.
Another methodological difference between the surveys was the use of an estimated rather than a weighed food diary in the rolling programme. However, it has been shown that there are no significant differences between mean intakes when measured during the same season for weighed and unweighed food diaries(Reference Bingham, Gill and Welch36). An estimated food diary can also result in better response rates than weighed diaries, as the burden to participants is lower. The response rate for year 1 of the rolling programme was 55 %, an improvement on the response rate of 47 % for the 2000–01 NDNS of adults aged 19–64 years.
The continual revision of the FSA's nutrient databank is a significant strength of the present study as it reflects the foods available at the time of fieldwork, through its inclusion of novel food products and manufacturer reformulations. It is possible that some observed changes in nutrient intake may be due to improved food composition analysis rather than changes in actual intake in the sample. However, it is difficult to measure the extent to which this has made an impact on these results.
The results of the present study have a number of implications for public health. The large proportion of girls aged 11–18 years and women with intakes below the LNRI for Fe is of particular concern in that it has not improved since previous surveys. The UK population's Fe intakes have been falling over the past few decades probably owing to changes in the consumption of specific foods, such as the offal meats, liver and kidney, rich sources of Fe which are less popular than they were previously(Reference Fairweather-Tait37). Fe deficiency can particularly affect women in the early stages of pregnancy, where Fe-deficiency anaemia is associated with an increased risk of preterm delivery and low birth weight(Reference Scholl and Hediger9), increasing the risk of infant morbidity, infant mortality and CVD in later life(Reference Barker10). Fe deficiency is thought to affect up to 50 % of women of childbearing age in the UK(Reference Williamson38). In the 2000–01 NDNS of adults aged 19–64 years, Fe-deficiency anaemia affected 8 % of women(Reference Henderson, Irving and Gregory39). Results from the blood sample analysis of the rolling programme to be published in 2011 will enable us to determine the proportion of women affected by anaemia.
Ca intakes in children were higher in 2008–09 than in 1997, and the proportion of children aged 11–18 years with intakes below the LRNI was halved. Since there was no change in semi-skimmed milk consumption, the most commonly consumed milk, and there was no change in the consumption of other dairy products, either in the percentage of consumers or the quantity consumed by consumers, this may be due to fortification of certain products, particularly cereal products, although this would need further investigation. Although the increase in Ca intakes is in the right direction, 6 % of boys and 12 % of girls aged 11–18 years remained below the LRNI.
More participants in the 2008–09 survey were eating fruit, a change in line with recommendations. This may be as a result of efforts to increase fruit and vegetable consumption and raise awareness through the ‘5 a day’ initiative(25).
The decrease in intake of soft drinks in younger children was accompanied by an increase in the consumption of the tea, coffee and water group in all children (aged 4–18 years), largely a result of increased water consumption. A decrease in soft drink purchases was reported by the Department for Environment, Food and Rural Affairs (DEFRA) in 2008(40), and this may be associated with the increasing consumer preference for bottled water and the huge investment in advertising from this industry(Reference Doria41), which has made the consumption of bottled water fashionable. While the increase in the consumption of fruit juice was only statistically significant in boys aged 4–10 years, an increase in the percentage of consumers was seen across all groups. It has been suggested that fruit juice consumption is a marker for healthier dietary habits(Reference Caswell42), and, although some studies have found an association between weight and fruit juice consumption in children(Reference Dennison, Rockwell and Nichols43, Reference Faith, Dennison and Edmunds44), one did not specify whether ‘fruit juice’ referred to 100 % fruit juices or fruit juice drinks, and the other used a small regional sample. Studies using large nationally representative samples have produced results to the contrary(Reference Nicklas, O'Neil and Kleinman45, Reference O'Connor, Yang and Nicklas46), such as the secondary analysis of data from the National Health and Nutrition Examination Survey by Nicklas et al. published in 2008(Reference Nicklas, O'Neil and Kleinman45), which found that in US children aged 2–11 years, consuming 100 % fruit juices was associated with significantly higher intakes of vitamins C and B6, K, Mg, riboflavin, Fe and folate and lower intakes of total fat, SFA and added sugar. They also found that it was not associated with weight status or the likelihood of being overweight in these children. Thus, the increase in fruit juice consumption in children in the rolling programme should be seen as a positive change in the right direction.
The lower contribution of NMES to food energy in children aged 4–10 years is another change in the direction of dietary recommendations. A cross-sectional study carried out in 2000 of 11- to 12-year-olds across seven schools in Northumberland showed that school meals were a substantial contributor to NMES intakes, with biscuits, cakes and soft drinks being the main sources(Reference Rugg-Gunn, Fletcher and Matthews47). Since the 1997 NDNS of young people aged 4–18 years, there have been various efforts throughout the UK to improve the nutritional quality of school meals. National Nutritional Standards were introduced in schools in England in 2001(48) and, following this, over £280 million was invested to improve school meals(Reference Buttriss49). The Hungry for Success policy for school meals in Scotland was implemented in 2002 and includes Her Majesty's Inspectorate of Education (HMIE) inspections making the measures compulsory and, according to the 2008 HMIE report, most schools were moving towards achieving the nutrient standards set(50). The school fruit and vegetable scheme in England, introduced in 2004, consisted of a free piece of fruit or vegetable being provided every day to children aged 4–6 years. A non-randomised controlled trial published in 2007(Reference Ransley, Greenwood and Cade51) evaluating this scheme found that it was associated with an increase in 0·4–0·5 portions/d of fruit at 3 months, but that after 7 months the effect was reduced to an increase of 0·3 portions/d. While this is a modest change, it shows that the scheme has been effective in increasing fruit consumption in this age group. In 2007, the school nutrient standards in England were updated to cover food available in schools besides lunches, including vending machines and tuck shops. A number of foods were no longer permitted in vending machines such as soft drinks containing less than 50 % fruit juice, and confectionery including chocolate and sweets(52). This would suggest that all food available in schools is now healthier and more likely to meet recommendations than in 1997, and may explain why most change was seen in younger children. In secondary schools, many children have the option to leave the school for lunch and in 2008–09 in England approximately 65 % of children in secondary schools, academies and city technology colleges chose not to take school meals(Reference Nelson, Nicholas and Wood53). In Scotland in 2008 approximately 54 % of children chose not to take school meals(50). In addition to improvements in schools, access to and availability of healthier choices may have had some impact. The food industry often uses the potential health benefits of foods to market their products, and the ‘5 a day’ message is often present on advertisements. Low-sugar and sugar-free options are also more widely available, creating an environment where consumers are more likely to make healthier choices. However, as this analysis has compared repeated cross-sectional surveys, it is not possible to attribute the changes seen to specific national policies or interventions, and further work would be required to do this.
In conclusion, while the positive changes seen are modest in most groups except younger children, it is important to note that across the board they are predominantly changes in the right direction. Furthermore, there are no dietary problem areas that have worsened. Continued monitoring of trends through the continuation of the NDNS rolling programme will allow further and more thorough comparisons to be made. More efforts are needed to improve the diets of older children, especially girls, and future campaigns should target this group specifically.
Acknowledgements
The authors would like to thank the Operations Team at NatCen and all interviewers involved for the collection of data; statisticians Dr Adrian Mander and Mark Chatfield for contributions to the survey design; and Melanie Farron-Wilson and Mary Day at the FSA for contributions to food composition issues. We also thank all participants of the survey for providing their dietary information.
The NDNS is funded by the FSA and the Department of Health.
C. W. analysed and interpreted the data, and wrote the manuscript. A. M. S., G. S., B. B., B. T., H. H. and C. R. designed, coordinated and supervised the survey. C. W., G. K. P. and A. O. prepared data for analysis. S. K. N., C. R., C. J. P., G. K. P. and A. M. S. contributed to the interpretation of results and editing of the manuscript. S. P. and C. D. contributed to survey design and data collection. E. F. coordinated food composition data. D. C. designed the nutrient analysis software. A. O. provided statistical guidance and contributed to editing of the manuscript. All authors approved the final draft before publication.
No authors have a conflict of interest to declare.


