

 O
OIt is well established that high levels of cardiorespiratory fitness (CRF) are associated with a favourable metabolic risk profile and an independent predictor of overall risk of illness and all-cause mortality(Reference Aspenes, Nilsen and Skaug1–Reference Lee, Sui and Ortega4). CRF is influenced by several factors, including age, sex, heredity, body composition and the individual's lifestyle factors(Reference Jackson, Sui and Hebert5, Reference Laukkanen, Laaksonen and Lakka6). Among those factors, lifestyle factors including physical activity, dietary habits and smoking status are thought to be modifiable contributors to variation in CRF.
Considerable evidence exists to demonstrate that both self-reported physical activity(Reference Lee, Sui and Ortega4, Reference Laukkanen, Laaksonen and Lakka6–Reference Rauramaa, Tuomainen and Vaisanen9) and objectively measured physical activity(Reference Cao, Miyatake and Higuchi10–Reference Ross and McGuire13) are clearly related to CRF. Compared with physical activity, fewer reports are available on the association between nutrition status and CRF(Reference Laukkanen, Laaksonen and Lakka6, Reference Brodney, McPherson and Carpenter14–Reference Cuenca-Garcia, Ortega and Huybrechts17). Existing studies usually focused on macronutrient intake. CRF has been frequently assessed using estimated ![]() O2max, and few studies have properly controlled for the confounding effects of physical activity. Previous studies have demonstrated that meeting the dietary recommendations for macronutrients is significantly associated with higher CRF levels in adults(Reference Brodney, McPherson and Carpenter14). However, there is a paucity of data on the relation between the status of micronutrient intake and CRF. In the present study, we examined the relationship between micronutrient intake status (based on adherence to the dietary reference intakes (DRI)) and directly measured CRF in Japanese men. As positive associations have been observed between physical activity and healthy nutritional intake(Reference Eaton, Lapane and Garber8, Reference Parsons, Power and Manor18), we also investigated whether these associations are independent of physical activity, quantified by step counts per d.
O2max, and few studies have properly controlled for the confounding effects of physical activity. Previous studies have demonstrated that meeting the dietary recommendations for macronutrients is significantly associated with higher CRF levels in adults(Reference Brodney, McPherson and Carpenter14). However, there is a paucity of data on the relation between the status of micronutrient intake and CRF. In the present study, we examined the relationship between micronutrient intake status (based on adherence to the dietary reference intakes (DRI)) and directly measured CRF in Japanese men. As positive associations have been observed between physical activity and healthy nutritional intake(Reference Eaton, Lapane and Garber8, Reference Parsons, Power and Manor18), we also investigated whether these associations are independent of physical activity, quantified by step counts per d.
Experimental methods
Subjects
The sample comprised 373 men aged 30–69 years (mean 48·8 (sd 11·5) years) who participated in the Physical Activity and Fitness for Health Promotion Study, which was designed to investigate Japanese physical activity and fitness as well as their association with other risk factors for lifestyle-related diseases. None of the subjects had any chronic diseases or were taking any medications that could affect the study variables. This study was conducted according to the guidelines laid down in the Declaration of Helsinki and all procedures involving human participants were approved by the Ethical Committee of the National Institute of Health and Nutrition. Written informed consent was obtained from all participants.
Dietary assessment
Dietary habits during the previous month were assessed with a brief self-administered diet history questionnaire (BDHQ) for Japanese adults(Reference Sasaki19). The BDHQ is a four-page structured questionnaire that enquires about the consumption frequency of a total of fifty-six food and beverage items, with specified serving sizes described in terms of the natural portion or the standard weight and volume measurement of servings commonly consumed in general Japanese populations. The BDHQ for adults was developed based on a comprehensive (sixteen-page) version of a validated self-administered diet history questionnaire(Reference Sasaki, Ushio and Amano20–Reference Sasaki, Yanagibori and Amano22). Estimates of dietary intake for the fifty-six food and beverage items, energy and selected nutrients were calculated using an ad hoc computer algorithm for the BDHQ, which was based on the Standard Tables of Food Composition in Japan(23, 24). The validity of the BDHQ using 16-d weighed dietary records as the ‘gold standard’ is described elsewhere(Reference Sasaki19, Reference Kobayashi, Honda and Murakami25, Reference Kobayashi, Murakami and Sasaki26). Nutrient variables were energy adjusted using the nutrient density method (amount of nutrient intake per 4184 kJ (1000 kcal)), to reduce the measurement error common with dietary assessment questionnaires and to avoid biased grouping due to variation in body size and energy requirement(Reference Willett and Stampfer27). Adequacy of nutrient intake was examined using the reference values given in the DRI for Japanese people as a temporal ‘gold standard’(28). Of the eighteen micronutrients with estimated average requirement presented in the DRI, five nutrients (Cr, Mo, Se, iodine and Na) were excluded from this study because the intake of these nutrients (Cr, Mo, Se and iodine) cannot be reliably assessed by the BDHQ or because for Na, a tentative dietary goal for the prevention of lifestyle-related diseases is more important than the estimated average requirement in the DRI. The thirteen selected micronutrients were vitamin A, thiamin, riboflavin, niacin, vitamin B6, vitamin B12, vitamin C, folate, Ca, Mg, Fe, Zn and Cu. For each of these nutrients, a nutrient adequacy score of 1 was allocated if the nutrient (amount of nutrient intake per 4184 kJ) met or exceeded the estimated average requirement (amount of nutrient intake per 4184 kJ) given in the DRI, and a ‘0’ if it did not meet the estimated average requirement. As a measure of overall micronutrient adequacy, an overall nutrient adequacy score (ONAS) was constructed by summing the scores of all nutrients. Overall micronutrient adequacy was defined as low (ONAS < 10), moderate (ONAS = 10 or 11), or high (ONAS = 12 or 13) according to the tertile of ONAS.
Cardiorespiratory fitness
CRF was defined as ![]() O2max during a maximal graded exercise test with bicycle ergometers (Lode Excalibur, Lode BV; Monark Ergomedic 828E). The methodology and equipment used in taking this measurement have been described in detail elsewhere(Reference Cao, Miyatake and Higuchi11). Achievement of
O2max during a maximal graded exercise test with bicycle ergometers (Lode Excalibur, Lode BV; Monark Ergomedic 828E). The methodology and equipment used in taking this measurement have been described in detail elsewhere(Reference Cao, Miyatake and Higuchi11). Achievement of ![]() O2max was accepted if at least two of three criteria were met: (1) a plateau in
O2max was accepted if at least two of three criteria were met: (1) a plateau in ![]() O despite increasing the work rate; (2) maximal RER ≥ 1·10; and (3) maximal heart rate was not less than 95 % of the age-predicted maximum (220 – age). Low (unfit), moderate and high CRF were defined according to the lowest 25 %, the middle 50 % and the upper 25 %, respectively, of the age-specific distribution of
O despite increasing the work rate; (2) maximal RER ≥ 1·10; and (3) maximal heart rate was not less than 95 % of the age-predicted maximum (220 – age). Low (unfit), moderate and high CRF were defined according to the lowest 25 %, the middle 50 % and the upper 25 %, respectively, of the age-specific distribution of ![]() O2max in all participants.
O2max in all participants.
Physical activity
We measured physical activity using the activity monitor (Kenz Lifecorder; Suzuken Co. Ltd). An activity monitor attached to a waist belt on the left side of the body was used to collect step count data for seven consecutive days in all participants. The mean total step counts per d were used for further analyses. Additional details have been published elsewhere(Reference Cao, Miyatake and Higuchi12).
Anthropometrics and smoking status
Height, without shoes, was measured to the nearest millimetre using a stadiometer. Body mass was measured using an electronic scale with the subjects wearing light clothing and no shoes and was determined to the nearest 0·1 kg. BMI was calculated by dividing the body mass in kilograms by the square of height in metres (kg/m2). Cigarette smoking status was assessed by self-report on a lifestyle and health history questionnaire. Smoking status was classified as never smoked, former smoker, or current smoker.
Statistical analysis
Subject characteristics (reported as mean values and standard deviations, or percentages) were contrasted between ![]() O2max tertiles using a one-way ANOVA for age, height, body mass, BMI,
O2max tertiles using a one-way ANOVA for age, height, body mass, BMI, ![]() O2max and step counts and for smoking status using the χ2 test (Table 1). The χ2 test was also used to identify significant differences in the prevalence of participants with inadequate micronutrient intake across levels of CRF. ANCOVA was used to identify significant differences in the micronutrient intake across levels of CRF after adjustment for the important confounding factors. The relationship of overall micronutrient intake adequacy with CRF was examined by multiple regression models. Model 1 adjusted for age, BMI and smoking status. Model 2 additionally adjusted for physical activity. Logistic regression analysis was used to determine the OR of being unfit (the lowest 25 % of the age-specific distribution of
O2max and step counts and for smoking status using the χ2 test (Table 1). The χ2 test was also used to identify significant differences in the prevalence of participants with inadequate micronutrient intake across levels of CRF. ANCOVA was used to identify significant differences in the micronutrient intake across levels of CRF after adjustment for the important confounding factors. The relationship of overall micronutrient intake adequacy with CRF was examined by multiple regression models. Model 1 adjusted for age, BMI and smoking status. Model 2 additionally adjusted for physical activity. Logistic regression analysis was used to determine the OR of being unfit (the lowest 25 % of the age-specific distribution of ![]() O2max) associated with each tertile of ONAS adjusted for age, BMI, smoking status (model 1) and further adjusted for physical activity (model 2). All statistical analyses were performed using SPSS statistical software version 19 (IBM Japan Ltd). Statistical significance was set at P < 0·05 (two-sided).
O2max) associated with each tertile of ONAS adjusted for age, BMI, smoking status (model 1) and further adjusted for physical activity (model 2). All statistical analyses were performed using SPSS statistical software version 19 (IBM Japan Ltd). Statistical significance was set at P < 0·05 (two-sided).
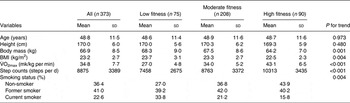
Characteristics of participants
(Mean values and standard deviations, or percentages)
Results
Descriptive characteristics across incremental categories of CRF are shown in Table 1. Significant inverse trends were observed for body mass (P value for trend = 0·001), BMI (P value for trend = 0·004), and smoking status (P value for trend = 0·004) across incremental CRF categories. Significant positive trends across incremental CRF categories were observed for step counts (low fitness group 7458, medium fitness group 8763 and high fitness group 10313 steps per d, respectively).
We examined the prevalence of inadequacy for micronutrient intake in our participants. As shown in Table 2, the average prevalence of adequacy calculated across all thirteen micronutrients was 78·9 % for Japanese men. Overall, the subjects reported diets with reasonable adequacy of intakes for niacin, vitamin B12, folate, Fe and Cu (96·5–100 %). However, the prevalence of potentially inadequate intakes was 25–35 % for Mg, Ca and Zn, and may also be relatively high for vitamin A (61·1 %) and thiamin (81·0 %).
Micronutrient intake (unit/4184 kJ) and proportion of participants with inadequate micronutrient intakes presenting a nutrient intake below the estimated average requirement (EAR) in the low, moderate and high fitness tertiles
(Mean values, standard errors and percentages)
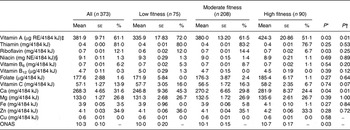
ONAS, overall nutrient adequacy score; RE, retinol equivalents; NE, niacin equivalents.
* P value for ANCOVA adjusted for age, BMI and smoking habits.
† P value for trend by the χ2 test.
‡ 1 µg RE = retinol (μg) + β-carotene (μg) × 1/12 + α-carotene (μg) × 1/24 + β-cryptoxanthin (μg) × 1/24 + other provitamin A carotenoids (μg) × 1/24(28).
§ NE were computed as niacin (mg) + protein (mg)/6000 according to the dietary reference intake for the Japanese(28).
We assessed differences of individual micronutrient intake and overall micronutrient intake status across levels of CRF by ANCOVA (Table 2). Participants in the high CRF category had the highest vitamin A, riboflavin and Ca intake and the highest ONAS compared with those in participants in the lower CRF categories (P value for ANCOVA <0·05, after adjustment for age, BMI and smoking status). These differences remain after further adjustment for step counts (vitamin A, P = 0·02; riboflavin, P = 0·08; Ca, P = 0·06). There were no significant differences in other nutrient intakes among CRF categories. We also observed a significant inverse trend for the prevalence of inadequacy for the intake of vitamin A (P value for trend = 0·006) and Ca (P value for trend = 0·005) across incremental CRF categories (Table 2).
In a multiple regression analysis with age, BMI, smoking status and ONAS as independent variables and CRF as the dependent variable, ONAS was the significant determinant of the variance in CRF in terms of absolute (β = 0·11, P < 0·05) and relative ![]() O2max (β = 0·10, P < 0·05) (Table 3). As seen in models 2 and 4, after further adjustment for step counts, ONAS remains the significant determinant of the variance in CRF in terms of absolute (β = 0·10, P < 0·05) and relative
O2max (β = 0·10, P < 0·05) (Table 3). As seen in models 2 and 4, after further adjustment for step counts, ONAS remains the significant determinant of the variance in CRF in terms of absolute (β = 0·10, P < 0·05) and relative ![]() O2max (β = 0·09, P < 0·05).
O2max (β = 0·09, P < 0·05).
Results of the multiple regression analyses between overall micronutrient intake status (overall nutrient adequacy score; ONAS) and cardiorespiratory fitness (n 373)*
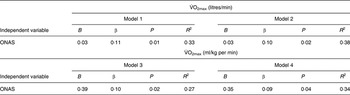
B, unstandardised regression coefficients; β, standardised regression coefficients.
* Model 1 is adjusted for age, BMI and smoking habits. Model 2 is adjusted for all covariates in model 1 plus step counts. Model 3 is adjusted for age and smoking habits.
Model 4 is adjusted for all covariates in model 3 plus step counts.
We fitted logistic regression models to assess the association between ONAS (tertile) and being unfit, adjusting for age, BMI and smoking status, with the lowest tertile used as the referent (Fig. 1). Individuals in the top tertile of ONAS had 52 % decreased odds of being unfit (OR 0·48; 95 % CI 0·24, 0·97), compared with those whose ONAS were in the lowest tertile. The OR of being unfit in the intermediate tertile compared with the lowest tertile was 0·57 (95 % CI 0·31, 1.05). The OR for being unfit remained strong comparing the top tertile with the lowest tertile (OR 0·49; 95 % CI 0·24, 0·99) when we further adjusted the models for step counts. After the further adjustment, the OR for being unfit in the intermediate tertile compared with the lowest tertile was 0·56 (95 % CI 0·30, 1·04). Similar results were observed when step counts were substituted with minutes of moderate- to vigorous-intensity physical activity as the adjusted variable (data not shown).
Odds of being unfit (low cardiorespiratory fitness) by overall nutrient intake status categories (overall nutrient adequacy score (ONAS) tertiles). ![]() , Lowest tertile (reference);
, Lowest tertile (reference); ![]() , intermediate tertile;
, intermediate tertile; ![]() , highest tertile. Values are OR, with 95 % CI represented by vertical bars. * Adjusted for age, BMI and smoking status. † Adjusted for age, BMI, smoking status and step counts.
, highest tertile. Values are OR, with 95 % CI represented by vertical bars. * Adjusted for age, BMI and smoking status. † Adjusted for age, BMI, smoking status and step counts.

Discussion
The main finding of the present study was that a number of dietary micronutrients and an overall micronutrient intake score representing the overall micronutrient adequacy for thirteen micronutrients were positively associated with CRF in a group of Japanese men. These associations were independent of physical activity and other potential confounding variables including age, BMI and smoking status, suggesting that physical activity does not confound the association between micronutrient intake and CRF in our population sample of Japanese men. Furthermore, these results show that participants who had a poor overall micronutrient intake status have a significantly higher risk of being unfit compared with men with a good micronutrient intake status.
Micronutrients most commonly function as essential co-enzymes and co-factors for metabolic reactions (as structural components of enzymes and mitochondrial cytochromes and as active electron and proton carriers in the ATP-generating respiratory chain) and thus help support basic cellular reactions (i.e. glycolysis, the citric acid cycle, lipid and amino acid metabolism) required to maintain energy production and life(Reference Lachance29). Although micronutrients probably play important roles in physical work capacity and therefore performance through different biological pathways, the relationship between dietary micronutrients and CRF is not well studied in the population sample of adults, especially in large sample sizes. Chatard et al. (Reference Chatard, Boutet and Tourny30) examined the association between micronutrient intake (eleven nutrient density variables) and CRF in eighteen sportsmen aged 56–72 years. Diet was assessed with a 6-d diet recall and CRF (![]() O2max) was objectively measured using a Monark cycle ergometer. Stepwise regression analyses indicated that vitamin C intake (expressed per 1000 kJ of energy intakes) was the only determinant to have a relationship with
O2max) was objectively measured using a Monark cycle ergometer. Stepwise regression analyses indicated that vitamin C intake (expressed per 1000 kJ of energy intakes) was the only determinant to have a relationship with ![]() O2max. By contrast, Butterworth et al. (Reference Butterworth, Nieman and Underwood31) studied a group of 20–40-year-old women (n 34) who varied widely in levels of physical activity and found no significant relationship between micronutrient intake (nutrient density) and
O2max. By contrast, Butterworth et al. (Reference Butterworth, Nieman and Underwood31) studied a group of 20–40-year-old women (n 34) who varied widely in levels of physical activity and found no significant relationship between micronutrient intake (nutrient density) and ![]() O2max, as assessed by a maximal graded treadmill test. However, they did not adjust for the important confounding factors. To our knowledge, only one study examined individual micronutrient intake in relation to CRF in a large sample of men and women. Brodney et al. (Reference Brodney, McPherson and Carpenter14) investigated nutrient intakes of 7959 men and 2453 women aged 20–87 years across low, moderate and high fitness categories. CRF was assessed using estimated
O2max, as assessed by a maximal graded treadmill test. However, they did not adjust for the important confounding factors. To our knowledge, only one study examined individual micronutrient intake in relation to CRF in a large sample of men and women. Brodney et al. (Reference Brodney, McPherson and Carpenter14) investigated nutrient intakes of 7959 men and 2453 women aged 20–87 years across low, moderate and high fitness categories. CRF was assessed using estimated ![]() O2max from treadmill time, and diet was assessed with a 3-d food record. The authors found that there was a significant difference across low, moderate and high fitness for both macronutrients and micronutrients (including vitamins A, B6, B12, C and E, folate and Ca), after adjusting for age, smoking status, health status and BMI in ANCOVA. However, they did not adjust micronutrient variables using the nutrient density method. Although physical activity is usually positively associated with healthy nutritional intake, the aforementioned studies do not appear to consider the independent effects of these lifestyle factors on CRF. Our results are the first to confirm that micronutrient intake is correlated with CRF independent of physical activity level (Table 2).
O2max from treadmill time, and diet was assessed with a 3-d food record. The authors found that there was a significant difference across low, moderate and high fitness for both macronutrients and micronutrients (including vitamins A, B6, B12, C and E, folate and Ca), after adjusting for age, smoking status, health status and BMI in ANCOVA. However, they did not adjust micronutrient variables using the nutrient density method. Although physical activity is usually positively associated with healthy nutritional intake, the aforementioned studies do not appear to consider the independent effects of these lifestyle factors on CRF. Our results are the first to confirm that micronutrient intake is correlated with CRF independent of physical activity level (Table 2).
A unique contribution of the present study is that associations between individual and overall micronutrient adequacy and CRF were examined in a sample of Japanese men. Our results showed a significant inverse trend for prevalence of inadequacy for the intake of vitamin A and Ca across incremental CRF categories (Table 2). As in vivo biological activities of nutrients are interdependent, the combination of inadequate micronutrient intakes may have a greater impact on functional status than inadequate intake of individual micronutrients(Reference van der Beek, van Dokkum and Wedel32). We therefore also examined relationships between overall micronutrient intake status (ONAS, overall micronutrient adequacy for thirteen selected micronutrients) and CRF. We found that ONAS emerged as a significant independent determinant of ![]() O2max. As shown in Table 3, for each 1-score increase in ONAS, the value of
O2max. As shown in Table 3, for each 1-score increase in ONAS, the value of ![]() O2max increased by 0·03 litres/min or 0·35 ml/kg per min after adjusting for step counts and other potential confounding variables. Individuals who had an inadequacy intake of a single micronutrient (the top tertile of ONAS) had a 51 % decreased odds of being unfit compared with those whose intake of more than four micronutrients was inadequate (the lowest tertile) even after adjusting for age, BMI, smoking status and physical activity. These results extend the findings of a previous study of males in the Netherlands(Reference van der Beek, van Dokkum and Schrijver33), in which the authors carried out a double-blind intervention examination of the combined restriction of thiamin, riboflavin and vitamins B6 and C in relation to
O2max increased by 0·03 litres/min or 0·35 ml/kg per min after adjusting for step counts and other potential confounding variables. Individuals who had an inadequacy intake of a single micronutrient (the top tertile of ONAS) had a 51 % decreased odds of being unfit compared with those whose intake of more than four micronutrients was inadequate (the lowest tertile) even after adjusting for age, BMI, smoking status and physical activity. These results extend the findings of a previous study of males in the Netherlands(Reference van der Beek, van Dokkum and Schrijver33), in which the authors carried out a double-blind intervention examination of the combined restriction of thiamin, riboflavin and vitamins B6 and C in relation to ![]() O2max in eleven men. They found that a combined restricted intake of these micronutrients caused a 9·8 % decrease in
O2max in eleven men. They found that a combined restricted intake of these micronutrients caused a 9·8 % decrease in ![]() O2max within a few weeks. The aforementioned results indicate that it is necessary to incorporate both dietary and physical activity advice into fitness promotion counselling.
O2max within a few weeks. The aforementioned results indicate that it is necessary to incorporate both dietary and physical activity advice into fitness promotion counselling.
Our study has some limitations. The study participants consisted of only men aged 30–69 years and are not representative of the entire Japanese population, and thus the present results may have limited generalisability. Our study was a cross-sectional study, and cannot provide causal evidence on the association between micronutrient intake status and CRF. Despite its limitations, the present study has some strengths, including the relatively large population sample of Japanese men, the objective measures of CRF and physical activity and the examination of ‘the micronutrient intake status (based on adherence to DRIs)’–CRF relationship and an important confounding variable (physical activity).
Conclusion
In conclusion, both several individual micronutrients' intake and overall micronutrient intake status were found to be independently and positively associated with CRF in Japanese men.
Acknowledgments
This research was supported by a Research Grant for Comprehensive Research on Cardiovascular and Life-Style Related Diseases from the Ministry of Health, Labour and Welfare, Japan (no. 19160101) and by a Grant-in-Aid for the Global COE, Waseda University ‘Sport Sciences for the Promotion of Active Life’ from the Ministry of Education, Culture, Sports, Science and Technology of Japan (no. A09338100). The authors have no conflict of interest. The author contributions are as follows: Z. B. C.: the study concept and design, collection and assembly of data, statistical analysis and interpretation of data, drafting of the manuscript; A. S.: acquisition of data, technical support; T. O., N. M., K. T. and M. H.: acquisition of data; S. S.: interpretation of the data, technical support; I. T.: the study concept and design, collection and assembly of the data, interpretation of the data, reviewing and editing the manuscript. All authors read and approved the final manuscript.


 Open access