


Introduction
Synanthropic rodents cohabiting with humans, including Rattus rattus, Rattus norvegicus and Mus musculus, are of great public health importance (Steppan et al., Reference Steppan, Adkins, Spinks and Hale2005; Himsworth et al., Reference Himsworth, Parsons, Jardine and Patrick2013), as they can carry at least 66 zoonotic diseases transmitted by viruses, bacteria, fungi, helminths and protozoa (Han et al., Reference Han, Schmidt, Bowden, Drake and Levin2015). Fleas, mites and lice are the most prevalent ectoparasites in rats and mice, while ticks, although important vectors of infectious agents, do not usually parasitize synanthropic rodents (Berdoy et al., Reference Berdoy, Webster and Macdonald1995; Mihalca et al., Reference Mihalca, Dumitrache, Magdaş, Gherman, Domşa, Mircean, Ghira, Pocora, Ionescu, Sikó Barabási, Cozma and Sándor2012; Hornok et al., Reference Hornok, Földvári, Rigó, Meli, Gönczi, Répási, Farkas, Papp, Kontschán and Hofmann-Lehmann2015; Chakma et al., Reference Chakma, Picard, Duffy, Constantinoiu and Gummow2017). Among the bacteria with pathogenic potential transmitted by vector-associated arthropods, those of the genus Bartonella and Rickettsia stand out (Eisen and Gage, Reference Eisen and Gage2012). However, despite the wide distribution of rodents and their importance as vectors in public health, there are still gaps in knowledge about the role of ectoparasites in transmitting these bacteria.
According to Armién et al. (Reference Armién, Ortiz, Gonzalez, Cumbrera, Rivero, Avila, Armién, Koster and Glass2016), the presence of these bacteria is related to environments with anthropogenic disturbance. Urban expansion modifies the structure of rodent communities, favouring generalist and synanthropic species to the detriment of specialized native wild rodents (Faeth et al., (Reference Faeth, Warren, Shochat and Marussich2005); Bradley and Altizer, Reference Bradley and Altizer2007). Encroachment into wilderness areas due to increasing human population expansion leads to a greater likelihood of contact with infected ectoparasites (Moreno-Salas et al., Reference Moreno-Salas, Espinoza-Carniglia, Lizama Schmeisser, Torres, Silva-de la Fuente, Lareschi and González-Acuña2019; Fantozzi et al., Reference Fantozzi, Sánchez, Lareschi and Beldomenico2021) increasing the probability of disease transmission (Dickman and Doncaster, Reference Dickman and Doncaster1987; Hassell et al., Reference Hassell, Begon, Ward and Fèvre2017).
Conversely, rural areas play a crucial role in the epidemiology of infectious diseases, acting as points of interaction between wild and domestic species, including humans (López Berrizbeitia et al., Reference López Berrizbeitia, Acosta and Sánchez2024). This generates a higher probability of disease emergence, particularly bacterial, which can then spread to both urban and wild environments (Neiderud, Reference Neiderud2015).
Bartonella spp. are classified as intracellular Gram-negative bacteria, mainly transmitted by rodents, which serve as important reservoirs (Ying et al., Reference Ying, Kosoy, Maupin, Tsuchiya and Gage2002; Favacho Arm de et al., Reference Favacho Arm de, Andrade, de Oliveira, Bonvicino, D’Andrea and de Lemos2015; Gonçalves et al., Reference Gonçalves, Favacho Ar de, Roque, Mendes, Fidelis Junior, Benevenute, Herrera, D’Andrea, de Lemos, Machado and André2016). Ectoparasites, like fleas, mites and lice, may act as vectors (Colborn et al., Reference Colborn, Kosoy, Motin, Telepnev, Valbuena, Myint, Fofanov, Putonti, Feng and Peruski2010; Klangthong et al., Reference Klangthong, Promsthaporn, Leepitakrat, Schuster, McCardle, Kosoy and Takhampunya2015; Moreno-Salas et al., Reference Moreno-Salas, Espinoza-Carniglia, Lizama Schmeisser, Torres, Silva-de la Fuente, Lareschi and González-Acuña2019). These bacteria are responsible for numerous emerging or re-emerging infectious diseases, with clinical manifestations that vary depending on the type of infection and the immune status of the patient (Tahmasebi Ashtiani et al., Reference Tahmasebi Ashtiani, Bagheri Amiri, Ahmadinezhad, Mostafavi and Esmaeili2025). They primarily infect erythrocytes and epithelial cells, and exhibit mechanisms for evading the host immune system (Harms and Dehio, Reference Harms and Dehio2012).
Another zoonotic disease transmitted by rodents involves bacteria of the genus Rickettsia, which are transmitted by fleas that infest rodents, birds, cats and occasionally humans (Renvoisé et al., Reference Renvoisé, Joliot and Raoult2009). Rickettsiae are obligate intracellular Gram-negative bacteria that cause rickettsioses such as Spotted Fever and Murine Typhus (Gillespie et al., Reference Gillespie, Williams, Shukla, Snyder, Nordberg, Ceraul, Dharmanolla, Rainey, Soneja, Shallom, Vishnubhat, Wattam, Purkayastha, Czar, Crasta, Setubal, Azad and Sobral2008).
Given that 75% of human diseases are of zoonotic origin (Taylor et al., Reference Taylor, Latham and Woolhouse2001), understanding the epidemiology of rodent ectoparasites is crucial. Although there is extensive literature on synanthropic rodents worldwide, data on the pathogens carried by ectoparasites in South America remain scarce (González-Acuña and Guglielmone, Reference González-Acuña and Guglielmone2005; Lareschi and Krasnov, Reference Lareschi and Krasnov2010; Nava and Lareschi, Reference Nava and Lareschi2012; López Berrizbeitia et al., Reference López Berrizbeitia, Sánchez, Díaz, Barquez and Lareschi2015; Lareschi et al., Reference Lareschi, Sánchez and Autino2016; Nava et al., Reference Nava, Venzal, Acuña, Martins and Guglielmone2017; Moreno-Salas et al., Reference Moreno-Salas, Espinoza-Carniglia, Lizama Schmeisser, Torres, Silva-de la Fuente, Lareschi and González-Acuña2019).
This study aims to evaluate the association between ectoparasite abundance, prevalence and diversity – including lice, fleas, mites and ticks – and the presence of Bartonella and Rickettsia in ectoparasites collected from R. rattus across varying anthropogenic gradients in Chile. It is hypothesized that ectoparasite abundance, prevalence and diversity are positively associated with the presence of Bartonella and Rickettsia within these ectoparasites, and that these associations differ according to the level of anthropogenic disturbance across localities in Chile.
Materials and methods
Areas of study
A total of 27 localities in Chile were analysed (Figure 1), classified according to their degree of anthropization, following the definitions of the National Institute of Statistics: ‘City’ (urban entity with more than 5,000 inhabitants) and ‘Rural’ (rural entity with a population between 2,001 and 5,000 inhabitants, or between 1,001 and 2,000 inhabitants, which meets the economic activity criteria of INE, 2005). The natural areas (‘Wild’) evaluated consisted of Parks and Reserves administered by CONAF (Corporación Nacional Forestal, Chile).
Map of Chile indicating the rodent sampling locations, subdivided; blue: urban zone (city), green: rural zone, orange: wild zone.

Live rodents were captured using Sherman traps baited with oats over 2 consecutive nights at each sampling site in 4 seasons (summer, autumn, winter, spring). To obtain a larger coverage area, transects equipped with 200 traps were set up, spaced 10 m apart, resulting in a total sampling effort of 4,800 traps per night. This allowed for a more representative sampling of the rodent population in each locality studied, considering seasonal variations.
Each captured rodent was identified using taxonomic guides (Iriarte, Reference Iriarte2008). Figure 2 illustrates the methodology used to ensure animal welfare and facilitate handling. All handling and euthanasia of the animals followed protocols for field and laboratory studies with rodents (Herbreteau et al., Reference Herbreteau, Jittapalapong, Rerkamnuaychoke, Chaval, Cosson, Morand, JC, Blasdell, Bordes, Chabé, Chaisiri, Charbonnel, Claude, Dei-Cas, Desquesnes, Dobigny, Douangboupha, Galan, Haukisalmi, Henttonen, Herbreteau, Hugot, Jiyipong, Latinne, Michaux, Milocco, Pagès, Phoophitpong, Pumhom, Ribas Salvador, Soonchan, Suputtamongkol, Waengsothorn, Waywa, Xuéreb and Pdr2011), approved by the Ethics Committee of the Vice-Rectory of Research and Development of the Universidad de Concepción. Rodent captures were authorized by the Agricultural Service (SAG R.E: 8968-2015, 1657-2016, 73-2016, 23-2017) and the National Forestry Corporation (CONAF Nº 018-2015).
Methodology used to ensure the welfare of the animals.

Mounting and identification of ectoparasites
Fleas collected were prepared following the modified methodology of Hastriter and Whiting (Reference Hastriter, Whiting, Resh and Cardé2009). Mites and ticks (nymph and larvae) were rinsed in Nesbitt’s solution (40 g chloral hydrate, 25 mL distilled water and 2.5 mL concentrated HCL) for 72 h and then mounted as permanent preparations using Berlese’s solution (Krantz and Walter, Reference Krantz and Walter2009). Lice were treated with 20% KOH for initial deposition, stained with alcohol-phenol-eosin, clarified using alcohol-phenol, and permanently mounted using Canada balsam (Price et al., Reference Price, Hellenthal, Palma, Johnson and Clayton2003).
Ectoparasites were identified using taxonomic characteristics and specific descriptions for each group. Identification references included Hopkins and Rothschild (Reference Hopkins and Rothschild1962), Hopkins (Reference Hopkins1956), Hopkins and Rothschild (Reference Hopkins and Rothschild1966), Johnson (Reference Johnson1957), Sánchez and Lareschi (Reference Sánchez and Lareschi2014) and López Berrizbeitia et al. (Reference López Berrizbeitia, Sánchez, Díaz, Barquez and Lareschi2015) for fleas, Brennan and Goff (Reference Brennan and Goff1977), Furman (Reference Furman1972) and Radovsky (Reference Radovsky2010) for mites, Castro (Reference Castro1982), Castro and González (Reference Castro and González1996) and Gómez (Reference Gómez1998) for lice, and Keirans and Clifford (Reference Keirans and Clifford1978), Guglielmone et al. (Reference Guglielmone, Estrada-Peña, Keirans and Robbins2004), Barros-Battesti et al. (Reference Barros-Battesti, Ramirez, Landulfo, Faccini, Dantas-Torres, Labruna, Venzal and Onofrio2013), and Nava et al. (Reference Nava, Venzal, Acuña, Martins and Guglielmone2017) for ticks.
Estimation of parasitological descriptors and ectoparasite diversity
Mean abundance (MA), mean intensity (MI) and prevalence (P%) were calculated using Quantitative Parasitology 3.0 software. The 95% confidence intervals were determined using the bootstrap method (2,000 replicates). The bootstrap t-test was applied to compare MA and MI between seasons and anthropization zones, while Fisher’s exact t-test was used to analyse P% data. Due to the low number of samples and the lack of significant differences between seasons regarding ectoparasites presence, seasons were grouped.
Diversity was estimated using the Shannon–Wiener index (H’), which considers both species richness and relative abundance in the host community. Only species with more than 10 individuals were included for statistical analysis.
Molecular identification of Bartonella and Rickettsia spp. in ectoparasites
Collected ectoparasites underwent DNA extraction individually (adult ticks and fleas) or in pools of up to 10 individuals per species (tick nymphs, mites and lice). Since it was necessary to identify ectoparasites morphologically prior to DNA extraction, different treatments were applied to the different groups of ectoparasites. For fleas, specimens were cut in half between the third and fourth abdominal tergites using a sterilized scalpel, taking care to change the scalpel between each sample. After DNA extraction, the exoskeleton was recovered and mounted following the previously described protocols. For adult ticks, individuals were identified under a stereomicroscope before proceeding with DNA extraction after maceration. In the case of nymphs and larvae, where extraction was performed in pools for each group, individuals were first examined under a stereomicroscope; some were mounted and identified, while the remaining specimens were grouped in pools and macerated for DNA extraction. For lice, a similar procedure was followed: specimens were examined under a stereomicroscope, selected individuals were mounted and identified, and the remaining ones were subjected to DNA extraction. The parasite pools were determined by host individual.
DNA was extracted using the DNeasy Blood & Tissue® kit (Qiagen, Hilden, Germany) following the manufacturer’s instructions. DNA concentrations were quantified using a Nanodrop TM 2000 spectrophotometer (Thermo Fisher TM), obtaining values between 50 and 200 ng/μL.
To determine the presence of Bartonella and Rickettsia species, real-time PCR (qPCR) screening with SYBR Green was performed. Detailed molecular characterization was subsequently conducted using conventional PCR (cPCR) followed by sequencing of the amplified products. Endogenous gene amplification for all ectoparasites DNA was performed via cPCR for detection of eukaryotic 18S rRNA DNA using the following primer sequences: F-573: CGC GGT AAT TCC AGC TCC A and R-1200: CCC GTG TTG AGT CAA ATT AAG C (Hadziavdic et al., Reference Hadziavdic, Lekang, Lanzen, Jonassen, Thompson and Troedsson2014).
For Bartonella spp. and Rickettsia spp. detection, ectoparasite samples were processed in duplicate for qPCR. Cycles were performed on the CFX96 Touch™ Real-Time PCR Detection System CFX96 thermal cycler (BioRad, Hercules, CA, USA) with Low-Profile Multiplate™ PCR plates (BioRad©, Hercules, CA). For the detection of Bartonella spp. qPCR first targeted the nuoG fragment (Colborn et al., Reference Colborn, Kosoy, Motin, Telepnev, Valbuena, Myint, Fofanov, Putonti, Feng and Peruski2010). Positive samples were submitted to conventional PCR amplification targeting the gltA (citrate synthase), rpoB (subunit RNA polymerase) genes and ITS intergenic region (16S-23S rRNA) (Pitulle et al., Reference Pitulle, Strehse, Brown and Breitschwerdt2002; Maggi and Breitschwerdt, Reference Maggi and Breitschwerdt2005; Paziewska et al., Reference Paziewska, Harris, Zwolińska, Bajer and Siński2011; Moreno-Salas et al., Reference Moreno-Salas, Espinoza-Carniglia, Lizama Schmeisser, Torres, Silva-de la Fuente, Lareschi and González-Acuña2019; Müller et al., Reference Müller, Gutiérrez, Seguel, Monti, Otth, Bittencourt, Sepúlveda, Alabí, Nachum-Biala and Harrus2020). Details of primers and amplified fragment size for each gene are provided in Table 1.
Targets genes and primers sets used for conventional PCR for detections of Bartonella spp. and Rickettsia spp. in this study

For the detection of Rickettsia spp. qPCR amplified a fragment of citrate synthase (gltA) gene following the protocol of Stenos et al. (Reference Stenos, Graves and Unsworth2005), with some modifications. The qPCR amplified gltA using cycles at 95 °C for 1 min, followed by 40 cycles at 95 °C for 15 sec and 60 °C for 1 min. PCR was then conducted for positive samples targeting the gltA, ompA and ompB (outer membrane protein A and B) genes (Table 1).
To calculate the frequency of bacterial DNA detection in Bartonella and Rickettsia within each ectoparasite group and locality, a sample was considered positive if at least 1 of 3 specific genes was amplified (gltA, ITS and rpoB for Bartonella; gltA, ompA and ompB for Rickettsia).
Sequencing of conventional PCR amplicons was performed by MACROGEN (Seoul, Korea). Sequences were aligned and assembled into a contig, and primer sequences were trimmed using MEGA v.7 software (Kumar et al., Reference Kumar, Stecher and Tamura2016). Sequence alignments were performed using MUSCLE (Edgar, 2004). Ambiguities were resolved manually by analysing chromatograms. Clean sequences were initially analysed by BLASTn using the MegaBLAST algorithm in NCBI (National Center for Biotechnology Information) to confirm species identity and place our sequences within the broader genetic context of Bartonella and Rickettsia (Morgulis et al., Reference Morgulis, Coulouris, Raytselis, Madden, Agarwala and Schäffer2008; Chen et al., Reference Chen, Ye, Zhang and Xu2015).
A maximum likelihood phylogenetic tree was constructed for each gene (gltA, ITS and rpoB for Bartonella; ompB for Rickettsia), using IQ-TREE2 (Minh et al., Reference Minh, Schmidt, Chernomor, Schrempf, Woodhams, von Haeseler and Lanfear2020), and Brucella abortus was used as an outgroup for Bartonella trees, except for the ITS gene, for which Bartonella bacilliformis was used. The Rickettsia tree was rooted with Rickettsia bellii. A best-fit model and bootstrap support based on 1,000 replicates were applied.
Genetic diversity within Bartonella and Rickettsia populations was assessed using specialized tools. Haplotype identification was performed using DnaSP v6.11.01 (Rozas et al., Reference Rozas, Ferrer-Mata, Sánchez-delbarrio, Guirao-Rico, Librado, Ramos-Onsins and Sánchez-Gracia2017). Additionally, we implemented a methodology for constructing haplotype networks using R software (Paradis, Reference Paradis2010; R Core Team, 2022). Haplotypes were named sequentially (H1, H2, etc.) according to their frequency in the dataset. Names do not correspond to preexisting GenBank haplotypes but were assigned for the purpose of this study.
The sequences were deposited in GenBank as follows: for Bartonella, accession numbers PP151229–PP151235 (gltA sequences), PP151219–PP151228 (rpoB sequences), and PP150442–PP150444 (ITS sequences). For Rickettsia, accession numbers PP151242 (gltA sequence) and PP151236–PP151241 (ompA sequences).
Association between Bartonella and Rickettsia presence with parasitological descriptors and degrees of anthropization
To assess the relationship between bacterial occurrence with degrees of anthropization (locality type), abundance, diversity and prevalence of ectoparasites, generalized linear models (GLM) were used. The presence or absence of the bacterial DNA in the ectoparasites was considered the dependent variable in a binomial distribution and logit function, while the explanatory variables included locality type (city, rural and wild), abundance and prevalence of each ectoparasite group (fleas, mites, lice and ticks), and diversity of all ectoparasites. The Chi-square test was used to evaluate the differences in the prevalence of Bartonella and Rickettsia. Values of p ≤ 0.05 were considered significant. These analyses were performed using the JMP software® (SAS Institute Inc., USA).
Results
Ectoparasites and degree of anthropization
A total of 411 R. rattus individuals were captured across different seasons (summer: n = 188; autumn: n = 27; winter: n = 168; spring: n = 28) and localities (city: n = 190; rural: n = 64; wild: n = 157). From these individuals, 1,339 ectoparasites were collected, including lice (52.48%; n = 697), fleas (17.6%; n = 236), mites (16.8%, n = 225) and ticks (13.5%; n = 181) (Table 2). Taxonomic identification yielded 2 louse species, 17 flea species, 3 mite taxa (2 identified to genus level and one to family level), and 2 tick species (Table 3).
Ectoparasites collected from Rattus rattus according to the degree of anthropization. Prevalence (P%), mean abundance (MA) and mean intensity (MI) are given with their respective confidence intervals (CI 95)

Parasitological indices for the different areas of anthropization by species and ectoparasite group. The confidence interval (95%) is indicated in brackets to the right of each value. P%: Prevalence, MA: Mean abundance, MI: Mean intensity, C: City, R: Rural, W: Wild, N: number of ectoparasites

Regarding lice, the 2 species identified, Polyplax spinulosa and Hoplopleura pacifica, correspond to native Rattus species. Polyplax spinulosa was the dominant species, detected in 15 of the 27 sampled localities, whereas H. pacifica was found in only one. Polyplax spinulosa showed higher prevalence in wild localities compared with rural and city areas (p = 0.001), with no difference between rural and cities (p = 0.48). Mean abundances and intensity of P. spinulosa were also significantly greater in wild than cities (MA: p = 0.001; MI: p = 0.002) but did not differ significantly between wild and rural (MA: p = 0.1; MI: p = 0.65) or between rural and cities (MA: p = 0.37; MI: p = 0.26).
Three species commonly associated with Rattus hosts were identified: Leptopsylla segnis, Nosospsyllus fasciatus and Xenopsylla cheopis. Leptopsylla segnis and N. fasciatus were widely distributed, occurring in 8 and 11 of the 27 localities, respectively. Whereas X. cheopis was found only in a single city in the extreme north of Chile (Iquique). Leptopsylla segnis was significantly more prevalent in rural localities than in wild or city sites (p = 0.02), although no differences in mean abundance or intensity were detected across locality types (P%: p = 0.6; MA: p = 0.1; MI: p = 0.1) (Table 3). In contrast, N. fasciatus showed higher prevalence and mean abundance in the cities than in wild areas (P%: p = 0.001; MA: p = 0.005), and its prevalence was also greater in wild than rural localities (P%: p = 0.003). However, no significant differences in mean intensity were observed between cities and wild areas (MI: p = 0.2) nor in any parasitological descriptors significantly different between cities and rural localities (P%: p = 0.8; MA: p = 0.7; MI: p = 0.9). Likewise, rural and wild localities did not differ significantly in abundance or intensity for this species (MA: p = 0.15; MI: p = 0.67) (Table 3).
For mites, Ornithonyssus sp. was de most abundant and prevalent species. However, no significant differences were detected among locality anthropization types, whether comparing wild and rural (AM: p = 0.07; P%: p = 0.13; IM: p = 0.12), wild and cities (AM: p = 0.2; P%: p = 0.07; IM: p = 0.74) and cities and rural (AM: p = 0.1; P%: p = 0.8; IM: p = 0.08) (Table 3).
Regarding ticks, only Ixodes sigelos (n = 173) and larvae of Ornithodoros sp. (n = 3) were identified. No significant differences were observed in the prevalence, mean abundance and mean intensity of I. sigelos between wild and rural localities (P%: p = 0.2; MA: p = 0.9; MI: p = 0.4) or between wild and cities (P%: p = 0.3; MA: p = 0.4; MI: p = 0.5) and rural and cities localities (P%: p = 0.3; MA: p = 0.4; MI: p = 0.5) (Table 3).
Detection and prevalence of Bartonella and Rickettsia
Bartonella and Rickettsia DNA were detected in all ectoparasite groups. Prevalence estimates are reported as pool prevalence for lice, mites and immature ticks (processed in pools of 10 specimens per host), and as individual prevalence for adult fleas and ticks (Table 4). In lice were tested in 99 pools, of which 33.3% (33/99; 95% CI: 20–45%) were positive for Bartonella and 19.2% (19/99; 95% CI: 9–29%) for Rickettsia. In mites, 22.0% (12/54; 95% CI: 8–36%) were positive for Bartonella, and 23.2% (23/54; 95% CI: 13–33%) for Rickettsia. Among ticks (n = 90; adults analysed individually, larvae and nymphs in pools), Bartonella DNA was detected in 26.6% (24/90; 95% CI: 14–38%) and Rickettsia DNA in 24.4% (22/90; 95% CI: 13–33%). In fleas, which were analysed individually (n = 193), Bartonella DNA prevalence was 53.4% (103/193; 95% CI: 44–63%) and Rickettsia DNA 50.3% (97/193; 95% CI: 49–50%).
Prevalence of Bartonella and Rickettsia DNA in ectoparasite groups collected from localities with different degrees of anthropization. Detection was considered positive when at least one of the 3 target genes was amplified via qPCR (Bartonella: gltA, ITS, rpoB; Rickettsia: gltA, ompA, ompB). Prevalence is expressed as percentage and number of positive samples (in parenthesis)

Bacteria prevalence varied by locality anthropization types within ectoparasite groups. Notably, both agents showed higher detection in rural environments, e.g. Bartonella in fleas (55.9%) and mites (33.3%), and Rickettsia in mites (66.7%) and fleas (61%) (Table 4).
Molecular identification and genetic diversity
Of 68 amplified Bartonella targets (10 gltA, 35 rpoB and 23 ITS), 30 yielded high-quality sequences suitable for analysis. Six samples provided multilocus confirmation (e.g. BP3, II124a, IV160e), with consistent taxonomic assignments across loci (Table 5). Sequences of gltA, rpoB and ITS of Bartonella isolated from fleas revealed significant divergence, associated with B. tribocorum, B. rochalimae, B. mastomydis, B. doshiae and several uncultured Bartonella lineages (Figures 3–5). On the other side, rpoB and ITS showed that sequences obtained from P. spinulosa were associated to B. coopersplainsensis and B. japonica (Figures 3 and 5). Meanwhile, ITS sequences from ticks were associated in the same clade of Bartonella of fleas and lice (Figure 5). Haplotype analysis in Bartonella seuqences from rpoB, gltA and ITS regions revealed five haplotypes for rpoB, seven for gltA and three for ITS. Haplotype diversity values were high across all markers (Hd-rpoB= 0.87, Hd-gltA= 0.94, Hd-ITS= 0.70), indicating substantial genetic variability despite the limited sample size (Figures 6–8).
Phylogenetic tree obtained by maximum likelihood of Bartonella sequences based on the rpoB region (highlighted in red). These sequences were obtained from ectoparasites on Rattus rattus from various locations in Chile. The numbers at the nodes represent the Bootstrap support value (1000 replicates).

Phylogenetic tree obtained by Maximum Likelihood of Bartonella sequences based on the gltA region (highlighted in red). These sequences were obtained from ectoparasites on Rattus rattus from various locations in Chile. The numbers at the nodes represent the Bootstrap support value (1000 replicates).

Phylogenetic tree obtained by Maximum Likelihood of Bartonella sequences based on the ITS region (highlighted in red). These sequences were obtained from ectoparasites on Rattus rattus from various locations in Chile. The numbers at the nodes represent the Bootstrap support value (1000 replicates).

Haplotype network for Bartonella using sequences from the rpoB region extracted from ectoparasites of Rattus rattus in different locations in Chile. The numbers on each branch indicate the number of nucleotide changes between haplotypes. BP3, lice from Sierra de Bellavista; CP7, lice from La Campana; II124a, flea from R. N. Nonguén; II125B, flea from P. N. Fray Jorge; II93c, flea from R. N. Nonguén; III39A, flea from Illapel; III81e, flea from Sotaquí; III82D, flea from Sotaquí; IIV80G, flea from Sotaquí; IV160e, flea from Iquique; IV69A, flea from Sotaquí; IV77a, flea from Monte Patria; IV80A, flea from Sotaquí; IX271B, flea from R. N. Isla Mocha; V23a, flea from Puerto Aysén.

Haplotype network for Bartonella using sequences from the gltA region extracted from ectoparasites of Rattus rattus in different locations in Chile. The numbers on each branch indicate the number of nucleotide changes between haplotypes. II124a, flea from R. N. Nonguén; III57A, flea from Canela Baja; III75b, flea from Canela Baja; IV160a, flea from Iquique; IV160e, flea from Iquique; IV7b, flea from Illapel; IX271B, flea from R. N. Isla Mocha; V23a, flea from Puerto Aysén; V23c, flea from Puerto Aysén.

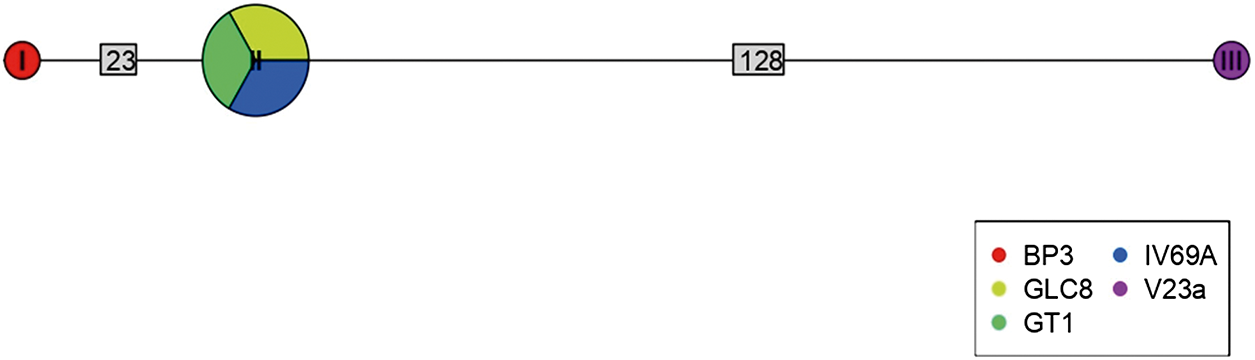
Haplotype network for Bartonella using sequences from the ITS region extracted from ectoparasites of Rattus rattus in different locations in Chile. The numbers on each branch indicate the number of nucleotide changes between haplotypes. BP3, lice from Sierra de Bellavista; GLC8, tick from La Campana; GT1, tick from Til–Til; IV69a, flea from Sotaquí; V23a, flea from Puerto Aysén.

BLASTn results for Bartonella and Rickettsia sequences obtained from ectoparasites of Rattus rattus. The table indicates gene fragments, number of occurrences, closest BLASTn matches, similarity values, and GenBank accession numbers. An additional column specifies the samples that yielded multilocus sequences (gltA, rpoB, ITS)

For Rickettsia, 31 high-quality ompB sequences were obtained, all matching Rickettsia felis (99, 12–100% identity to GenBank MN267050.1 in 30 cases). A single gltA sequence from a flea in Illapel showed 99.7% identity to an uncultured Rickettsia sp. (GenBank accession: KY753118.1) previously reported in Brazil (Table 5). The ompB phylogenetic tree revealed a polytomy among sequences of fleas, mites, lice and ticks across multiple localities, all of them associated only with R. felis (Figure 9).
Phylogenetic tree obtained by Maximum Likelihood of Rickettsia sequences based on the ompB region (within the pink box). These sequences were obtained from ectoparasites on Rattus rattus from various locations in Chile. The numbers at the nodes represent the Bootstrap support value (1,000 replicates).

Association with environmental and parasitological descriptors
Generalized linear models revealed negative associations between pathogen occurrence and certain ecological variables (Table 6). The presence of Bartonella was significantly reduced with increasing anthropization (β = –0.48, p = 0.005) and higher tick prevalence (β = – 0.42, p = 0.009). Similarly, the presence of Rickettsia was lower with higher flea prevalence (β = –0.12, p = 0.02) and tick prevalence (β = –0.30, p = 0.01) were both negatively associated with detection. Neither bacterium showed significant associations with overall ectoparasite abundance or diversity.
Generalized linear models (GLM) of Bartonella and Rickettsia presence. Values that are statistically significant are show in bold

L-R, likelihood ratio; df, degrees of freedom; SE, standard error;
* p ≤ 0.05.
Discussion
This study evaluated the association between ectoparasite abundance, prevalence and diversity – including lice, fleas, mites and ticks – and the presence of Bartonella and Rickettsia in R. rattus across urban, rural and wild environment in Chile. Contrary to our hypothesis, anthropization and ectoparasite prevalence showed negative associations with bacteria detection: Bartonella occurrence declined whit increasing urbanization and higher ticks prevalences, while Rickettsia was negatively associated with both flea and tick prevalences. These results suggest complex ecological interactions that may involve vector competition, host immune modulation, or environmental filter.
Ectoparasites and degree of anthropization
Lice (P. spinulosa) were the most abundant ectoparasites overall and predominated in wild areas, in contrast with the higher urban dominance of N. fasciatus and rural prevalence of L. segnis. These results contrast with those reported by Ho et al. (Reference Ho, Changbunjong, Weluwanarak, Hussain and Sparagano2021), who conducted a systematic review and meta-analysis of ectoparasites in synanthropic rodents, including urban rats, and found that mites were the most common ectoparasites (42.6% prevalence), followed by ticks (21.5%), lice (17.8%) and fleas (14.1%). Nevertheless, the study emphasized the considerable variability in prevalence estimates across studies, largely influenced by climatic conditions, which in turn shaped by the geographic regions where the research was conducted. Similar ectoparasites trend have been described in South America Mediterranean and temperate climates (e.g. Lareschi et al., Reference Lareschi, Savchenko and Urdapilleta2019; Alonso et al., Reference Alonso, Ruiz, Lovera, DP, Cavia and Sánchez2020), which are more closely the environmental context of our study areas. Consistent with Ho et al. (Reference Ho, Changbunjong, Weluwanarak, Hussain and Sparagano2021) our estimates also showed wide confidence intervals, reflecting high heterogeneity in ectoparasite loads.
Other studies conducted in urban and rural areas support the high prevalence of lice and fleas in rats (Fagir and El-Rayah, Reference Fagir and El-Rayah2009; Mlik et al., Reference Mlik, Meddour, Dik, Souttou and Sekour2022), with Polyplax spp. commonly dominating infestations (Chan et al., Reference Chan, Flores, Maghirang, Arellano and Chan2024). In our study, P. spinulosa was indeed the most prevalent louse species, but contrary to expectations, it was most abundant in wild rather than rural or urban areas. This may reflect poorer host conditions in wild environment, where individuals limited food availability could suppress immune responses and favour higher louse burdens (Chan et al., Reference Chan, Flores, Maghirang, Arellano and Chan2024).
Although lice are typically host-specific, P. spinulosa exhibits remarkable host plasticity, having been recorded on 13 Rattus species and other murids (Bandicota, Leggadina, Mesembriomys, Pseudomys), as well as a marsupial (Didelphis) (Durden and Musser, Reference Durden and Musser1994; Wang et al., Reference Wang, Durden and Shao2020; Ruiz et al., Reference Ruiz, Alonso, Rospide, Acosta, Cavia and Sánchez2025). The transfer and establishment of this louse have been documented in endemic rats in Australia; however, these cases of transfer have only been documented among species belonging to Muridae, subfamily Murinae (Wang et al., Reference Wang, Durden and Shao2020). Recent detection of this louse on Didelphis albiventris in rural Argentina, where invasive rats and native marsupials coexist, highlights its potential for cross-order spillover (Ruiz et al., Reference Ruiz, Alonso, Rospide, Acosta, Cavia and Sánchez2025). In Chile, there are no native representatives of Muridae, which makes parasite transfer to wild species unlikely. However, the high prevalence in rat populations, together with frequent contact with native rodents and marsupials in shared habitats, could still increase the probability of transfer across phylogenetically distant hosts (Ruiz et al., Reference Ruiz, Alonso, Rospide, Acosta, Cavia and Sánchez2025).
Fleas displayed the highest species richness, with most taxa previously associated with native Chilean rodents (Moreno-Salas et al., Reference Moreno-Salas, Espinoza-Carniglia, Lizama Schmeisser, Torres, Silva-de la Fuente, Lareschi and González-Acuña2019, Reference Moreno-Salas, Espinoza-Carniglia, Lizama Schmeisser, Torres-Fuentes, Silva-de la Fuente, Lareschi and González-Acuña2020). Only 3 species – L. segnis, N. fasciatus and X. cheopis – are typically linked to Rattus. Xenopsylla cheopis was found exclusively in Iquique (northern Chile) a coastal desert city, suggesting that arid conditions may restrict its establishment elsewhere despite the widespread distributions of rats.
While L. segnis and N. fasciatus showed comparable overall prevalence and abundance, their spatial distribution differed markedly: L. segnis was most prevalent in rural areas, whereas N. fasciatus dominated in cities. This may reflect host preferences, L. segnis is commonly associated with M. musculus, while N. fasciatus favours R. rattus and R. norvegicus, and the higher density and interspecific contact among synanthropic rodents in urban settings (Fitzgerald et al., Reference Fitzgerald, Efford and Karl2023).
Among the native fleas, Sphinctopsylla ares, typically parasitizing Abrothrix spp. was frequently found on R. rattus in wild and rural sites, likely due its generalist feeding behaviour and broad distribution (Beaucournu et al., Reference Beaucournu, Moreno and González-Acuña2014).
In contrast, ticks and mites showed no significant variation across anthropogenic gradients, suggesting a more uniform distribution and ecological flexibility (Paramasvaran et al., Reference Paramasvaran, Sani, Hassan, Krishnasamy, Jeffery, Oothuman, Salleh, Lim, Sumarni and Santhana2009; Modi and Vankara, Reference Modi and Vankara2021). Ornithonyssus sp. was the most prevalent and abundant mite genus. In rats, the typical species described is O. bacoti; however, morphological similarity within the Ornithonyssus complex prevented species-level identification. Molecular barcoding was not feasible due to resources constraints, a recognized limitation. This genus is recognized as a potential biological vector of pathogens affecting wildlife, domestic animals and humans (Sargison et al., Reference Sargison, Chaudhry, Costa-Junior, Kutcher, Li, Sargison and Zahid2025). In Chile, O. bacoti has been recorded in rats and linked to cases of dermatitis (Barriga and Donckaster, Reference Barriga and Donckaster1965; Jofré et al., Reference Jofré, Neomi, Saavedra and Diaz2009). Notably, Ornithonyssus sp. has also been detected on native cricetid rodents and marsupials (Silva-de la Fuente, Reference Silva-de la Fuente2019), raising questions about cross-transmission between invasive and native host.
Regarding ticks, I. sigelos was the most abundant species. Its presence on R. rattus aligns prior reports (Osorio, Reference Osorio2001) and underscore that rat´s role as a potential dispersal host, even into urban areas (González-Acuña et al., Reference González-Acuña, Venzal and Guglielmone2004). Given that I. sigelos also parasitizes native rodents, shared habitats may facilitate parasite exchange between invasive and endemic fauna. Additionally, 2 specimens of Ornithodoros sp. were collected from rats in La Campana National Park. Although species-level identification was not possible due to specimen damage, they likely represent the soft tick known to parasitize the endemic rodent Octodon degus in the regions (Muñoz-Leal et al., Reference Muñoz-Leal, Venzal, Nava, Marcili, González-Acuña, Martins and Labruna2020). Unfortunately, insufficient material precluded molecular confirmation.
Overall, local environment conditions, including host density, landscape configuration and interspecific interactions, strongly influence ectoparasite dynamics (Brunner and Ostfeld, Reference Brunner and Ostfeld2008; Young et al., Reference Young, Dirzo, McCauley, Agwanda, Cattaneo, Dittmar, Eckerlin, Fleischer, Helgen, Hintz, Montinieri, Zhao and Helgen2015; Krasnov et al., Reference Krasnov, Korallo-Vinarskaya, Vinarski and Khokhlova2022; Klain et al., Reference Klain, Mentz, Bustamante-Manrique and Bicca-Marques2023). Although R. rattus is closely associated with human structures, which may homogenize microhabitats across urban and rural sites, wild areas remained ecologically distinct, supporting unique parasite-host interactions.
Detection and prevalence of Bartonella and Rickettsia
Bartonella and Rickettsia DNA were detected in all ectoparasite groups investigated. Notably, prevalence estimates must be interpreted according to analytical method: fleas and adult ticks were processed individually, whereas lice, mites and immature ticks (larvae and nymphs) were analysed in pools of up to 10 specimens per host. Consequently, prevalence values for the latter groups reflect pool-level positivity rather than individual infection rates – a distinction critical for cross-study comparisons.
Fleas exhibited the highest Bartonella prevalence (53.4% in individually screened specimens), exceeding values reported in Thailand (25.8%; Klangthong et al., Reference Klangthong, Promsthaporn, Leepitakrat, Schuster, McCardle, Kosoy and Takhampunya2015), Chile (21.3%; Moreno-Salas et al., Reference Moreno-Salas, Espinoza-Carniglia, Lizama Schmeisser, Torres, Silva-de la Fuente, Lareschi and González-Acuña2019) and Southeast China (26.2%; Zhou et al., Reference Zhou, Nian, Zeng and Xiao2024). This elevated detection likely reflects both the sensitivity of our qPCR approach and the use of individual screening, which avoids the dilution effects inherent in pooled designs.
Lice (P. spinulosa) showed a Bartonella prevalence of 33.3% (pool-level), aligning with Reeves et al. (Reference Reeves, Szumlas, Moriarity, Loftis, Abbassy, Helmy and Dasch2006), who reported ∼30% in pooled lice from Egyptian Rattus spp. This pattern is further supported by Klangthong et al. (Reference Klangthong, Promsthaporn, Leepitakrat, Schuster, McCardle, Kosoy and Takhampunya2015), who found 57.1% prevalence in pooled rodent lice (Polyplax and Hoplopleura spp.) in Thailand. The consistency of high Bartonella detection across geographically distant studies using similar pooling strategies suggests that lice are significant and consistent reservoirs or vectors in synanthropic rodent systems.
A particularly novel finding was the detection of Bartonella in 26.6% of I. sigelos – a native Chilean tick primarily associated with wild rodents such as Abrothrix spp. and Octodon degus (González-Acuña et al., Reference González-Acuña, Venzal and Guglielmone2004). To our knowledge, this represents the first molecular detection of Bartonella in I. sigelos. This contrasts sharply with a recent large-scale U.S. field study that found Bartonella in only 1 of 853 blood-fed Ixodes ticks, despite high rodent bacteremia (Bai et al., Reference Bai, Osikowicz, Clark, Foster, Parise, Maes and Eisen2024), suggesting that natural acquisition by Ixodes is rare in many regions. Our result may reflect either a regionally distinct host-vector-pathogen interaction in southern South America or be influenced by our pooling of immature stages, which can inflate apparent prevalence if only 1 individual per pool is infected.
Bartonella prevalence was highest in rural environments, particularly in fleas (55.9%) and mites (33.3%), a pattern also observed in Slovakia (80%; Špitalská et al., Reference Špitalská, Minichová, Hamšíková, Stanko and Kazimírová2022) and central Chile (34.8%; Moreno-Salas et al., Reference Moreno-Salas, Espinoza-Carniglia, Lizama Schmeisser, Torres, Silva-de la Fuente, Lareschi and González-Acuña2019), highlighting rural interfaces as key hotspots for pathogen circulation.
Rickettsia felis DNA was detected across all ectoparasite groups, with the highest prevalence in fleas (50.3% in individuals) – the highest among all vector groups examined. This aligns with reports from Chile (35.1%; Moreno-Salas et al., Reference Moreno-Salas, Espinoza-Carniglia, Lizama Schmeisser, Torres-Fuentes, Silva-de la Fuente, Lareschi and González-Acuña2020) and Germany (28.6%; Obiegala et al., Reference Obiegala, Oltersdorf, Silaghi, Kiefer, Kiefer, Woll and Pfeffer2016), and falls within the range documented in U.S. R. norvegicus fleas (10–32%; Abramowicz et al., Reference Abramowicz, Rood, Krueger and Eremeeva2011). As with Bartonella, the high prevalence likely stems from our use of sensitive qPCR on individual fleas, avoiding signal dilution.
A novel finding was the detection of R. felis in 33.3% of P. spinulosa pools – the first report of Rickettsia in this louse species and, to our knowledge, the first documentation of R. felis in any rodent-associated louse globally. Previous studies identified Rickettsia only in H. pacifica (R. typhi; Reeves et al., Reference Reeves, Szumlas, Moriarity, Loftis, Abbassy, Helmy and Dasch2006) and P. serrata (R. helvetica; Aleksandravičienė et al., Reference Aleksandravičienė, Paulauskas, Stanko, Fričová and Radzijevskaja2021), but not in P. spinulosa. Reeves et al. (Reference Reeves, Szumlas, Moriarity, Loftis, Abbassy, Helmy and Dasch2006) explicitly screened P. spinulosa from Egyptian Rattus and found no Rickettsia, underscoring the novelty of our detection.
In mites (Ornithonyssus sp.), R. felis was detected in 23.2% of pools, reinforcing growing evidence that mesostigmatid mites may play an underappreciated role in Rickettsia ecology. This aligns with Reeves et al. (Reference Reeves, Loftis, Szumlas, Abbassy, Helmy, Hanafi and Dasch2007), who reported Rickettsia genotypes related to the Akari group – including R. akari-like strains – in O. bacoti collected from Rattus spp. in Egypt. Behera et al. (Reference Behera, Singh, Deval, Bhardwaj, Zaman, Misra, Kumar, Srivastava, Pandey, Yadav, Kavathekar, Kant and Bondre2023) also detected Rickettsia DNA (unspecified at the species level) in O. bacoti infesting Mus spp. in India, further supporting the role of this mite genus as a potential host for rickettsiae. Collectively, these studies – combined with our detection of R. felis in Ornithonyssus sp. from R. rattus in Chile – suggest that Ornithonyssus mites may contribute to Rickettsia circulation at sylvatic and peri-domestic interfaces, particularly in regions where invasive rodents interact with native fauna and human settlements.
Rickettsia felis was also detected in I. sigelos. This finding aligns with a growing body of evidence from across the globe, where R. felis has been molecularly detected in I. ovatus, I. granulatus, I. hexagonus and I. ricinus in Japan, Taiwan, Italy, Germany, France, Spain, Romania, Serbia and Slovakia (Tsui et al., Reference Tsui, Tsai, Weng, Hung, Liu, Hu, Lien, Lin, Shaio, Wang and Ji2007; Dobler and Wölfel, Reference Dobler and Wölfel2009; Pascucci et al., Reference Pascucci, Di Domenico, Curini, Cocco, Averaimo, D’Alterio and Cammà2019; Banović et al., Reference Banović, Díaz-Sánchez, Galon, Simin, Mijatović, Obregón, Moutailler and Cabezas-Cruz2021; Borsan et al., Reference Borsan, Ionica, Galon, Toma-Naic, Pestean, Sándor, Moutailler and Mihalca2021; Lejal et al., Reference Lejal, Marsot, Chalvet-Monfray, Cosson, Moutailler, Vayssier-Taussat and Pollet2019). Critically, Danchenko et al. (Reference Danchenko, Benada, Škultéty and Sekeyová2022) recently succeeded in culturing R. felis from a questing I. ricinus nymph in Slovakia, providing the first definitive evidence that this bacterium can not only be acquired by Ixodes ticks but also persist and replicate within them, thereby fulfilling a key criterion for vector competence. Our detection of R. felis in the native Chilean tick I. sigelos may therefore represent a genuine, albeit infrequent, natural infection, potentially facilitated by local ecological or host-specific factors. However, given that our tick samples included pooled immature stages, the possibility of transient carriage or signal contamination cannot be entirely excluded, and future studies using individual tick screening and bacterial viability assays are warranted.
Rickettsia prevalence was also highest in rural areas, especially in mites pool (66.7%) and fleas (61%), reinforcing the role of rural interfaces – where synanthropic rodents, native wildlife and humans converge – as key zones for enzootic maintenance and potential spillover.
Molecular identification and genetic diversity
High-quality sequences were obtained for 30 Bartonella amplicons and 32 Rickettsia amplicons. BLAST and phylogenetic analyses revealed multiple zoonotic Bartonella species, including B. tribocorum, B. rochalimae, B. coopersplainsensis, B. doshiae and several uncultured lineages – many previously reported in Chilean rodents and their fleas (Moreno-Salas et al., Reference Moreno-Salas, Espinoza-Carniglia, Lizama Schmeisser, Torres, Silva-de la Fuente, Lareschi and González-Acuña2019; Müller et al., Reference Müller, Gutiérrez, Seguel, Monti, Otth, Bittencourt, Sepúlveda, Alabí, Nachum-Biala and Harrus2020; Sepúlveda-García et al., Reference Sepúlveda-García, Rubio, Salgado, Riquelme, Bonacic, Canales and Müller2023). Six samples yielded multilocus confirmation (e.g. BP3, II124a, IV160e), with consistent taxonomic assignments across loci.
For Rickettsia, 30 of 31 high-quality ompB sequences matched R. felis (100% identity to GenBank MN267050.1). A single gltA sequence from Illapel showed 99.7% identity to an uncultured Rickettsia sp. previously reported in Brazil (KY753118.1). Critically, R. felis was detected in fleas, lice, mites and ticks, indicating a broad ectoparasite range in Chile.
Despite this taxonomic breadth, R. felis exhibited remarkably low genetic diversity: the ompB haplotype network revealed 1 dominant haplotype (H1) in 30 of 31 sequences across all ectoparasite groups and localities (Hd = 0.06), mirroring patterns in Chilean foxes (Millán et al., Reference Millán, Sepúlveda-García, Di Cataldo, Canales, Sallaberry-Pincheira, Painean, Cevidanes and Müller2023). This suggests clonal expansion of a single, well-adapted R. felis strain in Chilean synanthropic systems. In contrast, Bartonella showed higher haplotype diversity across gltA, rpoB and ITS, consistent with greater strain heterogeneity in rodent reservoirs (Kosoy and Bai, Reference Kosoy and Bai2019).
Association between Bartonella and Rickettsia presence with parasitological descriptors and degree of anthropization
Contrary to our initial hypothesis – that ectoparasite abundance, prevalence and diversity would positively correlate with pathogen detection – generalized linear models revealed significant negative associations between both Bartonella and Rickettsia occurrence and key ecological variables.
Bartonella presence was negatively associated with increasing anthropization and higher tick prevalence. This suggests that rural and wild environments – rather than urban centres – serve as more favourable settings for Bartonella circulation in R. rattus ectoparasite communities. This pattern aligns with evidence that Bartonella enzootic cycles are sensitive to habitat fragmentation and anthropogenic disturbance, which may disrupt stable rodent – vector networks required for bacteria maintenance (Kosoy and Bai, Reference Kosoy and Bai2019).
In contrast, Rickettsia occurrence showed no association with anthropization, but was negatively associated with both flea prevalence and tick prevalence. This decoupling from urbanization likely reflects the well-documented adaptability of R. felis to peri-domestic and synanthropic systems worldwide (Gillespie et al., Reference Gillespie, Ammerman, Beier-Sexton, Sobral and Azad2009). In Chile, R. felis has already been detected in fleas from wild foxes across Mediterranean landscapes, indicating its capacity to persist across environmental gradients (Millán et al., Reference Millán, Sepúlveda-García, Di Cataldo, Canales, Sallaberry-Pincheira, Painean, Cevidanes and Müller2023).
These counterintuitive patterns indicate that pathogen dynamics are not driven by simple metrics of ectoparasite load, but rather by complex ecological filters such as host community composition, vector competence, or competitive exclusion among co-occurring ectoparasites. Critically, given the cross-sectional design of our study, no causal relationships can be inferred from these statistical associations.
Notably, overall ectoparasite abundance and diversity were not significantly associated with the presence of either pathogen, reinforcing that taxon-specific interactions, rather than general parasitism intensity, shape pathogen occurrence in this system. Critically, no significant associations were found with overall ectoparasite abundance or diversity, reinforcing that taxon-specific interactions, rather than general parasitism intensity, drive pathogen dynamics in this system.
Future work incorporating strain-level resolution, vector identification at the species level, and longitudinal sampling will be valuable to determine whether these negative associations represent stable ecological relationships or temporal fluctuations. Overall, our results underscore the complex interplay between rodents, ectoparasites and bacterial pathogens in central Chile. Anthropogenic disturbance was negatively associated with Bartonella presence, whereas Rickettsia occurrence was more strongly linked to the distribution of specific ectoparasite taxa. Given the detection of zoonotic lineages and uncharacterized strains, continued molecular surveillance is essential to understand and mitigate the public-health risks associated with ectoparasite-borne pathogens in synanthropic environments.
Acknowledgements
We thank the Postgraduate Department of the University of Concepción and Ross University for supporting Elaine Monalize de Castro’s research stay.
Author’s contribution
E.M.S.C. and L.M.S. conceived and designed the study. L.M.S., M.C.S.F. and M.E.-C. conducted fieldwork and sample collection. A.M., R.G. and S.M.L. performed molecular analyses and pathogen identification. M.E.-C., S.M.L. and L.M.S. contributed to ectoparasite identification and taxonomic validation. A.M. and R.G. conducted statistical and phylogenetic analyses. E.M.S.C. and L.M.S. wrote the original draft of the manuscript. All authors reviewed, edited and approved the final version of the manuscript.
Financial support
This work was supported by Universidad de Concepcion, Grant-VRID 2023000985INT, VRID 220.113.099-INV and the National Fund for Scientific and Technological Development [FONDECYT 11150875].
Competing interests
The authors declare there are no conflicts of interest.
Ethical standards
The handling and euthanasia of rodents followed established protocols for field and laboratory studies with rodents (Herbreteau et al., Reference Herbreteau, Jittapalapong, Rerkamnuaychoke, Chaval, Cosson, Morand, JC, Blasdell, Bordes, Chabé, Chaisiri, Charbonnel, Claude, Dei-Cas, Desquesnes, Dobigny, Douangboupha, Galan, Haukisalmi, Henttonen, Herbreteau, Hugot, Jiyipong, Latinne, Michaux, Milocco, Pagès, Phoophitpong, Pumhom, Ribas Salvador, Soonchan, Suputtamongkol, Waengsothorn, Waywa, Xuéreb and Pdr2011). All procedures were reviewed and approved by the Ethics Committee of the Vice-Rectory of Research and Development of the Universidad de Concepción (Chile). Rodent captures were conducted under official permits granted by the Agricultural and Livestock Service of Chile (SAG permits R.E: 8968-2015, 1657-2016, 73-2016, 23-2017) and the National Forestry Corporation (CONAF permit no. 018-2015).


 Open access